
Association of Breakfast Food Types with Dietary Knowledge, Attitudes, and Practices Among School-Aged Children

 ,
,
Abstract
1. Introduction
2. Methods
2.1. Participants and Settings
2.2. Questionnaire Design
2.3. Assessments
2.4. Statistical Analysis
3. Results
3.1. Baseline Characteristics and KAP of the Participants
3.2. The Relationship Between Breakfast Frequency and Dietary KAP
3.3. Discrepancy of Breakfast Types Among Different Demographic Characteristics and Dietary KAP Groups
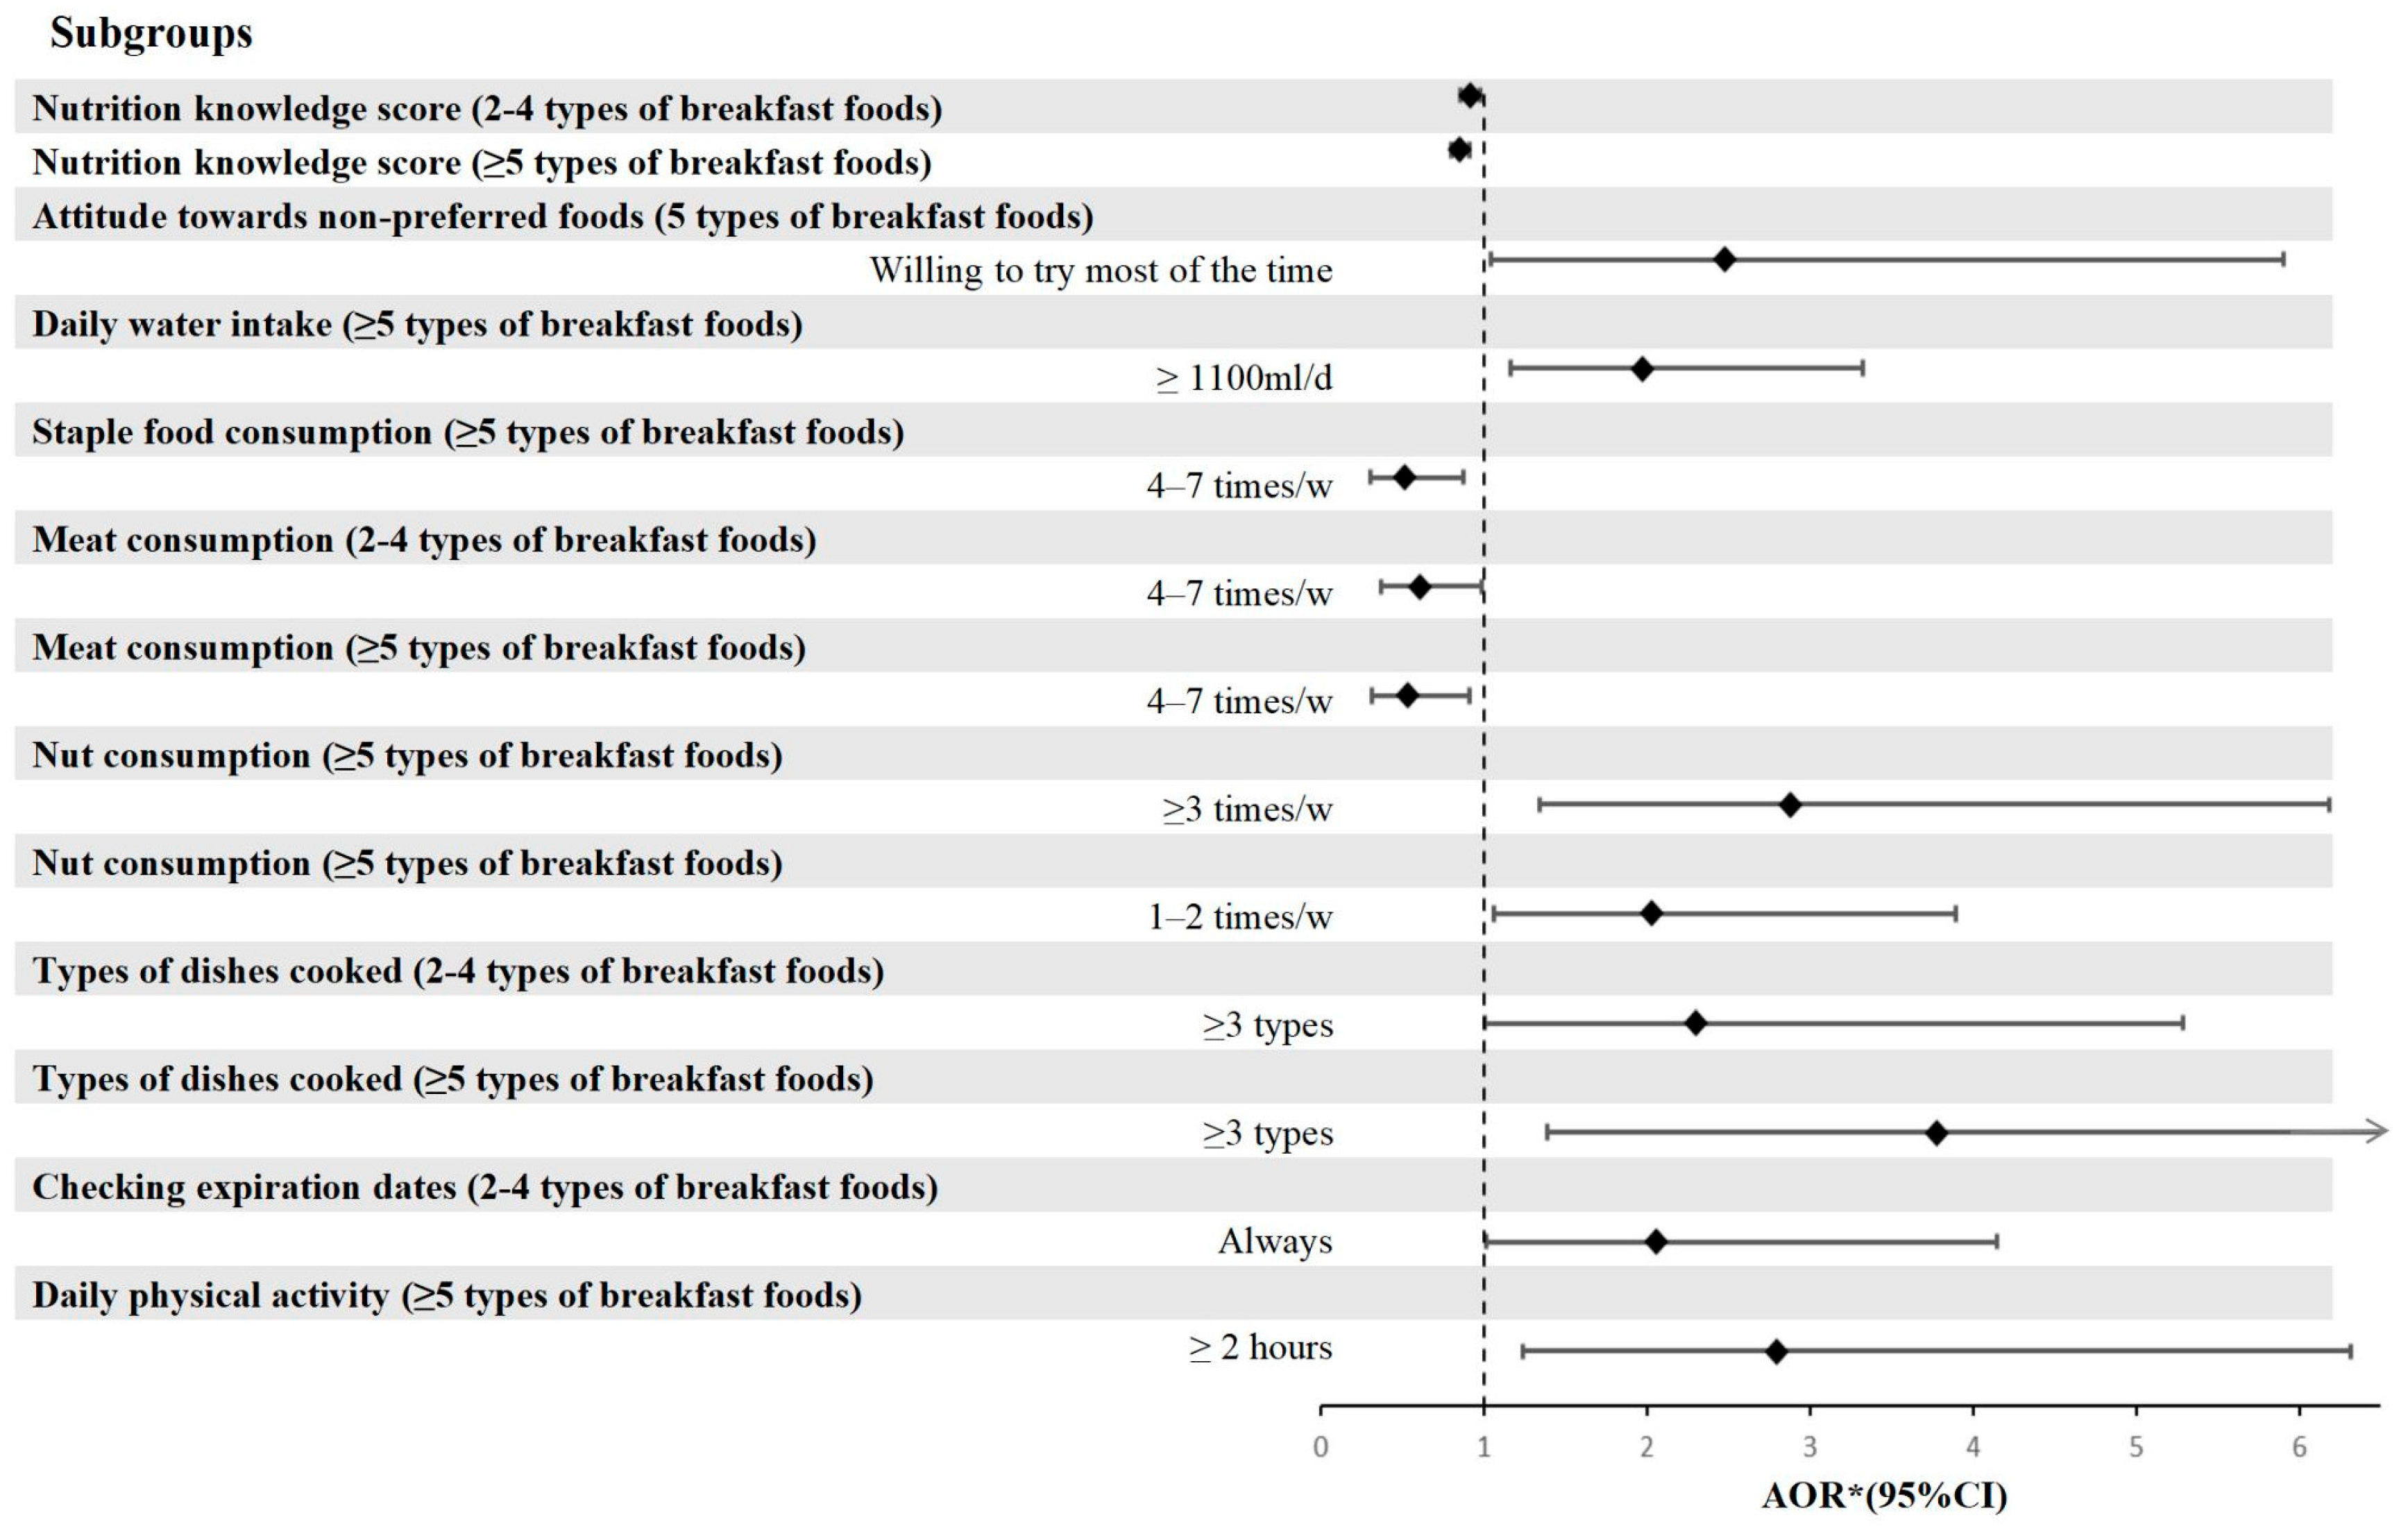
3.4. Types of Breakfast Foods and Their Associations with KAP
4. Discussion
5. Strengths and Limitations
6. Conclusions
Author Contributions
Funding
Institutional Review Board Statement
Informed Consent Statement
Data Availability Statement
Conflicts of Interest
References
- Gentile, C.L.; Weir, T.L. The Gut Microbiota at the Intersection of Diet and Human Health. Science 2018, 362, 776–780. [Google Scholar] [CrossRef] [PubMed]
- Sun, M.; Wu, Z. Associations of Breakfast Habits and Breakfast Quality with Depression Symptoms: A Cross-Sectional Study Based on NHANES 2007–2018. J. Affect. Disord. 2025, 375, 342–348. [Google Scholar] [CrossRef] [PubMed]
- Ferrer-Cascales, R.; Sánchez-SanSegundo, M.; Ruiz-Robledillo, N.; Albaladejo-Blázquez, N.; Laguna-Pérez, A.; Zaragoza-Martí, A. Eat or Skip Breakfast? The Important Role of Breakfast Quality for Health-Related Quality of Life, Stress and Depression in Spanish Adolescents. Int. J. Environ. Res. Public Health 2018, 15, 1781. [Google Scholar] [CrossRef] [PubMed]
- Jackson, L. Most Important Meal of the Day: Why Children Skip Breakfast and What Can Be Done About It. Pediatr. Ann. 2013, 42, 184–187. [Google Scholar] [CrossRef] [PubMed]
- Smith, K.J.; Gall, S.L.; McNaughton, S.A.; Blizzard, L.; Dwyer, T.; Venn, A.J. Skipping Breakfast: Longitudinal Associations with Cardiometabolic Risk Factors in the Childhood Determinants of Adult Health Study123. Am. J. Clin. Nutr. 2010, 92, 1316–1325. [Google Scholar] [CrossRef] [PubMed]
- Gong, W.-J.; Fong, D.Y.-T.; Wang, M.-P.; Lam, T.-H.; Chung, T.W.-H.; Ho, S.-Y. Skipping Breakfast and Eating Breakfast Away from Home Were Prospectively Associated with Emotional and Behavioral Problems in 115,217 Chinese Adolescents. J. Epidemiol. 2022, 32, 551–558. [Google Scholar] [CrossRef] [PubMed]
- Sincovich, A.; Moller, H.; Smithers, L.; Brushe, M.; Lassi, Z.S.; Brinkman, S.A.; Gregory, T. Prevalence of Breakfast Skipping among Children and Adolescents: A Cross-Sectional Population Level Study. BMC Pediatr. 2022, 22, 220. [Google Scholar] [CrossRef] [PubMed]
- Wang, M.; Zhong, J.-M.; Wang, H.; Zhao, M.; Gong, W.-W.; Pan, J.; Fei, F.-R.; Wu, H.-B.; Yu, M. Breakfast Consumption and Its Associations with Health-Related Behaviors among School-Aged Adolescents: A Cross-Sectional Study in Zhejiang Province, China. Int. J. Environ. Res. Public Health 2016, 13, 761. [Google Scholar] [CrossRef] [PubMed]
- Ardeshirlarijani, E.; Namazi, N.; Jabbari, M.; Zeinali, M.; Gerami, H.; Jalili, R.B.; Larijani, B.; Azadbakht, L. The Link between Breakfast Skipping and Overweigh/Obesity in Children and Adolescents: A Meta-Analysis of Observational Studies. J. Diabetes Metab. Disord. 2019, 18, 657–664. [Google Scholar] [CrossRef] [PubMed]
- Zahedi, H.; Djalalinia, S.; Sadeghi, O.; Zare Garizi, F.; Asayesh, H.; Payab, M.; Zarei, M.; Qorbani, M. Breakfast Consumption and Mental Health: A Systematic Review and Meta-Analysis of Observational Studies. Nutr. Neurosci. 2022, 25, 1250–1264. [Google Scholar] [CrossRef] [PubMed]
- de Souza, M.R.; Neves, M.E.A.; de Moura Souza, A.; Muraro, A.P.; Pereira, R.A.; Ferreira, M.G.; Rodrigues, P.R.M. Skipping Breakfast Is Associated with the Presence of Cardiometabolic Risk Factors in Adolescents: Study of Cardiovascular Risks in Adolescents–ERICA. Br. J. Nutr. 2021, 126, 276–284. [Google Scholar] [CrossRef] [PubMed]
- Ofori-Asenso, R.; Owen, A.J.; Liew, D. Skipping Breakfast and the Risk of Cardiovascular Disease and Death: A Systematic Review of Prospective Cohort Studies in Primary Prevention Settings. J. Cardiovasc. Dev. Dis. 2019, 6, 30. [Google Scholar] [CrossRef] [PubMed]
- Wang, K.; Niu, Y.; Lu, Z. The Effect of Breakfast on Childhood Obesity: A Systematic Review and Meta-Analysis. Front. Nutr. 2023, 10, 1222536. [Google Scholar] [CrossRef] [PubMed]
- Li, Q.; Wu, C.; Ma, P.; Cui, H.; Li, R.; Hong, C.; Zeng, L.; Liao, S.; Xiao, L.; Liu, L.; et al. Breakfast Consumption Frequency Is Associated with Dyslipidemia: A Retrospective Cohort Study of a Working Population. Lipids. Health. Dis. 2022, 21, 33. [Google Scholar] [CrossRef] [PubMed]
- Peprah, P.; Oduro, M.S.; Boakye, P.A.; Morgan, A.K. Association between Breakfast Skipping and Psychosomatic Symptoms among Canadian Adolescents. Eur. J. Pediatr. 2024, 183, 1607–1617. [Google Scholar] [CrossRef] [PubMed]
- Adolphus, K.; Hoyland, A.; Walton, J.; Quadt, F.; Lawton, C.L.; Dye, L. Ready-to-Eat Cereal and Milk for Breakfast Compared with No Breakfast Has a Positive Acute Effect on Cognitive Function and Subjective State in 11–13-Year-Olds: A School-Based, Randomised, Controlled, Parallel Groups Trial. Eur. J. Nutr. 2021, 60, 3325–3342. [Google Scholar] [CrossRef] [PubMed]
- Abebe, L.; Mengistu, N.; Tesfaye, T.S.; Kabthymer, R.H.; Molla, W.; Tarekegn, D.; Wudneh, A.; Shonor, M.N.; Yimer, S. Breakfast Skipping and Its Relationship with Academic Performance in Ethiopian School-Aged Children, 2019. BMC Nutr. 2022, 8, 51. [Google Scholar] [CrossRef] [PubMed]
- Moller, H.; Sincovich, A.; Gregory, T.; Smithers, L. Breakfast Skipping and Cognitive and Emotional Engagement at School: A Cross-Sectional Population-Level Study. Public Health Nutr. 2022, 25, 3356–3365. [Google Scholar] [CrossRef] [PubMed]
- Salas-González, M.D.; Lozano-Estevan, M.-d.C.; Aparicio, A.; Bermejo, L.M.; Loria-Kohen, V.; Ortega, R.M.; López-Sobaler, A.M. Breakfast Quality and Insulin Resistance in Spanish Schoolchildren: A Cross-Sectional Study. Int. J. Environ. Res. Public Health 2023, 20, 1181. [Google Scholar] [CrossRef] [PubMed]
- Bonnet, J.P.; Cardel, M.I.; Cellini, J.; Hu, F.B.; Guasch-Ferré, M. Breakfast Skipping, Body Composition, and Cardiometabolic Risk: A Systematic Review and Meta-Analysis of Randomized Trials. Obesity 2020, 28, 1098–1109. [Google Scholar] [CrossRef] [PubMed]
- Ruiz, E.; Ávila, J.M.; Valero, T.; Rodriguez, P.; Varela-Moreiras, G. Breakfast Consumption in Spain: Patterns, Nutrient Intake and Quality. Findings from the ANIBES Study, a Study from the International Breakfast Research Initiative. Nutrients 2018, 10, 1324. [Google Scholar] [CrossRef] [PubMed]
- Growth Reference 5–19 Years-BMI-for-Age (5–19 Years). Available online: https://www.who.int/data/gho/data/themes/topics/topic-details/GHO/body-mass-index (accessed on 19 December 2024).
- Spronk, I.; Kullen, C.; Burdon, C.; O’Connor, H. Relationship between Nutrition Knowledge and Dietary Intake. Br. J. Nutr. 2014, 111, 1713–1726. [Google Scholar] [CrossRef] [PubMed]
- Montenegro-Espinosa, J.A.; López-Gil, J.F. Does Sex Matter in the Link Between Self-Efficacy and Mediterranean Diet Adherence in Adolescents? Insights from the EHDLA Study. Nutrients 2025, 17, 880. [Google Scholar] [CrossRef] [PubMed]
- Brown, J.M.; Tahir, S.; Franco-Arellano, B.; LeSage, A.; Hughes, J.; Kapralos, B.; Lou, W.; Vogel, E.; Farkouh, M.; Tugault-Lafleur, C.; et al. Efficacy of the Foodbot Factory Digital Curriculum-Based Nutrition Education Intervention in Improving Children’s Nutrition Knowledge, Attitudes and Behaviours in Elementary School Classrooms: Protocol for a Cluster Randomised Controlled Trial. BMJ Open 2025, 15, e092426. [Google Scholar] [CrossRef] [PubMed]
- Eck, K.M.; Delaney, C.L.; Clark, R.L.; Leary, M.P.; Shelnutt, K.P.; Olfert, M.D.; Byrd-Bredbenner, C. The “Motor of the Day”: Parent and School-Age Children’s Cognitions, Barriers, and Supports for Breakfast. Int. J. Environ. Res. Public Health 2019, 16, 3238. [Google Scholar] [CrossRef] [PubMed]
- Olfert, M.D.; Hagedorn, R.L.; Leary, M.P.; Eck, K.; Shelnutt, K.P.; Byrd-Bredbenner, C. Parent and School-Age Children’s Food Preparation Cognitions and Behaviors Guide Recommendations for Future Interventions. J. Nutr. Educ. Behav. 2019, 51, 684–692. [Google Scholar] [CrossRef] [PubMed]
- McLeod, C.J.; Haycraft, E.; Daley, A.J. Would Offering Vegetables to Children for Breakfast Increase Their Total Daily Vegetable Intake? Public Health Nutr. 2022, 25, 3312–3316. [Google Scholar] [CrossRef] [PubMed]
- Mielgo-Ayuso, J.; Valtueña, J.; Cuenca-García, M.; Gottrand, F.; Breidenassel, C.; Ferrari, M.; Manios, Y.; Henauw, S.D.; Widhalm, K.; Kafatos, A.; et al. Regular Breakfast Consumption Is Associated with Higher Blood Vitamin Status in Adolescents: The HELENA (Healthy Lifestyle in Europe by Nutrition in Adolescence) Study. Public Health Nutr. 2017, 20, 1393–1404. [Google Scholar] [CrossRef] [PubMed]
- Sagbo, H.; Kpodji, P. Dietary Diversity and Associated Factors among School-Aged Children and Adolescents in Lokossa District of Southern Benin: A Cross-Sectional Study. BMJ Open 2023, 13, e066309. [Google Scholar] [CrossRef] [PubMed]
- Oliver Olid, A.; Fabios, E.; García-Blanco, L.; Moreno-Villares, J.M.; Martínez-González, M.Á.; Martín-Calvo, N. Higher Adherence to the Mediterranean Diet Is Associated with Lower Micronutrient Inadequacy in Children: The SENDO Project. Public Health Nutr. 2023, 27, e8. [Google Scholar] [CrossRef] [PubMed]
- Neale, E.P.; Tran, G.; Brown, R.C. Barriers and Facilitators to Nut Consumption: A Narrative Review. Int. J. Env. Res. Public Health 2020, 17, 9127. [Google Scholar] [CrossRef] [PubMed]
- Medin, A.C.; Myhre, J.B.; Diep, L.M.; Andersen, L.F. Diet Quality on Days without Breakfast or Lunch—Identifying Targets to Improve Adolescents’ Diet. Appetite 2019, 135, 123–130. [Google Scholar] [CrossRef] [PubMed]
- Smith, K.J.; Breslin, M.C.; McNaughton, S.A.; Gall, S.L.; Blizzard, L.; Venn, A.J. Skipping Breakfast among Australian Children and Adolescents; Findings from the 2011–12 National Nutrition and Physical Activity Survey. Aust. New Zealand J. Public Health 2017, 41, 572–578. [Google Scholar] [CrossRef] [PubMed]
- Haimoto, H.; Watanabe, S.; Komeda, M.; Wakai, K. The Impact of Carbohydrate Intake and Its Sources on Hemoglobin A1c Levels in Japanese Patients with Type 2 Diabetes Not Taking Anti-Diabetic Medication. DMSO 2018, 11, 53–64. [Google Scholar] [CrossRef] [PubMed]
- Manon, P.; Samantha, C.; Carolus, V. How Infants and Young Children Learn About Food: A Systematic Review. Front. Nutr. 2017, 8, 1046. [Google Scholar] [CrossRef]
- Ma, X.; Chen, Q.; Pu, Y.; Guo, M.; Jiang, Z.; Huang, W.; Long, Y.; Xu, Y. Skipping Breakfast Is Associated with Overweight and Obesity: A Systematic Review and Meta-Analysis. Obes. Res. Clin. Pract. 2020, 14, 1–8. [Google Scholar] [CrossRef] [PubMed]
- Ramsay, S.A.; Bloch, T.D.; Marriage, B.; Shriver, L.H.; Spees, C.K.; Taylor, C.A. Skipping Breakfast Is Associated with Lower Diet Quality in Young US Children. Eur. J. Clin. Nutr. 2018, 72, 548–556. [Google Scholar] [CrossRef] [PubMed]
- Harley, A.; Lemke, M.; Brazauskas, R.; Carnegie, N.B.; Bokowy, L.; Kingery, L. Youth Chef Academy: Pilot Results From a Plant-Based Culinary and Nutrition Literacy Program for Sixth and Seventh Graders. J. Sch. Health 2018, 88, 893–902. [Google Scholar] [CrossRef] [PubMed]
- Mancone, S.; Corrado, S.; Tosti, B.; Spica, G.; Di Siena, F.; Misiti, F.; Diotaiuti, P. Enhancing Nutritional Knowledge and Self-Regulation among Adolescents: Efficacy of a Multifaceted Food Literacy Intervention. Front. Psychol. 2024, 15, 1405414. [Google Scholar] [CrossRef] [PubMed]
- Drozdowska, A.; Falkenstein, M.; Lücke, T.; Kersting, M.; Jendrusch, G.; Platen, P.; Sinningen, K. Unfavorable Behaviors in Children Run in Packs! Dietary and Non-Dietary Modulators of Attentional Capacity. Nutrients 2022, 14, 5264. [Google Scholar] [CrossRef] [PubMed]
- Teo, C.H.; Chin, Y.S.; Lim, P.Y.; Masrom, S.A.H.; Shariff, Z.M. Impacts of a School-Based Intervention That Incorporates Nutrition Education and a Supportive Healthy School Canteen Environment among Primary School Children in Malaysia. Nutrients 2021, 13, 1712. [Google Scholar] [CrossRef] [PubMed]


| Items |
|---|
| K1: Which nutrient, besides carbohydrate and fat, serves a source of energy? |
| K2: Which of the following foods is a primary source of carbohydrates? |
| K3: What proportion of daily energy intake should be provided by breakfast for school-aged children? |
| K4: What is the function of dietary fiber? |
| K5: Which of the following foods is rich in dietary fiber? |
| K6: Among animal-based food, which has the highest nutritional value? |
| K7: What is the recommended daily limit for salt consumption? |
| K8: Which of the following foods is a source of high-quality protein? |
| K9: Which dairy products is considered the most nutritious? |
| K10: Are trans fatty acids harmful to human body? |
| K11: Which nutrient in dairy products contribute to bone strength? |
| K12: What type of food can help prevent iron-deficiency anemia? |
| K13: Which vitamin is beneficial for the healing of oral ulcers? |
| K14: Can fruit juice fully replace fresh fruits in the diet? |
| K15: Which vitamin in cereal grains helps regulate the nervous system? |
| K16: Is soybean protein considered a high-quality protein? |
| K17: For school-aged children, what is the recommended daily limit for added sugar intake? |
| K18: What is the recommended duration of daily physical activity for school-aged children? |
| K19: Are you familiar with nutrition labels on food packages? |
| K20: Do you believe that eating healthy meals is important for overall health? |
| Nutritional Attitude | |
| Attitude towards non-preferred foods | Are you willing to try foods that are not your favorite? (Willing to try most of the time, Willing to try occasionally, Always unwilling to try) |
| Sources of dietary knowledge | What are your sources of dietary knowledge? (Multiple choice) (Television/Internet, School clubs/Large scale events, Newspapers/Magazines/Books, Classroom instruction, Home, Other) |
| Dietary activities participation | Has the school or class ever organized any of the following dietary-related activities? (Multiple choice) (Class meetings focused on diet, Specialized dietary education courses, Integration of dietary knowledge into other subjects, Series of informative dietary lectures, Cooking activities, Dietary knowledge competition, Other, None of the above apply) |
| Attitude towards participating in dietary activities | Are you inclined to participate in the dietary activities organized by your school? (Interested, Neutral, Uninterested) |
| Expectation of nutritional adequacy | Do you expect your diet to meet your nutritional requirements? (Yes, No, Indifferent) |
| Attitude towards changing unhealthy eating habits | Do you want to change your unhealthy eating habits? (Yes, No, Indifferent) |
| Parental dietary expectation | What dietary expectations do your parentes have for you? (Eating whatever I like, Not picky, Not picky and being informed about the nutritional content of different foods) |
| Perception of body shape | How would you describe your body shape? (Normal, Thin, Obese) |
| Satisfaction with body shape | Are you satisfied with your body shape? (Very satisfied, Satisfied, Neutral, Not satisfied, Very dissatisfied) |
| Perception of obesity | What is your opinion on obesity? (Obesity is positively correlated with health, Obesity is negatively correlated with health, Obesity has no correlation with health) |
| Perceived causes of obesity | Which factors do you believe contribute to obesity? (Multiple choice) (Genetics, Excessive energy intake, Insufficient physical activity, Picky eating, Irregular eating patterns) |
| Nutritional practice | |
| Frequency of breakfast | During the past week, how often did you have breakfast? (Everyday, 3–6 times/w, 1–2 times/w, Never) |
| Reasons for skipping breakfast | During the past week, what were the reasons for not having breakfast? (Applicable only to students who did not select ‘everyday’ in the previous question) (Lack of time, Fullness or loss of appetite, No breakfast preparation available, Dietary considerations for weight loss) |
| Types of breakfast foods | Which of the following food categories were included in your breakfast on each occasion? (Multiple choices) (Grains, Vegetables, Fruits, Meats, Eggs, Beans, Milk, Nuts) |
| Choice of thirst-quenching drinks | During the past week, when you were thirsty, which of the following drinks did you choose most often? (Water, Tea, Cola/Sprite/Juice/Milk tea or other sweetened beverages, Milk) |
| Daily water intake | During the past week, what was your average daily consumption of water(including puried or mineral water)? (≥1100 mL, 600–1000 mL, 200–600 mL, ≤200 mL) |
| Milk consumption | During the past week, how often did you consume milk or milk products? (≥2 bottles/d, 1 bottle/d, 1 bottle every 1–2 days, 1 bottle of every 3–5 days, 1 bottle of every 6–7 days, never) (each bottle ≈ 250 mL) |
| Egg consumption | During the past week, how often did you eat eggs? (≥2 times/d, 1 time/d, 3–6 times/w, 1–2 times/w, Never) |
| Staple food consumption | During the past week, how often did you eat staple foods (such as cereals and potatoes)? (3 times/d, 2 times/d, 1 time/d, 3–5 times/w, 1–2 times/w, Never) |
| Meat consumption | During the past week, how often did you eat meat (e.g., pork, beef, lamb, chicken, duck, fish, etc.)? (3 times/d, 2 times/d, 1 time/d, 3–5 times/w, 1–2 times/w, Never) |
| Bean product consumption | During the past week, how often did you consume beans and products (e.g., tofu, soybean milk, beancurd sheet, etc.)? (3 times/d, 2 times/d, 1 time/d, 3–6 times/w, 1–2 times/w, Never) |
| Fruit consumption | During the past week, how much fruit did you eat per day on average (The edible portion of a medium apple is about 200 g)? (≥400 g/d, 300–400 g/d, 200–300 g/d, 100–200 g/d, <100 g/d) |
| Nut consumption | During the past week, how often did you eat nuts (e.g., seeds, almonds, walnuts, etc.)? (Everyday, 3–6 times/w, 1–2 times/w, Never) |
| Vegetable consumption | During the past week, how many different types of vegetables did you eat per day? (≥5 types/d, 3–4 types/d, 1–2 types/d) |
| Sugared beverage consumption | During the past week, how often did you consume sugared beverages (e.g., cola, soda, juice drinks, functional drinks, lactic acid drinks, milk tea, etc.)? (≥2 times/d, 1 time/d, 3–6 times/w, 1–2 times/w, Never) |
| Amount of sugared beverage intake | During the past week, what was the average amount of each sugared beverage consumed? (Open-ended question) |
| Western fast food consumption | During the past week, how often did you eat Western fast food (e.g., KFC/McDonald’s/Pizza Hut, etc.) or take-out meals? (≥2 times/d, 1 time/d, 3–6 times/w, 1–2 times/w, Never) |
| High-calorie snack consumption | During the past week, how often did you eat high-calorie snacks (e.g., chips, candy, jellies, cookies, spicy bars, puffed foods, etc.)? (≥2 times/d, 1 time/d, 3–6 times/w, 1–2 times/w, Never) |
| Nighttime snack consumption | During the past week, how often did you eat nighttime snacks? (1 time/d, 3–6 times/w, 1–2 times/w, Never) |
| Diet-related practice | |
| Help with food preparation | During the past week, how often did you assist in food preparation tasks (e.g., shopping, washing ingredients, setting utensils, etc.) while your family was cooking? (Everyday, 3–6 times/w, 1–2 times/w, Never) |
| Types of dishes cooked | How many different kinds of dishes can you prepare independently? (None, Limited to rice only, 1–2 types, 3–4 types, 5–9 types, ≥10 types) |
| Cooking criteria ranking | Based on your experience, please rank the following factors according to their importance when cooking a dish: Degree of liking, Color appearance, Flavor and taste, Availability of ingredients, Nutritional value |
| Cooking frequency | How often do you participate in cooking activities, such as preparing rice or cooking dishes, either independently or by assisting your family at home? (Everyday, 3–6 times/w, 1–2 times/w, Never) |
| Checking expiration dates | When purchasing food at the supermarket, do you check the expiration dates? (Always check the date and packaging carefully, Occasionally check the date and packaging, Never check, Not applicable due to no personal purchases) |
| Physical activity | |
| Vigorous physical activity | During the past week, on how many days did you engage in vigorous physical activity (e.g., basketball, soccer, running, swimming, fast biking, brisk dancing, etc.) for more than 60 min, resulting in sweating and increased breathing? (7 d, 6 d, 5 d, 4 d, 3 d, 2 d, 1 d, 0 d) |
| Daily physical activity | During the past week, how much time did you spend on physical activity per day, including recess, PE classes, extracurricular sports, and commuting to and from school? (≥2 h, 1–2 h, 0.5–1 h, ≤0.5 h) |
| Physical activity during recess | During the past week, how did you typically spend your recess time? (Engaged in reading or homework, Sat quietly or chatted with classmates, Played with classmates inside the classroom, Engaged in outdoor activities) |
| Daily sleep duration | During the past week, what was your average daily sleep duration, including naps? (≥9 h, 7–8 h, ≤7 h) |
| Variables | Total | Eating Daily | Skipping Breakfast | χ2 (t) | p |
|---|---|---|---|---|---|
| (n = 1449) | (n = 1315) | (n = 134) | |||
| Demographic characteristics | |||||
| Sex, n (%) | 0.12 | 0.73 | |||
| Male | 780 (53.83) | 706 (53.69) | 74 (55.22) | ||
| Female | 669 (46.17) | 609 (46.31) | 60 (44.78) | ||
| Age, n (%) | 12.89 | 0.005 * | |||
| Ninth | 298 (20.57) | 256 (19.47) | 42 (31.34) | ||
| Tenth | 519 (35.82) | 470 (35.74) | 49 (36.57) | ||
| Eleventh | 463 (31.95) | 432 (32.85) | 31 (23.13) | ||
| Twelfth | 169 (11.66) | 157 (11.94) | 12 (8.96) | ||
| Grade, n (%) | 17.45 | <0.001 * | |||
| Fourth | 532 (36.71) | 461 (35.06) | 71 (52.99) | ||
| Fifth | 562 (38.79) | 520 (39.54) | 42 (31.34) | ||
| Sixth | 355 (24.50) | 334 (25.40) | 21 (15.67) | ||
| Nutritional status, n (%) | 2.29 | 0.52 | |||
| Thin | 160 (11.04) | 143 (10.87) | 17 (12.69) | ||
| Normal | 867 (59.83) | 782 (59.47) | 85 (63.43) | ||
| Overweight | 180 (12.42) | 165 (12.55) | 15 (11.19) | ||
| Obesity | 242 (16.70) | 225 (17.11) | 17 (12.69) | ||
| Whether only child, n (%) | 1.55 | 0.21 | |||
| Yes | 440 (30.37) | 393 (29.89) | 47 (35.07) | ||
| No | 1009 (69.63) | 922 (70.11) | 87 (64.93) | ||
| Maternal education, n (%) | 0.14 | 0.71 | |||
| College degree or below | 941 (64.94) | 852 (64.79) | 89 (66.42) | ||
| Bachelor’s degree or above | 508 (35.06) | 463 (35.21) | 45 (33.58) | ||
| Paternal education, n (%) | 0.41 | 0.52 | |||
| College degree or below | 838 (57.83) | 757 (57.57) | 81 (60.45) | ||
| Bachelor’s degree or above | 611 (42.17) | 558 (42.43) | 53 (39.55) | ||
| Variables | Total | Eating Daily | Skipping Breakfast | χ2 (t) | p |
|---|---|---|---|---|---|
| (n = 1449) | (n = 1315) | (n = 134) | |||
| Nutrition knowledge score, M (P25, P75) | 13.00 (10.00, 16.00) | 13.00 (10.00, 16.00) | 13.50 (11.00, 16.00) | 1.73 | 0.08 |
| Nutritional attitude | |||||
| Attitude towards non-preferred foods, n (%) | 15.13 | <0.001 * | |||
| Willing to try most of the time | 584 (40.30) | 550 (41.83) | 34 (25.37) | ||
| Willing to try occasionally | 756 (52.17) | 672 (51.10) | 84 (62.69) | ||
| Always unwilling to try | 109 (7.52) | 93 (7.07) | 16 (11.94) | ||
| Attitude towards participating in dietary activities, n (%) | 21.26 | <0.001 * | |||
| Interested | 629 (48.87) | 592 (50.47) | 37 (32.46) | ||
| Neutral | 578 (44.91) | 517 (44.08) | 61 (53.51) | ||
| Uninterested | 80 (6.22) | 64 (5.46) | 16 (14.04) | ||
| Expectation of nutritional adequacy, n (%) | 7.37 | 0.025 * | |||
| Yes | 1036 (71.50) | 951 (72.32) | 85 (63.43) | ||
| Indifferent | 204 (14.08) | 175 (13.31) | 29 (21.64) | ||
| No | 209 (14.42) | 189 (14.37) | 20 (14.93) | ||
| Attitude towards changing unhealthy eating habits, n (%) | 25.54 | <0.001 * | |||
| Yes | 925 (63.84) | 856 (65.10) | 69 (51.49) | ||
| Indifferent | 291 (20.08) | 268 (20.38) | 23 (17.16) | ||
| No | 233 (16.08) | 191 (14.52) | 42 (31.34) | ||
| Satisfaction with body shape, n (%) | 3.21 | 0.20 | |||
| Satisfied | 833 (57.49) | 747 (56.81) | 86 (64.18) | ||
| Neutral | 459 (31.68) | 421 (32.02) | 38 (28.36) | ||
| Unsatisfied | 157 (10.84) | 147 (11.18) | 10 (7.46) | ||
| Nutritional practice (over the past week) | |||||
| Types of breakfast foods, n (%) | 9.61 | 0.008 * | |||
| ≥5 types/d | 538 (37.13) | 503 (38.25) | 35 (26.12) | ||
| 2–4 types/d | 776 (53.55) | 696 (52.93) | 80 (59.70) | ||
| ≤1 type/d | 135 (9.32) | 116 (8.82) | 19 (14.18) | ||
| Choice of thirst-quenching drinks, n (%) | 26.66 | <0.001 * | |||
| Water | 1204 (83.09) | 1114 (84.71) | 90 (67.16) | ||
| Tea, sugared beverages, milk, etc. | 245 (16.91) | 201 (15.29) | 44 (32.84) | ||
| Daily water intake, n (%) | 2.61 | 0.11 | |||
| ≥1100 mL/d | 691 (47.69) | 636 (48.37) | 55 (41.04) | ||
| <1100 mL/d | 758 (52.31) | 679 (51.63) | 79 (58.96) | ||
| Milk consumption, n (%) | 3.24 | 0.07 | |||
| ≥1 bottle/d | 956 (65.98) | 877 (66.69) | 79 (58.96) | ||
| <1 bottle/d | 493 (34.02) | 438 (33.31) | 55 (41.04) | ||
| Egg consumption, n (%) | 6.92 | 0.009 * | |||
| ≥1 per day | 363 (25.05) | 342 (26.01) | 21 (15.67) | ||
| <1 per day | 1086 (74.95) | 973 (73.99) | 113 (84.33) | ||
| Staple food consumption, n (%) | 11.7 | <0.001 * | |||
| 4–7 times/w | 430 (29.68) | 373 (28.37) | 57 (42.54) | ||
| 1–3 times/w | 1019 (70.32) | 942 (71.63) | 77 (57.46) | ||
| Meat consumption, n (%) | 1.27 | 0.26 | |||
| 4–7 times/w | 343 (23.67) | 306 (23.27) | 37 (27.61) | ||
| 1–3 times/w | 1106 (76.33) | 1009 (76.73) | 97 (72.39) | ||
| Bean products consumption, n (%) | 0.1 | 0.75 | |||
| 4–7 times/w | 1010 (69.70) | 915 (69.58) | 95 (70.90) | ||
| 1–3 times/w | 439 (30.30) | 400 (30.42) | 39 (29.10) | ||
| Fruit consumption, n (%) | 6.51 | 0.04 * | |||
| ≥400 g/d | 415 (28.64) | 389 (29.58) | 26 (19.40) | ||
| 200–400 g/d | 779 (53.76) | 700 (53.23) | 79 (58.96) | ||
| <200 g/d | 255 (17.60) | 226 (17.19) | 29 (21.64) | ||
| Nut consumption, n (%) | 14.89 | 0.001 * | |||
| ≥3 times/w | 493 (34.02) | 453 (34.45) | 40 (29.85) | ||
| 1–2 times/w | 716 (49.41) | 660 (50.19) | 56 (41.79) | ||
| Never | 240 (16.56) | 202 (15.36) | 38 (28.36) | ||
| Vegetable consumption, n (%) | 16.35 | <0.001 * | |||
| ≥5 types/d | 539 (37.20) | 507 (38.56) | 32 (23.88) | ||
| 3–4 types/d | 667 (46.03) | 601 (45.70) | 66 (49.25) | ||
| 1–2 types/d | 243 (16.77) | 207 (15.74) | 36 (26.87) | ||
| Sugared beverage consumption, n (%) | 3.89 | 0.04 * | |||
| ≤2 times/w | 1249 (86.20) | 1141 (86.77) | 108 (80.60) | ||
| ≥3 times/w | 200 (13.80) | 174 (13.23) | 26 (19.40) | ||
| Western fast food consumption, n (%) | 0.23 | 0.63 | |||
| ≤2 times/w | 1355 (93.51) | 1231 (93.61) | 124 (92.54) | ||
| ≥3 times/w | 94 (6.49) | 84 (6.39) | 10 (7.46) | ||
| High-calorie snack consumption, n (%) | 1.55 | 0.21 | |||
| ≤2 times/w | 1081 (74.60) | 987 (75.06) | 94 (70.15) | ||
| ≥3 times/w | 368 (25.40) | 328 (24.94) | 40 (29.85) | ||
| Nighttime snack consumption, n (%) | 15.46 | <0.001 * | |||
| ≤2 times/w | 883 (61.96) | 821 (63.59) | 62 (46.27) | ||
| ≥3 times/w | 542 (38.04) | 470 (36.41) | 72 (53.73) |
| Variables | Total | Eating Daily | Skipping Breakfast | χ2 | p |
|---|---|---|---|---|---|
| (n = 1449) | (n = 1315) | (n = 134) | |||
| Diet-related practice (over the past week) | |||||
| Help with food preparation, n (%) | 12.5 | 0.006 * | |||
| Everyday | 501 (34.58) | 471 (35.82) | 30 (22.39) | ||
| 3–6 times/w | 400 (27.61) | 363 (27.60) | 37 (27.61) | ||
| 1–2 times/w | 423 (29.19) | 373 (28.37) | 50 (37.31) | ||
| Never | 125 (8.63) | 108 (8.21) | 17 (12.69) | ||
| Types of dishes cooked, n (%) | 0.73 | 0.69 | |||
| ≥3 types | 907 (62.59) | 827 (62.89) | 80 (59.70) | ||
| 1–2 types | 453 (31.26) | 409 (31.10) | 44 (32.84) | ||
| None | 89 (6.14) | 79 (6.01) | 10 (7.46) | ||
| Cooking frequency, n (%) | 13.13 | 0.004 * | |||
| Everyday | 278 (19.19) | 262 (19.92) | 16 (11.94) | ||
| 3–6 times/w | 336 (23.19) | 313 (23.80) | 23 (17.16) | ||
| 1–2 times/w | 700 (48.31) | 625 (47.53) | 75 (55.97) | ||
| Never | 135 (9.32) | 115 (8.75) | 20 (14.93) | ||
| Checking expiration dates, n (%) | 22.59 | <0.001 * | |||
| Always | 992 (68.46) | 923 (70.19) | 69 (51.49) | ||
| Occasionally | 348 (24.02) | 303 (23.04) | 45 (33.58) | ||
| Never | 109 (7.52) | 89 (6.77) | 20 (14.93) | ||
| Physical activity (over the past week) | |||||
| Vigorous physical activity, n (%) | 10.61 | 0.005 * | |||
| Everyday | 630 (43.48) | 585 (44.49) | 45 (33.58) | ||
| 4–6 days | 504 (34.78) | 458 (34.83) | 46 (34.33) | ||
| 1–3 days & Never | 315 (21.74) | 272 (20.68) | 43 (32.09) | ||
| Daily physical activity, n (%) | 3.6 | 0.17 | |||
| ≥2 h | 425 (29.33) | 394 (29.96) | 31 (23.13) | ||
| 1–2 h | 763 (52.66) | 690 (52.47) | 73 (54.48) | ||
| ≤1 h | 261 (18.01) | 231 (17.57) | 30 (22.39) | ||
| Physical activity during recess, n (%) | 5.94 | 0.02 * | |||
| Yes | 740 (51.07) | 685 (52.09) | 55 (41.04) | ||
| No | 709 (48.93) | 630 (47.91) | 79 (58.96) | ||
| Daily sleep duration, n (%) | 2.45 | 0.12 | |||
| ≥9 h | 677 (46.72) | 623 (47.38) | 54 (40.30) | ||
| ≤8 h | 772 (53.28) | 692 (52.62) | 80 (59.70) | ||
| Variable | Frequency of Breakfast for All Students | |
|---|---|---|
| OR (95%CI) | AOR * (95%CI) | |
| Nutrition knowledge score | 1.009 (0.951–1.071) | 1.002 (0.943–1.065) |
| Nutritional attitude | ||
| Attitude towards non-preferred foods | ||
| Willing to try most of the time | 0.676 (0.311–1.468) | 0.718 (0.327–1.576) |
| Willing to try occasionally | 0.897 (0.452–1.783) | 0.938 (0.465–1.892) |
| Always unwilling to try | Ref. | Ref. |
| Attitude towards participating in dietary activities | ||
| Interested | 0.424 (0.191–0.939) | 0.420 (0.186–0.948) |
| Neutral | 0.540 (0.26–1.119) | 0.557 (0.265–1.171) |
| Uninterested | Ref. | Ref. |
| Expectation of nutritional adequacy | ||
| Yes | 1.208 (0.598–2.441) | 1.085 (0.525–2.242) |
| Indifferent | 0.858 (0.401–1.837) | 0.859 (0.395–1.867) |
| No | Ref. | Ref. |
| Attitude towards changing unhealthy eating habits | ||
| Yes | 0.439 (0.233–0.825) | 0.434 (0.226–0.835) |
| Indifferent | 0.333 (0.166–0.665) | 0.312 (0.152–0.639) |
| No | Ref. | Ref. |
| Satisfaction with body shape | ||
| Satisfied | 1.034 (0.475–2.253) | 1.027 (0.464–2.269) |
| Neutral | 0.837 (0.366–1.915) | 0.843 (0.363–1.961) |
| Unsatisfied | Ref. | Ref. |
| Nutritional practice (over the past week) | ||
| Types of breakfast foods | ||
| ≥5 types/d | 0.614 (0.289–1.304) | 0.559 (0.259–1.205) |
| 2–4 types/d | 0.620 (0.316–1.216) | 0.528 (0.265–1.052) |
| ≤1 type/d | Ref. | Ref. |
| Choice of thirst-quenching drinks | ||
| Water | 0.420 (0.261–0.675) | 0.404 (0.248–0.659) |
| Others (Tea, sugared beverages, milk, etc.) | Ref. | Ref. |
| Daily water intake | ||
| ≥1100 mL/d | 1.172 (0.745–1.846) | 1.106 (0.694–1.765) |
| <1100 mL/d | Ref. | Ref. |
| Milk consumption | ||
| ≥1 bottle/d | 1.042 (0.664–1.637) | 1.056 (0.668–1.670) |
| <1 bottle/d | Ref. | Ref. |
| Egg consumption | ||
| ≥1 per day | 0.867 (0.493–1.523) | 0.836 (0.468–1.492) |
| <1 per day | Ref. | Ref. |
| Staple food consumption | ||
| 4–7 times/w | 1.407 (0.883–2.244) | 1.426 (0.885–2.298) |
| 1–3 times/w | Ref. | Ref. |
| Meat consumption | ||
| 4–7 times/w | 0.868 (0.516–1.463) | 0.870 (0.508–1.488) |
| 1–3 times/w | Ref. | Ref. |
| Bean products consumption | ||
| 4–7 times/w | 0.839 (0.514–1.370) | 0.853 (0.519–1.404) |
| 1–3 times/w | Ref. | Ref. |
| Fruit consumption | ||
| ≥400 g/d | 1.016 (0.495–2.086) | 1.106 (0.531–2.306) |
| 200–400 g/d | 1.746 (0.975–3.129) | 1.762 (0.969–3.201) |
| <200 g/d | Ref. | Ref. |
| Nut consumption | ||
| ≥3 times/w | 0.589 (0.320–1.083) | 0.607 (0.326–1.132) |
| 1–2 times/w | 0.542 (0.316–0.932) | 0.541 (0.312–0.940) |
| Never | Ref. | Ref. |
| Vegetable consumption | ||
| ≥5 types/d | 0.496 (0.270–0.914) | 0.525 (0.283–0.975) |
| 3–4 types/d | 0.654 (0.381–1.121) | 0.657 (0.380–1.136) |
| 1–2 types/d | Ref. | Ref. |
| Sugared beverage consumption | ||
| ≤2 times/w | 1.204 (0.649–2.236) | 1.197 (0.641–2.236) |
| ≥3 times/w | Ref. | Ref. |
| Western fast food consumption | ||
| ≤2 times/w | 1.567 (0.650–3.778) | 1.543 (0.630–3.782) |
| ≥3 times/w | Ref. | Ref. |
| High-calorie snack consumption | ||
| ≤2 times/w | 0.905 (0.549–1.492) | 0.905 (0.544–1.506) |
| ≥3 times/w | Ref. | Ref. |
| Nighttime snack consumption | ||
| ≤2 times/w | 0.517 (0.334–0.800) | 0.514 (0.329–0.804) |
| ≥3 times/w | Ref. | Ref. |
| Diet-related practice (over the past week) | ||
| Help with food preparation | ||
| Everyday | 1.264 (0.513–3.116) | 1.305 (0.514–3.311) |
| 3–6 times/w | 1.464 (0.624–3.435) | 1.428 (0.593–3.440) |
| 1–2 times/w | 1.279 (0.578–2.830) | 1.263 (0.560–2.846) |
| Never | Ref. | Ref. |
| Types of dishes cooked | ||
| ≥3 types | 3.271 (1.119–9.563) | 2.695 (0.904–8.035) |
| 1–2 types | 1.828 (0.637–5.251) | 1.609 (0.551–4.700) |
| None | Ref. | Ref. |
| Cooking frequency | ||
| Everyday | 0.267 (0.096–0.742) | 0.263 (0.093–0.745) |
| 3–6 times/w | 0.433 (0.172–1.091) | 0.444 (0.174–1.134) |
| 1–2 times/w | 0.642 (0.292–1.409) | 0.629 (0.283–1.394) |
| Never | Ref. | Ref. |
| Checking expiration dates | ||
| Always | 0.400 (0.206–0.776) | 0.375 (0.190–0.740) |
| Occasionally | 0.726 (0.370–1.426) | 0.687 (0.344–1.370) |
| Never | Ref. | Ref. |
| Physical activity (over the past week) | ||
| Vigorous physical activity | ||
| Everyday | 0.782 (0.437–1.401) | 0.743 (0.406–1.359) |
| 4–6 days | 0.607 (0.347–1.060) | 0.623 (0.351–1.108) |
| 1–3 days & Never | Ref. | Ref. |
| Daily physical activity | ||
| ≥2 h | 1.006 (0.511–1.981) | 1.058 (0.531–2.107) |
| 1–2 h | 0.940 (0.546–1.619) | 0.933 (0.537–1.622) |
| ≤1 h | Ref. | Ref. |
| Physical activity during recess | ||
| Yes | 0.538 (0.347–0.833) | 0.572 (0.365–0.896) |
| No | Ref. | Ref. |
| Daily sleep duration | ||
| ≥9 h | 1.082 (0.670–1.748) | 1.106 (0.678–1.806) |
| ≤8 h | Ref. | Ref. |
| Variables | Types of Breakfast Foods | χ2 (F) | p | ||
|---|---|---|---|---|---|
| ≤1 (n = 135) | 2–4 (n = 776) | ≥5 (n = 538) | |||
| Sex, n (%) | 0.62 | 0.74 | |||
| Male | 77 (57.04) | 415 (53.48) | 288 (53.53) | ||
| Female | 58 (42.96) | 361 (46.52) | 250 (46.47) | ||
| Age, n (%) | 19.76 | 0.003 * | |||
| Ninth | 15 (11.11) | 185 (23.84) | 98 (18.22) | ||
| Tenth | 58 (42.96) | 280 (36.08) | 181 (33.64) | ||
| Eleventh | 48 (35.56) | 224 (28.87) | 191 (35.50) | ||
| Twelfth | 14 (10.37) | 87 (11.21) | 68 (12.64) | ||
| Grade, n (%) | 27.87 | <0.001 * | |||
| Fourth | 35 (25.93) | 308 (39.69) | 189 (35.13) | ||
| Fifth | 70 (51.85) | 307 (39.56) | 185 (34.39) | ||
| Sixth | 30 (22.22) | 161 (20.75) | 164 (30.48) | ||
| Nutritional status, n (%) | 7.10 | 0.31 | |||
| Thin | 10 (7.41) | 96 (12.37) | 54 (10.04) | ||
| Normal | 90 (66.67) | 452 (58.25) | 325 (60.41) | ||
| Overweight | 13 (9.63) | 104 (13.40) | 63 (11.71) | ||
| Obesity | 22 (16.30) | 124 (15.98) | 96 (17.84) | ||
| Whether only child, n (%) | 0.66 | 0.72 | |||
| Yes | 38 (28.15) | 242 (31.19) | 160 (29.74) | ||
| No | 97 (71.85) | 534 (68.81) | 378 (70.26) | ||
| Maternal education, n (%) | 5.87 | 0.05 | |||
| College degree or below | 98 (72.59) | 510 (65.72) | 333 (61.90) | ||
| Bachelor’s degree or above | 37 (27.41) | 266 (34.28) | 205 (38.10) | ||
| Paternal education, n (%) | 4.00 | 0.14 | |||
| College degree or below | 89 (65.93) | 443 (57.09) | 306 (56.88) | ||
| Bachelor’s degree or above | 46 (34.07) | 333 (42.91) | 232 (43.12) | ||
| Variables | Types of Breakfast Foods | χ2 (F) | p | ||
|---|---|---|---|---|---|
| ≤1 (n = 135) | 2–4 (n = 776) | ≥5 (n = 538) | |||
| Nutrition knowledge score, M (P25, P75) | 14.00 (11.00, 17.00) | 13.00 (11.00, 16.00) | 12.00 (10.00, 15.00) | 24.75 # | <0.001 * |
| Nutritional attitude | |||||
| Attitude towards non-preferred foods, n (%) | 47.05 | <0.001 * | |||
| Willing to try most of the time | 40 (29.63) | 270 (34.79) | 274 (50.93) | ||
| Willing to try occasionally | 77 (57.04) | 441 (56.83) | 238 (44.24) | ||
| Always unwilling to try | 18 (13.33) | 65 (8.38) | 26 (4.83) | ||
| Attitude towards participating in dietary activities, n (%) | 83.69 | <0.001 * | |||
| Interested | 27 (23.89) | 286 (42.25) | 316 (63.58) | ||
| Neutral | 77 (68.14) | 341 (50.37) | 160 (32.19) | ||
| Uninterested | 9 (7.96) | 50 (7.39) | 21 (4.23) | ||
| Expectation of nutritional adequacy, n (%) | 35.49 | <0.001 * | |||
| Yes | 80 (59.26) | 525 (67.65) | 431 (80.11) | ||
| Indifferent | 28 (20.74) | 126 (16.24) | 50 (9.29) | ||
| No | 27 (20.00) | 125 (16.11) | 57 (10.59) | ||
| Attitude towards changing unhealthy eating habits, n (%) | 41.28 | <0.001 * | |||
| Yes | 64 (47.41) | 467 (60.18) | 394 (73.23) | ||
| Indifferent | 41 (30.37) | 173 (22.29) | 77 (14.31) | ||
| No | 30 (22.22) | 136 (17.53) | 67 (12.45) | ||
| Satisfaction with body shape, n (%) | 6.25 | 0.18 | |||
| Satisfied | 86 (63.70) | 450 (57.99) | 297 (55.20) | ||
| Neutral | 34 (25.19) | 252 (32.47) | 173 (32.16) | ||
| Unsatisfied | 15 (11.11) | 74 (9.54) | 68 (12.64) | ||
| Variables | Types of Breakfast Foods | χ2 | p | ||
|---|---|---|---|---|---|
| ≤1 (n = 135) | 2–4 (n = 776) | ≥5 (n = 538) | |||
| Nutritional practice (over the past week) | |||||
| Choice of thirst-quenching drinks, n (%) | 7.38 | 0.03 * | |||
| Water | 102 (75.56) | 643 (82.86) | 459 (85.32) | ||
| Tea, sugared beverages, milk, etc. | 33 (24.44) | 133 (17.14) | 79 (14.68) | ||
| Daily water intake, n (%) | 73.52 | <0.001 * | |||
| ≥1100 mL/d | 40 (29.63) | 319 (41.11) | 332 (61.71) | ||
| <1100 mL/d | 95 (70.37) | 457 (58.89) | 206 (38.29) | ||
| Milk consumption, n (%) | 24.42 | <0.001 * | |||
| ≥1 bottle/d | 82 (60.74) | 476 (61.34) | 398 (73.98) | ||
| <1 bottle/d | 53 (39.26) | 300 (38.66) | 140 (26.02) | ||
| Egg consumption, n (%) | 55.42 | <0.001 * | |||
| ≥1 per day | 23 (17.04) | 146 (18.81) | 194 (36.06) | ||
| <1 per day | 112 (82.96) | 630 (81.19) | 344 (63.94) | ||
| Staple food consumption, n (%) | 42.03 | <0.001 * | |||
| 4–7 times/w | 56 (41.48) | 267 (34.41) | 107 (19.89) | ||
| 1–3 times/w | 79 (58.52) | 509 (65.59) | 431 (80.11) | ||
| Meat consumption, n (%) | 26.19 | <0.001 * | |||
| 4–7 times/w | 49 (36.30) | 201 (25.90) | 93 (17.29) | ||
| 1–3 times/w | 86 (63.70) | 575 (74.10) | 445 (82.71) | ||
| Bean products consumption, n (%) | 3.68 | 0.16 | |||
| 4–7 times/w | 98 (72.59) | 553 (71.26) | 359 (66.73) | ||
| 1–3 times/w | 37 (27.41) | 223 (28.74) | 179 (33.27) | ||
| Fruit consumption, n (%) | 46.79 | <0.001 * | |||
| ≥400 g/d | 29 (21.48) | 197 (25.39) | 189 (35.13) | ||
| 200–400 g/d | 71 (52.59) | 410 (52.84) | 298 (55.39) | ||
| <200 g/d | 35 (25.93) | 169 (21.78) | 51 (9.48) | ||
| Nut consumption, n (%) | 52.22 | <0.001 * | |||
| ≥3 times/w | 35 (25.93) | 249 (32.09) | 209 (38.85) | ||
| 1–2 times/w | 60 (44.44) | 371 (47.81) | 285 (52.97) | ||
| Never | 40 (29.63) | 156 (20.10) | 44 (8.18) | ||
| Vegetable consumption, n (%) | 28.32 | <0.001 * | |||
| ≥5 types/d | 41 (30.37) | 273 (35.18) | 225 (41.82) | ||
| 3–4 types/d | 57 (42.22) | 356 (45.88) | 254 (47.21) | ||
| 1–2 types/d | 37 (27.41) | 147 (18.94) | 59 (10.97) | ||
| Sugared beverage consumption, n (%) | 22.92 | <0.001 * | |||
| ≤2 times/w | 99 (73.33) | 670 (86.34) | 480 (89.22) | ||
| ≥3 times/w | 36 (26.67) | 106 (13.66) | 58 (10.78) | ||
| Western fast food consumption, n (%) | 14.15 | <0.001 * | |||
| ≤2 times/w | 116 (85.93) | 731 (94.20) | 508 (94.42) | ||
| ≥3 times/w | 19 (14.07) | 45 (5.80) | 30 (5.58) | ||
| High-calorie snack consumption, n (%) | 8.78 | 0.012 * | |||
| ≤2 times/w | 96 (71.11) | 560 (72.16) | 425 (79.00) | ||
| ≥3 times/w | 39 (28.89) | 216 (27.84) | 113 (21.00) | ||
| Nighttime snack consumption, n (%) | 13.33 | 0.001 * | |||
| ≤2 times/w | 77 (57.89) | 444 (58.42) | 362 (68.05) | ||
| ≥3 times/w | 56 (42.11) | 316 (41.58) | 170 (31.95) | ||
| Variables | Types of Breakfast Foods | χ2 | p | ||
|---|---|---|---|---|---|
| ≤1 (n = 135) | 2–4 (n = 776) | ≥5 (n = 538) | |||
| Diet-related practice (over the past week) | |||||
| Help with food preparation, n (%) | 66.72 | <0.001 * | |||
| Everyday | 34 (25.19) | 217 (27.96) | 250 (46.47) | ||
| 3–6 times/w | 34 (25.19) | 224 (28.87) | 142 (26.39) | ||
| 1–2 times/w | 49 (36.30) | 253 (32.60) | 121 (22.49) | ||
| Never | 18 (13.33) | 82 (10.57) | 25 (4.65) | ||
| Types of dishes cooked, n (%) | 44.74 | <0.001 * | |||
| ≥3 types | 59 (43.70) | 468 (60.31) | 380 (70.63) | ||
| 1–2 types | 58 (42.96) | 254 (32.73) | 141 (26.21) | ||
| None | 18 (13.33) | 54 (6.96) | 17 (3.16) | ||
| Cooking frequency, n (%) | 38.64 | <0.001 * | |||
| Eveyday | 24 (17.78) | 124 (15.98) | 130 (24.16) | ||
| 3–6 times/w | 30 (22.22) | 161 (20.75) | 145 (26.95) | ||
| 1–2 times/w | 61 (45.19) | 404 (52.06) | 235 (43.68) | ||
| Never | 20 (14.81) | 87 (11.21) | 28 (5.20) | ||
| Checking expiration dates, n (%) | 51.43 | <0.001 * | |||
| Always | 68 (50.37) | 503 (64.82) | 421 (78.25) | ||
| Occasionally | 47 (34.81) | 210 (27.06) | 91 (16.91) | ||
| Never | 20 (14.81) | 63 (8.12) | 26 (4.83) | ||
| Physical activity (over the past week) | |||||
| Vigorous physical activity, n (%) | 65.71 | <0.001 * | |||
| Everyday | 48 (35.56) | 279 (35.95) | 303 (56.32) | ||
| 4–6 days | 46 (34.07) | 296 (38.14) | 162 (30.11) | ||
| 1–3 days & Never | 41 (30.37) | 201 (25.90) | 73 (13.57) | ||
| Daily physical activity, n (%) | 60.74 | <0.001 * | |||
| ≥2 h | 21 (15.56) | 196 (25.26) | 208 (38.66) | ||
| 1–2 h | 75 (55.56) | 414 (53.35) | 274 (50.93) | ||
| ≤1 h | 39 (28.89) | 166 (21.39) | 56 (10.41) | ||
| Physical activity during recess, n (%) | 3.57 | 0.17 | |||
| Yes | 75 (55.56) | 379 (48.84) | 286 (53.16) | ||
| No | 60 (44.44) | 397 (51.16) | 252 (46.84) | ||
| Daily sleep duration, n (%) | 62.48 | <0.001 * | |||
| ≥9 h | 43 (31.85) | 312 (40.21) | 322 (59.85) | ||
| ≤8 h | 92 (68.15) | 464 (59.79) | 216 (40.15) | ||
| Variable | Types of Breakfast Foods for All Students | |||
|---|---|---|---|---|
| 2 ≤ Types ≤ 4 | Types ≥ 5 | |||
| OR (95%CI) | AOR * ( 95%CI) | OR (95%CI) | AOR * (95%CI) | |
| Nutrition knowledge score | 0.917 (0.86–0.978) | 0.917 (0.859–0.979) | 0.855 (0.798–0.916) | 0.854 (0.796–0.915) |
| Nutritional attitude | ||||
| Attitude towards non-preferred foods | ||||
| Willing to try most of the time | 1.589 (0.743–3.397) | 1.592 (0.734–3.451) | 2.365 (1.004–5.569) | 2.476 (1.038–5.905) |
| Willing to try occasionally | 1.499 (0.760–2.956) | 1.440 (0.720–2.883) | 1.989 (0.906–4.365) | 1.974 (0.888–4.390) |
| Always unwilling to try | Ref. | Ref. | Ref. | Ref. |
| p-trend | 0.561 | 0.516 | 0.147 | 0.121 |
| Attitude towards participating in dietary activities | ||||
| Interested | 1.055 (0.414–2.691) | 1.023 (0.392–2.669) | 1.418 (0.502–4.004) | 1.231 (0.424–3.573) |
| Neutral | 0.568 (0.244–1.320) | 0.578 (0.243–1.375) | 0.547 (0.211–1.418) | 0.510 (0.192–1.360) |
| Uninterested | Ref. | Ref. | Ref. | Ref. |
| p-trend | 0.230 | 0.209 | 0.024 | 0.030 |
| Expectation of nutritional adequacy | ||||
| Yes | 0.863 (0.408–1.825) | 0.823 (0.381–1.775) | 0.831 (0.357–1.933) | 0.835 (0.351–1.986) |
| Indifferent | 1.083 (0.519–2.260) | 1.044 (0.496–2.197) | 1.068 (0.457–2.496) | 0.996 (0.422–2.349) |
| No | Ref. | Ref. | Ref. | Ref. |
| p-trend | 0.682 | 0.632 | 0.687 | 0.693 |
| Attitude towards changing unhealthy eating habits | ||||
| Yes | 1.054 (0.505–2.199) | 1.104 (0.522–2.335) | 1.022 (0.457–2.283) | 1.065 (0.469–2.417) |
| Indifferent | 0.630 (0.321–1.234) | 0.661 (0.335–1.304) | 0.612 (0.285–1.316) | 0.663 (0.306–1.437) |
| No | Ref. | Ref. | Ref. | Ref. |
| p-trend | 0.642 | 0.655 | 0.650 | 0.621 |
| Satisfaction with body shape | ||||
| Satisfied | 1.100 (0.529–2.289) | 1.019 (0.481–2.158) | 0.900 (0.417–1.943) | 0.823 (0.374–1.811) |
| Neutral | 1.371 (0.623–3.020) | 1.256 (0.559–2.821) | 1.071 (0.467–2.460) | 0.923 (0.393–2.165) |
| Unsatisfied | Ref. | Ref. | Ref. | Ref. |
| p-trend | 0.852 | 0.902 | 0.659 | 0.741 |
| Nutritional practice (over the past week) | ||||
| Choice of thirst-quenching drinks | ||||
| Water | 1.361 (0.804–2.306) | 1.385 (0.809–2.372) | 1.182 (0.662–2.110) | 1.206 (0.667–2.179) |
| Others (Tea, sugared beverages, milk, etc.) | Ref. | Ref. | Ref. | Ref. |
| Daily water intake | ||||
| ≥1100 mL/d | 1.287 (0.788–2.100) | 1.252 (0.763–2.054) | 1.958 (1.167–3.286) | 1.971 (1.168–3.327) |
| <1100 mL/d | Ref. | Ref. | Ref. | Ref. |
| Milk consumption | ||||
| ≥1 bottle/d | 0.742 (0.462–1.190) | 0.709 (0.439–1.146) | 0.911 (0.544–1.526) | 0.852 (0.505–1.436) |
| <1 bottle/d | Ref. | Ref. | Ref. | Ref. |
| Egg consumption | ||||
| ≥1 per day | 0.946 (0.528–1.695) | 0.908 (0.504–1.636) | 1.426 (0.779–2.609) | 1.474 (0.801–2.710) |
| <1 per day | Ref. | Ref. | Ref. | Ref. |
| Staple food consumption | ||||
| 4–7 times/w | 0.862 (0.536–1.386) | 0.857 (0.530–1.385) | 0.497 (0.294–0.838) | 0.515 (0.303–0.875) |
| 1–3 times/w | Ref. | Ref. | Ref. | Ref. |
| Meat consumption | ||||
| 4–7 times/w | 0.585 (0.362–0.945) | 0.607 (0.373–0.985) | 0.535 (0.314–0.913) | 0.529 (0.308–0.909) |
| 1–3 times/w | Ref. | Ref. | Ref. | Ref. |
| Bean products consumption | ||||
| 4–7 times/w | 0.971 (0.573–1.645) | 0.948 (0.557–1.614) | 1.100 (0.63–1.921) | 1.026 (0.584–1.801) |
| 1–3 times/w | Ref. | Ref. | Ref. | Ref. |
| Fruit consumption | ||||
| ≥400 g/d | 1.211 (0.618–2.373) | 1.215 (0.616–2.398) | 1.858 (0.886–3.898) | 1.827 (0.862–3.869) |
| 200–400 g/d | 1.121 (0.658–1.910) | 1.119 (0.652–1.918) | 1.620 (0.876–2.993) | 1.700 (0.913–3.167) |
| <200 g/d | Ref. | Ref. | Ref. | Ref. |
| Nut consumption | ||||
| ≥3 times/w | 1.801 (0.923–3.517) | 1.755 (0.891–3.458) | 3.038 (1.428–6.464) | 2.879 (1.341–6.181) |
| 1–2 times/w | 1.091 (0.634–1.879) | 1.098 (0.633–1.904) | 2.016 (1.061–3.831) | 2.031 (1.061–3.891) |
| Never | Ref. | Ref. | Ref. | Ref. |
| p-trend | 0.067 | 0.081 | 0.012 | 0.018 |
| Vegetable consumption | ||||
| ≥5 types/d | 1.331 (0.715–2.478) | 1.328 (0.706–2.497) | 1.298 (0.653–2.579) | 1.272 (0.634–2.553) |
| 3–4 types/d | 1.487 (0.849–2.602) | 1.486 (0.839–2.632) | 1.669 (0.888–3.139) | 1.700 (0.895–3.229) |
| 1–2 types/d | Ref. | Ref. | Ref. | Ref. |
| p-trend | 0.574 | 0.624 | 0.867 | 0.976 |
| Sugared beverage consumption | ||||
| ≤2 times/w | 1.881 (1.014–3.489) | 1.766 (0.940–3.317) | 2.044 (1.034–4.040) | 1.822 (0.910–3.647) |
| ≥3 times/w | Ref. | Ref. | Ref. | Ref. |
| Western fast food consumption | ||||
| ≤2 times/w | 1.619 (0.731–3.585) | 1.487 (0.660–3.354) | 1.188 (0.495–2.852) | 1.114 (0.455–2.724) |
| ≥3 times/w | Ref. | Ref. | Ref. | Ref. |
| High-calorie snack consumption | ||||
| ≤2 times/w | 0.909 (0.530–1.556) | 0.938 (0.544–1.616) | 1.168 (0.652–2.094) | 1.201 (0.666–2.166) |
| ≥3 times/w | Ref. | Ref. | Ref. | Ref. |
| Nighttime snack consumption | ||||
| ≤2 times/w | 0.710 (0.444–1.134) | 0.723 (0.450–1.163) | 0.894 (0.539–1.481) | 0.899 (0.539–1.499) |
| ≥3 times/w | Ref. | Ref. | Ref. | Ref. |
| Diet-related practice (over the past week) | ||||
| Help with food preparation | ||||
| Everyday | 0.767 (0.307–1.918) | 0.791 (0.312–2.001) | 1.225 (0.429–3.498) | 1.137 (0.394–3.283) |
| 3–6 times/w | 0.847 (0.348–2.060) | 0.886 (0.361–2.173) | 0.887 (0.316–2.488) | 0.835 (0.295–2.362) |
| 1–2 times/w | 0.732 (0.326–1.643) | 0.731 (0.323–1.657) | 0.788 (0.303–2.052) | 0.706 (0.269–1.856) |
| Never | Ref. | Ref. | Ref. | Ref. |
| p-trend | 0.749 | 0.753 | 0.259 | 0.252 |
| Types of dishes cooked | ||||
| ≥3 types | 2.568 (1.138–5.795) | 2.301 (1.001–5.292) | 3.917 (1.467–10.458) | 3.775 (1.389–10.258) |
| 1–2 types | 1.323 (0.610–2.871) | 1.263 (0.573–2.784) | 1.751 (0.675–4.547) | 1.741 (0.661–4.588) |
| None | Ref. | Ref. | Ref. | Ref. |
| p-trend | 0.001 | 0.003 | <0.001 | <0.001 |
| Cooking frequency | ||||
| Everyday | 0.603 (0.235–1.547) | 0.632 (0.243–1.642) | 0.537 (0.183–1.582) | 0.615 (0.206–1.837) |
| 3–6 times/w | 0.539 (0.217–1.340) | 0.561 (0.222–1.417) | 0.619 (0.219–1.752) | 0.768 (0.266–2.213) |
| 1–2 times/w | 1.033 (0.467–2.287) | 1.024 (0.457–2.296) | 1.041 (0.411–2.636) | 1.127 (0.439–2.889) |
| Never | Ref. | Ref. | Ref. | Ref. |
| p-trend | 0.052 | 0.087 | 0.048 | 0.076 |
| Checking expiration dates | ||||
| Always | 1.946 (0.972–3.897) | 2.054 (1.017–4.148) | 2.118 (0.931–4.820) | 2.145 (0.935–4.919) |
| Occasionally | 1.560 (0.757–3.213) | 1.603 (0.770–3.336) | 1.674 (0.707–3.968) | 1.724 (0.721–4.120) |
| Never | Ref. | Ref. | Ref. | Ref. |
| p-trend | 0.080 | 0.059 | 0.089 | 0.068 |
| Physical activity (over the past week) | ||||
| Vigorous physical activity | ||||
| Everyday | 0.673 (0.375–1.208) | 0.644 (0.353–1.173) | 0.947 (0.497–1.806) | 0.893 (0.460–1.731) |
| 4–6 days | 1.221 (0.696–2.143) | 1.234 (0.696–2.187) | 1.346 (0.715–2.534) | 1.266 (0.664–2.414) |
| 1–3 days & Never | Ref. | Ref. | Ref. | Ref. |
| p-trend | 0.507 | 0.479 | 0.629 | 0.639 |
| Daily physical activity | ||||
| ≥2 h | 1.944 (0.916–4.125) | 1.955 (0.915–4.180) | 2.777 (1.241–6.212) | 2.799 (1.240–6.321) |
| 1–2 h | 1.050 (0.614–1.794) | 1.070 (0.622–1.841) | 1.305 (0.714–2.387) | 1.298 (0.705–2.391) |
| ≤1 h | Ref. | Ref. | Ref. | Ref. |
| p-trend | 0.107 | 0.089 | 0.011 | 0.011 |
| Physical activity during recess | ||||
| Yes | 0.659 (0.422–1.028) | 0.675 (0.430–1.059) | 0.751 (0.466–1.211) | 0.774 (0.477–1.256) |
| No | Ref. | Ref. | Ref. | Ref. |
| Daily sleep duration | ||||
| ≥9 h | 1.063 (0.643–1.758) | 1.079 (0.649–1.793) | 1.477 (0.866–2.519) | 1.476 (0.860–2.532) |
| ≤8 h | Ref. | Ref. | Ref. | Ref. |
Disclaimer/Publisher’s Note: The statements, opinions and data contained in all publications are solely those of the individual author(s) and contributor(s) and not of MDPI and/or the editor(s). MDPI and/or the editor(s) disclaim responsibility for any injury to people or property resulting from any ideas, methods, instructions or products referred to in the content. |
© 2025 by the authors. Licensee MDPI, Basel, Switzerland. This article is an open access article distributed under the terms and conditions of the Creative Commons Attribution (CC BY) license (https://creativecommons.org/licenses/by/4.0/).
Share and Cite
Zhou, S.; Zhao, H.; Xiao, Y.; Li, J.; Huang, Q.; Zhang, Y.; Guo, F.; Xu, B.; Zou, H.; Huang, X.; et al. Association of Breakfast Food Types with Dietary Knowledge, Attitudes, and Practices Among School-Aged Children. Nutrients 2025, 17, 2424. https://doi.org/10.3390/nu17152424
Zhou S, Zhao H, Xiao Y, Li J, Huang Q, Zhang Y, Guo F, Xu B, Zou H, Huang X, et al. Association of Breakfast Food Types with Dietary Knowledge, Attitudes, and Practices Among School-Aged Children. Nutrients. 2025; 17(15):2424. https://doi.org/10.3390/nu17152424
Chicago/Turabian StyleZhou, Siyao, Hanqing Zhao, Yu Xiao, Jie Li, Qiaoli Huang, Yufang Zhang, Fengfeng Guo, Beibei Xu, Haoyan Zou, Xiaoxia Huang, and et al. 2025. "Association of Breakfast Food Types with Dietary Knowledge, Attitudes, and Practices Among School-Aged Children" Nutrients 17, no. 15: 2424. https://doi.org/10.3390/nu17152424
APA StyleZhou, S., Zhao, H., Xiao, Y., Li, J., Huang, Q., Zhang, Y., Guo, F., Xu, B., Zou, H., Huang, X., Huang, S., & Wang, L. (2025). Association of Breakfast Food Types with Dietary Knowledge, Attitudes, and Practices Among School-Aged Children. Nutrients, 17(15), 2424. https://doi.org/10.3390/nu17152424