1. Introduction
Soccer is an intermittent sport involving repeated high-intensity efforts interspersed with low-intensity activities [
1,
2]. Recent developments in women’s soccer, including its increased visibility and professionalization, have led to greater physical demands on players [
3,
4,
5]. Consequently, the pre-season preparation period has become essential in developing the fitness required to sustain high training loads and match intensities throughout the competitive season and during tournaments [
6,
7,
8].
Athletes, including female soccer players, frequently use dietary supplements to support training adaptations and competitive performance, with NO precursors ranking among the most widely marketed and accessible supplement groups [
9]. NO is a signaling molecule involved in numerous physiological functions, including vasodilatation, mitochondrial respiration and biogenesis, angiogenesis, muscle glucose uptake, and sarcoplasmic reticulum calcium handling [
10,
11,
12]. Through these mechanisms, NO has been linked to enhanced muscle efficiency [
13,
14], reduced oxygen demand during exercise, and improved neuromuscular recovery [
15], making it a potential target for performance optimization.
The human body generates NO through two complementary pathways [
16]. The first is the citrulline-arginine-NO pathway, in which NO is synthesized endogenously from L-arginine and oxygen through nitric oxide synthase (NOS) enzymes, producing L-citrulline as a byproduct [
17]. This process is commonly referred to as the NOS-dependent pathway.
The second pathway is partially exogenous, as it relies on NO
3− and NO
2− obtained from both endogenous NO oxidation [
18] and dietary sources rich in NO
3− [
16] such as spinach, beets, and arugula [
19]. A portion of the ingested NO
3− accumulates in saliva and is then reduced to NO
2− by bacteria in the oral cavity [
20,
21,
22]. Subsequent ingestion of this NO
2− results in the reduction of a portion of it to NO within the acidic environment of the stomach [
23], with the remainder entering the systemic circulation. This NO
2− is rapidly distributed in blood and other tissues, including peripheral vasculature and skeletal muscle [
18], and can readily undergo a one-electron reduction to yield NO [
9]. This reaction is enhanced under conditions of hypoxia [
24] and acidity [
25] such as those observed in skeletal muscle during contraction [
26]. This route is known as the NO
3− -NO
2− -NO pathway or the NOS-independent pathway.
Given these pathways, it has been suggested that combining different NO precursors, such as dietary NO
3− and citrulline, may further enhance its bioavailability [
27]. L-citrulline could support the NOS-dependent pathway by increasing L-arginine availability [
28,
29], while dietary NO
3− could contribute to the NOS-independent route by providing additional substrate for NO synthesis [
18,
30].
In this context, L-citrulline is commonly supplemented in the form of CM [
31], a compound that consists of L-citrulline in combination with malic acid, an intermediate of the tricarboxylic acid cycle [
32,
33]. In addition to supporting NO synthesis, CM may contribute to enhanced ATP production and improved ammonia clearance, which could be particularly beneficial during repeated high-intensity efforts [
34,
35]. These mechanisms are particularly relevant in team sports such as soccer, which involve frequent explosive actions interspersed with short recovery periods [
36] and constant alternation between anaerobic [
37,
38] and aerobic [
39,
40] energy systems.
Dietary NO
3− supplementation has been associated with performance improvements in endurance, muscular endurance, and high-intensity power output, as reported in a recent umbrella review summarizing 20 systematic reviews and meta-analyses [
41].
These effects are thought to be mediated by NO–related physiological adaptations [
10,
11,
12,
13,
14]. However, methodological variability and limited representation of female athletes highlight the need for further research in applied sport contexts [
41,
42,
43,
44].
In recent years, it has been suggested that type II muscle fibers—primarily recruited during explosive and high-intensity efforts [
26]—may serve as NO
3− reservoirs, promoting localized NO production under hypoxic and acidic conditions and contributing to intramuscular buffering [
45,
46]. These observations support the hypothesis that skeletal muscle functions as a physiological NO
3− reservoir sensitive to dietary intake. Animal studies have shown that NO
3− depletion reduces intramuscular stores, while reintroduction leads to rapid recovery and even supraphysiological accumulation, suggesting a potential adaptive mechanism that may reinforce the rationale for chronic supplementation strategies [
47]. Regarding the mode of administration, beetroot juice has been the most extensively studied source of inorganic NO
3− [
48]. However, alternative dietary sources, such as amaranth, have gained attention in recent years as potential alternatives, although research on them remains limited [
49,
50,
51].
Due to the physiological complementarity of CM and dietary NO
3−, their combined use may offer a practical strategy to support performance and recovery by targeting distinct NO synthesis pathways. Although several studies have examined their effects separately [
31,
33,
35,
41,
52,
53], to our knowledge, no study has investigated their co-supplementation. This is the first study to evaluate the combined effects of CM and dietary NO
3− under a chronic supplementation protocol in professional soccer players. Exploring this strategy during pre-season may provide valuable insight into approaches aimed at attenuating fatigue, sustaining performance, and optimizing recovery in applied sport-specific settings.
The primary aim of this study is to examine whether chronic supplementation with 500 mg of NO3− from amaranth extract and 8 g of CM over four weeks during pre-season influences external load and post-match recovery in professional female soccer players. We hypothesize that combined supplementation with CM and NO3− may help attenuate performance decline and support recovery during pre-season.
3. Results and Discussion
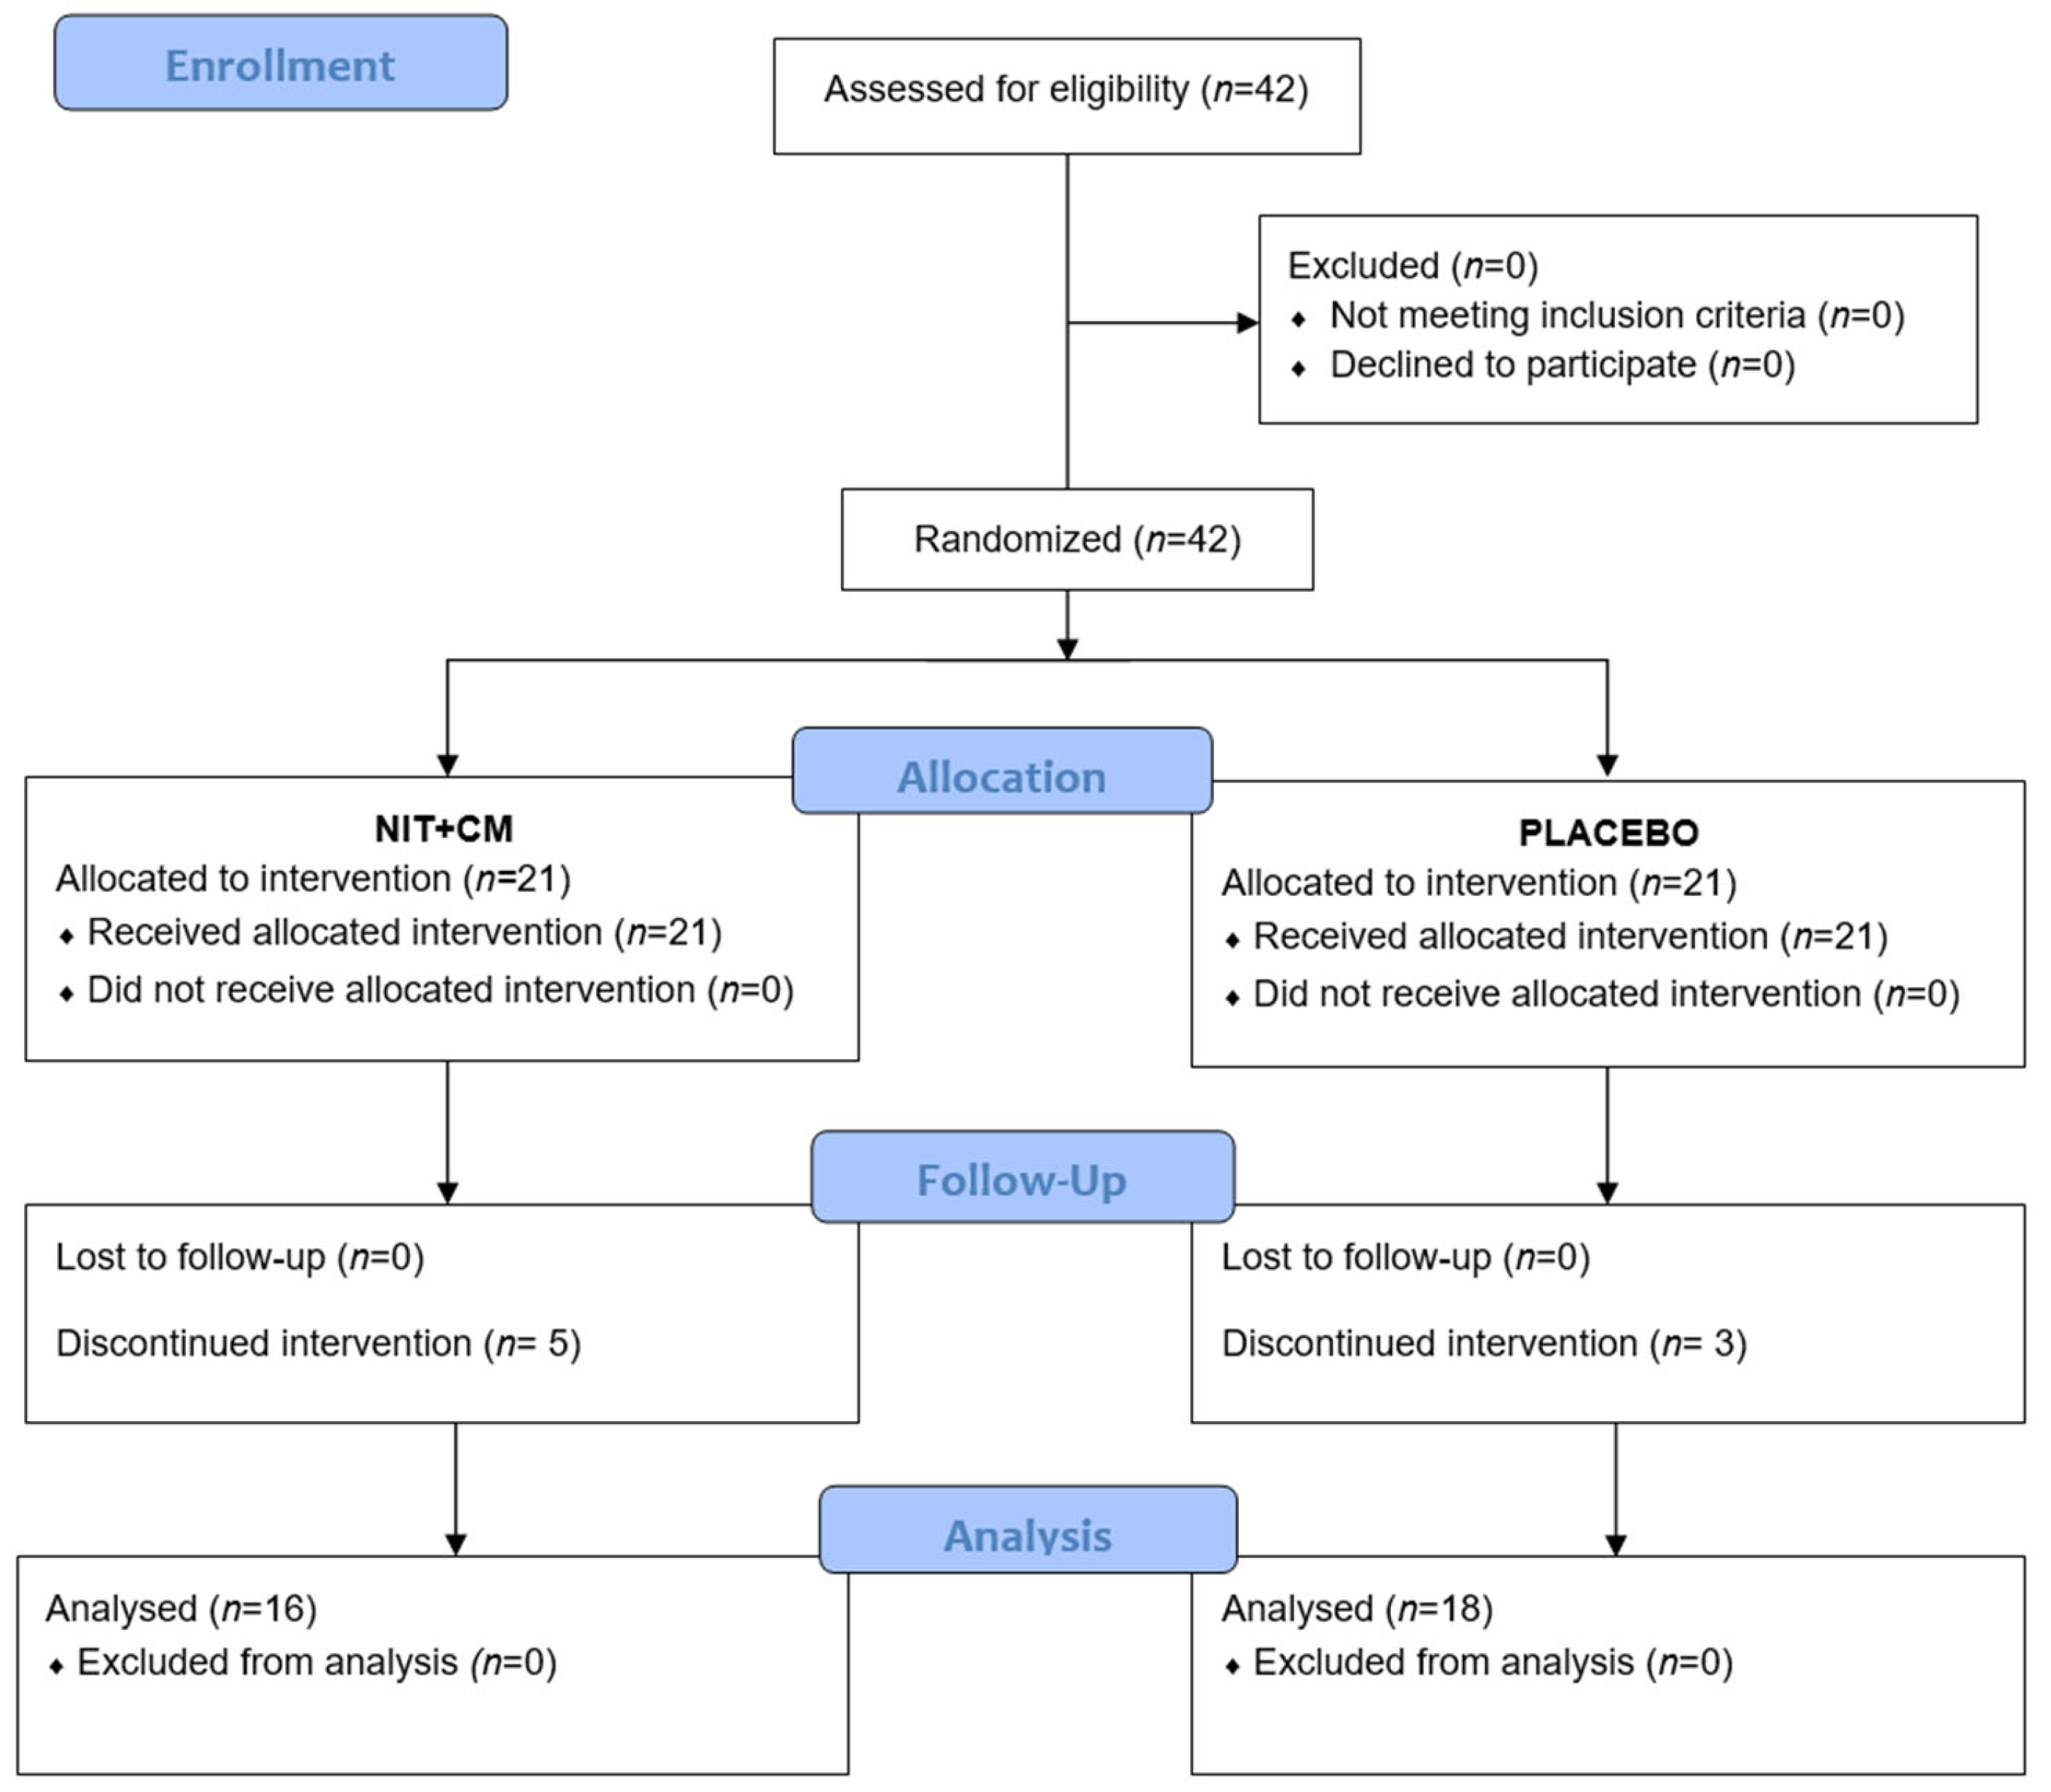
A total of 42 professional female soccer players were enrolled in the study. All participants met the inclusion criteria and agreed to participate, so no exclusions were necessary. Players were randomly assigned to two equal groups (NIT + CM and placebo,
n = 21 each). During the intervention period, five players in the NIT + CM group and three in the placebo group discontinued participation. In total, 34 players completed the study and were included in the final analysis (NIT + CM:
n = 16; PLA:
n = 18). A flow chart illustrating participant progression is presented in
Figure 1.
The demographic characteristics of the players are displayed in
Table 1. The anthropometric measurements and body composition of the players are available in detail in a previous publication by our research team [
67].
To the best of our knowledge, this is the first study to assess the chronic effects of combined CM and NO3− supplementation in professional soccer players. As this combination has been largely unexplored in the literature, investigating its potential effects under real-world training conditions may provide relevant insight for performance and recovery strategies.
GPS-derived data from training sessions were used to assess player performance, evaluate changes throughout pre-season, and explore potential differences between the NIT + CM supplementation group and the placebo group. The interaction between the type of product (NIT + CM vs. PLA) and time (the different weeks of the study) was not statistically significant for any of the variables analyzed. This indicates that the changes observed over the course of the weeks were similar in both groups, with no differences attributable to the product administered.
Table 2 summarizes ANOVA results, while
Table 3 presents weekly descriptive values by group and the entire sample.
Vmax showed significant main effects for both product and week. The product factor had a large effect size (p < 0.001; η2p = 0.351), with post hoc analysis confirming that values were consistently higher in the NIT + CM group compared to placebo throughout pre-season period. The week factor also had a large effect size (p < 0.001; η2p = 0.160), although smaller compared to the product factor. Post hoc tests for the week factor indicated progressive improvements from week 1 to weeks 3 and 4, and from week 2 to weeks 3 and 4 (all p < 0.001), peaking in week 4. Weekly comparisons using independent t-tests revealed that the NIT + CM group consistently reached higher maximum speeds than the placebo group throughout the pre-season period (all p < 0.001), indicating a stable between-group difference across the measured weeks.
Although previous studies on the chronic effects of NO precursor supplementation on Vmax in elite female soccer players are limited, some findings from team-sport athletes in sprint-related protocols provide indirect support. Improvements in cycling sprint performance have been reported following 5 to 7 days of beetroot juice supplementation (8.2–12.8 mmol NO
3−/day), with increases in mean power [
68] and total work [
69]. Enhanced sprint times have also been observed in running-based tests under similar protocols [
70]. These data suggest a potential benefit of NO
3− for explosive efforts, particularly following repeated-day administration [
71].
From a physiological perspective, these effects may be mediated by the increased NO availability. Elevated NO levels have been associated with enhanced calcium handling, improved excitation–contraction coupling, and increased recruitment of type II muscle fibers [
9,
16], all of which are closely involved in generating Vmax in soccer [
72,
73]. High-speed running demands rapid activation of the posterior chain and strong neuromuscular coordination under fatigue [
74,
75], which could benefit from improved contractile efficiency and reduced ATP cost. Furthermore, the NO-induced increases in muscle perfusion and mitochondrial efficiency [
76] could support the maintenance of sprinting capacity during consecutive sessions, particularly under high training loads. The malate component may further contribute by enhancing the rate of ATP production during high-intensity efforts [
35].
Although our intervention combined NO
3− and CM, previous evidence suggests that CM alone may contribute to sprint performance. In a study, three days of CM supplementation (8 g/day) improved repeated sprint performance in male team sport athletes, with faster sprint times and reduced fatigue [
77].
Taken together, the consistently higher Vmax values in the NIT + CM group, along with a larger effect size for the product than for the training week, may reflect a beneficial neuromuscular adaptation in response to NO precursor supplementation. Nevertheless, given the observational nature of the study and the multifactorial determinants of sprint performance, these findings should be interpreted with caution.
Regarding baseline performance, the mean Vmax recorded during the pre-season training period was 26.79 ± 4.45 km/h. Although direct comparisons must be interpreted cautiously due to methodological differences and seasonal context, it is worth noting that this value exceeds the average reported in Spanish professional female players during a four-week in-season training period (23.55 ± 1.30) [
78]. This difference may be partially explained by the fact that pre-season training sessions are typically more demanding and focused on accumulating higher training loads compared to in-season microcycles, which prioritize recovery and match preparation [
79].
As for distance covered per minute, this variable showed a significant main effect for product (p < 0.001), with a small effect size (η2p = 0.035). Post hoc analyses revealed consistently higher overall values in the NIT + CM group. The effect of the training weeks was close to statistical significance (p = 0.053) and showed a small effect size (η2p = 0.025). Post hoc analysis for the week factor showed a significant improvement from week 1 to week 3 (p = 0.009). Independent weekly t-tests revealed significantly higher values in the NIT + CM group only in weeks 1 (p < 0.001) and 3 (p = 0.029).
Considering all findings, it may indicate a modest but consistent advantage for the NIT + CM group in sustaining work rate during training. This effect is likely to involve mechanisms similar to those proposed for Vmax, such as enhanced muscle efficiency, improved blood flow, and increased ATP production through higher NO availability. Further studies under controlled conditions are needed to clarify the physiological relevance of this finding and its potential impact on training outcomes.
The overall mean distance per minute was 70.66 ± 22.72 m/min. Similar to the findings for Vmax, this value is also higher than those reported in Spanish professional players during the in-season period (60.12 ± 10.31) [
78].
In addition, TD and walking distance showed significant main effects for the product. TD showed a moderate effect size (p < 0.001; η2p = 0.113), with the NIT + CM group presenting higher overall values compared to placebo. Additionally, a significant main effect was found for the week factor, although with a small effect size (p = 0.003; η2p = 0.029), with post hoc tests revealing significantly higher values in week 3 compared to week 2 (p = 0.006). Independent weekly t-tests confirmed consistently higher TD covered by the NIT + CM group compared to the placebo across all weeks (all p < 0.001).
Although a direct comparison cannot be made with distance covered during training, previous studies have reported increased TD in team-sport athletes during the Yo-Yo IR1 test following chronic NO
3− supplementation. These effects have been observed with protocols ranging from 2 to 6 days and doses between 4.1 and 12.9 mmol/day of NO
3− [
70,
80,
81]. While those findings come from controlled performance tests and did not involve CM, the present results appear to follow a similar trend, suggesting a potential improvement in locomotor output during physically demanding periods such as pre-season.
The overall mean TD was 5281.13 ± 1272.78 m across the pre-season period. In line with previous findings for Vmax and distance per minute, this value was also higher than that reported in Spanish professional players from the same reference study (4883.5 ± 780.49) [
78] but lower than the value reported in a study of Australian National League players during pre-season training (6646 ± 111) [
79].
Walking distance showed a moderate product effect size (p < 0.001; η2p = 0.133), consistently favoring the NIT + CM group throughout pre-season. There was no significant week effect, yet independent weekly t-tests indicated significantly higher walking distances in the NIT + CM group at weeks 1, 2, and 4 (p < 0.001) and week 3 (p = 0.004).
Therefore, the consistent advantage observed in both total and walking distances among players in the NIT + CM group may reflect greater fatigue tolerance and an enhanced capacity to remain active for extended periods during training. Rather than indicating reduced intensity, the accumulation of walking distance may suggest a more effective active recovery process, allowing players to continue moving without the need for complete passive rest [
82,
83,
84]. Considering the moderate effect sizes observed for the product factor and the consistent differences between groups, these findings support the hypothesis that NIT + CM supplementation could have contributed to a more favorable physiological response under sustained pre-season training demands. Nevertheless, these interpretations should be approached with caution, as the observational nature of the study precludes any inference of causality.
Physiologically, increased NO availability may have enhanced peripheral blood flow during training [
85], improving oxygen and nutrient delivery while facilitating the clearance of metabolic byproducts [
86]. Moreover, the malate component has been proposed to reduce lactate production by promoting aerobic utilization of pyruvate, especially under high blood flow conditions [
35]. This combination may reflect a synergistic effect that supports sustained low-intensity activity and delays fatigue accumulation, potentially contributing to the greater total and walking distances observed in the NIT + CM group.
Moreover, jogging, HIR, and MIR distances exhibited significant main effects only for week, with no significant product effects. Specially, jogging distance presented a small effect size (p = 0.001; η2p = 0.034), with post hoc analysis showing fluctuations across weeks (higher in week 1 vs. week 2, p = 0.003; week 2 vs. week 3, p = 0.029). HIR distance displayed a moderate effect size (p < 0.001; η2p = 0.061), with a significant decrease from week 1 to week 2 (p < 0.001), followed by significant increases from week 2 to weeks 3 and 4 (both p ≤ 0.001). MIR distance showed a small effect size (p < 0.001; η2 = 0.059), with a progressive increase and significant increments from weeks 1 and 2 to weeks 3 and 4 (p ≤ 0.037).
Comparisons with previous studies are inherently limited by methodological differences, such as the velocity thresholds used in this analysis, which were defined by the GPS system and may not match those in other research. The variations observed in jogging, HIR, and MIR distances across the pre-season period likely reflect differences in the physical and tactical emphasis of each microcycle. Small effect sizes for jogging and MIR distances suggest minor week-to-week adjustments, while the moderate effect size for HIR may indicate a progressive increase in exposure to high-intensity efforts. These patterns are consistent with the natural variability of training content in professional soccer and the specific objectives set by the coaching staff each week [
87].
Finally, training duration showed a small but statistically significant product effect (p = 0.001; η2p = 0.013). Despite reaching statistical significance, the small effect size limits its practical interpretation and calls for cautious analysis.
Table 2.
Two-way ANOVA used to examine the effect of the product (NIT + CM vs. PLA) and the week on GPS-derived performance variables during pre-season training.
Table 2.
Two-way ANOVA used to examine the effect of the product (NIT + CM vs. PLA) and the week on GPS-derived performance variables during pre-season training.
| | Product | Week | Product × Week |
|---|
| Variable | p-Value | η2p | p-Value | η2p | p-Value | η2p |
|---|
| Time (min) | 0.001 * | 0.013 | 0.098 | 0.009 | 0.668 | 0.003 |
| Vmax (km/h) | <0.001 * | 0.351 | <0.001 * | 0.160 | 0.995 | 0.000 |
| TD (m) | <0.001 * | 0.113 | 0.003 * | 0.029 | 0.694 | 0.003 |
| Distance × minute | <0.001 * | 0.035 | 0.053 * | 0.025 | 0.789 | 0.002 |
| Walking (m) | <0.001 * | 0.133 | 0.902 | 0.003 | 0.480 | 0.005 |
| Jogging (m) | 0.194 | 0.007 | 0.001 * | 0.034 | 0.763 | 0.002 |
| HIR (m) | 0.507 | 0.000 | <0.001 * | 0.061 | 0.515 | 0.005 |
| MIR (m) | 0.082 | 0.003 | <0.001 * | 0.059 | 0.645 | 0.004 |
Table 3.
Descriptive statistics of GPS-derived training performance variables by group and week: mean and standard deviations (mean ± SD).
Table 3.
Descriptive statistics of GPS-derived training performance variables by group and week: mean and standard deviations (mean ± SD).
| Variable | Group | Total | Week 1 | Week 2 | Week 3 | Week 4 |
|---|
| Time (min) | NIT + CM | 81.71 ± 21.12 | 84.63 ± 20.67 | 82.00 ± 25.10 | 77.17 ± 19.41 | 82.64 ± 16.62 |
| Placebo | 76.62 ± 19.99 | 79.22 ± 22.01 | 74.28 ± 24.54 | 75.92 ± 16.74 | 77.85 ± 13.17 |
| All players | 78.82 ± 20.62 | 81.5 ± 21.52 | 77.77 ± 25.01 | 76.41 ± 17.75 | 80.05 ± 14.97 |
| Vmax (km/h) | NIT + CM | 29.63 ± 4.04 | 28.48 ± 3.21 * | 28.19 ± 4.33 * | 31.18 ± 4.06 * | 31.27 ± 3.23 * |
| Placebo | 24.62 ± 3.40 | 23.39 ± 2.83 | 23.06 ± 3.50 | 26.11 ± 2.89 | 26.35 ± 2.87 |
| All players | 26.79 ± 4.45 | 25.54 ± 3.91 | 25.38 ± 4.65 | 28.08 ± 4.19 | 28.61 ± 3.9 |
| TD (m) | NIT + CM | 5761.54 ± 1315.70 | 6001.50 ± 1580.04 * | 5521.58 ± 1336.87 * | 5961.62 ± 1175.81 * | 5686.26 ± 1090.62 * |
| Placebo | 4915.52 ± 1109.51 | 4949.58 ± 1297.76 | 4594.22 ± 1022.62 | 5213.75 ± 983.84 | 4971.47 ± 1058.21 |
| All players | 5281.13 ± 1272.78 | 5393.51 ± 1509.73 | 5014.03 ± 1259.41 | 5504.96 ± 1199.21 | 5293.35 ± 1265.53 |
| Distance × minute | NIT + CM | 75.26 ± 27.37 | 72.48 ± 15.20 * | 74.06 ± 30.13 | 83.51 ± 30.92 * | 72.19 ± 28.22 |
| Placebo | 67.15 ± 17.68 | 64.02 ± 12.65 | 67.49 ± 21.58 | 71.47 ± 18.48 | 64.99 ± 14.45 |
| All players | 70.66 ± 22.72 | 67.59 ± 14.35 | 70.46 ± 25.92 | 76.16 ± 24.68 | 68.29 ± 22.06 |
| Walking (m) | NIT + CM | 3735.42 ± 1068.13 | 3727.05 ± 1143.61 * | 3840.14 ± 1125.00 * | 3690.77 ± 1052.16 * | 3642.09 ± 945.23 * |
| Placebo | 2994.69 ± 788.09 | 2901.70 ± 828.61 | 2957.38 ± 837.43 | 3149.77 ± 777.51 | 2963.85 ± 677.06 |
| All players | 3314.80 ± 989.76 | 3250.01 ± 1052.04 | 3570.01 ± 1069.71 | 3604.43 ± 928.58 | 3274.97 ± 875.68 |
| Jogging (m) | NIT + CM | 1560.69 ± 780.93 | 1720.05 ± 700.95 | 1351.38 ± 826.37 | 1715.61 ± 863.55 | 1558.22 ± 658.11 |
| Placebo | 1462.65 ± 614.45 | 1580.24 ± 632.83 | 1317.36 ± 657.53 | 1505.78 ± 620.94 | 1486.10 ± 490.20 |
| All players | 1505.02 ± 692.27 | 1639.24 ± 662.9 | 1332.76 ± 736.33 | 1587.48 ± 728.67 | 1519.18 ± 571.71 |
| HIR (m) | NIT + CM | 435.17 ± 374.52 | 535.58 ± 372.81 | 313.75 ± 334.79 | 516.34 ± 434.05 | 434.07 ± 331.95 |
| Placebo | 433.16 ± 331.86 | 448.10 ± 290.91 | 304.37 ± 256.09 | 527.87 ± 407.23 | 483.25 ± 320.32 |
| All players | 434.03 ± 350.55 | 485.02 ± 329.21 | 308.62 ± 293.32 | 523.38 ± 415.99 | 460.69 ± 325.12 |
| MIR (m) | NIT + CM | 30.26 ± 58.93 | 18.83 ± 26.03 | 16.31 ± 37.62 | 38.90 ± 60.29 | 51.87 ± 89.14 |
| Placebo | 25.02 ± 38.75 | 19.54 ± 23.16 | 15.11 ± 24.83 | 30.33 ± 44.01 | 38.27 ± 54.22 |
| All players | 27.28 ± 48.52 | 19.24 ± 24.3 | 15.65 ± 31.17 | 33.67 ± 50.88 | 44.51 ± 72.32 |
GPS-derived data from match play were analyzed to evaluate performance changes throughout pre-season and to identify potential differences between the NIT + CM supplementation group and the placebo group.
Table 4 summarizes the ANOVA results, while
Table 5 presents weekly descriptive values by group and for the entire sample.
Vmax showed a significant interaction among product and training week (p = 0.022; η2p = 0.079, moderate effect size). Post hoc analysis within the NIT + CM group revealed progressive increases from week 1 to weeks 3 and 4 (both p < 0.001), as well as from week 2 to weeks 3 (p = 0.006) and 4 (p = 0.028). Additionally, significant main effects were observed for both product (p < 0.001; η2p = 0.413, large effect size) and week (p < 0.001; η2p = 0.253, large effect size). Post hoc analysis for the product factor indicated consistently higher overall Vmax values in the NIT + CM group compared to placebo. For the week factor, post hoc tests showed clear and significant increases from week 1 to weeks 3 and 4 (both p < 0.001), and from week 2 to weeks 3 (p = 0.021) and 4 (p = 0.003). Independent weekly t-tests further confirmed significantly higher Vmax values for the NIT + CM group in weeks 1, 3, and 4 (p < 0.001) and week 2 (p = 0.012).
From a physiological perspective, the influence of both the product and the training week on this variable appears to be substantial, with the effect of the product being particularly pronounced. In addition, a significant interaction between product and training week suggests that differences between the NIT + CM and placebo groups evolved over time, potentially reflecting an enhanced physiological response in the supplemented group as pre-season progressed. This hypothesis was further supported by consistently higher Vmax values in the NIT + CM group across all weeks, as confirmed by independent t-tests. While causality cannot be established due to the observational design, the magnitude and stability of the group differences, along with the significant interaction, are compatible with a potential neuromuscular benefit of NIT + CM supplementation.
Due to the physiological mechanisms of NO
3− and CM discussed earlier, the product-related advantage observed here may reflect improved sprint capacity under competitive load. However, interpreting these findings requires consideration of the complex and variable nature of match demands. In elite women’s soccer, performance metrics such as Vmax are influenced by several factors including physical readiness, tactical role, opponent characteristics [
88], and contextual factors such as match status or competition phase [
89]. While these variables introduce a degree of variability, Vmax appears to be relatively stable. According to a study on match load variability in elite female players, this metric displays low inter-match variability (CV ≈ 4.5%) compared to other high-intensity measures [
90], suggesting that changes are more likely to reflect genuine physiological adaptations rather than contextual fluctuations.
Moreover, the ability to express peak velocity in matches may be partially conditioned by the neuromuscular capacities developed during training. The consistent advantage observed in both training and match Vmax values among players in the NIT + CM group raises the hypothesis that enhanced high-speed performance during training could have facilitated a more robust translation of this ability into match contexts. Still, this interpretation must remain speculative and subject to the limitations inherent to non-experimental designs.
Descriptively, the overall mean Vmax observed during matches was 29.52 ± 4.26 km/h, which aligns with previous reports indicating that elite female players can reach peak speeds of approximately 30–32 km/h during match play [
91,
92]. In comparison, this value is slightly lower than the average Vmax reported in male professional players throughout the season (≈30.7 km/h), although most players tend to reach peak velocities between 32 and 33.9 km/h [
93]. Finally, compared to the average reported in Spanish female players during a four-week match period in the competitive season (25.3 ± 0.3), the value observed in the present study appears notably higher [
78]. Considering that all teams followed their usual training routines, this difference may reflect a potential influence of the supplementation strategy implemented.
Distance per minute showed a marginally significant interaction between product and match week (p = 0.052; η2p = 0.064, moderate effect size). Within-group analysis showed a significant increase from week 1 to week 4 in the NIT + CM group (p < 0.001). No significant main effect was found for the product factor; however, a significant main effect was observed for week (p < 0.001; η2p = 0.117, moderate effect size). Post hoc tests confirmed a clear improvement from week 1 to week 4 (p < 0.001). Independent t-tests revealed significantly higher values in the NIT + CM group at week 4 (p = 0.004).
The moderate main effect of training week on distance per minute, with significant increases from week 1 to week 4 across all players, suggests that the final pre-season match was played at a higher overall intensity. Although no main effect was found for the product factor, the presence of an almost significant interaction between product and match week, combined with the descriptively progressive increase observed in the NIT + CM group, may point to a more favorable adjustment in this group over time. The fact that this culminated in significantly higher values for the supplemented group in week 4 may reflect a more favorable adjustment to competitive demands. This pattern aligns with the physiological mechanisms previously discussed and warrants further exploration in controlled settings.
Descriptively, the overall mean distance per minute observed during matches was 93.30 ± 44.39 m/min, which is slightly lower but comparable to the average reported in Spanish professional female players during a four-week in-season period (96.3 ± 8.8) [
78]. TD exhibited no significant effects for the product factor or the Product × Week interaction. However, a significant main effect for week was detected (
p = 0.033; η
2p = 0.079, moderate effect size), with increased values from week 1 to week 4 (
p = 0.007). Moreover, the overall mean TD covered during matches was 7545.4 ± 4653.78 m, which falls slightly below the average reported in a recent systematic review of professional female players, which indicated typical match demands ranging from 8800 to 10,800 m, with an observed range between 7800 and 11,200 m depending on competition level, position, and measurement protocols [
94,
95].
Although TD increased from week 1 to week 4, this pattern should be interpreted with caution. As seen with distance per minute, the last match of pre-season appears to have been the most intense, which may partially explain the observed increase. TD is also highly influenced by contextual factors such as tactical role, match dynamics, and playing position [
88], which are known to affect locomotor output during competition. The high standard deviation in this sample further highlights the large inter-individual and match-to-match variability, suggesting that the weekly differences may be more reflective of situational demands than systematic adaptations or product-related effects.
Regarding the distances covered at different velocity thresholds, no significant effects were found for the product factor or the Product × Week interaction in any of the four categories. However, independent t-tests revealed significantly higher walking distance in the NIT + CM group during week 4 (p = 0.026), which may reflect the elevated overall match intensity observed that week rather than a direct effect of the supplementation. Jogging distance displayed a significant main effect for week (p = 0.011; η2p = 0.095, moderate effect size), with post hoc tests revealing differences between week 1 and all subsequent weeks. Similarly, HIR showed a significant week effect (p = 0.002; η2p = 0.143, large effect size), again driven by differences between the first and later matches. MIR also followed this pattern, with a significant week effect (p = 0.021; η2p = 0.103, moderate effect size) and a trend toward higher values in week 3 compared to week 1 (p = 0.056).
Overall, the changes observed across matches suggest lower physical demands in the first game, followed by a relatively stable load in the remaining weeks. One isolated difference was found in HIR during week 1, with higher values in the placebo group (p = 0.006). However, the absence of consistent group effects and the high variability across players and contexts suggest that match-related situational factors were the main drivers of these fluctuations.
Table 4.
Two-way ANOVA used to examine the effect of the product (NIT + CM vs. PLA) and the week on GPS-derived performance variables during pre-season matches.
Table 4.
Two-way ANOVA used to examine the effect of the product (NIT + CM vs. PLA) and the week on GPS-derived performance variables during pre-season matches.
| | Product | Week | Product × Week |
|---|
| Variable | p-Value | η2p | p-Value | η2p | p-Value | η2p |
|---|
| Time (min) | 0.749 | 0.005 | 0.742 | 0.006 | 0.921 | 0.004 |
| Vmax (km/h) | <0.001 * | 0.413 | <0.001 * | 0.253 | 0.022 * | 0.079 |
| TD (m) | 0.325 | 0.023 | 0.033 * | 0.079 | 0.238 | 0.036 |
| Distance × minute | 0.160 | 0.002 | <0.001 * | 0.117 | 0.052 * | 0.064 |
| Walking (m) | 0.134 | 0.036 | 0.184 | 0.042 | 0.420 | 0.024 |
| Jogging (m) | 0.541 | 0.005 | 0.011 * | 0.095 | 0.279 | 0.032 |
| HIR (m) | 0.081 | 0.000 | 0.002 * | 0.143 | 0.277 | 0.033 |
| MIR (m) | 0.962 | 0.018 | 0.021 * | 0.103 | 0.501 | 0.020 |
Table 5.
Descriptive statistics of GPS-derived match performance variables by group and week: mean and standard deviations (mean ±SD).
Table 5.
Descriptive statistics of GPS-derived match performance variables by group and week: mean and standard deviations (mean ±SD).
| Variable | Group | Total | Week 1 | Week 2 | Week 3 | Week 4 |
|---|
| Time (min) | NIT + CM | 82.15 ± 31.30 | 80.73 ± 32.47 | 87.04 ± 32.16 | 76.21 ± 33.65 | 84.19 ± 29.48 |
| Placebo | 77.75 ± 30.29 | 75.20 ± 30.75 | 78.70 ± 31.38 | 78.45 ± 26.07 | 78.61 ± 35.99 |
| All players | 79.70 ± 30.70 | 77.69 ± 31.13 | 82.34 ± 31.49 | 77.54 ± 28.88 | 81.3 ± 32.55 |
| Vmax (km/h) | NIT + CM | 32.28 ± 4.26 | 29.22 ± 2.50 * | 30.65 ± 4.40 * | 35.03 ± 4.29 * | 34.42 ± 2.67 * |
| Placebo | 27.33 ± 2.73 | 25.69 ± 2.34 | 27.32 ± 2.60 | 27.44 ± 2.81 | 29.04 ± 2.27 |
| All players | 29.52 ± 4.26 | 27.29 ± 2.97 | 28.78 ± 3.83 | 30.52 ± 5.11 | 31.64 ± 3.66 |
| TD (m) | NIT + CM | 8296.85 ± 6216.69 | 5361.70 ± 3157.51 | 7895.66 ± 6448.85 | 8709.23 ± 7525.30 | 11,250.29 ± 6139.06 |
| Placebo | 6946.41 ± 2768.35 | 5985.29 ± 1852.95 | 7572.10 ± 2991.31 | 6879.60 ± 3240.47 | 7369.49 ± 2666.64 |
| All players | 7545.4 ± 4653.78 | 5703.67 ± 2500.19 | 7713.65 ± 4730.07 | 7622.89 ± 5371.41 | 9242.98 ± 4994.85 |
| Distance × minute | NIT + CM | 95.54 ± 62.48 | 64.63 ± 35.04 | 84.69 ± 59.72 | 98.79 ± 74.74 | 134.25 ± 58.98 * |
| Placebo | 91.51 ± 21.37 | 83.49 ± 14.72 | 97.39 ± 11.01 | 87.60 ± 31.49 | 98.52 ± 18.75 |
| All players | 93.30 ± 44.39 | 74.97 ± 27.18 | 91.83 ± 40.04 | 92.14 ± 52.62 | 115.79 ± 46.06 |
| Walking (m) | NIT + CM | 4864.74 ± 3825.86 | 3780.37 ± 2622.78 | 4536.51 ± 4256.96 | 4568.32 ± 4380.76 | 6552.60 ± 3680.61 * |
| Placebo | 3768.59 ± 1791.96 | 3609.23 ± 1628.64 | 3896.78 ± 1799.28 | 3592.53 ± 1939.08 | 4018.39 ± 1907.63 |
| All players | 4254.79 ± 2915.52 | 3686.52 ± 2098.34 | 4176.66 ± 3078.76 | 3988.95 ± 3138.33 | 5241.8 ± 3125.71 |
| Jogging (m) | NIT + CM | 2676.28 ± 2523.16 | 1282.38 ± 1091.75 | 2734.77 ± 2654.58 | 3169.10 ± 3001.26 | 3554.06 ± 2592.83 |
| Placebo | 2442.78 ± 1248.90 | 1821.92 ± 545.27 | 2957.51 ± 1459.65 | 2523.50 ± 1425.19 | 2426.49 ± 1104.39 |
| All players | 2546.35 ± 1915.95 | 1578.26 ± 865.78 | 2860.06 ± 2033.74 | 2785.78 ± 2184.02 | 2970.83 ± 2014.93 |
| HIR (m) | NIT + CM | 677.85 ± 680.38 | 271.70 ± 203.65 | 574.29 ± 401.43 | 856.78 ± 843.89 | 1021.42 ± 845.33 |
| Placebo | 680.40 ± 372.76 | 510.05 ± 235.67 * | 691.76 ± 294.60 | 685.19 ± 386.85 | 853.78 ± 494.13 |
| All players | 679.27 ± 529.0 | 402.41 ± 249.26 | 640.37 ± 344.49 | 754.9 ± 608.19 | 934.71 ± 679.06 |
| MIR (m) | NIT + CM | 77.98 ± 124.37 | 27.25 ± 31.02 | 50.09 ± 51.07 | 115.04 ± 155.63 | 122.20 ± 176.75 |
| Placebo | 54.64 ± 59.35 | 44.09 ± 38.02 | 26.05 ± 25.68 | 78.37 ± 84.35 | 70.84 ± 57.22 |
| All players | 64.99 ± 94.2 | 36.48 ± 35.5 | 36.57 ± 40.03 | 93.27 ± 117.65 | 95.64 ± 129.71 |
To assess post-match recovery, performance outcomes from the CMJ test and WAnT conducted on the first day of pre-season were compared with those obtained the day after a pre-season match. This second assessment took place after a four-week supplementation period, with the final dose consumed on match day. The aim was to determine which group showed better maintenance of performance—or, conversely, a smaller decline—under conditions of accumulated fatigue.
The CMJ pre-WAnT was used to assess anaerobic power and explosive strength under post-match conditions (
Table 6). None of the variables showed statistically significant differences between groups. However, the NIT + CM group showed slightly more stable values in jump height, CMJ
Pmean and CMJ
Ppeak, while the placebo group presented a small decline in both power metrics.
Although the differences were small and not significant, this pattern may suggest that the NIT + CM group recovered slightly better in terms of anaerobic performance.
The CMJ post-WAnT was used to evaluate neuromuscular fatigue and recovery capacity the day after the match. None of the variables showed statistically significant differences between groups (
Table 7).
Jump height increased slightly in both groups, with very similar values in the change from baseline to the final test. This suggests that explosive strength was not markedly affected by the intervention in either condition.
In contrast, CMJPmean and CMJPpeak values showed a slightly more favorable evolution in the NIT + CM group. Both groups improved from baseline, but the NIT + CM group showed a greater increase in power compared to the placebo group. Although these differences were not significant, the trend may point toward a better recovery of neuromuscular performance following high-intensity effort in the NIT + CM group.
As with the CMJ pre-WAnT, these results do not confirm a clear effect of the product but suggest a consistent pattern that warrants further exploration under similar post-match conditions.
The WAnT was used to evaluate anaerobic power and capacity under post-match conditions (
Table 8). Several variables showed significant differences between groups, indicating a better preservation of performance in the NIT + CM group. P
mean and P
min decreased in both groups, but the reduction was significantly smaller in the NIT + CM group. The decline in power across the 30 s effort was also consistently lower in the NIT + CM group, with significant differences in both the first and second half of the test.
Although Ppeak and FI (%) did not reach statistical significance, both followed the same pattern observed in other variables. TPpeak showed no relevant differences between groups.
These findings suggest that the NIT + CM product may have contributed to preserving anaerobic capacity under conditions of accumulated fatigue. In the context of female soccer, this finding becomes especially relevant, as a systematic review and meta-analysis [
96] has shown that high-intensity anaerobic performance, including sprint capacity, remains impaired for up to 48 h following a match. Supporting the ability to maintain anaerobic output the day after competition may therefore have practical implications for performance management during congested schedules or periods of high training load.
To complement the performance data, plasma concentrations of NO
3− and NO
2− were analyzed at baseline and again the day after the match (
Table 9). The NIT + CM group showed significant increases from baseline in both NO
3− (
p < 0.001) and NO
2− (
p = 0.008). At the final time point, NO
3− was significantly higher in the NIT + CM group compared to placebo (
p < 0.001), while no significant between-group difference was observed for NO
2−.
Importantly, plasma NO
3− concentrations in the NIT + CM group remained elevated the day after the final dose. This aligns with previous research showing that chronic supplementation leads to progressive increases in plasma NO
3−, and that concentrations remain above baseline even 24 h after the last intake. For instance, in a study with 19.5 mmol/day over 8 days, values rose from 37 ± 15 μM to 270 ± 182 μM one day after the final dose, indicating prolonged systemic exposure [
97]. Although absolute values are not directly comparable due to population and dose differences, this finding is consistent with the present observations using 8 mmol/day over four weeks.
Moreover, previous studies have shown that multi-day NO
3− intake results in higher plasma NO
3− compared to single bolus ingestion [
45], and that NO
2− responses are more closely associated with total NO
3− intake across the protocol than with daily intake alone [
12]. In the present analysis, NO
2− was the only biomarker that did not show a significant between-group difference at the final measurement, despite a significant increase from baseline in the NIT + CM group. This finding may be related to the markedly shorter plasma half-life of NO
2− compared to NO
3− [
98], which limits its persistence in circulation during the recovery phase. In addition, NO
2− may be buffered or stored within skeletal muscle tissue [
45], potentially reducing its detectability in plasma while still contributing to local NO availability. These mechanisms could help explain the absence of a significant difference between groups, even under conditions of elevated systemic NO
3− availability.


 ,
, 


