Review

The Complex Gene–Carbohydrate Interaction in Type 2 Diabetes: Between Current Knowledge and Future Perspectives

by
Francesca Gorini
* and
Alessandro Tonacci
Institute of Clinical Physiology, National Research Council, 56124 Pisa, Italy
*
Author to whom correspondence should be addressed.
Nutrients 2025, 17(14), 2350; https://doi.org/10.3390/nu17142350
Submission received: 24 June 2025 / Revised: 9 July 2025 / Accepted: 16 July 2025 / Published: 17 July 2025
(This article belongs to the Special Issue Advances in Gene–Diet Interactions and Human Health)

Abstract

Type 2 diabetes (T2D) represents a public health problem globally, with the highest prevalence reported among older adults. While an interplay of various determinants including genetic, epigenetic, environmental factors and unhealthy lifestyle, particularly diet, has been established to contribute to T2D development, emerging evidence supports the role of interactions between nutrients or dietary patterns and genes in the pathogenesis of this metabolic disorder. The amount, and especially the type of carbohydrates, in particular, have been correlated with the risk of non-communicable chronic disease and mortality. This narrative review aims to discuss the updated data on the complex and not fully elucidated relationship between carbohydrate–gene interactions and incidence of T2D, identifying the most susceptible genes able to modulate the dual association between carbohydrate intake and risk of developing T2D. The identification of genetic polymorphisms in response to this macronutrient represents a potentially powerful target to estimate individual risk and prevent the development of T2D in the context of personalized medicine. The postulation around novel foods potentially tailored to minimize the risks of developing T2D will pave the way for a new era into food research in relation to the safeguarding of well-being status in patients affected by, or at risk for, T2D.

1. Introduction

Diabetes, a chronic and serious condition resulting from the lack of production or inefficient use of insulin, is a major cause of morbidity and mortality and one of the fastest growing global health emergencies of the 21st century [1,2,3]. Among the different types of diabetes, type 2 diabetes (T2D) is characterized by hyperglycemia due to the progressive loss of adequate insulin production by pancreatic beta cells and it frequently occurs in the setting of insulin resistance in several tissues (e.g., adipose tissue, liver, skeletal muscles) and metabolic syndrome (MetS) [4]. T2D accounts for over 90% of diabetes cases worldwide, with an estimated prevalence of 462 million individuals affected (corresponding to 6.28% of the world population) and over 1 million deaths in 2017, making this condition the ninth leading cause of mortality [5,6]. The 2021 IDF Diabetes Atlas, which periodically produces prevalence estimates and future projections for diabetes, predicted that 643 million people (11.3% of the global population) will have diabetes by 2030 and 783 million people (12.2%) by 2045 [3]. A recent pooled analysis of 1108 population-representative studies, with a total of 141 million participants, reported a global age-standardized diabetes prevalence of 13.9% for women and 14.3% for men, with an estimated 828 million adult individuals with diabetes in 2022, an overall global increase of 630 million from 1990 [7]. In particular, the largest increases were recorded in low- and middle-income countries due to the almost total lack of treatment and inadequate primary prevention programs [7], highlighting the importance of disease prevention and personalization of care within a “p4 medicine” framework. The hyperglycemia in T2D patients can induce damage to various organs and tissues, in particular the kidneys, eyes, nerves, and circulatory system, leading to an increased risk of kidney failure, vision loss, cardiovascular, cerebrovascular, and other peripheral vascular diseases, and a two-fold excess risk of death from any cause compared to controls [6,8,9,10].
Overall, T2D is a complex disorder resulting from the interaction of anthropological factors including age, small or large birth weight, body mass index, and environmental factors such as sedentary lifestyle, high-calorie diets, obesity, environmental pollutants with genetic component, epigenetic modifications, gut microbiota, and organelle stress [11,12,13]. Indeed, although T2D is characterized by a strong genetic basis, with inheritance estimated between 20% and 80%, the approximately 700 genetic variants identified by genome-wide association studies (GWAS), half of which were discovered in the past three years, related to beta cell function, insulin secretion, and insulin resistance, account for almost 20% of the hereditability of the disease, clearly indicating the substantial contribution of other determinants to the disease’s development [12,13,14,15]. In particular, over the last two decades, gene–diet and dietary pattern interactions have emerged as key players in the pathophysiology of T2D. Nutrigenomics (the investigation of the effects of diet on gene expression) and nutrigenetics (the study of the impact of genetic variation on biological responses, particularly metabolic status, to dietary intake), both fields linked to advances in omics technologies, have been identified as research foundations for both personalized nutrition and precision healthcare for chronic non-communicable diseases such as T2D [12,16,17,18]. Prospective studies have provided suggestive insights into gene–diet interactions in relation to T2D, in the setting of the general pattern of gene–environment interactions, resulting in a synergistic or antagonistic effect on outcome that is greater or less than the sum or product of individual exposures [19,20]. At the same time, the high adherence to a healthy diet or, conversely, to a dietary pattern characterized by low amounts of antioxidants may reduce or increase the risk of T2D, respectively [21,22]. Furthermore, nutritional epigenetics, i.e., the study of molecular processes modulating gene expression affecting the genome sequence, induced by bioactive dietary components, represents a further novel field of study of the impact of nutrition on the risk of T2D and can potentially explain an individual’s susceptibility to develop the disease [23,24].
Carbohydrates, the most abundant molecules in nature and key sources for energy production and signaling pathways, have been associated with both a reduced and increased risk of T2D although high levels of intake have been recognized as closely related to the development of chronic metabolic diseases [25,26,27]. In fact, non-digestible forms of carbohydrates contain fiber, with beneficial effects on overall metabolic health including insulin sensitivity; on the other hand, an excess of mono- and disaccharides, typical of Western diets, shortens lifespan, contributing to an increased risk of chronic diseases such as obesity, T2D, metabolic syndrome, and non-alcoholic fatty liver disease [25,28].
Therefore, this critical review aimed to summarize the up-to-date evidence on the associations between carbohydrate intake and T2D risk, discuss the strengths and limitations of findings on the complex interaction between carbohydrate intake and the major genetic determinants in T2D and how epigenetic alterations may potentially modulate these relationships, and also propose future interventions such as the use of functional foods as a prevention and treatment strategy for T2D.

2. Genetics of Type 2 Diabetes

While the risk of T2D has been established to depend on both genetic and environmental causes, knowledge on the genetic basis for T2D is still incomplete [29,30]. Furthermore, unlike type 1 diabetes, the genetic risk of T2D is not concentrated in a single region and is otherwise the result of interactions between multiple genes scattered throughout the genome [11]. Based on large population-based studies, heritability (the degree to which genetic differences contribute to the number of phenotypic variations in a trait or disease) for T2D has been estimated at 20–80%, with great variability between populations possibly due to differences in age ranges, regions and ethnicities [30,31]. In particular, the risk of a child developing T2D in the case of an affected parent increases by 3 times compared to the general population and up to 6 times if both parents are affected by T2D, compared to subjects without a positive family history of the disease [32,33]. Likewise, a singleton sibling of an affected sibling has an approximately 3-fold increased risk of T2D, and the risk increased to more than 30-fold when the affected first-degree relatives were two or more siblings and one parent [34]. Higher concordance rates in monozygotic than in dizygotic twins further support the significant genetic component in T2D [35]. Conversely, no significant difference in genetic risk between males and females has been observed recently [30].
Over the last three decades, advances in sequencing and genotyping techniques have paved the way to linkage analyses (the primary method used in the second half of the 20th century to map genetic loci with familial aggregation [36,37]), which have allowed for the identification of the gene encoding the transcription factor 7-like 2 (TCF7L2), considered to be the most potent locus for T2D risk [38]. Subsequent candidate gene studies (based on an approach assessing the association between an allele or a group of alleles of a gene potentially involved in a disease and the disease itself [39]) then led to the hypothesis that the peroxisome proliferator-activated receptor gamma (PPAR-γ) may represent a predisposing factor for obesity and insulin resistance [38,40,41]. Although relatively successful in identifying rare variants in single-gene disorders, linkage analyses are less effective in detecting genes that are involved in polygenic disease such as T2D [11]. On the other hand, most genes identified in candidate gene studies, despite their involvement in glucose and lipid metabolism and insulin secretion and signaling, do not appear to be associated with T2D [11]. The advent of GWAS has made it possible to genotype hundreds of thousands to millions of markers, generally single-nucleotide polymorphisms (SNPs, the most common type of genetic variations between individuals), across the human genome to identify the role of common variants (those having a frequency ≥ 0.05) in the development of a trait or a disease [42]. Thanks to GWAS, more than 700 novel risk loci have been discovered, all accounting for an increased risk of T2D of less than 40%, and many of them of for less than 15% [39]. However, despite the large collection of loci reaching the conventional threshold of genome-wide significance (p  <  5  ×  10−8) [43], only a limited number of them have been explored for their interaction with carbohydrate intake and their subsequent impact on the development of T2D.
The product of the TCF7L2 gene, located on chromosome 10, is a downstream effector involved in the canonical Wnt/β-caternin signaling cascade, which, in addition to being critical for pancreatic islet development and the production and secretion of insulin, has also been related to various common diseases as well as to diverse models of cancers [37,44,45]. SNPs of the TCF7L2 gene, especially the rs7903146 (C/T) SNP, one of the most susceptible genes to T2D discovered so far, have been associated with almost 20% of T2D patients and exert their effects via a multiplicative genetic model [44,46]. A recent meta-analysis including 28 studies with a total of 56,628 participants (34,232 cases and 22,396 controls) reported a significant, strong association of rs7903146 with T2D in Caucasian, East Asian, South Asian, and other ethnicities, with an increased risk ranging from 41 to 81% [47]. In non-diabetic individuals, TCF7L2 rs7903146 appears to be associated with a decrease in basal and glucose-stimulated insulin secretion as well as with quantitative and qualitative morphological changes in pancreatic islets [48]. The same variant is responsible for decreased β-cell responsivity and impaired glucose tolerance in obese adolescents [49]. TCF7L2, highly expressed in white adipose tissue, also has a fundamental role in adipogenesis by directly regulating the expression of genes implicated in lipid and glucose metabolism, while the loss of TCF7L2 in adipocytes leads to reduced glucose tolerance, increased insulin resistance, weight gain, and increased amount of subcutaneous adipose tissue in mice fed with high-fat diet, predisposing animals to develop T2D [40,50]. Furthermore, TCF7L2 suppression affects the normal function of pancreatic β-cells, resulting in a reduced glucose-stimulated insulin secretion, underlying defective insulin exocytosis [51] (Table 1).
PPAR-γ, highly expressed in adipose tissue, is a ligand-activated nuclear receptor that controls the transcriptional status of various genes involved in different biological functions such as adipocyte differentiation and immunity, cell differentiation, and glucose and lipid metabolism [52]. Importantly, thiazolidinediones, PPAR-γ agonists currently used as therapeutic agents in T2D subjects, primarily act in the adipose tissue where PPAR-γ is predominantly expressed, promote lipid uptake and storage, and stimulate lipogenic activities in fat cells, thereby leading to an improvement in insulin resistance and a reduction in blood glucose levels [53,54]. The PPAR-γ2 rs1801282 missense variant, also known as Pro12Ala due to the replacement of proline with alanine, has been extensively examined in epidemiological studies, which generally reported a decreased risk of T2D associated with this variant [55,56,57]. In contrast, past research supported an association of PPAR-γ2 rs1801282 with insulin resistance in both non-diabetic children and adults, which can also be modified by circulating lipids [57,58]. These conflicting results can be attributed to differences in populations, ethnicities, individual characteristics, and pre-existing conditions such as obesity or T2D [59]. Actually, a recent study showed that PPAR-γ2 rs1801282 and PPAR-β/δ rs2016520—the latter a variant associated with PPAR-β/δ, another isoform belonging to the nuclear receptor superfamily, which appears to improve glucose and fatty acid metabolism and alleviate insulin resistance, glycogen storage, and gluconeogenesis downregulation in animal models—are associated with higher values of waist circumference, fasting plasma glucose, and glycosylated hemoglobin A1c (HbA1c, i.e., a relevant indicator reflecting the cumulative glycemic history during the previous two or three months) [60,61,62,63] (Table 1).
Glucose dependent insulin polypeptide receptor (GIPR) is another gene with a crucial role in metabolic pathways [64]. The GIPR gene, located on chromosome 19 in the β cells of Langerhans islands and, to a lesser extent, in insulin-sensitive tissues such as adipose tissue, encodes a G-protein coupled receptor for the GIP hormone [64,65]. GIP is an intestinal hormone secreted from the enteroendocrine K cells in the postprandial state, and it is responsible for the increased uptake of lipids and glucose, stimulation of insulin secretion, and inhibition of glucagon secretion from pancreatic cells in healthy subjects, although the incretin effect remains active 1–2 min after its secretion [66,67]. GIP also increases glucagon levels during fasting and hypoglycemic conditions, with little or no effect concomitant on insulin secretion, indicating a bidirectional function of this hormone in stabilizing glucose levels with opposite effects on the two main pancreatic glucoregulatory hormones [68]. Furthermore, in combination with hyperinsulinemia, GIP increases subcutaneous abdominal adipose tissue blood flow (ATBF) and stimulates triacylglyceride deposition in adipose tissue in lean humans without inducing any significant changes in ATBF response in obese subjects with decreased glucose tolerance [69,70]. GIPR rs10423928, due to T/A exchange, is associated with increased fasting glucose and proinsulin levels, and reduced ß-cell function, thereby representing a risk factor in non-diabetic individuals [71], while in subjects with T2D it causes a reduced incretin effect (no effect on insulin secretion) and consequent postprandial hyperglycemia [72,73] (Table 1).
Insulin receptor substrate ( ) genes encode a family of cytoplasmic adaptor proteins that are phosphorylated by the intrinsic tyrosine kinase activity of the insulin receptor, which is activated upon binding of the hormone and then in turn activates the downstream phosphatidylinositol 3-kinase pathway (PI3K), mediating key actions of insulin [74,75]. IRS molecules (i.e., IRS-1, IRS-2, IRS-3, IRS-4, which show differences in tissue and subcellular localization, phosphorylation patterns, developmental expression, and binding to the insulin receptor) represent pivotal mediators in insulin signaling pathways, which play a central role in maintaining essential cell functions such as growth, metabolism, and survival [76]. Although several SNPs have been identified in IRS1 genes, only the Gly to Arg972 substitution of IRS-1 (rs1801278 SNP) seems to represent a key independent determinant in the onset of insulin resistance in T2D patients, affecting the ability of insulin to activate the PI3K cascade that physiologically regulates glucose metabolism by promoting glycolysis and inhibiting gluconeogenesis in insulin-sensitive tissues [77,78,79]. However, as previously observed for PPAR-γ, the effects of IRS-1 may vary depending on ethnicity, presence of obesity, and sample size [77]; therefore, studies conducted on certain Asian populations did not find any association of IRS-1 with insulin resistance and/or risk of T2D [79,80,81] (Table 1).
Meta-analyses of GWAS datasets, which increase the power of association signals by increasing sample size through the assessment of multiple datasets [82], have allowed for the identification of hundreds of T2D susceptibility loci up to 2023, based on the finding that the frequency of a specific SNP is higher in cases than in controls and thus associated with the disease; however, they explain only a small effect on the heritability of T2D [83,84]. Therefore, the “missing heritability” in T2D could be attributed to the presence of common variants with a lower frequency (≥1%), those not yet identified, and/or rare variants detectable only by whole-genome sequencing (WGS) or whole-exome sequencing (WES), which, while allowing for assessment of the full spectrum of genetic variation, are based on a small sample size [37,85,86,87]. Rare variants in single genes are the cause of monogenic diabetes (MD), a form of diabetes with autosomal dominant inheritance, frequently misdiagnosed as type 1 diabetes or T2D, and representing approximately 2.5–6% of all diabetes cases [88,89]. In particular, maturity-onset diabetes of the young (MODY) is the most common form of MD and, to date, at least 14 different genes have been associated with MODY development [89]. Furthermore, WGS data have recently shown that rare variants may explain a large proportion of the heritability of complex traits and diseases, including T2D, for which rare variants are responsible for up to 25% of the heritability of the strongest common single-variant signals [86,90].
Table 1. Characteristics of the most relevant loci possibly involved in pathogenesis of type 2 diabetes.
GeneAcronymOriginal FunctionVariantRole in T2DReferences
Transcription factor 7-likeTCF7L2Encoding a Wnt signaling-associated transcription factorrs7903146Decrease in insulin secretion; morphological and functional changes in β cells [48,49,50,51]
Proliferator-activated receptor gammaPPAR-γEncoding a ligand-activated superfamily member of ligand-dependent transcriptionrs1801282Increase in insulin resistance; impairment of anthropometric, glucose, and lipid metabolism biomarkers[58,59,60]
Glucose dependent insulin polypeptide receptorGIPREncoding a G protein-coupled receptor for the GIP hormoners10423928Increased fasting glucose and proinsulin levels; reduced incretin effects[69,70]
Insulin receptor substrate-1IRS-1Encoding a cytoplasmic adaptor protein involved in insulin signal transmissionrs1801278Increased insulin resistance [77,78,79]

3. Carbohydrate–Gene Interactions in Type 2 Diabetes

The interest towards the importance of diet as a modifiable risk factor in T2D has been progressively increasing in recent decades, with most evidence resulting from a multitude of cross-sectional and cohort studies published since the late 1990s [15,91]. On the other hand, according to the “developmental-origins hypothesis”, perinatal events (prematurity, low birth weight), maternal nutrition imbalance, and medication intake during pregnancy, which lead changes in metabolism and hormone production that determine alterations in the development and functioning of various organs, may profoundly affect subsequently adulthood susceptibility to certain chronic diseases such as T2D, MetS, coronary heart disease, obesity, and stroke [92].
More recently, a number of systematic reviews and meta-analyses have assessed the relationship between food and dietary factors and the onset of T2D [93]. This condition arises from a complex interaction between genetic and lifestyle factors, with diet quality likely to play a key role in the causal mechanisms of T2D development, although the generally poor quality of past studies due to cross-sectional design (subject to recall bias), small sample sizes, and inadequate control for confounders, has produced unconclusive evidence [19,94,95]. As suggested by Franks et al., large case–control studies nested with population-based cohorts, assessing interactions selected on a priori biologically driven-hypotheses to reduce the likelihood of spurious results, would instead be desirable to provide useful information in the investigation of disease etiology [94]. Actually, larger prospective studies have been conducted since then, and novel findings in the field of diet-gene interactions have recently been published [19,95]. In the following sections, we will focus on the bidirectional role of carbohydrates in the occurrence of T2D and how they can interact with susceptibility genes.

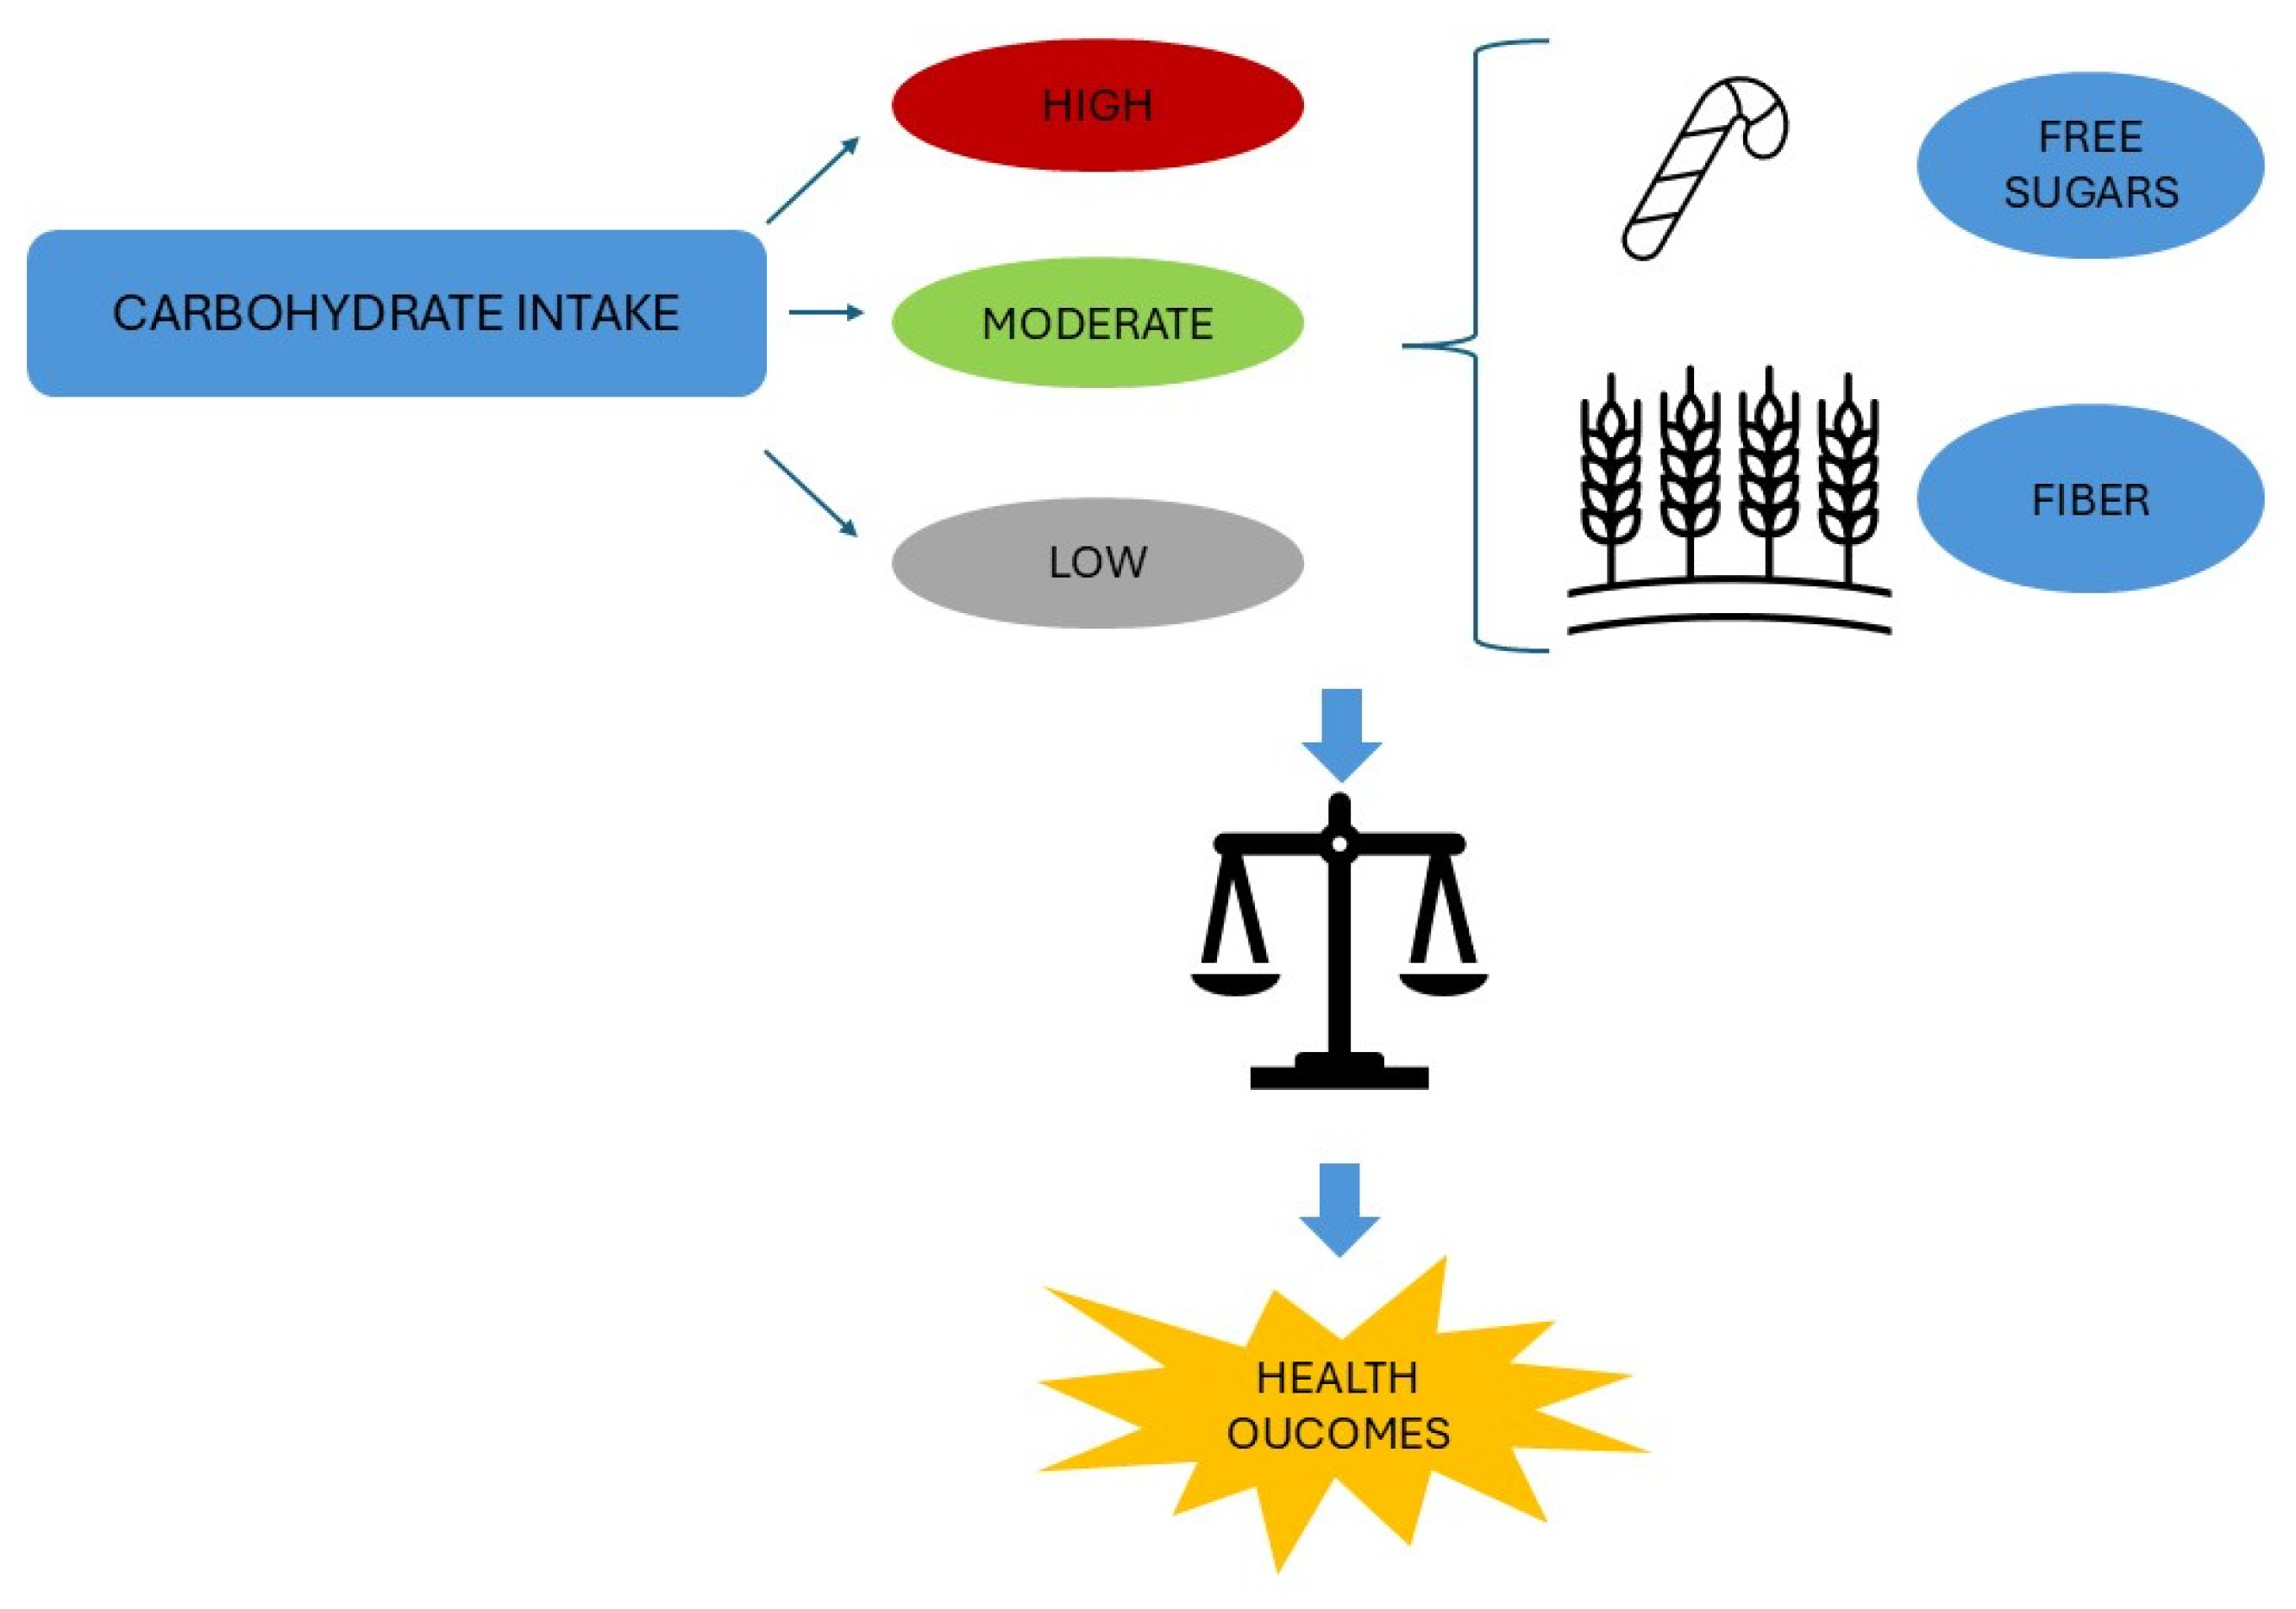
3.1. Carbohydrates and Their Role in Human Health

Along with proteins and fats, carbohydrates are also known as macronutrients that provide essential energy for the maintenance of biological systems [25]. Carbohydrates can be divided into two main groups: simple, consisting of one (i.e., monosaccharides such as fructose, galactose, glucose) or two sugar units (i.e., disaccharides like lactose, maltose, sucrose); and complex, which are composed of many sugar units including starch, glycogen, and fibers [95]. Cereals, especially in the form of whole grains (WGs), a category of foods consisting of endosperm, germ, and bran, represent a relevant source of fibers known as non-digestible carbohydrates and composed of at least 10 monomers [28,96]. Based on the 2020–2025 Dietary Guidelines for Americans, the reference intake of carbohydrates corresponds to 45–65% of total daily calories [97]. Notably, both low (<40%) and high carbohydrate (>70%) intakes have been related to an increase in mortality compared to a moderate intake (50–55%) [98]. Indeed, low-carbohydrate diets may result in accumulating animal fat and protein with a concomitant reduction in vegetable protein and dietary fiber intake, which overall are significantly associated with T2D risk and increased mortality from cardiovascular disease (CVD) [99,100,101]. Dietary fiber, classified as soluble or insoluble depending on its solubility in water, reduces the aging process and therefore the risk of mortality, especially at high intakes [25,28]. Dietary fiber presents further beneficial effects, promoting healthy gut microbiota, increasing the feeling of satiety and thereby facilitating weight loss, and regulating carbohydrate and lipid metabolism [25,28]. Consistently, dietary patterns such as the Mediterranean and Okinawan diets, both characterized by a protein/carbohydrate ratio of less than 1, are associated with reduced overall mortality, lower risk of major chronic and metabolic diseases, and increased life expectancy [28,102]. In addition to the daily amount of carbohydrates, carbohydrate type appears to be crucial for health outcomes [25]. In fact, the inverse association between adherence to the Mediterranean diet and mortality is attributable both to moderate carbohydrate consumption and to a dietary pattern mainly composed of high fiber from vegetables and fruits and WG products as the main sources of carbohydrates [103,104]. Given the health benefits of WG consumption due to their high fiber and antioxidant and phytochemical contents, current U.S. Dietary Guidelines recommend that WGs make up at least 50% of total grain intake, with the remainder coming from refined grains that have had the bran removed during the milling process and whose consumption has been associated with an increased risk of metabolic disease [26,95,96,105]. However, as is generally the case with other foods, WGs are not generally consumed alone but combined with other food groups or macronutrients [106]. Intake of food items rich in natural (those contained in fruits and vegetables) and added sugars (those contained in sweetened beverages, fruit juice, preserves, and added during processing or preparation) has been associated with all-cause, cardiovascular, and cancer mortality, with sugar intakes > 20% of total energy linked to a 30% increase in the risk of mortality [25,107,108,109]. Given the threat to human health associated with an excessive consumption of free sugars, which may cause de novo lipogenesis, inflammation, and oxidative stress, the World Health Organization, beyond recommending an intake of free sugars at less than 10% of the total energy intake, suggests a further reduction to less than 5% [110]. Therefore, there is a fine balance underlying the relationship between carbohydrate intake, the quality of carbohydrates ingested, and the risk of diseases, including T2D, with opposite effects (Figure 1).

3.2. Whole-Grain Intake and Risk of Type 2 Diabetes

A series of meta-analyses have assessed the relationship between WG intake and other types of grains, namely refined grains, and the risk of T2D, with results suggesting significant associations, although with limitations that reduce their strength and evidence (Table 2). A meta-analysis by Ye et al., including a total of 45 prospective cohort studies and 21 randomized-controlled trials (RCTs) published in the years 1966–2012, reported that WG intake was associated with a 26% reduced risk of T2D (relative risk—RR = 0.74, 95% confidence interval—95% CI: 0.69–0.80) [111]. This estimate was based on six observational studies (for a total of 288,410 participants) comparing the highest intake level (consumers of an average of 48–80 g/day—3–5 serving/day of whole grains) with the lowest one (rare or never consumers of whole grains) [111]. Furthermore, based on 11 prospective studies and 389,319 subjects, the risk of T2D related to the comparison between the highest and the lowest category of total cereal fiber intake was reduced by 13% (RR = 0.87, 95% CI: 0.81–0.94) [110]. A subsequent meta-analysis encompassing 16 cohort studies (ten of which assessed the relationship between WG and T2D and included 19,829 cases among 385,868 participants, and six studies examining the impact of refined grains for a total of 9545 cases among 258,078 participants) published up to 2013 found a 32% reduced risk for T2D associated with three servings a day of WGs (RR = 0.68, 95% CI: 0.58–0.81) [96]. The authors observed a nonlinear relationship showing most of the risk reduction with an increasing intake up to two servings a day, but no association between refined grain intake and occurrence of T2D (RR = 0.95, 95% CI: 0.77–1.04) [96]. Similarly, a significantly inverse association was found in subgroup analyses for WG bread, WG cereals, wheat germ, and brown rice with T2D risk, while T2D risk had a positive association with white rice [96]. Although based on an extremely small amount of data, these results can be explained by differences in WGs in their content of fiber, antioxidants, phytochemicals, and micronutrients, which subsequently influence cardiovascular health [96,112,113,114]. The meta-analysis by Chanson-Rolle and co-authors [106], including eight observational studies (all but one were prospective, with a follow-up interval of 6 to 22 years) comprising 15,573 cases among 316,051 participants, corroborated previous findings and reported a significant inverse association between WG intake and the incidence of T2D, with a 0.6% decrease in T2D risk for each 20 g/day increase in WG consumption, and the relationship remained significant even after adjusting for covariates. Using data from the Danish Diet, Cancer, and Health cohort including 55,465 participants of whom 7417 received a diagnosis of T2D during the follow-up, Kyrø et al. [115] investigated the relationship between different WG intakes and risk of T2D. Each one-serving increase in WG intake (16 g daily) was associated with a significantly reduced risk of T2D by 11% (hazard ratio—HR = 0.89, 95% CI: 0.87–0.91) in men and by 7% in women (HR = 0.93, 95% CI: 0.91–0.96) [115]. Likewise, a one-serving increment (50 g/day) in WG product intake was also related to a significantly lower risk of T2D in both sexes (HR = 0.89, 95% CI: 0.86–0.90 in men and HR = 0.93, 95% CI: 0.90–0.96 in women) [115]. When examining the impact of three WGs (wheat, rye and oats), they were all significantly associated with a reduced risk of T2D from 34 to 8% in men, while in women wheat alone showed a significant inverse association (by 21%) [115]. Reynolds et al. [116], who conducted a series of systematic reviews and meta-analyses of prospective studies (published by 2017) and RCTs (published by 2018) to assess the correlation between carbohydrate quality and selected health outcomes, demonstrated that a higher intake of total dietary fiber (25–29 g per day) compared to a lower intake was associated with a 16% reduction in the incidence of T2D (RR = 0.84, 95% CI: 0.78–0.90), with a linear dose–response relationship (based on 17 observational studies). Furthermore, a higher intake of WGs was associated with a 33% reduction in the risk of T2D (RR = 0.67, 95% CI: 0.58–0.78) (based on eight observational studies), supporting the beneficial effects of WGs due to their high fiber content [116]. Based on the Nurses’ Health Study, the Nurses’ Health Study II, and the Health Professionals Follow-up Study, all large-scale prospective studies including a total of 194,274 participants without a diagnosis of T2D, CVD, or cancer at baseline and 18,629 subjects identified with T2D during a mean follow-up of 24 years, Hu et al. [26] explored the associations of total and individual WG intake with the risk of T2D. After dividing total grain consumption into five categories of servings a day and adjusting for lifestyle and other dietary risk factors, the pooled analysis of all three cohorts indicated that the highest intake vs. the lowest intake of total WGs was associated with a 29% lower occurrence of T2D, after adjusting for covariates (HR = 0.71, 95% CI: 0.67–0.74). For individual WG foods, comparing consumption of more than one serving per day vs. less than one serving per month, the pooled HRs for T2D were 0.81 (95% CI: 0.77–0.86) for WG cold breakfast cereal, 0.79 (95% CI: 0.75–0.83) for dark bread, and 1.08 (95% CI: 1.00–1.17) for popcorn [26]. In line with [96], total WG consumption was inversely correlated with the risk of T2D according to a nonlinear relationship showing a plateau between two and three servings a day [26]. Subgroup analysis revealed a relatively weaker inverse association between total WG intake and T2D risk in obese subjects, compared with that observed in lean and overweight participants; the chronic conditions of inflammation, dyslipidemia, and insulin resistance typical of obese individuals may counteract the benefits of WG consumption on glucose metabolism [26].
Table 2. Clues and pitfalls in the association between whole grain intake and risk of type 2 diabetes.
CluesReferencePitfallsReference
WG intake (3–5 servings per day) significantly associated with a reduced risk of T2D[96,106,111,116]Potential overestimation due to incomplete adjustment for lifestyle and dietary factors, as well as unmeasured or residual confounding[26,96,106,111]
Significantly inverse associations between WG bread, whole grain cereals, wheat bran, and brown rice and risk of T2D[96,115]Most studies conducted among Caucasian populations in the United States[106,111]
No significant association between refined grain consumption and T2D risk[96]Small number of cohort studies[96]
Whole grain intake (the highest category vs. the lowest category) significantly inversely associated with T2D occurrence[26]High heterogeneity in the dose–response analysis of WGs and T2D[96]
Whole grain cold breakfast cereals and dark bread (≥1 serving per day) significantly associated with a reduced risk of T2D[26]No possibility to control publication bias[96]
Possible inadequate reporting of WG consumption from subjects[106]
Possible measurement errors and differences between studies in the exposure assessment[96,111]
Lack of a uniform definition for WG foods[96,106]
Wide range of whole grain intake across studies[106]
Possibility of false results due to the assessment of associations of WG foods simultaneously[26]
Findings mainly related to white health professionals[26]
Evidence for the association between dietary fiber and whole grain intake and the risk of T2D rated as low or moderate by the GRADE criteria assessment [116]
Abbreviations: T2D: type 2 diabetes; WGs: whole grains.

3.2.1. Whole Grain Intake and the Impact on Glycemic Control

The inverse association between WG intake and T2D risk can be partially explained by the regulatory effect of WG on blood glucose levels through a significant decrease in fasting glucose and postprandial glycemia, insulinemia, and HbA1c [117,118,119,120]. In particular, the significant improvement in HbA1c can account for the cumulative positive effect of WGs on postprandial glycemia [119]. A systematic review and meta-analysis of 21 RCTs showed that, in comparison to controls, WG intervention groups had significantly lower concentrations of fasting glucose, insulin, total and low-density lipoprotein (LDL) cholesterol, and lower weight gain after 4–16 weeks [111]. A meta-analysis of 14 RCTs [117] reported that the acute effects on postprandial glucose and insulin homeostasis promoted by WG intake in healthy subjects did not significantly differ from those of refined grain meals, contrary to a subsequent meta-analysis including 80 RCTs [118], which instead documented significantly lower postprandial glycemia and insulinemic response compared to refined grain foods, despite the small effect size. Furthermore, WG consumption did not significantly affect fasting insulin, a homeostatic model assessment of insulin resistance (HOMA-IR), or glucose tolerance, suggesting little or no effect on insulin sensitivity [117,118,119]. A recent meta-analysis of 25 RCTs showed that although WG intake may improve HbA1c in adults with or without risk factors for CVD, the corresponding level of evidence was moderate; therefore, the authors’ opinion was of no clear indications to recommend WG in replacement of refined grains to prevent and/or treat CVD [120]. In contrast, the meta-analysis by Ying et al. [121], based on ten prospective studies and 37 RCTs, reported that the intake of WGs was significantly associated with reduced fasting blood glucose, HbA1c, and HOMA-IR according to a dose-dependent pattern. Fiber, and in particular β-glucan, a non-starch soluble polysaccharide contained in barley, oat, and rye, increases the viscosity of the gastrointestinal tract which, by limiting the accessibility of digestive enzymes, reduces the intestinal absorption of carbohydrates, with a consequent reduction in postprandial glycemia [119,122,123]. This action on glucose metabolism probably involves the modulation of the hormone cholecystokinin, which, when secreted in the upper part of the small intestine following a meal, delays gastric emptying and enhances postprandial satiety [124]. Consistently, the intake of WG foods is significantly associated with decreased appetite and increased satiety perception compared to refined grain foods [125]. Of note, β-glucan in barley may influence the composition of the gut microbiota by increasing the abundance of specific succinate-producing bacteria and succinate, a precursor of propionate, one of the short chain fatty acids (SCFAs), which represent the main metabolites produced by the intestinal microbiota from dietary fiber and resistant starch [119,126]. Among multiple biological effects, SCFAs may improve glucose metabolism function and insulin sensitivity, thus explaining the effects of WG intake on postprandial insulinemia [119,127,128,129,130,131]. SCFAs also directly control hepatic function and increase insulin secretion, as well as promoting the release of the intestinal hormones peptide-YY and glucagon-like peptide-1 (GLP-1), two key regulators of appetite behavior, energy intake, and nutrient availability [131,132]. In particular, the incretin GLP-1 enhances the insulin response to ingested carbohydrates, thus helping to regulate blood glucose levels [133]. In addition to the high fiber content in bran and germ components, WGs contain a wide range of phytochemicals, among which phenolic acids are of great importance due to their antioxidant, anti-inflammatory, and anti-tumor properties [134]. In vitro studies have shown that phenolic acids (the most common ones in WGs include vanillic, ferulic acid, caffeic, syringic, and p-coumaric acids) can modulate carbohydrate and lipid metabolism and reduce insulin resistance, exerting anti-diabetic activities, i.e., stimulating insulin secretion and signaling, modulating glucose release from the liver through the control of gene expression, regulating the gut microbiota, activating intracellular signaling pathways, and protecting pancreatic β-cells from oxidative stress [119,134,135,136,137]. Furthermore, phenolic compounds (phenolic acids, anthocyanins, tannins, and flavonoids), are inhibitors of α-amylase and α-glucosidase, carbohydrate digestive enzymes that catalyze the hydrolysis of starch, maltodextrins, and other related carbohydrates into maltose and convert maltose into glucose, respectively, overall leading to strict control of postprandial blood glucose in diabetic patients and also contributing to the prevention of T2D [138] (Figure 2).
In summary, a strong body of evidence indicates a considerable decrease in the risk of T2D associated with an intake of all grains, especially wheat, accompanied by an improvement in fasting glucose concentration, postprandial glycemia, and insulin homeostasis. On the other hand, WGs do not appear to influence long-term glucose-related parameters, probably due to the study design and the types of WGs evaluated (whether a mix of WGs able to exert mutually reinforced effects or, more frequently, wheat alone). Although some studies have concluded that consuming 45 g/day of whole grains would be related to a reduction in T2D risk of at least 20% (up to 30%), not all authors agree that there is sufficient data to support the current recommendations to consume at least two portions of WGs per day for the prevention of chronic non-communicable diseases, such as T2D. Indeed, if WGs contain more fiber than refined grains, which leads to a reduced glycemic response due to the replacement of digestible carbohydrates with non-digestible fibers, the real benefits of WGs more probably lie in the ability of fibers and phenolic acids to slow down the rate of carbohydrate digestion, fibers to enhance the effects of incretin hormones, and β-glucan to modulate the composition of the intestinal microbiota. Therefore, large clinical studies with longer intervention durations and evaluations of both the type and variety of WGs and the dose-dependent relationship of individual WGs are warranted to translate acute effects on glycemia into permanent benefits in reducing the onset of T2D. A future challenge will also be understanding, in preclinical and clinical studies, which components of WGs, i.e., fiber, phenolic compounds, or bran, are mainly involved in lowering the risk of disease, while cytotoxicity tests will clarify the potential of these compounds as adjuvants or alternative medications in the treatment and management of T2D.

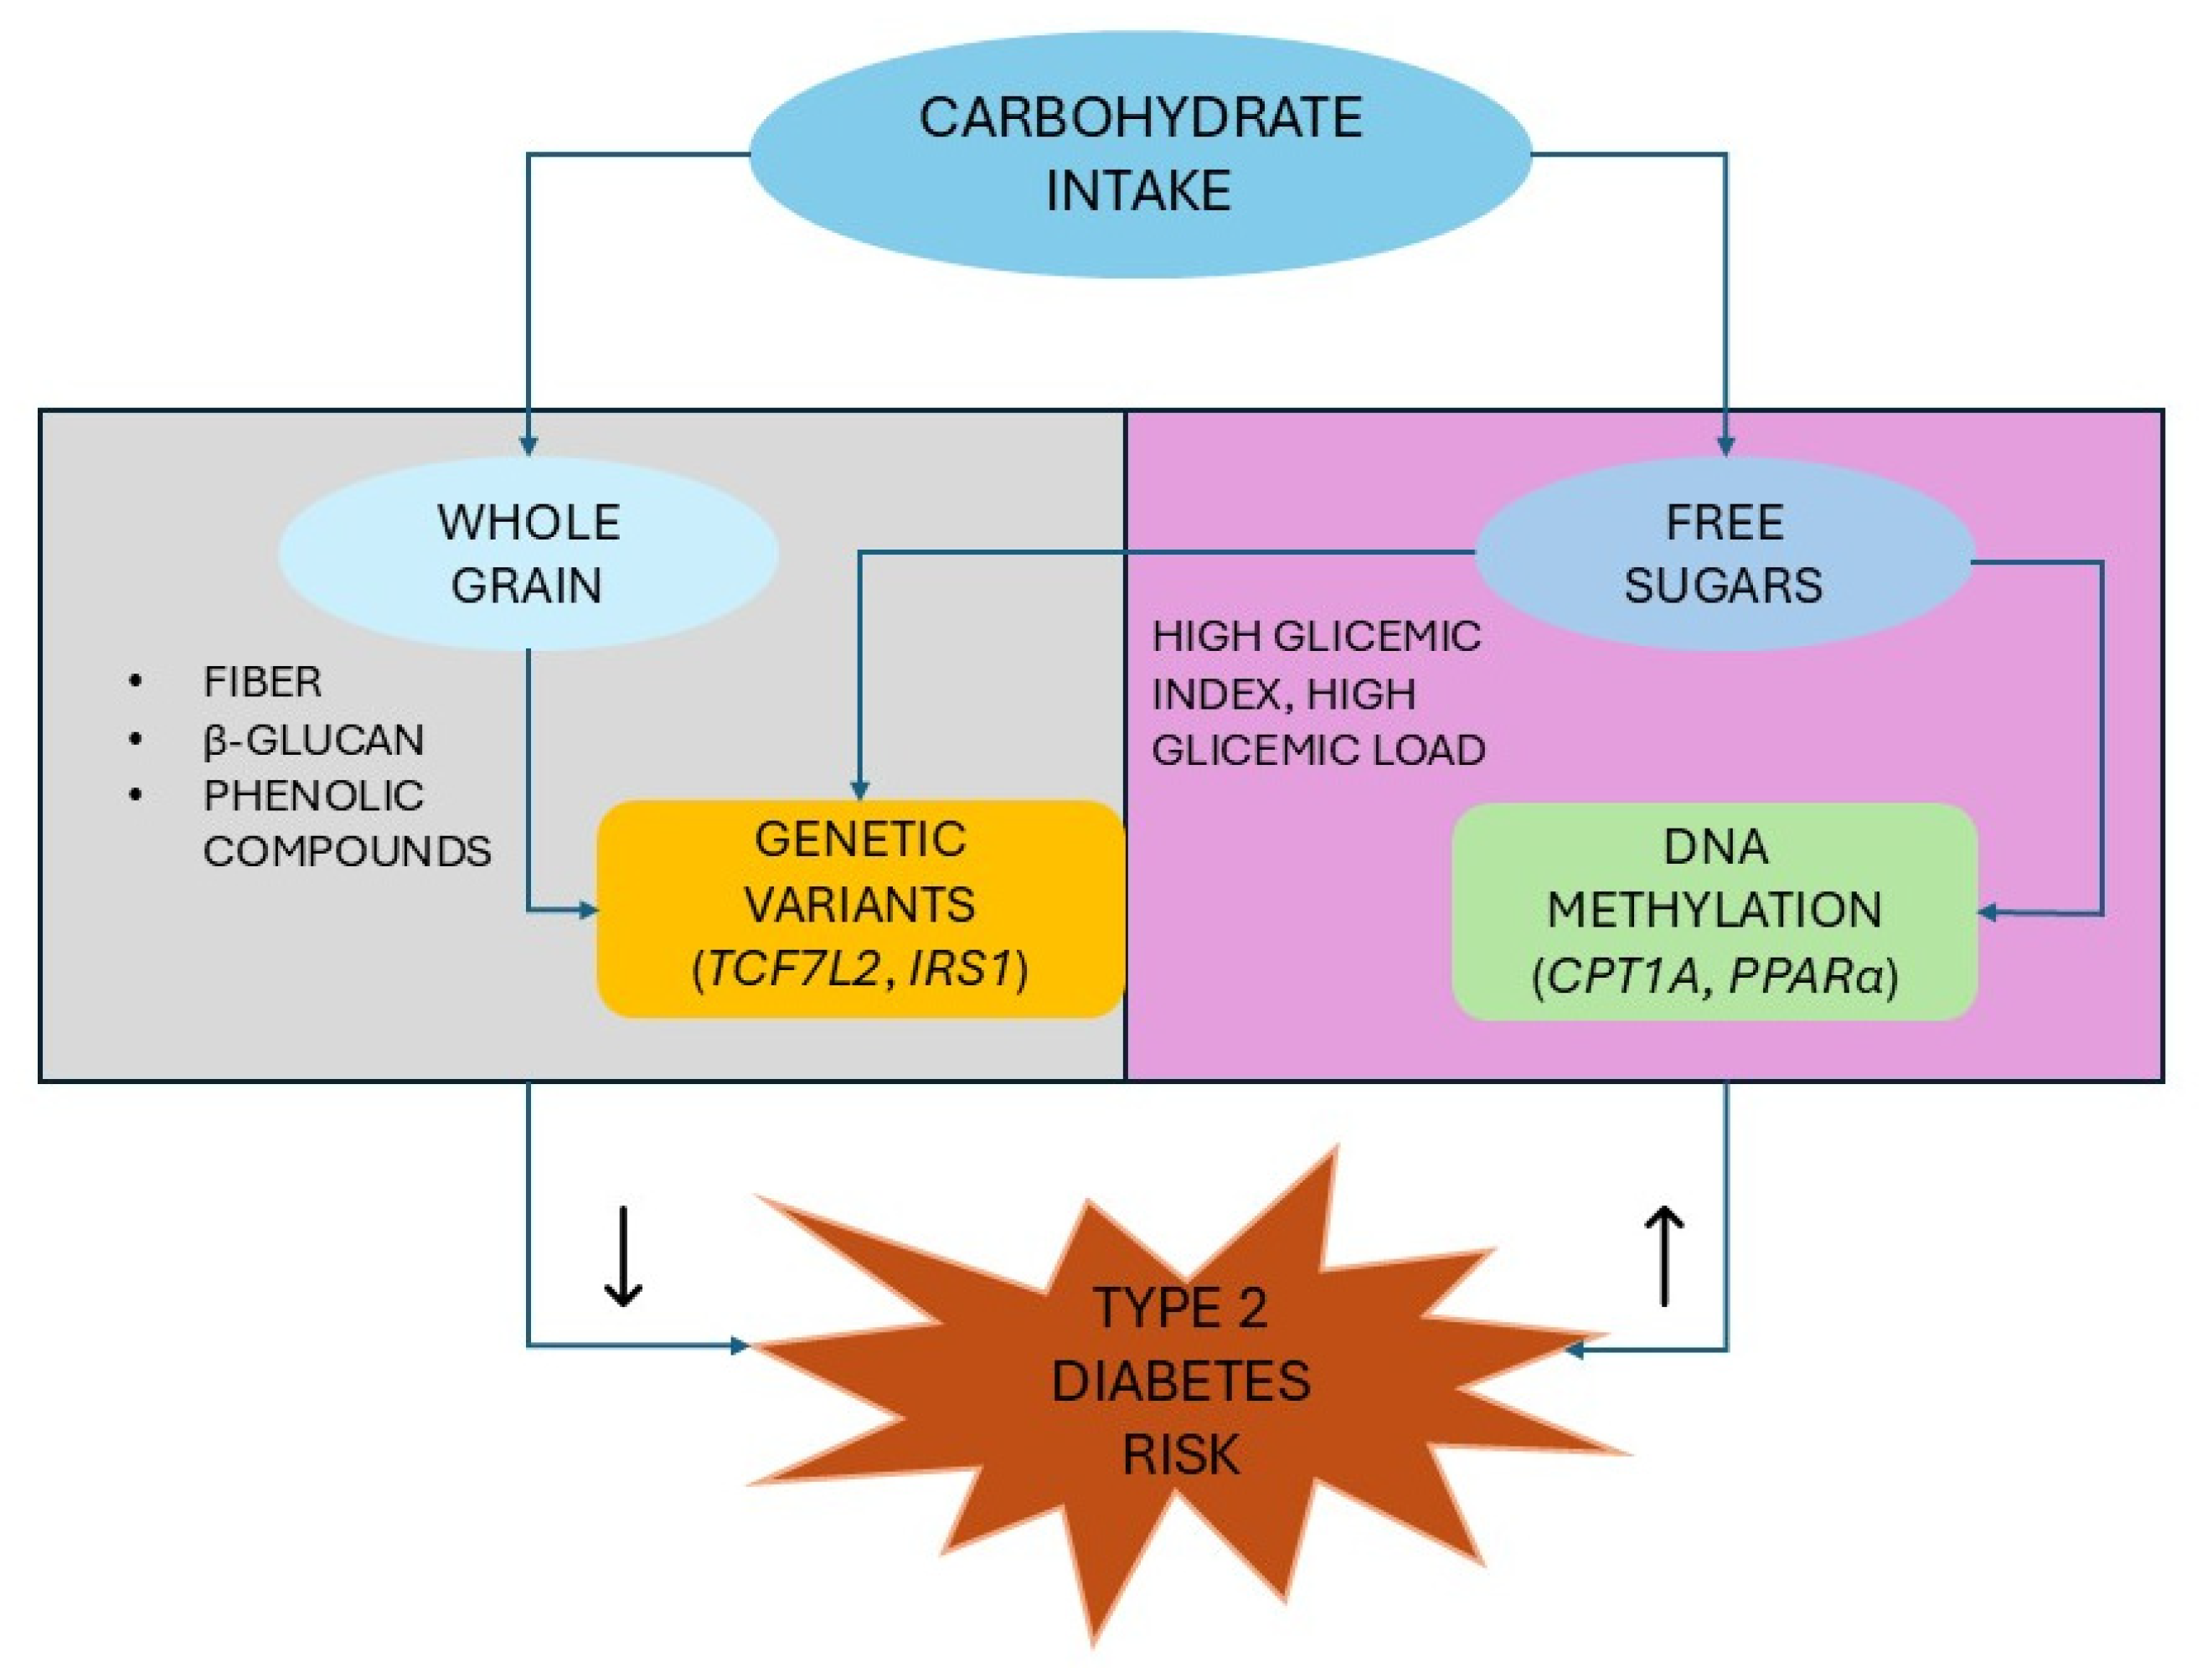
3.2.2. Nutrigenetic Interaction Between Whole Grain and Type 2 Diabetes Genes

Among the numerous investigations evaluating gene–macronutrient interactions that may potentially predispose individuals to T2D development, one of the most widely studied is that between TCF7L2 and intake of WGs and related dietary fiber [139]. In a systematic review and meta-analysis of 13 observational studies, the four studies examining this gene–diet interaction reported conflicting results, with a significantly increased incidence of T2D in subjects with a T allele (the risk allele) of rs7903146 and high consumption of total or cereal fiber observed in two studies and no significant associations reported in the other two investigations [139]. The diabetogenic effect of the TCF7L2 variant could be mediated by a reduced expression and function of GLP-1, a hormone that, as also discussed in the previous section, plays a crucial role in regulating glucose metabolism [140,141,142]. Conversely, no-risk carriers of the rs7903146 CC and rs4506565 AA-genotypes exhibited a decreased risk of developing T2D in relation to high intakes of WGs and cereal fiber [142,143]. The systematic review by Dietrich et al. [20], in addition to the above findings, included a further study reporting an interaction between TCF7L2 rs7903146 and another TCF7L2 variant (rs12255372) and quintiles of cereal fiber intake on T2D incidence, showing that the magnitude of the association between TCF7L2 variants and T2D incidence was greater among individuals in the higher fiber intake quintiles than among those in the lower quintiles [144]. In contrast, the case–cohort European Prospective Investigation into Cancer and Nutrition (EPIC)—InterAct study (a multi-center, prospective, cohort study of 519,978 participants from 8 European countries aimed at investigating the relationship of environmental factors, food habits and lifestyle with cancer and other chronic diseases), including 12,403 incident T2D cases and a random subcohort of 16,835 subjects, did not reveal significant effect modifications of TCF7L2 variants in the association between cereal fiber and T2D, except for a borderline significant protective association among carriers of TCF7L2 rs12255372 GG [145]. A higher dietary fiber intake was instead associated with a reduced incidence of T2D among carriers of the risk (T) allele in the rs10923931 variant of Neurogenic locus notch homolog protein 2 (NOTCH2) and among homozygotes for the risk (G) allele in Zinc-finger BED domain-containing 3 (ZBED3) rs445705 [144]. These SNPs are located on two genes upstream of TCLF2 in the Wnt signaling pathway, which, as described in Section 2, plays a pivotal role in T2D development by mediating GLP-1-induced beta cell proliferation [144,146,147]. NOTCH2 gene expression is significantly higher in diabetic patients than in healthy controls [148], while, on the other hand, NOTCH can inhibit Wnt/β-catenin activity by reducing the levels of active β-catenin in stem cells and colon cancer to regulate their proliferative state [149], although it is currently unknown how the effect of the NOTCH variant is related to NOTCH expression [144]. In addition to being involved in the modulation of Wnt/beta-catenin signaling, increasing levels of ZBED3 are independently associated with insulin resistance and risk of T2D, and ZBED3 has recently been identified as a regulator of hepatic glucose metabolism, promoting hepatic gluconeogenesis under glucagon stimulation and thus regulating T2D progression [150,151,152].
Within a prior meta-analysis of 14 cohort studies comprising around 48,000 participants of European descent, WG intake showed the strongest interaction with the glucokinase regulator gene (GCKR) rs780094 in relation to fasting insulin concentration [153]. Indeed, glucokinase (GCK) serves as a glucose sensor and maintains blood glucose homeostasis by regulating glycogen synthesis and gluconeogenesis, and GCKR acts as the primary regulator of GCK, inhibiting its enzymatic activity at low glucose levels [154]. GCKR SNPs (rs780093 T>C, rs780094 T>C, and rs1260326 T>C) have been related to increased glucose levels and HOMA-IR but to decreased concentrations of total cholesterol and triglycerides [155]. Conversely, the T allele of these variants has been associated with lower fasting glucose levels, reduced insulin resistance and T2D risk, and, at the same time, higher 2 h postprandial glucose and triglyceride levels [156]. Consistently, the meta-analysis by Nettleton et al. [153] found that subjects carrying one or two copies of the C-allele in the polymorphic locus rs780094 exhibited a weaker insulin-lowering effect (from 0.010 to 0.018 units) upon a greater WG intake than those not carrying the insulin-raising rs780094 C allele, although these relationships lost statistical significance after adjustment for covariates.
In sum, a diet rich in WGs and fibers seems to decrease fasting insulin independently of genetic variation and to have a protective effect against the onset of T2D, especially in subjects carrying the risk-free alleles of TCF7L2. However, it is likely that the generally inconsistent results observed are attributable to a predominance of study samples composed mainly of European ethnicities, with a concomitant underrepresentation of other ethnicities, which may influence the frequencies of variants associated with T2D and the resulting interactions with dietary factors.

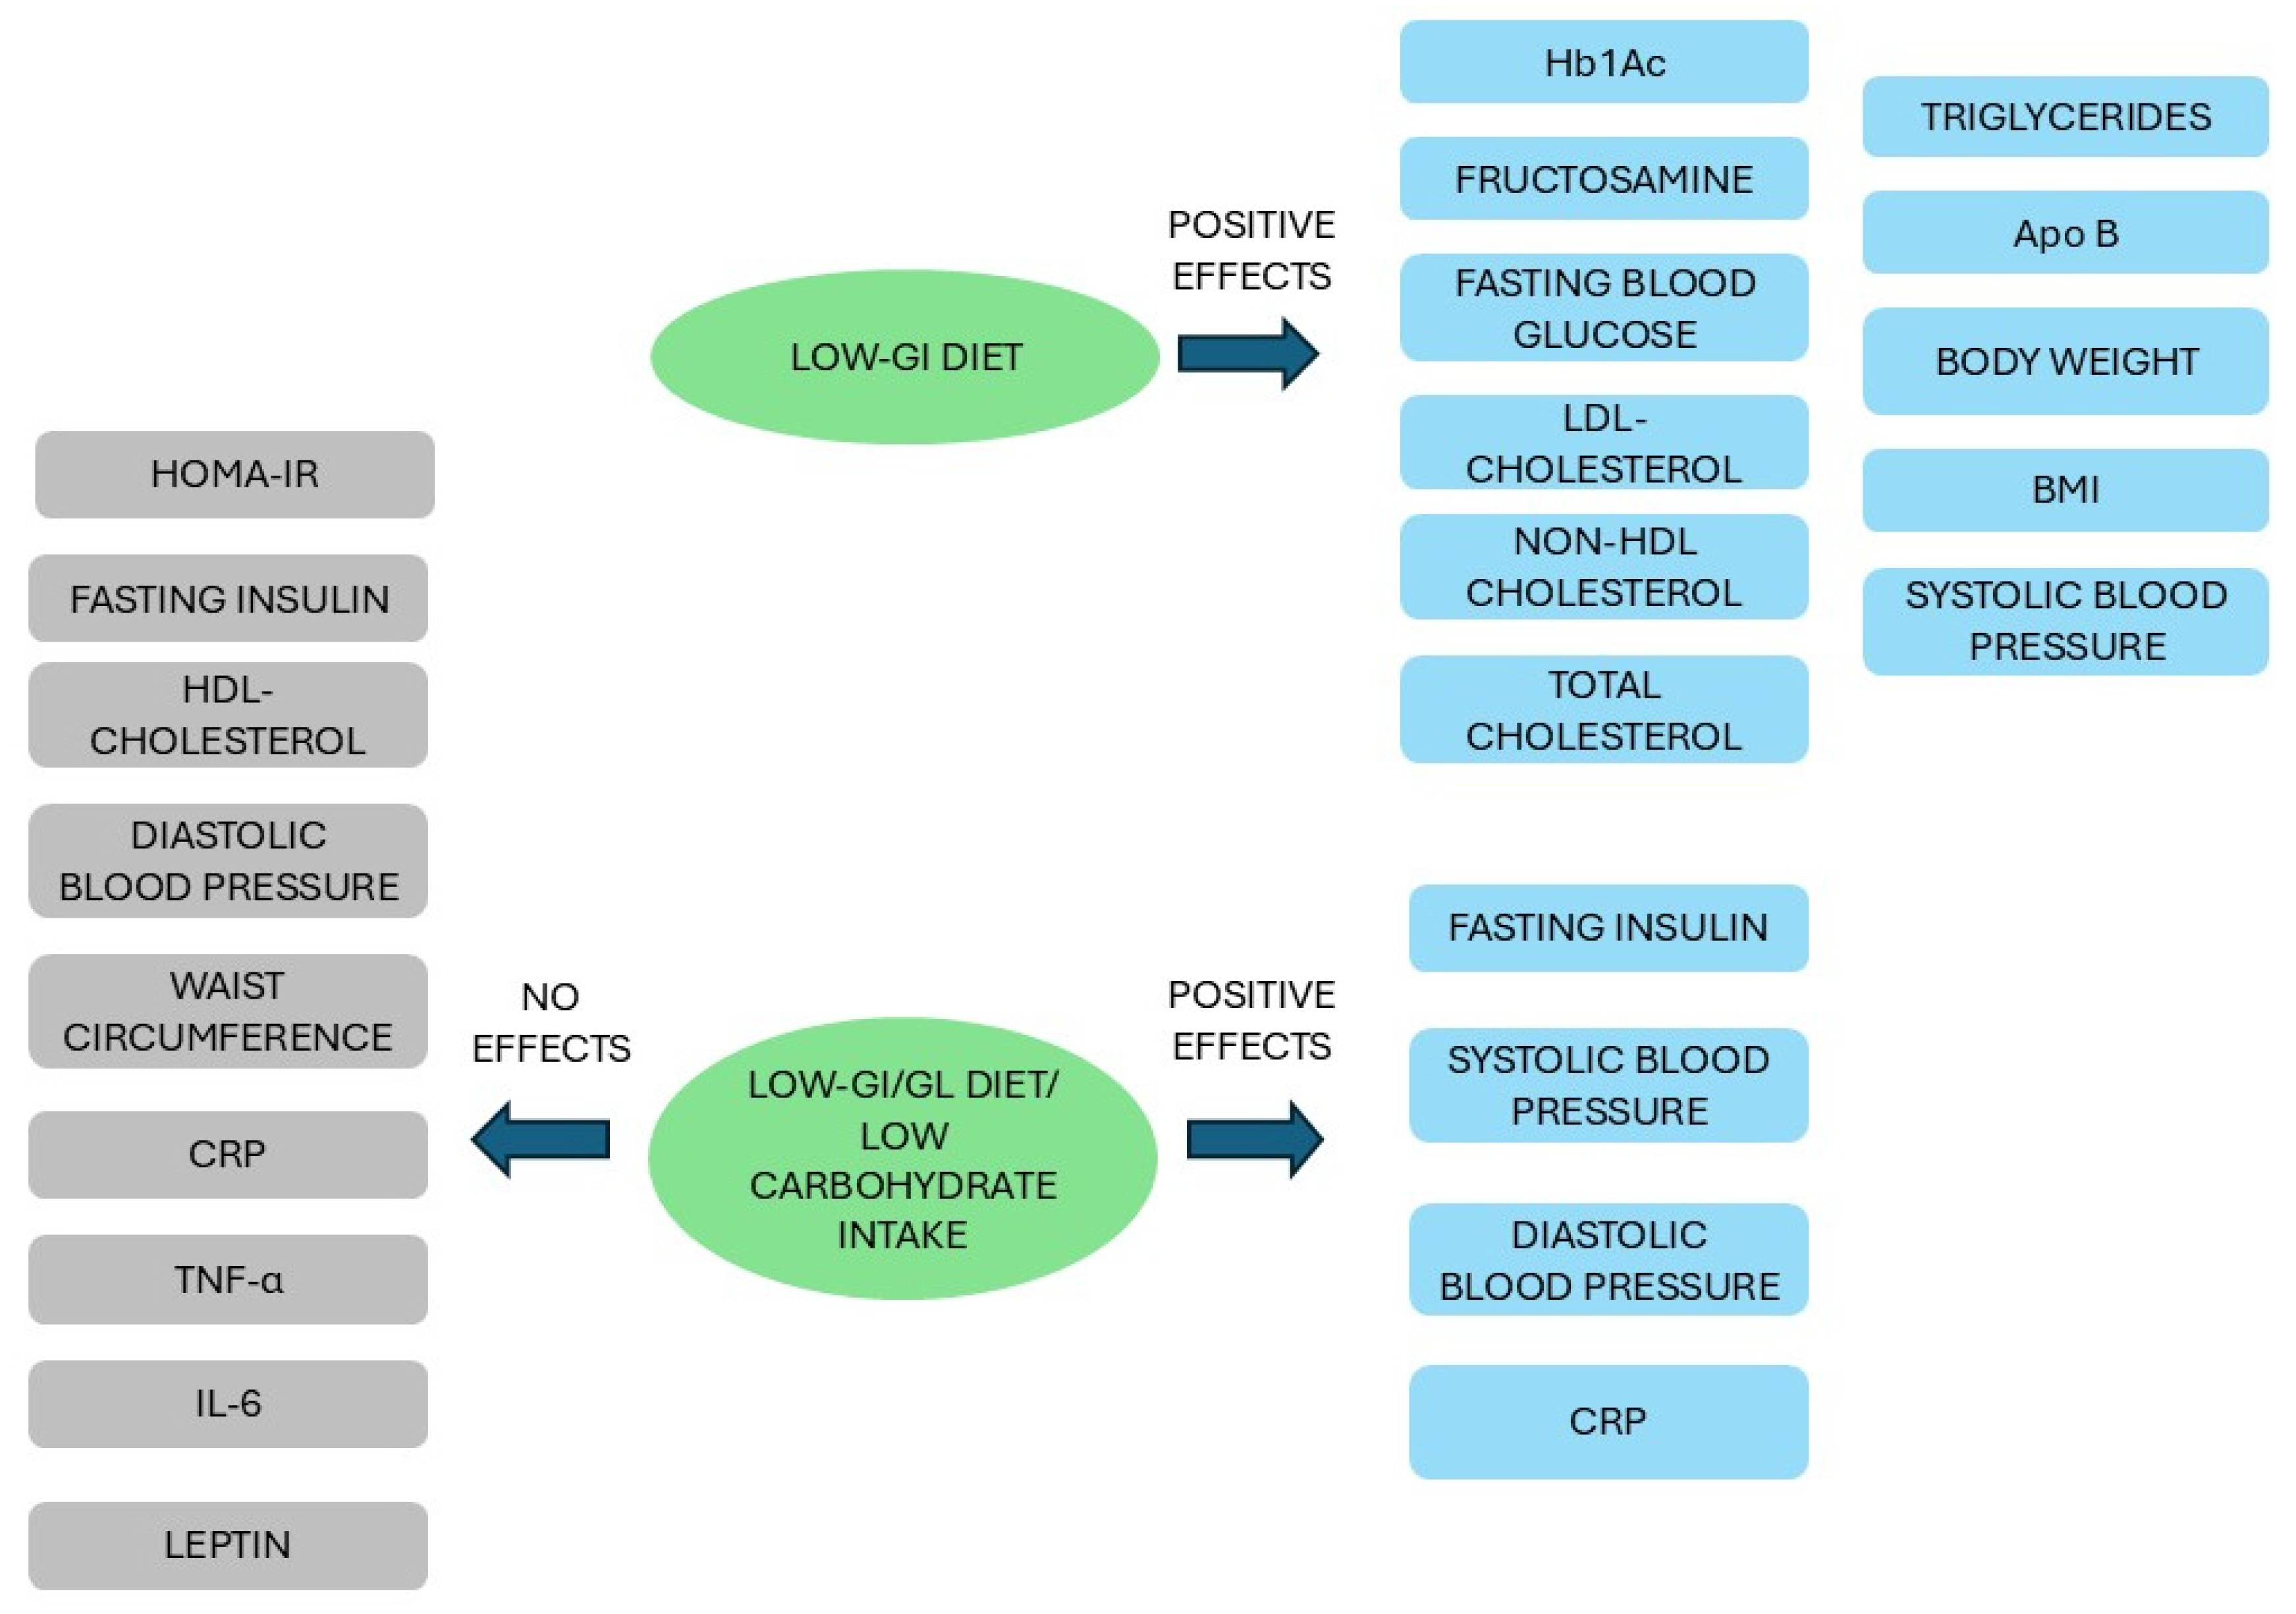
3.3. Glycemic Index, Glycemic Load, and Risk of Type 2 Diabetes

While a substantial body of evidence supports a significant association between high-fiber whole foods and a reduced risk of T2D, with a risk ratio of 0.85 (95% CI: 0.82–0.89) observed for every 8 g more fiber consumed per day [116], low-fiber carbohydrate diets potentially have the greatest impact on postprandial circulating glucose concentration [157]. High-carbohydrate diets result in a high glycemic index (GI—a classification of carbohydrate foods based on their ability to increase blood glucose concentration in comparison with reference food and, consequently, insulin requirements) and glycemic load (GL—a global score that indicates the glycemic response induced not only by the GI but also by the total amount of carbohydrates ingested and influenced by insulin resistance and related factors such as genetics, overall diet, lifestyle, and physical activity), which may plausibly contribute to the positive association between carbohydrate intake and the risk of T2D [27,158,159]. In both in vivo and short-term epidemiological studies, the intake of high-GI carbohydrates causes, on the one hand, pancreatic exhaustion due to increasing insulin demand and glucose intolerance and, on the other hand, an increase in free fatty acid release in the late post-prandial state, which may lead to insulin resistance [159]. Data from large prospective cohort epidemiological studies further suggest that a high-GL diet carries a significantly higher risk of T2D than a low-GL diet [159,160]. Additionally, a number of meta-analyses have explored the relationship between dietary GI and GL in relation to T2D risk, albeit with somewhat conflicting results and substantial limitations (Table 3). According to a systematic review and meta-analysis of 13 prospective cohort studies published between 1997 and 2010 including 530,875 participants, the pooled adjusted RR of T2D comparing the highest to the lowest category of GI was 1.16 (95% CI: 1.06–1.26), while the comparison between the highest and the lowest GL exposure was associated with an overall 20% increased risk (RR = 1.20, 95% CI: 1.11–1.30) [161]. Importantly, the two relationships remained significant even in the sensitivity analyses, and no publication bias was observed [161]. A meta-analysis of 22 cohort studies published in the years 1992–2011, for a total of 1,171,865 subjects in the cohorts [27], reported a significantly positive association between the intake of total dietary carbohydrates and incident T2D, with an increment of risk by 11% (RR = 1.11, 95% CI: 1.01–1.22, p = 0.035). However, the statistical significance was not observed in subgroup analyses evaluating individual sugars (i.e., fructose, glucose, lactose, maltose, sucrose) [27]. In addition, the effect was attenuated when considering only female participants or male and female participants [27]. A dose–response meta-analysis including a total of 21 prospective cohort studies from 24 publications (years 1990–2012), involving a total of 542,495 subjects, confirmed the previous findings, showing an 8% increased risk of T2D (RR = 1.08, 95% CI: 1.02–1.15, p = 0.01) for each 5-unit increase in GI (data extracted from 15 publications) [162]. The association between GL and T2D risk was slightly weaker, with a pooled RR estimate of 1.03 (95% CI: 1.00–1.05, p = 0.02) for every 20-unit increase in GL (data retrieved from 16 publications) [162]. In contrast, no excess risk of T2D was observed per 50 g of total daily carbohydrate intake (RR = 0.97, 95% CI: 0.90–1.06), although a substantial heterogeneity was detected between studies (n = 8) [162]. This unexpected finding may reflect differences in the amount, main sources, and types of carbohydrate consumed among different cohorts of subjects, including different proportions of men and women and diverse lifestyles (e.g., more active subjects may have a higher daily carbohydrate intake) [162]. Additionally, the exposure assessment was based on individual responses to the food frequency questionnaire (FFQ), which is not specifically designed for GI and GL, and the assignment of GI values to food items in FFQ may have potentially led to measurement errors [162]. In addition, variables such as cooking methods, storage duration, and combination of food items within a meal (e.g., co-ingestion of fat and protein) may affect the GI of an entire meal [162,163]. Sluijs et al. [163], who investigated the association between GI, GL, and digestible carbohydrates (all divided into quartiles) and T2D risk within a case–cohort study nested in the large-scale, prospective, multi-center InterAct EPIC study, including 12,403 incident T2D cases and a random subcohort of 16,235 subjects, did not find any statistically significant association in adjusted analyses, suggesting that the impact of GI and GL may have been overestimated in the initial studies [163]. The systematic review and meta-analysis by Livesey et al. [164] (24 prospective studies for a total of 7.5-million-person years of follow-up), showed that GL represents a key determinant in contributing to the incidence of T2D. Indeed, the authors reported a 45% increased risk (RR = 1.45, 95% CI: 1.31–1.61, p < 0.001) for a 100 g rise in GL (corresponding to the consumption of 250 g carbohydrate, the usual intake in Western diets, with a GI of 40) after adjustment for covariates [163]. In particular, the dose–response relationship between GL and T2D was stronger in females, in subjects of European American ethnicity, and when the dietary instrument had greater validity, whereas the duration of follow-up, which is related to the duration of exposure to GL and to the risk of developing diabetes, did not appear to influence T2D risk [164]. An updated meta-analysis of prospective studies published up to 2013 (n = 14) and including 15,027 cases of incident T2D during 3,800,618 person-years of follow-up, estimated an increased risk of T2D by 19% (RR = 1.19, 95% CI: 1.14–1.24) and 13% (RR = 1.13, 95% CI: 1.08–1.17) associated with the highest categories compared to the lowest categories of GI and GL, respectively [165]. In a subsequent systematic review and meta-analysis on the relationship between GI, GL, and T2D including only studies that applied valid dietary instruments (i.e., energy-adjusted deattenuated correlation coefficients for carbohydrates > 0.55 when assessing the risk of coronary heart disease in relation to GI and GL), Livesey et al. reported a RR of 1.27 (95% CI: 1.15–1.40, p < 0.001) for the T2D–GI risk association (n = 10 studies) and a RR of 1.26 (95% CI: 1.15–1.37, p < 0.001) for the T2D-GL risk relationship (n = 15 studies) [166]. The authors hypothesized the possibility of an underestimation of these effects since a subset of studies that clinically ascertained T2D and not through self-reporting yielded higher RR estimates [166]. Furthermore, an increased risk of 87% (RR = 1.87, 95% CI: 1.56–2.25, p < 0.01) and 89% (RR = 1.87, 95% CI: 1.66–2.16, p < 0.01) was observed for the T2D–GI association between 47.6 and 76.1 GI units and for the T2D–GL association between 73 and 257 g/d GL in a 2000 kcal diet, respectively [166]. No significant differences were reported between female and male participants in the GL-T2D relationship, while, in accordance with [164], subjects of European ancestry were significantly associated with both GI and GL and met both criteria of interest for public health (RR > 1.20 and lower 95% confidence limit > 1.10) [166]. Additionally, the results of this meta-analysis met all nine Bradford Hill criteria, a group of guidelines used to verify causality between a risk factor and an outcome, indicating that GI and GL have a causal role in the incidence of T2D [166,167]. An updated meta-analysis including ten studies (publication years 2015–2021), three of which were performed in Asia, failed to find any significant association between carbohydrate intake and the risk of T2D (overall RR = 1.07, 95% CI: 0.94–1.21), consistent with the findings of [162], although a significant association was detected when considering only Asia-based studies (RR = 1.29, 95% CI: 1.15–1.45) [168]. However, although Asian populations are characterized by high carbohydrate intake and reduced insulin-releasing capacity, the difference in follow-up duration between Asian and non-Asian samples could have influenced this result [168]. A recent prospective cohort study, with a median follow-up of 13.6 years and including 161,872 participants, reported a significantly positive association between the intake of starch and the risk of T2D (HR = 1.31, 95% CI: 1.16–1.48, p < 0.0001 by comparing the fifth with the lowest quintile) [169]. Considering various food sources, a higher intake of carbohydrates from starchy vegetables was associated with a 19% increased risk of T2D (fifth vs. first quintile, HR = 1.19, 95% CI: 1.09–1.31, p = 0.0003), corroborating the importance of reducing the consumption of refined grains and starchy vegetables [169].
The overall results indicate that diets characterized by high GI and GL are generally strongly associated with the incidence of T2D in healthy subjects, with RRs reported to be between 1.08 and 1.27 and between 1.03 and 1.26 in the T2D-GI and T2D-GL relationships, respectively, which, despite the small excesses, may translate into important implications for public health. Conversely, the association between carbohydrate intake and T2D risk appears somewhat controversial. However, in this framework, the assessment of this relationship should not only analyze the daily amount and type of carbohydrates, but also the circadian timing of food intake, which could be related to a greater risk of cardiometabolic diseases. Furthermore, the generally high heterogeneity between studies reflects a wide range of exposures reported across publications due to the variety of dietary assessment tools (there are more than 150 different databases worldwide), which makes it difficult to compare data collected in different countries, leading to misclassification of dietary intake and, consequently, to a possible overestimation of the association between dietary intake and T2D risk. Therefore, future studies should use standardized methods for exposure assessment to minimize systematic errors. At the same time, studies conducted in certain geographic areas, such as Africa and South America, are not yet sufficiently explored, while research involving susceptible subject groups, like individuals with high BMI and/or a family history of diabetes or cardiometabolic diseases, is warranted.

3.3.1. Carbohydrate Intake and the Impact on Glycemic Control

As discussed in the previous section, while GI and GL play a substantial role in contributing to the incidence of T2D, a lower GI and a higher intake of dietary or cereal fiber result in an additive decrease in T2D risk [167]. In fact, a series of meta-analyses of RCTs have underscored the beneficial effects of a low-GI diet on glycemic control in diabetic patients, as compared with high-GI diets, with significant differences in HbA1c and fructosamine (also known as glycated serum albumin, a marker of glycemic control up to six weeks) [116,170,171,172,173,174], fasting blood glucose [172,173,174], and other established cardiometabolic risk factors including LDL cholesterol, non-high-density lipoprotein (HDL) cholesterol, total cholesterol, apolipoprotein B, triglycerides, body weight, BMI, and systolic blood pressure [116,172,173,175,176]. Low-GI/GL diets or low carbohydrate intake did not affect either HOMA-IR, HDL cholesterol, waist circumference, diastolic pressure [172,173,176], nor inflammatory biomarkers such as C-reactive protein (CRP), tumor necrosis factor alpha, interleukin-6, or leptin, which can be involved in the development of insulin resistance and subsequently lead to T2D [177]. Conversely, a low-GI/GL diet is inversely associated with fasting insulin, both systolic and diastolic pressure, and CRP [178,179] (Figure 3). Overall, these findings, which confirm the effectiveness of the low-GI/GL dietary pattern strategy in producing a relevant improvement in the major targets of glycemic control in people with prediabetes or diabetes and with a concomitant reduction in the number of hypoglycemic episodes, are in line with the recommendations of the American Diabetes Association, which encourage the consumption of non-starchy vegetables, whole fruits, legumes, and WGs [173,180]. Furthermore, based on a recent meta-analysis including 23 published and unpublished RCTs for a total of 1357 patients with T2D, moderate to little evidence suggests that subjects adhering to a low-carbohydrate diet (LCD) for six months may achieve higher diabetes remission rates (around 30%) concurrently with reduced medication use, increased weight loss, and improved triglyceride profile when compared to patients undergoing low-fat diets, which are among the most common diets recommended for the management of T2D [181]. These beneficial effects tend to decline after 12 months, when increased levels of LDL were observed, while long-term LCD can lead to adverse outcomes, including a 20% increase in mortality, suggesting that LCD represents an effective strategy when used only for short-term periods [181]. It should be noted, however, that these results are profoundly influenced by the source of the macronutrient replacement, as excess of mortality can be detected when carbohydrates were exchanged for animal-derived fat or protein [98,181]. A recent 16-year prospective cohort study revealed that replacing 5% energy from refined grains or starchy vegetables with an equal amount of WGs or non-starchy vegetables was associated with a significant decrease in the risk of T2D, ranging from 8 to 17%, highlighting the importance of food sources in the primary prevention of T2D [169].

3.3.2. Nutrigenetic Interaction Between Carbohydrates and Type 2 Diabetes Genes

The variant rs2943641 of IRS1, which plays a central role in the insulin signaling pathway, appears to interact with macronutrient intake in modulating T2D risk [182]. rs2943641 IRS1 interacts with sex and carbohydrate intake, and females carrying the T allele exhibit a reduced risk of developing T2D in the lowest tertile of carbohydrate intake [183]. A 2-year RCT comparing the effects of energy-restricted diets on body weight in overweight and obese subjects reported a significant interaction between IRS1 rs2943641 genotype and dietary groups on changes in weight, insulin resistance, and HOMA-IR after adjustment for covariates [184]. In fact, at 6 months, participants in the highest-carbohydrate-intake group and with the CC genotype showed a greater decrease in insulin levels than subjects who did not have this genotype, while an opposite effect was observed in the group with the lowest carbohydrate diet [184]. A similar interaction between the IRS1 rs2943641 genotype and the carbohydrate diet groups was also found for changes in HOMA-IR [184]. At 2 years of follow-up, the effect of the CC genotype on changes in insulin and HOMA-IR remained significant in the highest-carbohydrate-diet group, demonstrating that the IRS1 variant rs2943641 may improve insulin resistance in response to weight-loss diets [184]. In the study by Zheng et al. [185], two IRS1 variants (rs7578326 and rs2943641) were tested for their associations with insulin resistance, T2D, and MetS, as well as their interactions with diet in two populations of different ancestries: the first one (Genetics of Lipid Lowering Drugs and Diet Network—GOLDN) composed of 820 subjects, all of European descent, and the second one (Boston Puerto Rican Health Study—BPRHS) composed of 844 participants mostly of European descent (57.4%) and for the remaining parts African (27.4%) and Native American (15.4%). Meta-analysis revealed a lower risk of impaired fasting glucose, T2D, and MetS among T-allele homozygotes compared to C-allele carriers in the SNP rs2943641 and of T2D and MetS in T-allele homozygotes compared to G-allele carriers in the rs7578326 variant [185]. Both variants interacted with dietary carbohydrates in modulating the risk of HOMA-IR. In the GOLDN population, SNP rs7578326 G-allele carriers and rs2943641 T-allele carriers had significantly lower HOMA-IR than noncarriers when the short fatty acid (SFA)-to-carbohydrate ratio was low, supporting a protective effect of a high-carbohydrate and low-fat diet against T2D, as previously observed in [184], but in contrast with findings from [183], probably due to differences in study design and dietary intake ranges [183]. Similarly, in the BPRHS population, rs7578326 G-allele carriers showed lower HOMA-IR than A-allele homozygotes only in the case of a low content of dietary monounsaturated fatty acid and glycemic load [185]. Furthermore, while in the BPRHS population no significant interactions between IRS1 variants and carbohydrates influenced the risk of T2D, impaired fasting glucose levels and MetS in the GOLDN population subjects with the rs7578326 G allele and those with the rs2943641 T-allele had a reduced risk of MetS compared to AA and CC carriers, respectively, only when SFA-to-carbohydrate ratio was ≤0.24, thus suggesting the importance of developing specific dietary recommendations in different populations [185]. Consistently, Gao et al. [109], using detailed dietary data from 120,343 participants from the UK Biobank study, in which 2878 participants developed T2D over 8.4 years of follow-up from the latest dietary assessment, did not identify any significant association between a dietary pattern characterized by a high intake of sugar-sweetened beverages, fruit juice, table sugars and preserves, in the context of a low intake of high-fat cheese and butter, and incidence of T2D. Low SFA levels and concomitant consumption of adequate amounts of fiber from fruits and vegetables may account for most of this effect, although other unconsidered nutrients may explain the remaining variability implicated in the disease pathway [109].
To sum up, specific haplotypes of IRS1 variants are associated with a reduced risk of insulin resistance and T2D, and this relationship appears to be modulated by carbohydrate intake and the SFA-to-carbohydrate ratio, in line with recent data from a large prospective observational study. Nonetheless, these findings should be confirmed by studies performed across different populations to ensure reproducibility and increase statistical power, with repeated exposure measurements that also include nutritional biomarkers and using experimental settings that allow for dietary manipulation in subjects with different genetic profiles, in order to definitely establish a causal association between gene–diet interactions and the incidence of T2D.

4. The Carbohydrate–Epigenetics Relationship in Type 2 Diabetes

Epigenetics, which refers to the inheritable and reversible changes in gene expression without alterations in DNA sequences, represents an interface between endogenous (pathological conditions) and exogenous environmental determinants (diet, lifestyle, toxins) and the genome, which is able to affect cells, tissues, or a whole organism and can transmitted to the next generation [24,186,187]. Epigenetic phenomena, which are implicated in a wide range of cellular processes such as cell differentiation, parental imprinting, genomic stability, and X-chromosome inactivation, include changes in DNA methylation, covalent modifications of histones—both of which can modify chromatin structure and thus modulate access to transcription factors—and non-coding RNA interference, which controls gene expression at the RNA level [187,188,189]. In DNA methylation, the most important epigenetic mark, a methyl group, is mainly added in the 5′ position of the cytosine residues of cytosine–guanine dinucleotides (CpG), frequently forming dense repeat sequences, known as CpG islands, in the promoter region [24]. DNA methyltransferases (DNMT1, which maintains methylation during DNA replication and de novo enzymes, DNMT3a, and DNMT3b) are responsible for the transfer of methyl groups to DNA, which generally results in the inhibition of gene expression when methylation occurs in regions close to the transcription start site and in the enhancer region [24,186,187]. Conversely, the hydroxymethylation of 5-methyl-cytosine, catalyzed by DNA demethylases termed ten-eleven translocation proteins, leads to the activation of transcriptional activity [24,187]. If DNA methylation is a reversible modification with a crucial role in various physiological processes, aberrant DNA methylation profiles caused by genetic mutations or environmental factors may contribute to the occurrence of diseases including autoimmune diseases, cancer, and metabolic and neurological disorders [24,188]. Modifications of histones (globular proteins that serve to package and organize DNA within the nucleus [190]) are another form of epigenetic information that typically occurs post translationally at their N- and C-terminal tails [191]. They comprise methylation, acetylation, ADP-ribosylation, glycosylation, phosphorylation, SUMOylation, and ubiquitination, which, changing the electronic charge and structures of these histone tails, may cause alterations in chromatin status, resulting in the activation or silencing of expression [192,193,194]. Accumulating data indicate that histone modifications are closely associated with the development of inflammatory diseases such as T2D, Alzheimer’s disease, asthma, atherosclerosis, inflammatory bowel disease, and psoriasis [194]. Non-coding RNAs, i.e., RNAs that are not translated into proteins, have a regulatory role and can be divided into two categories based on size: short chain non-coding RNAs (micro-RNAs—miRNAs, piwi-interacting RNAs, and small interfering RNAs—siRNAs) and long non-coding RNAs (lncRNAs) [195]. They can act at transcriptional levels alone, leading to gene silencing (miRNAs and siRNAs), or both at transcriptional and post-transcriptional levels by interacting with enhancers, promoters, chromatin-modifying complexes, and miRNAs (lncRNAs) [195,196]. By modulating gene expression, miRNAs have the ability to govern various cellular processes and, consequently, their dysregulation has been associated with diseases such as autoimmune and inflammatory diseases, cardiovascular disease, and neurodegenerative disorders [197]. LncRNAs have also progressively emerged as regulators of the inflammatory response through the precise control of inflammation-related gene expression and are therefore hypothesized to play a crucial role in diabetic retinopathy, a serious complication of T2D, whose hallmarks include inflammation and apoptosis [198].

4.1. Epigenetics in Type 2 Diabetes: The Role of DNA Methylation

As reported in the previous sections, genetic susceptibility in T2D does not cover the total amount of cases, and genetic variants account for approximately 20% of heritability. Therefore, environmental and lifestyle factors, contributing to epigenetic changes, may explain the so-called missing heritability in T2D and differences in disease susceptibility between individuals [24,199,200]. A growing body of evidence indicates that the dysregulation of expression of non-coding RNA, particularly those involved in insulin secretion and glucose and lipid metabolism, can contribute to T2D development [201,202], while histone modifications appear to be involved in the pathophysiology of T2D, affecting the development of pancreatic β cells and insulin release, and complications of T2D [203,204]. However, CpG methylation has been the most widely studied epigenetic phenomenon to date, with dozens of publications showing the association between changes in DNA methylation profile and risk of T2D. Initial studies evaluating DNA methylation in candidate genes for T2D (e.g., IRS, GLP1-R, encoding the receptor for GLP-1, PPARGC1A, encoding the peroxisome proliferator-activated receptor γ coactivator-1 alpha, a transcriptional co-activator involved in cellular energy metabolism [205]) found that the DNA methylation level in pancreatic islets of T2D subjects was lower than that of non-diabetic control, with a consequent reduced expression of these pivotal genes, which can explain the impaired insulin secretion, high glucose, and Hb1Ac levels [189]. The introduction of the Illumina sequencing array, which presents cost-effectiveness and overall good accuracy, has allowed for identification of methylation sites in thousands of genes expressed in other tissues, such as the liver, skeletal muscle, and adipose tissue [206,207]. Beyond islet cells, increased methylation and downregulation of PPARGC1A have been detected in the skeletal muscle and adipose tissue of insulin-resistant and obese individuals at high risk of T2D [208,209]. A recent study documented substantial changes in the methylation patterns of 921 genes expressed in skeletal muscles and involved in calcium/lipid metabolism and mitochondrial function in obese individuals 52 weeks after bariatric surgery, with a concomitant improvement in insulin sensitivity [210]. Overall, while these data suggest that DNA methylation processes are related to the reprogramming of gene expression in response to metabolic changes, it is still unclear whether these alterations directly influence insulin action or whether the improvement in insulin sensitivity is attributable to weight loss alone [210,211]. Within a systematic review including 47 studies for a total of 10,823 participants and 3358 T2D cases, Muka et al. [207] reported no consistent association between global DNA methylation and T2D and glycemic traits, although the cross-sectional design of most studies, together with the small sample size, the frequent lack of adequate adjustment for confounders, and the lack of standardized approaches in epigenome-wide association studies (EWASs), may have considerably affected the results. A subsequent systematic review [212] selected 37 studies that overall highlighted reproducible differential methylation in a set of genes in blood involved in glucose and lipid metabolism and energy intake and expenditure (e.g., FTO encoding a 2-oxoglutarate-dependent nucleic acid demethylase whose variation in expression is associated with the regulation of food intake and energy balance [213], TCF7L2) as well as in insulin secretion and function (e.g., SLC30A8, which encodes a zinc transporter expressed primarily in pancreatic β-cells and which plays a pivotal role in maintaining glucose homeostasis [214], and GIPR) in different population groups. Of note, considering that up to 25% of all SNPs in the genome contain CpG sites undergoing methylation or demethylation, a study included in this review suggests that SNPs associated with 20 genes may also cause their differential methylation, thus contributing to the pathogenesis of T2D [212]. A systematic review of 19 EWASs (of which 18 out of 19 had a cross-sectional design) assessing the association between DNA methylation and T2D or glycemic traits identified differentially methylated sites in the blood: TXNIP, which encodes thioredoxin-interacting protein, representing the main regulator of glucose balance [215]; ABCG1, encoding a member of the ATP-binding cassette protein family implicated in cholesterol transport and glucose homeostasis [216]; CPT1A, which encodes for the enzyme carnitine palmitoyltransferase 1, which initiates the mitochondrial oxidation of long-chain lipids [217]; and SREBF1, which encodes sterol regulatory element-binding proteins, transcription factors involved in the regulation of lipid and glucose metabolism [218]. These CpGs were associated with T2D status, sustained hyperglycemia levels, fasting blood glucose, and insulin resistance independently of ethnicity and environmental exposures, although the cross-sectional design of most studies precludes determining whether changes in DNA methylation precede the onset of T2D [199,219]. Furthermore, some included studies reported significant methylation differences at liver and pancreas loci in individuals with T2D compared to control individuals butshowed no overlap with blood-based EWAS results, thus indicating tissue-specific changes [199]. Within an incident T2D case–cohort study nested within the population-based EPIC-Norfolk study, a prospective cohort study recruiting 25,639 individuals, Cardona et al. [220] confirmed the results of [199], identifying 18 methylation variable positions in whole blood strongly associated with incident T2D, of which the most robust involved TXNIP (decreased methylation), ABCG1, and SREBF1 (both increased methylation). Additionally, the authors reported a causal role of methylation at the cg00574958 site in CPT1A in T2D [220]. Therefore, these DNA methylation markers are plausibly related to T2D development via glucose- and obesity-related pathways that exert their effects many years before the disease onset [220]. A meta-analysis of EWAS results from five European cohorts, with a total 1250 cases and 1950 controls and based on blood samples collected 7–10 years before the diagnosis of T2D, identified 76 CpGs that were significantly and differently methylated in subjects with incident T2D compared to healthy subjects [220]. Nonetheless, the adjustment for BMI alone, or for BMI, smoking, and years of follow-up, reduced the significant associations to only 4 and 3 genes, respectively (including TXNIP and ABCG1), suggesting that BMI may influence the relationship between DNA methylation and T2D incidence [221]. A recent systematic review including 32 studies found that overall, among a total of 130 selected differentially methylated genes across tissues (i.e., adipose tissue, blood cells, liver, pancreatic isles) between T2D cases and healthy controls, ABCG1 and TXNIP (hypermethylated in blood), PPARGC1A (hypermethylated in skeletal muscle), and PTPRN2 (hypermethylated in blood, hypomethylated in adipose tissue, and encoding the protein tyrosine phosphatase receptor type N2 that is involved in insulin response to glucose levels [222]) showed a differential methylation pattern in more than one study [223].
Based on current data, epigenetics could explain the apparent missing heritability of T2D, with epigenetic alterations in genes implicated in insulin secretion (GIPR, SLC30A8, PTPRN2), glucose homeostasis and lipid metabolism (TXNIP, CPT1A, SREBF1, ABCG1), and energy balance (FTO, PPARGC1A) in blood, as well as in insulin-responsive tissues. These epigenetic patterns, by modifying the expression of crucial genes, some of which are candidate genes for T2D, potentially contribute to T2D pathogenesis, as documented in recent prospective studies, pointing to potential development of novel strategies of primary prevention and possible treatment of this disease. However, the large variability between studies due to the different approaches used to measure DNA methylation, the frequently applied cross-sectional or case–control design, and the lack of key confounding covariates such as BMI, alcohol consumption, lifestyle, and presence of comorbidities in the epigenetic analysis prevent direct comparison of the results and inference of a causal relationship, making it necessary to perform longitudinal studies employing standardized analysis methods and repeated measurements of methylation.

4.2. Carbohydrate–Epigenetics Interactions in Type 2 Diabetes

In Section 3.2.2 and Section 3.3.2, we discussed how the interactions between carbohydrate intake and certain gene variants related to T2D development may modulate this relationship. Likewise, different diet regimens, such as high-fat feeding and global caloric restriction applied in experimental and human interventional studies, have been widely established to impact on the human epigenome (reviewed in [24,189]). An excessive accumulation of fat induces a myriad of metabolic abnormalities, including insulin resistance, dyslipidemia, β-cell dysfunction, prediabetes, and T2D [224]. Therefore, obesity, especially when it involves increased abdominal and intra-abdominal fat distribution, represents a major contributing factor to the increasing worldwide prevalence of T2D [224]. Maternal diet (high-fat, low-protein, or nutrient-restriction patterns) can cause great epigenetic effects in both mothers and, given the high susceptibility of developmental stages like the intrauterine period, in offspring, increasing the possibility of developing metabolic disorders including obesity and T2D in adulthood [186]. Maternal caloric restriction, including vitamin B12 and folate deficiency, may alter the methylation profile in the promoter region of hepatic genes, resulting in increased adiposity and insulin resistance in the offspring in later life [225]. The methyl groups for DNA methylation come from S-adenosylmethionine, the second most common enzymatic cofactor after ATP, which in turn originates from the essential amino acid methionine via hepatic one-carbon metabolism [226,227]. Indeed, vitamin B12 acts as a cofactor in the methionine synthase reaction, which catalyzes the conversion of homocysteine to methionine and is dependent on methylfolate, which provides methyl groups for the synthesis of S-adenosyl methionine [225]. Consistently, diabetic subjects with hepatic hypomethylation are characterized by reduced circulating folate levels compared to non-diabetic subjects, while, conversely, folate intake in young adulthood is significantly inversely associated with the incidence of T2D, along with plasma homocysteine and insulin [228,229]. Therefore, any dietary disturbance, which may also involve fluctuations in methionine concentration, can have an impact on DNA methylation and, if occurring during intrauterine life, leaves a signature and manifests its effects during subsequent generations when the altered gene expression may contribute to the pathogenesis of metabolic disorders such as T2D [226].
CPT1A is among the major genes subject to differential methylation in T2D, with a possible causal role in this condition. Extensively expressed in the liver, in addition to the adipose tissue, fibroblast, kidney, lymphocytes and pancreas, CPT1A catalyzes the conversion of long-chain acyl-coenzyme (Co)A to acyl-carnitine that, once entering the mitochondrial matrix, is converted to acyl-CoA, which in turn participates in the acid β-oxidation cycle [230,231]. Therefore, differential expression of CPT1A may explain its crucial role in a series of physiological processes, including glucose synthesis, insulin release, and appetite control [232]. A genome-scale analysis conducted on sixty subjects and paired-sex sibling controls demonstrated that exposure to famine during early gestation (in the setting of Dutch Hunger Winter at the end of the World War II) was associated with differential DNA methylation at open chromatin regions and enhancers in six genes, including CPT1A [233]. Although the authors could not rule out that changes in DNA methylation may have occurred over the six decades since the exposure and DNA measurements, they found no influence of age and lifestyle on DNA methylation patterns [233]. In early human studies, while high levels of methylation at CPT1A cg00574958 have been associated with a decrease in BMI and waist circumference [234] as well as in fasting triglycerides, high and medium levels of very low-density-lipoprotein cholesterol and in the small subfraction of LDL only [235,236], a lower methylation at CPT1A was observed following a high-fat meal [237]. Within an EWAS including 846 participants of European descent, Das et al. [238] also observed a significantly inverse relationship between methylation at cg00574958 and cg17058475 and the presence of MetS, and these results were also replicated in younger subjects of both European American and African American ancestry. Since reduced CPT1A methylation and the resulting increase in gene expression appear to be related to improved transport and metabolism of triglycerides and a more favorable lipid profile, it is plausible that MeS is associated with hypermethylation at this site [235,238]. Therefore, the unexpected result of Das’ study could be attributed to a change in CPT1A methylation promoted by MetS itself [238]. On the other hand, CPT1A is regulated by various environmental factors, including dietary conditions [230]. Indeed, the combination of a high-fat diet during early life and adulthood in rodents induces increased CPT1A expression and hepatic lipid accumulation [239], as previously observed by Lai et al. in an EWAS [237]. Conversely, experiments in rodents reported a significant relationship between high fructose intake and increased DNA methylation at CPT1A promoter regions [240]. Interestingly, CPT1A is a target of PPARα, whose transcriptional levels are also thought to be reduced due to promoter hypermethylation following fructose consumption, and this can also explain the resulting decreased levels of CPT1A [235,240]. Considering that PPARα is a pivotal transcription factor functioning as a lipid sensor in the liver and thus regulating the expression of numerous genes involved in metabolic processes, including peroxisomal and mitochondrial β-oxidation, epigenetic variations within PPARα lead to a downregulation of β-oxidation activity, promoting the development of pathological conditions such as hyperlipidemia, obesity, and T2D [240,241]. Previously, Nagai et al. [242] showed that high-fructose feeding suppressed hepatic PPARα expression in rats, also observing a direct effect of fructose on PPARα expression in primary cultured hepatocytes, which causes cellular lipid accumulation. Conversely, fenofibrate, an activator of PPARα and a triglyceride-lowering drug, increases the PPARα protein content, also affecting the expression of its target genes, such as those implicated in β-oxidation [242]. A recent study by Lai et al. [232] evaluated the association between both carbohydrate and fat consumption and cg00574958 methylation at CPT1A and the risk of metabolic disease in three populations, for a total of nearly 4000 subjects. In all the populations analyzed and even with a stronger effect, the meta-analysis of the three populations revealed that carbohydrate intake was significantly and positively correlated with CPT1A-cg00574958 methylation, resulting in decreased gene expression [238]. In contrast, fat intake was negatively associated with the level of gene methylation, as also observed in [238]. In particular, the strongest association was observed between CPT1A-cg00574958 methylation and total carbohydrate intake, followed by consumption of complex and simple carbohydrates [238]. CPT1A-cg00574958 expression was also significantly positively associated with fasting glucose and triglyceride levels and BMI, indicating that the methylation of CPT1A is a mediator of the effects of carbohydrate intake on metabolic parameters [238]. On the other hand, carbohydrate intake had a significant yet negative effect on all the metabolic traits assessed, i.e., glucose, triglycerides, BMI, hypertension, MetS, and T2D, due to the mediating action of CPT1A methylation [238].
Therefore, several lines of evidence suggest that not only does CPT1A have a possible causal role in T2D, an effect mediated by differential methylation patterns, but carbohydrate intake is crucial in inducing CPT1A methylation, thereby influencing the risk of developing MetS and T2D. These findings are supported by both experimental and observational studies, although the absence of clinical controlled studies prevents ascertaining a causal relationship between high-carbohydrate diets and CPT1A methylation.

5. Conclusions and Future Perspectives

The current state of knowledge identifies nutrigenetics, nutrigenomics, and nutritional epigenetics as key components in the modulation of the risk of a complex multifactorial condition such as T2D, in which genetics and environmental factor interactions play a key role in disease development. In recent decades, research attention has increasingly turned to diet and, in general, lifestyle as critical determinants in contributing to the risk of T2D. Carbohydrates, which in healthy dietary patterns such as the Mediterranean diet represent the main macronutrient, have been differently associated with diseases and mortality risk depending on both the amount and the type of carbohydrates ingested. While WGs, containing valuable elements including fiber, β-glucan, and polyphenols, which lower carbohydrate digestion by inducing the action of incretin hormones and, at the same time, promote insulin secretion and modulate the composition of the intestinal microbiota, have generally been linked to a reduced incidence of T2D, the opposite effect is observed following meals characterized by elevated GI and GL, despite conflicting results due to heterogeneity between studies (Figure 4).
From this foundation, a significant branch of scientific research has started focusing on so-called “functional foods” [243], foods that provide a scientifically proven specific health benefit beyond their nutritional format [244]. Such compounds allow for enhancing the health and well-being status of an individual, both in case they are not affected by clinically relevant disorders or if they present diseases like T2D. In that, functional foods can deliver a significant benefit to the health status of patients with T2D, but to fully enter the diet of such individuals they must face cultural hurdles and, in many cases, issues related to their palatability [245]. In such a framework, sensory and emotional analysis should be totally included in the overall pipeline of functional food production and functionalization, with traditional methods of sensory analysis placed side-by-side with instrumental measurements of chemicals contained within food and by emotional analysis, having the potential to reveal the implicit psychophysiological activation brought about by the compound and the related chemosensory stimuli on the end-users [246,247].
Therefore, if a WG-based diet is crucial in controlling glycemic response and, in general, in preventing the onset of non-communicable chronic diseases, future intervention studies should be performed both to improve the understanding of which component in WGs is mainly involved in reducing T2D risk and to better clarify which genes variants are involved in this process. TCF7L2 represents the main gene implicated in the development of T2D, with the rs7903146 variant associated with one in five cases and, in the presence of TT genotype, appearing to interact with a high consumption of cereal fiber. Likewise, one or two copies of the C allele in GCKR rs780094 confer an increased risk of developing T2D in the case of WG consumption. In contrast, other TCF7L2 SNPs, together with selected variants of NOTCH2 and ZEBD2, are associated with a decreased risk of T2D in relation to a higher WG or dietary fiber intake, although with limited evidence, suggesting that fiber and other micronutrients contained in WGs have a protective effect against the incidence of T2D independently of genetic variations. On the other hand, a relevant interaction has been reported between the IRS1 rs2943641 CC variant and high carbohydrate intake, while the T and G carriers exhibit an improvement in insulin sensitivity, especially in the presence of low SFA consumption. Nonetheless, these results should be interpreted with caution, given the underrepresentation of ethnic groups other than those of European descent, the wide variety of dietary assessment, and the paucity of clinical studies, which would allow for an accurate control of macronutrient intake (Table 4).
Future interventional as well as large-scale observational prospective studies on populations of different ethnicities, such as those from Africa, Asia, and South America, are warranted to confirm the published findings and, possibly, to search for further relevant interactions between known loci and carbohydrate intake in modulating the development of T2D. In the meantime, experimental and clinical studies aimed at establishing which compounds in WGs are mainly involved in reducing the risk of T2D could provide valuable information for planning supplementation and nutritional programs, also based on the use of functional foods, in the framework of disease prevention and a personalized treatment strategy.
Considering that the strongest genetic variants account for approximately 20% of T2D heritability, epigenetics has proven to be decisive in explaining the missing heritability of T2D, in addition to rare variants. Differential methylation patterns, which determine a change in the expression of genes implicated in insulin release, energy balance, and glucose and lipid metabolism in blood and various tissues, have been shown to be crucial in modulating T2D risk. Hypermethylation at CPT1A cg00574958 is related to reduced MetS risk, decreased fasting triglycerides, and improved metabolic parameters. In contrast, a significant yet positive correlation between high fructose and carbohydrate consumption and CPT1A-cg00574958 methylation levels appears to profoundly affect the risk of metabolic traits, designating CPT1A as a mediator of the interaction between carbohydrates and T2D risk. However, despite the promising results, the current lack of longitudinal studies to confirm the provisional data and potentially identify novel biomarkers prevents the establishment of a causal relationship. A more complete picture of the methylome and the discovery of additional epigenetic markers mediating the effects of carbohydrate intake on T2D risk will provide a useful tool to predict individual disease risk and eventually plan appropriate nutritional treatments as adjuvants to traditional therapies.

Author Contributions

Conceptualization, F.G. and A.T.; methodology, F.G.; investigation, F.G.; writing—original draft preparation, F.G. and A.T.; writing—review and editing, F.G. and A.T. All authors have read and agreed to the published version of the manuscript.

Funding

This research received no external funding.

Conflicts of Interest

The authors declare no conflicts of interest.

Abbreviations

The following abbreviations are used in this manuscript:
BMIBody mass index
CpGCytosine–guanine dinucleotides
CVDCardiovascular disease
DNMTDNA methyltransferase
EWASsEpigenome wide association studies
FFQFood frequency questionnaire
GCKRGlucokinase regulator gene
GIGlycemic index
GIPGlucose dependent insulin polypeptide
GIPRGlucose dependent insulin polypeptide receptor
GLGlycemic load
GLP-1Glucagon-like peptide-1
GWASGenome-wide association studies
HbA1cGlycosylated hemoglobin A1c
HDLHigh density lipoprotein
HOMA-IRHomeostatic model assessment of insulin resistance
HRHazard ratio
IRSInsulin receptor substrate
LCDLow-carbohydrate diet
LDLLow-density lipoprotein
LncRNALong non-coding RNA
MetSMetabolic syndrome
miRNAMicro-RNA
PPARPeroxisome proliferator-activated receptor
RCTRandomized controlled trial
RRRelative risk
SCFAShort-chain fatty acid
SFAShort fatty acid
SNPSingle-nucleotide polymorphisms
T2DType 2 diabetes
TCF7L2Transcription factor 7-like 2
WGsWhole grains

References

  1. Saeedi, P.; Petersohn, I.; Salpea, P.; Malanda, B.; Karuranga, S.; Unwin, N.; Colagiuri, S.; Guariguata, L.; Motala, A.A.; Ogurtsova, K.; et al. IDF Diabetes Atlas Committee. Global and regional diabetes prevalence estimates for 2019 and projections for 2030 and 2045: Results from the International Diabetes Federation Diabetes Atlas, 9th edition. Diabetes Res. Clin. Pract. 2019, 157, 107843. [Google Scholar] [CrossRef] [PubMed]
  2. Arroyave, F.; Montaño, D.; Lizcano, F. Diabetes Mellitus Is a Chronic Disease that Can Benefit from Therapy with Induced Pluripotent Stem Cells. Int. J. Mol. Sci. 2020, 21, 8685. [Google Scholar] [CrossRef] [PubMed]
  3. International Diabetes Federation. IDF Diabetes Atlas 10th Edition. 2021. Available online: https://diabetesatlas.org/atlas/tenth-edition/ (accessed on 24 February 2025).
  4. Lu, X.; Xie, Q.; Pan, X.; Zhang, R.; Zhang, X.; Peng, G.; Zhang, Y.; Shen, S.; Tong, N. Type 2 diabetes mellitus in adults: Pathogenesis, prevention and therapy. Signal Transduct. Target. Ther. 2024, 9, 262. [Google Scholar] [CrossRef] [PubMed]
  5. Khan, M.A.B.; Hashim, M.J.; King, J.K.; Govender, R.D.; Mustafa, H.; Al Kaabi, J. Epidemiology of Type 2 Diabetes-Global Burden of Disease and Forecasted Trends. J. Epidemiol. Glob. Health 2020, 10, 107–111. [Google Scholar] [CrossRef] [PubMed]
  6. Daryabor, G.; Atashzar, M.R.; Kabelitz, D.; Meri, S.; Kalantar, K. The Effects of Type 2 Diabetes Mellitus on Organ Metabolism and the Immune System. Front. Immunol. 2020, 11, 1582. [Google Scholar] [CrossRef] [PubMed]
  7. Risk Factor Collaboration (NCD-RisC). Worldwide trends in diabetes prevalence and treatment from 1990 to 2022: A pooled analysis of 1108 population-representative studies with 141 million participants. Lancet 2024, 404, 2077–2093. [Google Scholar] [CrossRef] [PubMed]
  8. Tancredi, M.; Rosengren, A.; Svensson, A.M.; Kosiborod, M.; Pivodic, A.; Gudbjörnsdottir, S.; Wedel, H.; Clements, M.; Dahlqvist, S.; Lind, M. Excess Mortality among Persons with Type 2 Diabetes. N. Engl. J. Med. 2015, 373, 1720–1732. [Google Scholar] [CrossRef] [PubMed]
  9. Ye, J.; Wu, Y.; Yang, S.; Zhu, D.; Chen, F.; Chen, J.; Ji, X.; Hou, K. The global, regional and national burden of type 2 diabetes mellitus in the past, present and future: A systematic analysis of the Global Burden of Disease Study 2019. Front. Endocrinol. 2023, 14, 1192629. [Google Scholar] [CrossRef] [PubMed]
  10. Wang, B.; Fu, Y.; Tan, X.; Wang, N.; Qi, L.; Lu, Y. Assessing the impact of type 2 diabetes on mortality and life expectancy according to the number of risk factor targets achieved: An observational study. BMC Med. 2024, 22, 114. [Google Scholar] [CrossRef] [PubMed]
  11. Ali, O. Genetics of type 2 diabetes. World J. Diabetes 2013, 4, 114–123. [Google Scholar] [CrossRef] [PubMed]
  12. Ortega, Á.; Berná, G.; Rojas, A.; Martín, F.; Soria, B. Gene-Diet Interactions in Type 2 Diabetes: The Chicken and Egg Debate. Int. J. Mol. Sci. 2017, 18, 1188. [Google Scholar] [CrossRef] [PubMed]
  13. Vujkovic, M.; Keaton, J.M.; Lynch, J.A.; Miller, D.R.; Zhou, J.; Tcheandjieu, C.; Huffman, J.E.; Assimes, T.L.; Lorenz, K.; Zhu, X.; et al. Discovery of 318 new risk loci for type 2 diabetes and related vascular outcomes among 1.4 million participants in a multi-ancestry meta-analysis. Nat. Genet. 2020, 52, 680–691. [Google Scholar] [CrossRef] [PubMed]
  14. DeForest, N.; Majithia, A.R. Genetics of Type 2 Diabetes: Implications from Large-Scale Studies. Curr. Diabetes Rep. 2022, 22, 227–235. [Google Scholar] [CrossRef] [PubMed]
  15. Harrington, J.M.; Phillips, C.M. Nutrigenetics: Bridging two worlds to understand type 2 diabetes. Curr. Diabetes Rep. 2014, 14, 477. [Google Scholar] [CrossRef] [PubMed]
  16. Berná, G.; Oliveras-López, M.J.; Jurado-Ruíz, E.; Tejedo, J.; Bedoya, F.; Soria, B.; Martín, F. Nutrigenetics and nutrigenomics insights into diabetes etiopathogenesis. Nutrients 2014, 6, 5338–5369. [Google Scholar] [CrossRef] [PubMed]
  17. Bouchard, C.; Ordovas, J.M. Fundamentals of nutrigenetics and nutrigenomics. Prog. Mol. Biol. Transl. Sci. 2012, 108, 1–15. [Google Scholar] [PubMed]
  18. Marcum, J.A. Nutrigenetics/Nutrigenomics, Personalized Nutrition, and Precision Healthcare. Curr. Nutr. Rep. 2020, 9, 338–345. [Google Scholar] [CrossRef] [PubMed]
  19. Dietrich, S.; Jacobs, S.; Zheng, J.S.; Meidtner, K.; Schwingshackl, L.; Schulze, M.B. Gene-lifestyle interaction on risk of type 2 diabetes: A systematic review. Obes. Rev. 2019, 20, 1557–1571. [Google Scholar] [CrossRef] [PubMed]
  20. Virolainen, S.J.; VonHandorf, A.; Viel, K.C.M.F.; Weirauch, M.T.; Kottyan, L.C. Gene-environment interactions and their impact on human health. Genes Immun. 2023, 24, 1–11. [Google Scholar] [CrossRef] [PubMed]
  21. Koloverou, E.; Esposito, K.; Giugliano, D.; Panagiotakos, D. The effect of Mediterranean diet on the development of type 2 diabetes mellitus: A meta-analysis of 10 prospective studies and 136,846 participants. Metabolism 2014, 63, 903–911. [Google Scholar] [CrossRef] [PubMed]
  22. Apio, C.; Chung, W.; Moon, M.K.; Kwon, O.; Park, T. Gene-diet interaction analysis using novel weighted food scores discovers the adipocytokine signaling pathway associated with the development of type 2 diabetes. Front. Endocrinol. 2023, 14, 1165744. [Google Scholar] [CrossRef] [PubMed]
  23. Franzago, M.; Santurbano, D.; Vitacolonna, E.; Stuppia, L. Genes and Diet in the Prevention of Chronic Diseases in Future Generations. Int. J. Mol. Sci. 2020, 21, 2633. [Google Scholar] [CrossRef] [PubMed]
  24. Parrillo, L.; Spinelli, R.; Nicolò, A.; Longo, M.; Mirra, P.; Raciti, G.A.; Miele, C.; Beguinot, F. Nutritional Factors, DNA Methylation, and Risk of Type 2 Diabetes and Obesity: Perspectives and Challenges. Int. J. Mol. Sci. 2019, 20, 2983. [Google Scholar] [CrossRef] [PubMed]
  25. Okburan, G.; Gezer, C. Carbohydrates as Nutritional Components for Health and Longevity. In Nutrition, Food and Diet in Ageing and Longevity. Healthy Ageing and Longevity; Rattan, S.I.S., Kaur, G., Eds.; Springer: Berlin/Heidelberg, Germany, 2021; Volume 14. [Google Scholar]
  26. Hu, Y.; Ding, M.; Sampson, L.; Willett, W.C.; Manson, J.E.; Wang, M.; Rosner, B.; Hu, F.B.; Sun, Q. Intake of whole grain foods and risk of type 2 diabetes: Results from three prospective cohort studies. BMJ 2020, 370, m2206. [Google Scholar] [CrossRef] [PubMed]
  27. Alhazmi, A.; Stojanovski, E.; McEvoy, M.; Garg, M.L. Macronutrient intakes and development of type 2 diabetes: A systematic review and meta-analysis of cohort studies. J. Am. Coll. Nutr. 2012, 31, 243–258. [Google Scholar] [CrossRef] [PubMed]
  28. Barber, T.M.; Kabisch, S.; Pfeiffer, A.F.H.; Weickert, M.O. The Health Benefits of Dietary Fibre. Nutrients 2020, 12, 3209. [Google Scholar] [CrossRef] [PubMed]
  29. Lillioja, S.; Wilton, A. Agreement among type 2 diabetes linkage studies but a poor correlation with results from genome-wide association studies. Diabetologia 2009, 52, 1061–1074. [Google Scholar] [CrossRef] [PubMed]
  30. Feng, Y.; Li, X.; Mao, Z.; Huo, W.; Hou, J.; Wang, C.; Li, W.; Yu, S. Heritability Estimation and Environmental Risk Assessment for Type 2 Diabetes Mellitus in a Rural Region in Henan, China: Family-Based and Case-Control Studies. Front. Public Health 2021, 9, 690889. [Google Scholar] [CrossRef] [PubMed]
  31. Almgren, P.; Lehtovirta, M.; Isomaa, B.; Sarelin, L.; Taskinen, M.R.; Lyssenko, V.; Tuomi, T.; Groop, L.; Botnia Study Group. Heritability and familiality of type 2 diabetes and related quantitative traits in the Botnia Study. Diabetologia 2011, 54, 2811–2819. [Google Scholar] [CrossRef] [PubMed]
  32. Meigs, J.B.; Cupples, L.A.; Wilson, P.W. Parental transmission of type 2 diabetes: The Framingham Offspring Study. Diabetes 2000, 49, 2201–2207. [Google Scholar] [CrossRef] [PubMed]
  33. Florez, J.C.; Hirschhorn, J.; Altshuler, D. The inherited basis of diabetes mellitus: Implications for the genetic analysis of complex traits. Annu. Rev. Genom. Hum. Genet. 2003, 4, 257–291. [Google Scholar] [CrossRef] [PubMed]
  34. Poulsen, P.; Grunnet, L.G.; Pilgaard, K.; Storgaard, H.; Alibegovic, A.; Sonne, M.P.; Carstensen, B.; Beck-Nielsen, H.; Vaag, A. Increased risk of type 2 diabetes in elderly twins. Diabetes 2009, 58, 1350–1355. [Google Scholar] [CrossRef] [PubMed]
  35. Hemminki, K.; Li, X.; Sundquist, K.; Sundquist, J. Familial risks for type 2 diabetes in Sweden. Diabetes Care 2010, 33, 293–297. [Google Scholar] [CrossRef] [PubMed]
  36. Dawn Teare, M.; Barrett, J.H. Genetic linkage studies. Lancet 2005, 366, 1036–1044. [Google Scholar] [CrossRef] [PubMed]
  37. Ott, J.; Wang, J.; Leal, S.M. Genetic linkage analysis in the age of whole-genome sequencing. Nat. Rev. Genet. 2015, 16, 275–284. [Google Scholar] [CrossRef] [PubMed]
  38. Del Bosque-Plata, L.; Martínez-Martínez, E.; Espinoza-Camacho, M.Á.; Gragnoli, C. The Role of TCF7L2 in Type 2 Diabetes. Diabetes 2021, 70, 1220–1228. [Google Scholar] [CrossRef] [PubMed]
  39. Kwon, J.M.; Goate, A.M. The candidate gene approach. Alcohol Res. Health 2000, 24, 164–168. [Google Scholar] [PubMed]
  40. Laakso, M.; Fernandes Silva, L. Genetics of Type 2 Diabetes: Past, Present, and Future. Nutrients 2022, 14, 3201. [Google Scholar] [CrossRef] [PubMed]
  41. Prasad, R.B.; Groop, L. Genetics of type 2 diabetes-pitfalls and possibilities. Genes 2015, 6, 87–123. [Google Scholar] [CrossRef] [PubMed]
  42. Vachon, C.M. Genome-wide association studies go green: Novel and cost-effective opportunities for identifying genetic associations. Mayo Clin. Proc. 2011, 86, 597–599. [Google Scholar] [CrossRef] [PubMed]
  43. Suzuki, K.; Hatzikotoulas, K.; Southam, L.; Taylor, H.J.; Yin, X.; Lorenz, K.M.; Mandla, R.; Huerta-Chagoya, A.; Melloni, G.E.M.; Kanoni, S. Genetic drivers of heterogeneity in type 2 diabetes pathophysiology. Nature 2024, 627, 347–357. [Google Scholar] [CrossRef] [PubMed]
  44. Bahaaeldin, A.M.; Seif, A.A.; Hamed, A.I.; Kabiel, W.A.Y. Transcription Factor 7-Like-2 (TCF7L2) rs7903146 (C/T) Polymorphism in Patients with Type 2 Diabetes Mellitus. Dubai Diabetes Endocrinol. J. 2020, 26, 112–118. [Google Scholar] [CrossRef]
  45. Wang, H.; Ren, Y.; Hu, X.; Ma, M.; Wang, X.; Liang, H.; Liu, D. Effect of Wnt Signaling on the Differentiation of Islet β-Cells from Adipose-Derived Stem Cells. BioMed Res. Int. 2017, 2017, 2501578. [Google Scholar] [CrossRef] [PubMed]
  46. Tong, Y.; Lin, Y.; Zhang, Y.; Yang, J.; Zhang, Y.; Liu, H.; Zhang, B. Association between TCF7L2 gene polymorphisms and susceptibility to type 2 diabetes mellitus: A large Human Genome Epidemiology (HuGE) review and meta-analysis. BMC Med. Genet. 2009, 10, 15. [Google Scholar] [CrossRef] [PubMed]
  47. Ding, W.; Xu, L.; Zhang, L.; Han, Z.; Jiang, Q.; Wang, Z.; Jin, S. Meta-analysis of association between TCF7L2 polymorphism rs7903146 and type 2 diabetes mellitus. BMC Med. Genet. 2018, 19, 38. [Google Scholar] [CrossRef] [PubMed]
  48. Le Bacquer, O.; Kerr-Conte, J.; Gargani, S.; Delalleau, N.; Huyvaert, M.; Gmyr, V.; Froguel, P.; Neve, B.; Pattou, F. TCF7L2 rs7903146 impairs islet function and morphology in non-diabetic individuals. Diabetologia 2012, 55, 2677–2681. [Google Scholar] [CrossRef] [PubMed]
  49. Cropano, C.; Santoro, N.; Groop, L.; Dalla Man, C.; Cobelli, C.; Galderisi, A.; Kursawe, R.; Pierpont, B.; Goffredo, M.; Caprio, S. The rs7903146 Variant in the TCF7L2 Gene Increases the Risk of Prediabetes/Type 2 Diabetes in Obese Adolescents by Impairing β-Cell Function and Hepatic Insulin Sensitivity. Diabetes Care 2017, 40, 1082–1089. [Google Scholar] [CrossRef] [PubMed]
  50. Geoghegan, G.; Simcox, J.; Seldin, M.M.; Parnell, T.J.; Stubben, C.; Just, S.; Begaye, L.; Lusis, A.J.; Villanueva, C.J. Targeted deletion of Tcf7l2 in adipocytes promotes adipocyte hypertrophy and impaired glucose metabolism. Mol. Metab. 2019, 24, 44–63. [Google Scholar] [CrossRef] [PubMed]
  51. da Silva Xavier, G.; Loder, M.K.; McDonald, A.; Tarasov, A.I.; Carzaniga, R.; Kronenberger, K.; Barg, S.; Rutter, G.A. TCF7L2 regulates late events in insulin secretion from pancreatic islet beta-cells. Diabetes 2009, 58, 894–905. [Google Scholar] [CrossRef] [PubMed]
  52. Sharma, V.; Patial, V. Peroxisome proliferator-activated receptor gamma and its natural agonists in the treatment of kidney diseases. Front. Pharmacol. 2022, 13, 991059. [Google Scholar] [CrossRef] [PubMed]
  53. Chiarelli, F.; Di Marzio, D. Peroxisome proliferator-activated receptor-gamma agonists and diabetes: Current evidence and future perspectives. Vasc. Health Risk Manag. 2008, 4, 297–304. [Google Scholar] [PubMed]
  54. Basak, S.; Murmu, A.; Matore, B.W.; Roy, P.P.; Singh, J. Thiazolidinedione an auspicious scaffold as PPAR-γ agonist: Its possible mechanism to Manoeuvre against insulin resistant diabetes mellitus. Eur. J. Med. Chem. Rep. 2024, 11, 100160. [Google Scholar] [CrossRef]
  55. Bakhashab, S.; Filimban, N.; Altall, R.M.; Nassir, R.; Qusti, S.Y.; Alqahtani, M.H.; Abuzenadah, A.M.; Dallol, A. The Effect Sizes of PPARγ rs1801282, FTO rs9939609, and MC4R rs2229616 Variants on Type 2 Diabetes Mellitus Risk among the Western Saudi Population: A Cross-Sectional Prospective Study. Genes 2020, 11, 98. [Google Scholar] [CrossRef] [PubMed]
  56. Sarhangi, N.; Sharifi, F.; Hashemian, L.; Hassani Doabsari, M.; Heshmatzad, K.; Rahbaran, M.; Jamaldini, S.H.; Aghaei Meybodi, H.R.; Hasanzad, M. PPARG (Pro12Ala) genetic variant and risk of T2DM: A systematic review and meta-analysis. Sci. Rep. 2020, 10, 12764. [Google Scholar] [CrossRef] [PubMed]
  57. Li, J.; Niu, X.; Li, J.; Wang, Q. Association of PPARG Gene Polymorphisms Pro12Ala with Type 2 Diabetes Mellitus: A Meta-analysis. Curr. Diabetes Rev. 2019, 15, 277–283. [Google Scholar] [CrossRef] [PubMed]
  58. Vergotine, Z.; Yako, Y.Y.; Kengne, A.P.; Erasmus, R.T.; Matsha, T.E. Proliferator-activated receptor gamma Pro12Ala interacts with the insulin receptor substrate 1 Gly972Arg and increase the risk of insulin resistance and diabetes in the mixed ancestry population from South Africa. BMC Genet. 2014, 15, 10. [Google Scholar] [CrossRef] [PubMed]
  59. Stryjecki, C.; Peralta-Romero, J.; Alyass, A.; Karam-Araujo, R.; Suarez, F.; Gomez-Zamudio, J.; Burguete-Garcia, A.; Cruz, M.; Meyre, D. Association between PPAR-γ2 Pro12Ala genotype and insulin resistance is modified by circulating lipids in Mexican children. Sci. Rep. 2016, 6, 24472. [Google Scholar] [CrossRef] [PubMed]
  60. Reza-López, S.A.; González-Gurrola, S.; Morales-Morales, O.O.; Moreno-González, J.G.; Rivas-Gómez, A.M.; González-Rodríguez, E.; Moreno-Brito, V.; Licón-Trillo, A.; Leal-Berumen, I. Metabolic Biomarkers in Adults with Type 2 Diabetes: The Role of PPAR-γ2 and PPAR-β/δ Polymorphisms. Biomolecules 2023, 13, 1791. [Google Scholar] [CrossRef] [PubMed]
  61. Winzell, M.S.; Wulff, E.M.; Olsen, G.S.; Sauerberg, P.; Gotfredsen, C.F.; Ahrén, B. Improved insulin sensitivity and islet function after PPARdelta activation in diabetic db/db mice. Eur. J. Pharmacol. 2010, 626, 297–305. [Google Scholar] [CrossRef] [PubMed]
  62. Wang, Y.; Nakajima, T.; Gonzalez, F.J.; Tanaka, N. PPARs as Metabolic Regulators in the Liver: Lessons from Liver-Specific PPAR-Null Mice. Int. J. Mol. Sci. 2020, 21, 2061. [Google Scholar] [CrossRef] [PubMed]
  63. Sherwani, S.I.; Khan, H.A.; Ekhzaimy, A.; Masood, A.; Sakharkar, M.K. Significance of HbA1c Test in Diagnosis and Prognosis of Diabetic Patients. Biomark Insights 2016, 11, 95–104. [Google Scholar] [CrossRef] [PubMed]
  64. Namghi, S.M. Association of GIPR gene variant on the risk of type 2 diabetes mellitus: A case-control study. Endocunre Metab. Sci. 2023, 13, 100140. [Google Scholar] [CrossRef]
  65. Erfanian, S.; Mir, H.; Abdoli, A.; Roustazadeh, A. Association of gastric inhibitory polypeptide receptor (GIPR) gene polymorphism with type 2 diabetes mellitus in iranian patients. BMC Med. Genom. 2023, 16, 44. [Google Scholar] [CrossRef] [PubMed]
  66. Gasbjerg, L.S.; Gabe, M.B.N.; Hartmann, B.; Christensen, M.B.; Knop, F.K.; Holst, J.J.; Rosenkilde, M.M. Glucose-dependent insulinotropic polypeptide (GIP) receptor antagonists as anti-diabetic agents. Peptides 2018, 100, 173–181. [Google Scholar] [CrossRef] [PubMed]
  67. Fisman, E.Z.; Tenenbaum, A. The dual glucose-dependent insulinotropic polypeptide (GIP) and glucagon-like peptide-1 (GLP-1) receptor agonist tirzepatide: A novel cardiometabolic therapeutic prospect. Cardiovasc. Diabetol. 2021, 20, 225. [Google Scholar] [CrossRef] [PubMed]
  68. Christensen, M.; Vedtofte, L.; Holst, J.J.; Vilsbøll, T.; Knop, F.K. Glucose-dependent insulinotropic polypeptide: A bifunctional glucose-dependent regulator of glucagon and insulin secretion in humans. Diabetes 2011, 60, 3103–3109. [Google Scholar] [CrossRef] [PubMed]
  69. Asmar, M.; Simonsen, L.; Madsbad, S.; Stallknecht, B.; Holst, J.J.; Bulow, J. Glucose-dependent insulinotropic polypeptide may enhance fatty acid re-esterification in subcutaneous abdominal adipose tissue in lean humans. Diabetes 2010, 59, 2160–2163. [Google Scholar] [CrossRef] [PubMed]
  70. Asmar, M.; Simonsen, L.; Arngrim, N.; Holst, J.J.; Dela, F.; Bülow, J. Glucose-dependent insulinotropic polypeptide has impaired effect on abdominal, subcutaneous adipose tissue metabolism in obese subjects. Int. J. Obes. 2014, 38, 259–265. [Google Scholar] [CrossRef] [PubMed]
  71. Barbosa-Yañez, R.L.; Markova, M.; Dambeck, U.; Honsek, C.; Machann, J.; Schüler, R.; Kabisch, S.; Pfeiffer, A.F.H. Predictive effect of GIPR SNP rs10423928 on glucose metabolism liver fat and adiposity in prediabetic and diabetic subjects. Peptides 2020, 125, 170237. [Google Scholar] [CrossRef] [PubMed]
  72. Holst, J.J.; Windeløv, J.A.; Boer, G.A.; Pedersen, J.; Svendsen, B.; Christensen, M.; Torekov, S.; Asmar, M.; Hartmann, B.; Nissen, A. Searching for the physiological role of glucose-dependent insulinotropic polypeptide. J. Diabetes Investig. 2016, 7 (Suppl. 1), 8–12. [Google Scholar] [CrossRef] [PubMed]
  73. Bagger, J.I.; Knop, F.K.; Lund, A.; Vestergaard, H.; Holst, J.J.; Vilsbøll, T. Impaired regulation of the incretin effect in patients with type 2 diabetes. J. Clin. Endocrinol. Metab. 2011, 96, 737–745. [Google Scholar] [CrossRef] [PubMed]
  74. Lavin, D.P.; White, M.F.; Brazil, D.P. IRS proteins and diabetic complications. Diabetologia 2016, 59, 2280–2291. [Google Scholar] [CrossRef] [PubMed]
  75. Boura-Halfon, S.; Zick, Y. Phosphorylation of IRS proteins, insulin action, and insulin resistance. Am. J. Physiol. Endocrinol. Metab. 2009, 296, E581–E591. [Google Scholar] [CrossRef] [PubMed]
  76. Sesti, G.; Federici, M.; Hribal, M.L.; Lauro, D.; Sbraccia, P.; Lauro, R. Defects of the insulin receptor substrate (IRS) system in human metabolic disorders. FASEB J. 2001, 15, 2099–2111. [Google Scholar] [CrossRef] [PubMed]
  77. Yousef, A.A.; Behiry, E.G.; Allah, W.M.A.; Hussien, A.M.; Abdelmoneam, A.A.; Imam, M.H.; Hikal, D.M. IRS-1 genetic polymorphism (r.2963G>A) in type 2 diabetes mellitus patients associated with insulin resistance. Appl. Clin. Genet. 2018, 11, 99–106. [Google Scholar] [CrossRef] [PubMed]
  78. Albegali, A.A.; Shahzad, M.; Mahmood, S.; Ullah, M.I. Genetic association of insulin receptor substrate-1 (IRS-1, rs1801278) gene with insulin resistant of type 2 diabetes mellitus in a Pakistani population. Mol. Biol. Rep. 2019, 46, 6065–6070. [Google Scholar] [CrossRef] [PubMed]
  79. Wang, W.; Shi, B.; Cong, R.; Hao, M.; Peng, Y.; Yang, H.; Song, J.; Feng, D.; Zhang, N.; Li, D. RING-finger E3 ligases regulatory network in PI3K/AKT-mediated glucose metabolism. Cell Death Discov. 2022, 8, 372. [Google Scholar] [CrossRef] [PubMed]
  80. Alsalman, H.A.; Kaabi, Y.A. Lack of association between the insulin receptor substrates-1 Gly972Arg polymorphism and type-2 diabetes mellitus among Saudis from Eastern Saudi Arabia. Saudi Med. J. 2015, 36, 1420–1424. [Google Scholar] [CrossRef] [PubMed]
  81. Arikoglu, H.; Aksoy Hepdogru, M.; Erkoc Kaya, D.; Asik, A.; Ipekci, S.H.; Iscioglu, F. IRS1 gene polymorphisms Gly972Arg and Ala513Pro are not associated with insulin resistance and type 2 diabetes risk in non-obese Turkish population. Meta Gene 2014, 2, 579–585. [Google Scholar] [CrossRef] [PubMed]
  82. Imamura, M.; Maeda, S. Perspectives on genetic studies of type 2 diabetes from the genome-wide association studies era to precision medicine. J. Diabetes Investig. 2024, 15, 410–422. [Google Scholar] [CrossRef] [PubMed]
  83. Bansal, V.; Winkelmann, B.R.; Dietrich, J.W.; Boehm, B.O. Whole-exome sequencing in familial type 2 diabetes identifies an atypical missense variant in the RyR2 gene. Front. Endocrinol. 2024, 15, 1258982. [Google Scholar] [CrossRef] [PubMed]
  84. Xue, A.; Wu, Y.; Zhu, Z.; Zhang, F.; Kemper, K.E.; Zheng, Z.; Yengo, L.; Lloyd-Jones, L.R.; Sidorenko, J.; Wu, Y.; et al. Genome-wide association analyses identify 143 risk variants and putative regulatory mechanisms for type 2 diabetes. Nat. Commun. 2018, 9, 2941. [Google Scholar] [CrossRef] [PubMed]
  85. Huerta-Chagoya, A.; Schroeder, P.; Mandla, R.; Li, J.; Morris, L.; Vora, M.; Alkanaq, A.; Nagy, D.; Szczerbinski, L.; Madsen, J.G.S.; et al. Rare variant analyses in 51,256 type 2 diabetes cases and 370,487 controls reveal the pathogenicity spectrum of monogenic diabetes genes. Nat. Genet. 2024, 56, 2370–2379. [Google Scholar] [CrossRef] [PubMed]
  86. Flannick, J.; Mercader, J.M.; Fuchsberger, C.; Udler, M.S.; Mahajan, A.; Wessel, J.; Teslovich, T.M.; Caulkins, L.; Koesterer, R.; Barajas-Olmos, F.; et al. Exome sequencing of 20,791 cases of type 2 diabetes and 24,440 controls. Nature 2019, 570, 71–76. [Google Scholar] [CrossRef] [PubMed]
  87. Yang, Y.S.; Kwak, S.H.; Park, K.S. Update on Monogenic Diabetes in Korea. Diabetes Metab. J. 2020, 44, 627–639. [Google Scholar] [CrossRef] [PubMed]
  88. Jakiel, P.; Gadzalska, K.; Juścińska, E.; Gorządek, M.; Płoszaj, T.; Skoczylas, S.; Borowiec, M.; Zmysłowska, A. Identification of rare variants in candidate genes associated with monogenic diabetes in polish mody-x patients. J. Diabetes Metab. Disord. 2023, 23, 545–554. [Google Scholar] [CrossRef] [PubMed]
  89. Wainschtein, P.; Jain, D.; Zheng, Z.; TOPMed Anthropometry Working Group; NHLBI Trans-Omics for Precision Medicine (TOPMed) Consortium; Cupples, L.A.; Shadyab, A.H.; McKnight, B.; Shoemaker, B.M.; Mitchell, B.D.; et al. Assessing the contribution of rare variants to complex trait heritability from whole-genome sequence data. Nat. Genet. 2022, 54, 263–273. [Google Scholar] [CrossRef] [PubMed]
  90. Zeggini, E.; Ioannidis, J.P. Meta-analysis in genome-wide association studies. Pharmacogenomics 2009, 10, 191–201. [Google Scholar] [CrossRef] [PubMed]
  91. Franks, P.W.; Pearson, E.; Florez, J.C. Gene-environment and gene-treatment interactions in type 2 diabetes: Progress, pitfalls, and prospects. Diabetes Care 2013, 36, 1413–1421. [Google Scholar] [CrossRef] [PubMed]
  92. Gluckman, P.D.; Hanson, M.A.; Cooper, C.; Thornburg, K.L. Effect of in utero and early-life conditions on adult health and disease. N. Engl. J. Med. 2008, 359, 61–73. [Google Scholar] [CrossRef] [PubMed]
  93. Schwingshackl, L.; Hoffmann, G.; Lampousi, A.M.; Knüppel, S.; Iqbal, K.; Schwedhelm, C.; Bechthold, A.; Schlesinger, S.; Boeing, H. Food groups and risk of type 2 diabetes mellitus: A systematic review and meta-analysis of prospective studies. Eur. J. Epidemiol. 2017, 32, 363–375. [Google Scholar] [CrossRef] [PubMed]
  94. Franks, P.W.; Mesa, J.L.; Harding, A.H.; Wareham, N.J. Gene-lifestyle interaction on risk of type 2 diabetes. Nutr. Metab. Cardiovasc. Dis. 2007, 17, 104–124. [Google Scholar] [CrossRef] [PubMed]
  95. Clemente-Suárez, V.J.; Mielgo-Ayuso, J.; Martín-Rodríguez, A.; Ramos-Campo, D.J.; Redondo-Flórez, L.; Tornero-Aguilera, J.F. The Burden of Carbohydrates in Health and Disease. Nutrients 2022, 14, 3809. [Google Scholar] [CrossRef] [PubMed]
  96. Aune, D.; Norat, T.; Romundstad, P.; Vatten, L.J. Whole grain and refined grain consumption and the risk of type 2 diabetes: A systematic review and dose-response meta-analysis of cohort studies. Eur. J. Epidemiol. 2013, 28, 845–858. [Google Scholar] [CrossRef] [PubMed]
  97. U.S. Department of Agriculture and U.S. Department of Health and Human Services. Dietary Guidelines for Americans, 2020–2025, 9th ed.; USDA and HHS: Washington, DC, USA, 2020. Available online: https://www.dietaryguidelines.gov/ (accessed on 8 May 2025).
  98. Seidelmann, S.B.; Claggett, B.; Cheng, S.; Henglin, M.; Shah, A.; Steffen, L.M.; Folsom, A.R.; Rimm, E.B.; Willett, W.C.; Solomon, S.D. Dietary carbohydrate intake and mortality: A prospective cohort study and meta-analysis. Lancet Public Health 2018, 3, e419–e428. [Google Scholar] [CrossRef] [PubMed]
  99. Zhao, B.; Gan, L.; Graubard, B.I.; Männistö, S.; Fang, F.; Weinstein, S.J.; Liao, L.M.; Sinha, R.; Chen, X.; Albanes, D.; et al. Plant and Animal Fat Intake and Overall and Cardiovascular Disease Mortality. JAMA Intern. Med. 2024, 184, 1234–1245. [Google Scholar] [CrossRef] [PubMed]
  100. Mariotti, F. Animal and Plant Protein Sources and Cardiometabolic Health. Adv. Nutr. 2019, 10, S351–S366. [Google Scholar] [CrossRef] [PubMed]
  101. Mathers, J.C. Dietary fibre and health: The story so far. Proc. Nutr. Soc. 2023, 82, 120–129. [Google Scholar] [CrossRef] [PubMed]
  102. Capurso, C. Whole-Grain Intake in the Mediterranean Diet and a Low Protein to Carbohydrates Ratio Can Help to Reduce Mortality from Cardiovascular Disease, Slow Down the Progression of Aging, and to Improve Lifespan: A Review. Nutrients 2021, 13, 2540. [Google Scholar] [CrossRef] [PubMed]
  103. Eleftheriou, D.; Benetou, V.; Trichopoulou, A.; La Vecchia, C.; Bamia, C. Mediterranean diet and its components in relation to all-cause mortality: Meta-analysis. Br. J. Nutr. 2018, 120, 1081–1097. [Google Scholar] [CrossRef] [PubMed]
  104. Soltani, S.; Jayedi, A.; Shab-Bidar, S.; Becerra-Tomás, N.; Salas-Salvadó, J. Adherence to the Mediterranean Diet in Relation to All-Cause Mortality: A Systematic Review and Dose-Response Meta-Analysis of Prospective Cohort Studies. Adv. Nutr. 2019, 10, 1029–1039. [Google Scholar] [CrossRef] [PubMed]
  105. Dunford, E.K.; Miles, D.R.; Popkin, B.; Ng, S.W. Whole Grain and Refined Grains: An Examination of US Household Grocery Store Purchases. J. Nutr. 2022, 152, 550–558. [Google Scholar] [CrossRef] [PubMed]
  106. Chanson-Rolle, A.; Meynier, A.; Aubin, F.; Lappi, J.; Poutanen, K.; Vinoy, S.; Braesco, V. Systematic Review and Meta-Analysis of Human Studies to Support a Quantitative Recommendation for Whole Grain Intake in Relation to Type 2 Diabetes. PLoS ONE 2015, 10, e0131377. [Google Scholar] [CrossRef] [PubMed]
  107. Ramne, S.; Alves Dias, J.; González-Padilla, E.; Olsson, K.; Lindahl, B.; Engström, G.; Ericson, U.; Johansson, I.; Sonestedt, E. Association between added sugar intake and mortality is nonlinear and dependent on sugar source in 2 Swedish population-based prospective cohorts. Am. J. Clin. Nutr. 2019, 109, 411–423. [Google Scholar] [CrossRef] [PubMed]
  108. Ho, F.K.; Gray, S.R.; Welsh, P.; Petermann-Rocha, F.; Foster, H.; Waddell, H.; Anderson, J.; Lyall, D.; Sattar, N.; Gill, J.M.R.; et al. Associations of fat and carbohydrate intake with cardiovascular disease and mortality: Prospective cohort study of UK Biobank participants. BMJ 2020, 368, m688. [Google Scholar] [CrossRef] [PubMed]
  109. Gao, M.; Jebb, S.A.; Aveyard, P.; Ambrosini, G.L.; Perez-Cornago, A.; Carter, J.; Sun, X.; Piernas, C. Associations between dietary patterns and the incidence of total and fatal cardiovascular disease and all-cause mortality in 116,806 individuals from the UK Biobank: A prospective cohort study. BMC Med. 2021, 19, 83. [Google Scholar] [CrossRef] [PubMed]
  110. World Health Organization. Reducing Free Sugars Intake in Adults to Reduce the Risk of Noncommunicable Diseases. 2023. Available online: https://www.who.int/tools/elena/interventions/free-sugars-adults-ncds (accessed on 8 May 2025).
  111. Ye, E.Q.; Chacko, S.A.; Chou, E.L.; Kugizaki, M.; Liu, S. Greater whole-grain intake is associated with lower risk of type 2 diabetes, cardiovascular disease, and weight gain. J. Nutr. 2012, 142, 1304–1313. [Google Scholar] [CrossRef] [PubMed]
  112. Frølich, W.; Aman, P.; Tetens, I. Whole grain foods and health—A Scandinavian perspective. Food Nutr. Res. 2013, 57, 18503. [Google Scholar] [CrossRef] [PubMed]
  113. Özer, M.S.; Yazici, G.N. Phytochemicals of Whole Grains and Effects on Health. In Health and Safety Aspects of Food Processing Technologies; Malik, A., Erginkaya, Z., Erten, H., Eds.; Springer: Cham, Switzerland, 2019. [Google Scholar]
  114. Prasadi, N.P.V.; Joye, I.J. Dietary Fibre from Whole Grains and Their Benefits on Metabolic Health. Nutrients 2020, 12, 3045. [Google Scholar] [CrossRef] [PubMed]
  115. Kyrø, C.; Tjønneland, A.; Overvad, K.; Olsen, A.; Landberg, R. Higher Whole-Grain Intake Is Associated with Lower Risk of Type 2 Diabetes among Middle-Aged Men and Women: The Danish Diet, Cancer, and Health Cohort. J. Nutr. 2018, 148, 1434–1444. [Google Scholar] [CrossRef] [PubMed]
  116. Reynolds, A.; Mann, J.; Cummings, J.; Winter, N.; Mete, E.; Te Morenga, L. Carbohydrate quality and human health: A series of systematic reviews and meta-analyses. Lancet 2019, 393, 434–445. [Google Scholar] [CrossRef] [PubMed]
  117. Marventano, S.; Vetrani, C.; Vitale, M.; Godos, J.; Riccardi, G.; Grosso, G. Whole Grain Intake and Glycaemic Control in Healthy Subjects: A Systematic Review and Meta-Analysis of Randomized Controlled Trials. Nutrients 2017, 9, 769. [Google Scholar] [CrossRef] [PubMed]
  118. Sanders, L.M.; Zhu, Y.; Wilcox, M.L.; Koecher, K.; Maki, K.C. Whole grain intake, compared to refined grain, improves postprandial glycemia and insulinemia: A systematic review and meta-analysis of randomized controlled trials. Crit. Rev. Food Sci. Nutr. 2023, 63, 5339–5357. [Google Scholar] [CrossRef] [PubMed]
  119. Li, Z.; Yan, H.; Chen, L.; Wang, Y.; Liang, J.; Feng, X.; Hui, S.; Wang, K. Effects of whole grain intake on glycemic control: A meta-analysis of randomized controlled trials. J. Diabetes Investig. 2022, 13, 1814–1824. [Google Scholar] [CrossRef] [PubMed]
  120. Marshall, S.; Petocz, P.; Duve, E.; Abbott, K.; Cassettari, T.; Blumfield, M.; Fayet-Moore, F. The Effect of Replacing Refined Grains with Whole Grains on Cardiovascular Risk Factors: A Systematic Review and Meta-Analysis of Randomized Controlled Trials with GRADE Clinical Recommendation. J. Acad. Nutr. Diet. 2020, 120, 1859–1883.e31. [Google Scholar] [CrossRef] [PubMed]
  121. Ying, T.; Zheng, J.; Kan, J.; Li, W.; Xue, K.; Du, J.; Liu, Y.; He, G. Effects of whole grains on glycemic control: A systematic review and dose-response meta-analysis of prospective cohort studies and randomized controlled trials. Nutr. J. 2024, 23, 47. [Google Scholar] [CrossRef] [PubMed]
  122. Jovanovski, E.; Khayyat, R.; Zurbau, A.; Komishon, A.; Mazhar, N.; Sievenpiper, J.L.; Blanco Mejia, S.; Ho, H.V.T.; Li, D.; Jenkins, A.L.; et al. Should Viscous Fiber Supplements Be Considered in Diabetes Control? Results From a Systematic Review and Meta-analysis of Randomized Controlled Trials. Diabetes Care 2019, 42, 755–766. [Google Scholar] [CrossRef] [PubMed]
  123. Du, B.; Meenu, M.; Liu, H.; Xu, B. A Concise Review on the Molecular Structure and Function Relationship of β-Glucan. Int. J. Mol. Sci. 2019, 20, 4032. [Google Scholar] [CrossRef] [PubMed]
  124. Gelevam, D.; Thomas, W.; Gannon, M.C.; Keenan, J.M. A solubilized cellulose fiber decreases peak postprandial cholecystokinin concentrations after a liquid mixed meal in hypercholesterolemic men and women. J. Nutr. 2003, 133, 2194–2203. [Google Scholar] [CrossRef] [PubMed]
  125. Sanders, L.M.; Zhu, Y.; Wilcox, M.L.; Koecher, K.; Maki, K.C. Effects of Whole Grain Intake, Compared with Refined Grain, on Appetite and Energy Intake: A Systematic Review and Meta-Analysis. Adv. Nutr. 2021, 12, 1177–1195. [Google Scholar] [CrossRef] [PubMed]
  126. Zhang, D.; Jian, Y.P.; Zhang, Y.N.; Li, Y.; Gu, L.T.; Sun, H.H.; Liu, M.D.; Zhou, H.L.; Wang, Y.S.; Xu, Z.X. Short-chain fatty acids in diseases. Cell Commun. Signal. 2023, 21, 212. [Google Scholar] [CrossRef] [PubMed]
  127. Mio, K.; Goto, Y.; Matsuoka, T.; Komatsu, M.; Ishii, C.; Yang, J.; Kobayashi, T.; Aoe, S.; Fukuda, S. Barley β-glucan consumption improves glucose tolerance by increasing intestinal succinate concentrations. NPJ Sci. Food 2024, 8, 69. [Google Scholar] [CrossRef] [PubMed]
  128. Chambers, E.S.; Byrne, C.S.; Morrison, D.J.; Murphy, K.G.; Preston, T.; Tedford, C.; Garcia-Perez, I.; Fountana, S.; Serrano-Contreras, J.I.; Holmes, E.; et al. Dietary supplementation with inulin-propionate ester or inulin improves insulin sensitivity in adults with overweight and obesity with distinct effects on the gut microbiota, plasma metabolome and systemic inflammatory responses: A randomised cross-over trial. Gut 2019, 68, 1430–1438. [Google Scholar] [PubMed]
  129. Zurbau, A.; Noronha, J.C.; Khan, T.A.; Sievenpiper, J.L.; Wolever, T.M.S. The effect of oat β-glucan on postprandial blood glucose and insulin responses: A systematic review and meta-analysis. Eur. J. Clin. Nutr. 2021, 75, 1540–1554. [Google Scholar] [CrossRef] [PubMed]
  130. Palmnäs-Bédard, M.S.A.; Costabile, G.; Vetrani, C.; Åberg, S.; Hjalmarsson, Y.; Dicksved, J.; Riccardi, G.; Landberg, R. The human gut microbiota and glucose metabolism: A scoping review of key bacteria and the potential role of SCFAs. Am. J. Clin. Nutr. 2022, 116, 862–874. [Google Scholar] [CrossRef] [PubMed]
  131. Portincasa, P.; Bonfrate, L.; Vacca, M.; De Angelis, M.; Farella, I.; Lanza, E.; Khalil, M.; Wang, D.Q.-H.; Sperandio, M.; Di Ciaula, A. Gut Microbiota and Short Chain Fatty Acids: Implications in Glucose Homeostasis. Int. J. Mol. Sci. 2022, 23, 1105. [Google Scholar] [CrossRef] [PubMed]
  132. Covasa, M.; Stephens, R.W.; Toderean, R.; Cobuz, C. Intestinal Sensing by Gut Microbiota: Targeting Gut Peptides. Front. Endocrinol. 2019, 10, 82. [Google Scholar] [CrossRef] [PubMed]
  133. Zheng, Z.; Zong, Y.; Ma, Y.; Tian, Y.; Pang, Y.; Zhang, C.; Gao, J. Glucagon-like peptide-1 receptor: Mechanisms and advances in therapy. Signal Transduct. Target. Ther. 2024, 9, 234. [Google Scholar] [CrossRef] [PubMed]
  134. Hanhineva, K.; Törrönen, R.; Bondia-Pons, I.; Pekkinen, J.; Kolehmainen, M.; Mykkänen, H.; Poutanen, K. Impact of dietary polyphenols on carbohydrate metabolism. Int. J. Mol. Sci. 2010, 11, 1365–1402. [Google Scholar] [CrossRef] [PubMed]
  135. Khan, J.; Khan, M.Z.; Ma, Y.; Meng, Y.; Mushtaq, A.; Shen, Q.; Xue, Y. Overview of the Composition of Whole Grains’ Phenolic Acids and Dietary Fibre and Their Effect on Chronic Non-Communicable Diseases. Int. J. Environ. Res. Public Health 2022, 19, 3042. [Google Scholar] [CrossRef] [PubMed]
  136. Deka, H.; Choudhury, A.; Dey, B.K. An Overview on Plant Derived Phenolic Compounds and Their Role in Treatment and Management of Diabetes. J. Pharmacopunct. 2022, 25, 199–208. [Google Scholar] [CrossRef] [PubMed]
  137. Naz, R.; Saqib, F.; Awadallah, S.; Wahid, M.; Latif, M.F.; Iqbal, I.; Mubarak, M.S. Food Polyphenols and Type II Diabetes Mellitus: Pharmacology and Mechanisms. Molecules 2023, 28, 3996. [Google Scholar] [CrossRef] [PubMed]
  138. Gong, L.; Feng, D.; Wang, T.; Ren, Y.; Liu, Y.; Wang, J. Inhibitors of α-amylase and α-glucosidase: Potential linkage for whole cereal foods on prevention of hyperglycemia. Food Sci. Nutr. 2020, 8, 6320–6337. [Google Scholar] [CrossRef] [PubMed]
  139. Li, S.X.; Imamura, F.; Ye, Z.; Schulze, M.B.; Zheng, J.; Ardanaz, E.; Arriola, L.; Boeing, H.; Dow, C.; Fagherazzi, G.; et al. Interaction between genes and macronutrient intake on the risk of developing type 2 diabetes: Systematic review and findings from European Prospective Investigation into Cancer (EPIC)-InterAct. Am. J. Clin. Nutr. 2017, 106, 263–275. [Google Scholar] [CrossRef] [PubMed]
  140. Kabisch, S.; Weickert, M.O.; Pfeiffer, A.F.H. The role of cereal soluble fiber in the beneficial modulation of glycometabolic gastrointestinal hormones. Crit. Rev. Food Sci. Nutr. 2024, 64, 4331–4347. [Google Scholar] [CrossRef] [PubMed]
  141. Shankar, A.; Sharma, A.; Vinas, A.; Chilton, R.J. GLP-1 receptor agonists and delayed gastric emptying: Implications for invasive cardiac interventions and surgery. Cardiovasc. Endocrinol. Metab. 2024, 14, e00321. [Google Scholar] [CrossRef] [PubMed]
  142. Wirström, T.; Hilding, A.; Gu, H.F.; Östenson, C.G.; Björklund, A. Consumption of whole grain reduces risk of deteriorating glucose tolerance, including progression to prediabetes. Am. J. Clin. Nutr. 2013, 97, 179–187. [Google Scholar] [CrossRef] [PubMed]
  143. Hindy, G.; Sonestedt, E.; Ericson, U.; Jing, X.J.; Zhou, Y.; Hansson, O.; Renström, E.; Wirfält, E.; Orho-Melander, M. Role of TCF7L2 risk variant and dietary fibre intake on incident type 2 diabetes. Diabetologia 2012, 55, 2646–2654. [Google Scholar] [CrossRef] [PubMed]
  144. Hindy, G.; Mollet, I.G.; Rukh, G.; Ericson, U.; Orho-Melander, M. Several type 2 diabetes-associated variants in genes annotated to WNT signaling interact with dietary fiber in relation to incidence of type 2 diabetes. Genes Nutr. 2016, 11, 6. [Google Scholar] [CrossRef] [PubMed]
  145. InterAct Consortium. Investigation of gene-diet interactions in the incretin system and risk of type 2 diabetes: The EPIC-InterAct study. Diabetologia 2016, 59, 2613–2621. [Google Scholar] [CrossRef] [PubMed]
  146. Wang, H.; Zhang, R.; Wu, X.; Chen, Y.; Ji, W.; Wang, J.; Zhang, Y.; Xia, Y.; Tang, Y.; Yuan, J. The Wnt Signaling Pathway in Diabetic Nephropathy. Front. Cell Dev. Biol. 2022, 9, 701547. [Google Scholar] [CrossRef] [PubMed]
  147. Liu, Z.; Habener, J.F. Glucagon-like peptide-1 activation of TCF7L2-dependent Wnt signaling enhances pancreatic beta cell proliferation. J. Biol. Chem. 2008, 283, 8723–8735. [Google Scholar] [CrossRef] [PubMed]
  148. Al-Awaida, W.J.; Hameed, W.S.; Al Hassany, H.J.; Al-Dabet, M.M.; Al-Bawareed, O.; Hadi, N.R. Evaluation of the Genetic Association and Expressions of Notch-2 /Jagged-1 in Patients with Type 2 Diabetes Mellitus. Med. Arch. 2021, 75, 101–108. [Google Scholar] [CrossRef] [PubMed]
  149. Kwon, C.; Cheng, P.; King, I.N.; Andersen, P.; Shenje, L.; Nigam, V.; Srivastava, D. Notch post-translationally regulates β-catenin protein in stem and progenitor cells. Nat. Cell Biol. 2011, 13, 1244–1251. [Google Scholar] [CrossRef] [PubMed]
  150. Chen, T.; Li, M.; Ding, Y.; Zhang, L.S.; Xi, Y.; Pan, W.J.; Tao, D.L.; Wang, J.Y.; Li, L. Identification of zinc-finger BED domain-containing 3 (Zbed3) as a novel Axin-interacting protein that activates Wnt/beta-catenin signaling. J. Biol. Chem. 2009, 284, 6683–6699. [Google Scholar] [CrossRef] [PubMed]
  151. Jia, Y.; Yuan, L.; Hu, W.; Luo, Y.; Suo, L.; Yang, M.; Chen, S.; Wang, Y.; Liu, H.; Yang, G.; et al. Zinc-finger BED domain-containing 3 (Zbed3) is a novel secreted protein associated with insulin resistance in humans. J. Intern. Med. 2014, 275, 522–533. [Google Scholar] [CrossRef] [PubMed]
  152. Luo, Y.Y.; Ruan, C.S.; Zhao, F.Z.; Yang, M.; Cui, W.; Cheng, X.; Luo, X.H.; Zhang, X.X.; Zhang, C. ZBED3 exacerbates hyperglycemia by promoting hepatic gluconeogenesis through CREB signaling. Metabolism 2025, 162, 156049. [Google Scholar] [CrossRef] [PubMed]
  153. Nettleton, J.A.; McKeown, N.M.; Kanoni, S.; Lemaitre, R.N.; Hivert, M.F.; Ngwa, J.; Van Rooij, F.J.; Sonestedt, E.; Wojczynski, M.K.; Ye, Z.; et al. Interactions of dietary whole-grain intake with fasting glucose- and insulin-related genetic loci in individuals of European descent: A meta-analysis of 14 cohort studies. Diabetes Care 2010, 33, 2684–2691. [Google Scholar] [CrossRef] [PubMed]
  154. Zahedi, A.S.; Akbarzadeh, M.; Sedaghati-Khayat, B.; Seyedhamzehzadeh, A.; Daneshpour, M.S. GCKR common functional polymorphisms are associated with metabolic syndrome and its components: A 10-year retrospective cohort study in Iranian adults. Diabetol. Metab. Syndr. 2021, 13, 20. [Google Scholar] [CrossRef] [PubMed]
  155. Kim, O.Y.; Kwak, S.Y.; Lim, H.; Shin, M.J. Genotype effects of glucokinase regulator on lipid profiles and glycemic status are modified by circulating calcium levels: Results from the Korean Genome and Epidemiology Study. Nutr. Res. 2018, 60, 96–105. [Google Scholar] [CrossRef] [PubMed]
  156. Bi, M.; Kao, W.H.; Boerwinkle, E.; Hoogeveen, R.C.; Rasmussen-Torvik, L.J.; Astor, B.C.; North, K.E.; Coresh, J.; Köttgen, A. Association of rs780094 in GCKR with metabolic traits and incident diabetes and cardiovascular disease: The ARIC Study. PLoS ONE 2010, 5, e11690. [Google Scholar] [CrossRef] [PubMed]
  157. Hosseini, F.; Jayedi, A.; Khan, T.A.; Shab-Bidar, S. Dietary carbohydrate and the risk of type 2 diabetes: An updated systematic review and dose-response meta-analysis of prospective cohort studies. Sci. Rep. 2022, 12, 2491. [Google Scholar] [CrossRef] [PubMed]
  158. Eleazu, C.O. The concept of low glycemic index and glycemic load foods as panacea for type 2 diabetes mellitus; prospects, challenges and solutions. Afr. Health Sci. 2016, 16, 468–479. [Google Scholar] [CrossRef] [PubMed]
  159. Willett, W.; Manson, J.; Liu, S. Glycemic index, glycemic load, and risk of type 2 diabetes. Am. J. Clin. Nutr. 2002, 76, 274S–280S. [Google Scholar] [CrossRef] [PubMed]
  160. Krishnan, S.; Rosenberg, L.; Singer, M.; Hu, F.B.; Djoussé, L.; Cupples, L.A.; Palmer, J.R. Glycemic index, glycemic load, and cereal fiber intake and risk of type 2 diabetes in US black women. Arch. Intern. Med. 2007, 167, 2304–2309. [Google Scholar] [CrossRef] [PubMed]
  161. Dong, J.Y.; Zhang, L.; Zhang, Y.H.; Qin, L.Q. Dietary glycaemic index and glycaemic load in relation to the risk of type 2 diabetes: A meta-analysis of prospective cohort studies. Br. J. Nutr. 2011, 106, 1649–1654. [Google Scholar] [CrossRef] [PubMed]
  162. Greenwood, D.C.; Threapleton, D.E.; Evans, C.E.; Cleghorn, C.L.; Nykjaer, C.; Woodhead, C.; Burley, V.J. Glycemic index, glycemic load, carbohydrates, and type 2 diabetes: Systematic review and dose-response meta-analysis of prospective studies. Diabetes Care 2013, 36, 4166–4171. [Google Scholar] [CrossRef] [PubMed]
  163. Sluijs, I.; Beulens, J.W.; Van der Schouw, Y.T.; Van der, A.D.L.; Buckland, G.; Kuijsten, A.; Schulze, M.B.; Amiano, P.; Ardanaz, E.; Balkau, B.; et al. Dietary glycemic index, glycemic load, and digestible carbohydrate intake are not associated with risk of type 2 diabetes in eight European countries. J. Nutr. 2013, 143, 93–99. [Google Scholar] [CrossRef] [PubMed]
  164. Livesey, G.; Taylor, R.; Livesey, H.; Liu, S. Is there a dose-response relation of dietary glycemic load to risk of type 2 diabetes? Meta-analysis of prospective cohort studies. Am. J. Clin. Nutr. 2013, 97, 584–596. [Google Scholar] [CrossRef] [PubMed]
  165. Bhupathiraju, S.N.; Tobias, D.K.; Malik, V.S.; Pan, A.; Hruby, A.; Manson, J.E.; Willett, W.C.; Hu, F.B. Glycemic index, glycemic load, and risk of type 2 diabetes: Results from 3 large US cohorts and an updated meta-analysis. Am. J. Clin. Nutr. 2014, 100, 218–232. [Google Scholar] [CrossRef] [PubMed]
  166. Livesey, G.; Taylor, R.; Livesey, H.F.; Buyken, A.E.; Jenkins, D.J.A.; Augustin, L.S.A.; Sievenpiper, J.L.; Barclay, A.W.; Liu, S.; Wolever, T.M.S.; et al. Dietary Glycemic Index and Load and the Risk of Type 2 Diabetes: A Systematic Review and Updated Meta-Analyses of Prospective Cohort Studies. Nutrients 2019, 11, 1280. [Google Scholar] [CrossRef] [PubMed]
  167. Livesey, G.; Taylor, R.; Livesey, H.F.; Buyken, A.E.; Jenkins, D.J.A.; Augustin, L.S.A.; Sievenpiper, J.L.; Barclay, A.W.; Liu, S.; Wolever, T.M.S.; et al. Dietary Glycemic Index and Load and the Risk of Type 2 Diabetes: Assessment of Causal Relations. Nutrients 2019, 11, 1436. [Google Scholar] [CrossRef] [PubMed]
  168. Yaegashi, A.; Sunohara, S.; Kimura, T.; Hao, W.; Moriguchi, T.; Tamakoshi, A. Association between dietary carbohydrate intake and risk of type 2 diabetes: A systematic review and meta-analysis of cohort studies. Diabetol. Int. 2023, 14, 327–338. [Google Scholar] [CrossRef] [PubMed]
  169. Gan, L.; Yang, Y.; Zhao, B.; Yu, K.; Guo, K.; Fang, F.; Zhou, Z.; Albanes, D.; Huang, J. Dietary carbohydrate intake and risk of type 2 diabetes: A 16-year prospective cohort study. Sci. China Life Sci. 2025, 68, 1149–1157. [Google Scholar] [CrossRef] [PubMed]
  170. Wang, Q.; Xia, W.; Zhao, Z.; Zhang, H. Effects comparison between low glycemic index diets and high glycemic index diets on HbA1c and fructosamine for patients with diabetes: A systematic review and meta-analysis. Prim. Care Diabetes 2015, 9, 362–369. [Google Scholar] [CrossRef] [PubMed]
  171. Ojo, O.; Ojo, O.O.; Adebowale, F.; Wang, X.H. The Effect of Dietary Glycaemic Index on Glycaemia in Patients with Type 2 Diabetes: A Systematic Review and Meta-Analysis of Randomized Controlled Trials. Nutrients 2018, 10, 373. [Google Scholar] [CrossRef] [PubMed]
  172. Zafar, M.I.; Mills, K.E.; Zheng, J.; Regmi, A.; Hu, S.Q.; Gou, L.; Chen, L.L. Low-glycemic index diets as an intervention for diabetes: A systematic review and meta-analysis. Am. J. Clin. Nutr. 2019, 110, 891–902. [Google Scholar] [CrossRef] [PubMed]
  173. Chiavaroli, L.; Lee, D.; Ahmed, A.; Cheung, A.; Khan, T.A.; Mejia, S.B.; Mirrahimi, A.; Jenkins, D.J.A.; Livesey, G.; Wolever, T.M.S.; et al. Effect of low glycaemic index or load dietary patterns on glycaemic control and cardiometabolic risk factors in diabetes: Systematic review and meta-analysis of randomised controlled trials. BMJ 2021, 374, n1651. [Google Scholar] [CrossRef] [PubMed]
  174. Thomas, D.; Elliott, E.J. Low glycaemic index, or low glycaemic load, diets for diabetes mellitus. Cochrane Database Syst. Rev. 2009, 2009, CD006296. [Google Scholar] [CrossRef] [PubMed]
  175. Korsmo-Haugen, H.K.; Brurberg, K.G.; Mann, J.; Aas, A.M. Carbohydrate quantity in the dietary management of type 2 diabetes: A systematic review and meta-analysis. Diabetes Obes. Metab. 2019, 21, 15–27. [Google Scholar] [CrossRef] [PubMed]
  176. Goff, L.M.; Cowland, D.E.; Hooper, L.; Frost, G.S. Low glycaemic index diets and blood lipids: A systematic review and meta-analysis of randomised controlled trials. Nutr. Metab. Cardiovasc. Dis. 2013, 23, 1–10. [Google Scholar] [CrossRef] [PubMed]
  177. Milajerdi, A.; Saneei, P.; Larijani, B.; Esmaillzadeh, A. The effect of dietary glycemic index and glycemic load on inflammatory biomarkers: A systematic review and meta-analysis of randomized clinical trials. Am. J. Clin. Nutr. 2018, 107, 593–606. [Google Scholar] [CrossRef] [PubMed]
  178. Evans, C.E.; Greenwood, D.C.; Threapleton, D.E.; Gale, C.P.; Cleghorn, C.L.; Burley, V.J. Glycemic index, glycemic load, and blood pressure: A systematic review and meta-analysis of randomized controlled trials. Am. J. Clin. Nutr. 2017, 105, 1176–1190. [Google Scholar] [CrossRef] [PubMed]
  179. Schwingshackl, L.; Hoffmann, G. Long-term effects of low glycemic index/load vs. high glycemic index/load diets on parameters of obesity and obesity-associated risks: A systematic review and meta-analysis. Nutr. Metab. Cardiovasc. Dis. 2013, 23, 699–706. [Google Scholar] [CrossRef] [PubMed]
  180. American Diabetes Association. Standards of Care in Diabetes. 2025. Available online: https://professional.diabetes.org/standards-of-care (accessed on 1 May 2025).
  181. Goldenberg, J.Z.; Day, A.; Brinkworth, G.D.; Sato, J.; Yamada, S.; Jönsson, T.; Beardsley, J.; Johnson, J.A.; Thabane, L.; Johnston, B.C. Efficacy and safety of low and very low carbohydrate diets for type 2 diabetes remission: Systematic review and meta-analysis of published and unpublished randomized trial data. BMJ 2021, 372, m4743. [Google Scholar] [CrossRef] [PubMed]
  182. Zheng, J.S.; Parnell, L.D.; Smith, C.E.; Lee, Y.C.; Jamal-Allial, A.; Ma, Y.; Li, D.; Tucker, K.L.; Ordovás, J.M.; Lai, C.Q. Circulating 25-hydroxyvitamin D, IRS1 variant rs2943641, and insulin resistance: Replication of a gene-nutrient interaction in 4 populations of different ancestries. Clin. Chem. 2014, 60, 186–196. [Google Scholar] [CrossRef] [PubMed]
  183. Ericson, U.; Rukh, G.; Stojkovic, I.; Sonestedt, E.; Gullberg, B.; Wirfält, E.; Wallström, P.; Orho-Melander, M. Sex-specific interactions between the IRS1 polymorphism and intakes of carbohydrates and fat on incident type 2 diabetes. Am. J. Clin. Nutr. 2013, 97, 208–216. [Google Scholar] [CrossRef] [PubMed]
  184. Qi, Q.; Bray, G.A.; Smith, S.R.; Hu, F.B.; Sacks, F.M.; Qi, L. Insulin receptor substrate 1 gene variation modifies insulin resistance response to weight-loss diets in a 2-year randomized trial: The Preventing Overweight Using Novel Dietary Strategies (POUNDS LOST) trial. Circulation 2011, 124, 563–571. [Google Scholar] [CrossRef] [PubMed]
  185. Zheng, J.S.; Arnett, D.K.; Parnell, L.D.; Smith, C.E.; Li, D.; Borecki, I.B.; Tucker, K.L.; Ordovás, J.M.; Lai, C.Q. Modulation by dietary fat and carbohydrate of IRS1 association with type 2 diabetes traits in two populations of different ancestries. Diabetes Care 2013, 36, 2621–2627. [Google Scholar] [CrossRef] [PubMed]
  186. Szabó, M.; Máté, B.; Csép, K.; Benedek, T. Epigenetic Modifications Linked to T2D, the Heritability Gap, and Potential Therapeutic Targets. Biochem. Genet. 2018, 56, 553–574. [Google Scholar] [CrossRef] [PubMed]
  187. Kowluru, R.A.; Mohammad, G. Epigenetic modifications in diabetes. Metabolism 2022, 126, 154920. [Google Scholar] [CrossRef] [PubMed]
  188. Liu, R.; Zhao, E.; Yu, H.; Yuan, C.; Abbas, M.N.; Cui, H. Methylation across the central dogma in health and diseases: New therapeutic strategies. Signal Transduct. Target. Ther. 2023, 8, 310. [Google Scholar] [CrossRef] [PubMed]
  189. Ling, C.; Rönn, T. Epigenetics in Human Obesity and Type 2 Diabetes. Cell Metab. 2019, 29, 1028–1044. [Google Scholar] [CrossRef] [PubMed]
  190. Martire, S.; Banaszynski, L.A. The roles of histone variants in fine-tuning chromatin organization and function. Nat. Rev. Mol. Cell Biol. 2020, 21, 522–541. [Google Scholar] [CrossRef] [PubMed]
  191. Zhang, Y.; Sun, Z.; Jia, J.; Du, T.; Zhang, N.; Tang, Y.; Fang, Y.; Fang, D. Overview of Histone Modification. In Histone Mutations and Cancer. Advances in Experimental Medicine and Biology; Fang, D., Han, J., Eds.; Springer: Singapore, 2021; Volume 123. [Google Scholar]
  192. Hardy, T.M.; Tollefsbol, T.O. Epigenetic diet: Impact on the epigenome and cancer. Epigenomics 2011, 3, 503–518. [Google Scholar] [CrossRef] [PubMed]
  193. Kaimala, S.; Kumar, C.A.; Allouh, M.Z.; Ansari, S.A.; Emerald, B.S. Epigenetic modifications in pancreas development, diabetes, and therapeutics. Med. Res. Rev. 2022, 42, 1343–1371. [Google Scholar] [CrossRef] [PubMed]
  194. Lin, Y.; Qiu, T.; Wei, G.; Que, Y.; Wang, W.; Kong, Y.; Xie, T.; Chen, X. Role of Histone Post-Translational Modifications in Inflammatory Diseases. Front. Immunol. 2022, 13, 852272. [Google Scholar] [CrossRef] [PubMed]
  195. Wei, J.W.; Huang, K.; Yang, C.; Kang, C.S. Non-coding RNAs as regulators in epigenetics (Review). Oncol. Rep. 2017, 37, 3–9. [Google Scholar] [CrossRef] [PubMed]
  196. Srijyothi, L.; Ponne, S.; Prathama, T.; Ashok, C.; Baluchamy, S. Roles of Non-Coding RNAs in Transcriptional Regulation. In Transcriptional and Post-Transcriptional Regulation; InTech: London, UK, 2018. [Google Scholar]
  197. Nalbant, E.; Akkaya-Ulum, Y.Z. Exploring regulatory mechanisms on miRNAs and their implications in inflammation-related diseases. Clin. Exp. Med. 2024, 24, 142. [Google Scholar] [CrossRef] [PubMed]
  198. Zhang, Y.; Liu, H.; Niu, M.; Wang, Y.; Xu, R.; Guo, Y.; Zhang, C. Roles of long noncoding RNAs in human inflammatory diseases. Cell Death Discov. 2024, 10, 235. [Google Scholar] [CrossRef] [PubMed]
  199. Walaszczyk, E.; Luijten, M.; Spijkerman, A.M.W.; Bonder, M.J.; Lutgers, H.L.; Snieder, H.; Wolffenbuttel, B.H.R.; Van Vliet-Ostaptchouk, J.V. DNA methylation markers associated with type 2 diabetes, fasting glucose and HbA1c levels: A systematic review and replication in a case-control sample of the Lifelines study. Diabetologia 2018, 61, 354–368. [Google Scholar] [CrossRef] [PubMed]
  200. Ling, C.; Bacos, K.; Rönn, T. Epigenetics of type 2 diabetes mellitus and weight change—a tool for precision medicine? Nat. Rev. Endocrinol. 2022, 18, 433–448. [Google Scholar] [CrossRef] [PubMed]
  201. Formichi, C.; Nigi, L.; Grieco, G.E.; Maccora, C.; Fignani, D.; Brusco, N.; Licata, G.; Sebastiani, G.; Dotta, F. Non-Coding RNAs: Novel Players in Insulin Resistance and Related Diseases. Int. J. Mol. Sci. 2021, 22, 7716. [Google Scholar] [CrossRef] [PubMed]
  202. Macvanin, M.T.; Gluvic, Z.; Bajic, V.; Isenovic, E.R. Novel insights regarding the role of noncoding RNAs in diabetes. World J. Diabetes 2023, 14, 958–976. [Google Scholar] [CrossRef] [PubMed]
  203. Li, D.; Zhang, L.; He, Y.; Zhou, T.; Cheng, X.; Huang, W.; Xu, Y. Novel histone post-translational modifications in diabetes and complications of diabetes: The underlying mechanisms and implications. Biomed. Pharmacother. 2022, 156, 113984. [Google Scholar] [CrossRef] [PubMed]
  204. Yang, Y.; Luan, Y.; Feng, Q.; Chen, X.; Qin, B.; Ren, K.D.; Luan, Y. Epigenetics and Beyond: Targeting Histone Methylation to Treat Type 2 Diabetes Mellitus. Front. Pharmacol. 2022, 12, 807413. [Google Scholar] [CrossRef] [PubMed]
  205. Santos, J.L.; Krause, B.J.; Cataldo, L.R.; Vega, J.; Salas-Pérez, F.; Mennickent, P.; Gallegos, R.; Milagro, F.I.; Prieto-Hontoria, P.; Riezu-Boj, J.I.; et al. PPARGC1A Gene Promoter Methylation as a Biomarker of Insulin Secretion and Sensitivity in Response to Glucose Challenges. Nutrients 2020, 12, 2790. [Google Scholar] [CrossRef] [PubMed]
  206. Younesian, S.; Mohammadi, M.H.; Younesian, O.; Momeny, M.; Ghaffari, S.H.; Bashash, D. DNA methylation in human diseases. Heliyon 2024, 10, e32366. [Google Scholar] [CrossRef] [PubMed]
  207. Muka, T.; Nano, J.; Voortman, T.; Braun, K.V.E.; Ligthart, S.; Stranges, S.; Bramer, W.M.; Troup, J.; Chowdhury, R.; Dehghan, A.; et al. The role of global and regional DNA methylation and histone modifications in glycemic traits and type 2 diabetes: A systematic review. Nutr. Metab. Cardiovasc. Dis. 2016, 26, 553–566. [Google Scholar] [CrossRef] [PubMed]
  208. Gillberg, L.; Jacobsen, S.C.; Rönn, T.; Brøns, C.; Vaag, A. PPARGC1A DNA methylation in subcutaneous adipose tissue in low birth weight subjects—impact of 5 days of high-fat overfeeding. Metabolism 2014, 63, 263–271. [Google Scholar] [CrossRef] [PubMed]
  209. Andrade, S.; Morais, T.; Sandovici, I.; Seabra, A.L.; Constância, M.; Monteiro, M.P. Adipose Tissue Epigenetic Profile in Obesity-Related Dysglycemia—A Systematic Review. Front. Endocrinol. 2021, 12, 681649. [Google Scholar] [CrossRef] [PubMed]
  210. Gancheva, S.; Ouni, M.; Jelenik, T.; Koliaki, C.; Szendroedi, J.; Toledo, F.G.S.; Markgraf, D.F.; Pesta, D.H.; Mastrototaro, L.; De Filippo, E.; et al. Dynamic changes of muscle insulin sensitivity after metabolic surgery. Nat. Commun. 2019, 10, 4179. [Google Scholar] [CrossRef] [PubMed]
  211. Ling, C. Epigenetic regulation of insulin action and secretion—role in the pathogenesis of type 2 diabetes. J. Intern. Med. 2020, 288, 158–167. [Google Scholar] [CrossRef] [PubMed]
  212. Willmer, T.; Johnson, R.; Louw, J.; Pheiffer, C. Blood-Based DNA Methylation Biomarkers for Type 2 Diabetes: Potential for Clinical Applications. Front. Endocrinol. 2018, 9, 744. [Google Scholar] [CrossRef] [PubMed]
  213. Marchetti, J.; Balbino, K.P.; Hermsdorff, H.H.M.; Juvanhol, L.L.; Martinez, J.A.; Steemburgo, T. Relationship between the FTO Genotype and Early Chronic Kidney Disease in Type 2 Diabetes: The Mediating Role of Central Obesity, Hypertension, and High Albuminuria. Lifestyle Genom. 2021, 14, 73–80. [Google Scholar] [CrossRef] [PubMed]
  214. Daniels, M.J.; Jagielnicki, M.; Yeager, M. Structure/Function Analysis of human ZnT8 (SLC30A8): A Diabetes Risk Factor and Zinc Transporter. Curr. Res. Struct. Biol. 2020, 2, 144–155. [Google Scholar] [CrossRef] [PubMed]
  215. Wondafrash, D.Z.; Nire’a, A.T.; Tafere, G.G.; Desta, D.M.; Berhe, D.A.; Zewdie, K.A. Thioredoxin-Interacting Protein as a Novel Potential Therapeutic Target in Diabetes Mellitus and Its Underlying Complications. Diabetes Metab. Syndr. Obes. 2020, 13, 43–51. [Google Scholar] [CrossRef] [PubMed]
  216. Qie, R.; Chen, Q.; Wang, T.; Chen, X.; Wang, J.; Cheng, R.; Lin, J.; Zhao, Y.; Liu, D.; Qin, P.; et al. Association of ABCG1 gene methylation and its dynamic change status with incident type 2 diabetes mellitus: The Rural Chinese Cohort Study. J. Hum. Genet. 2021, 66, 347–357. [Google Scholar] [CrossRef] [PubMed]
  217. Schlaepfer, I.R.; Joshi, M. CPT1A-mediated Fat Oxidation, Mechanisms, and Therapeutic Potential. Endocrinology 2020, 161, bqz046. [Google Scholar] [CrossRef] [PubMed]
  218. Eberlé, D.; Clément, K.; Meyre, D.; Sahbatou, M.; Vaxillaire, M.; Le Gall, A.; Ferré, P.; Basdevant, A.; Froguel, P.; Foufelle, F. SREBF-1 gene polymorphisms are associated with obesity and type 2 diabetes in French obese and diabetic cohorts. Diabetes 2004, 53, 2153–2157. [Google Scholar] [CrossRef] [PubMed]
  219. Raciti, G.A.; Desiderio, A.; Longo, M.; Leone, A.; Zatterale, F.; Prevenzano, I.; Miele, C.; Napoli, R.; Beguinot, F. DNA Methylation and Type 2 Diabetes: Novel Biomarkers for Risk Assessment? Int. J. Mol. Sci. 2021, 22, 11652. [Google Scholar] [CrossRef] [PubMed]
  220. Cardona, A.; Day, F.R.; Perry, J.R.B.; Loh, M.; Chu, A.Y.; Lehne, B.; Paul, D.S.; Lotta, L.A.; Stewart, I.D.; Kerrison, N.D.; et al. Epigenome-Wide Association Study of Incident Type 2 Diabetes in a British Population: EPIC-Norfolk Study. Diabetes 2019, 68, 2315–2326. [Google Scholar] [CrossRef] [PubMed]
  221. Fraszczyk, E.; Spijkerman, A.M.W.; Zhang, Y.; Brandmaier, S.; Day, F.R.; Zhou, L.; Wackers, P.; Dollé, M.E.T.; Bloks, V.W.; Gào, X.; et al. Epigenome-wide association study of incident type 2 diabetes: A meta-analysis of five prospective European cohorts. Diabetologia 2022, 65, 763–776. [Google Scholar] [CrossRef] [PubMed]
  222. Lee, S. The association of genetically controlled CpG methylation (cg158269415) of protein tyrosine phosphatase, receptor type N2 (PTPRN2) with childhood obesity. Sci. Rep. 2019, 9, 4855. [Google Scholar] [CrossRef] [PubMed]
  223. Nadiger, N.; Veed, J.K.; Chinya Nataraj, P.; Mukhopadhyay, A. DNA methylation and type 2 diabetes: A systematic review. Clin. Epigenet. 2024, 16, 67. [Google Scholar] [CrossRef] [PubMed]
  224. Klein, S.; Gastaldelli, A.; Yki-Järvinen, H.; Scherer, P.E. Why does obesity cause diabetes? Cell Metab. 2022, 34, 11–20. [Google Scholar] [CrossRef] [PubMed]
  225. Rosenberg, I.H. Metabolic programming of offspring by vitamin B12/folate imbalance during pregnancy. Diabetologia 2008, 51, 6–7. [Google Scholar] [CrossRef] [PubMed]
  226. Ducker, G.S.; Rabinowitz, J.D. One-Carbon Metabolism in Health and Disease. Cell Metab. 2017, 25, 27–42. [Google Scholar] [CrossRef] [PubMed]
  227. Zhang, N. Role of methionine on epigenetic modification of DNA methylation and gene expression in animals. Anim. Nutr. 2018, 4, 11–16. [Google Scholar] [CrossRef] [PubMed]
  228. Nilsson, E.; Matte, A.; Perfilyev, A.; de Mello, V.D.; Käkelä, P.; Pihlajamäki, J.; Ling, C. Epigenetic Alterations in Human Liver From Subjects With Type 2 Diabetes in Parallel With Reduced Folate Levels. J. Clin. Endocrinol. Metab. 2015, 100, E1491–E1501. [Google Scholar] [CrossRef] [PubMed]
  229. Zhu, J.; Chen, C.; Lu, L.; Yang, K.; Reis, J.; He, K. Intakes of Folate, Vitamin B6, and Vitamin B12 in Relation to Diabetes Incidence Among American Young Adults: A 30-Year Follow-up Study. Diabetes Care 2020, 43, 2426–2434. [Google Scholar] [CrossRef] [PubMed]
  230. Lemas, D.J.; Wiener, H.W.; O’Brien, D.M.; Hopkins, S.; Stanhope, K.L.; Havel, P.J.; Allison, D.B.; Fernandez, J.R.; Tiwari, H.K.; Boyer, B.B. Genetic polymorphisms in carnitine palmitoyltransferase 1A gene are associated with variation in body composition and fasting lipid traits in Yup’ik Eskimos. J. Lipid Res. 2012, 53, 175–184. [Google Scholar] [CrossRef] [PubMed]
  231. Liang, K. Mitochondrial CPT1A: Insights into structure, function, and basis for drug development. Front. Pharmacol. 2023, 14, 1160440. [Google Scholar] [CrossRef] [PubMed]
  232. Lai, C.Q.; Parnell, L.D.; Smith, C.E.; Guo, T.; Sayols-Baixeras, S.; Aslibekyan, S.; Tiwari, H.K.; Irvin, M.R.; Bender, C.; Fei, D.; et al. Carbohydrate and fat intake associated with risk of metabolic diseases through epigenetics of CPT1A. Am. J. Clin. Nutr. 2020, 112, 1200–1211. [Google Scholar] [CrossRef] [PubMed]
  233. Tobi, E.W.; Goeman, J.J.; Monajemi, R.; Gu, H.; Putter, H.; Zhang, Y.; Slieker, R.C.; Stok, A.P.; Thijssen, P.E.; Müller, F.; et al. DNA methylation signatures link prenatal famine exposure to growth and metabolism. Nat. Commun. 2014, 5, 5592. [Google Scholar] [CrossRef] [PubMed]
  234. Aslibekyan, S.; Demerath, E.W.; Mendelson, M.; Zhi, D.; Guan, W.; Liang, L.; Sha, J.; Pankow, J.S.; Liu, C.; Irvin, M.R.; et al. Epigenome-wide study identifies novel methylation loci associated with body mass index and waist circumference. Obesity 2015, 23, 1493–1501. [Google Scholar] [CrossRef] [PubMed]
  235. Frazier-Wood, A.C.; Aslibekyan, S.; Absher, D.M.; Hopkins, P.N.; Sha, J.; Tsai, M.Y.; Tiwari, H.K.; Waite, L.L.; Zhi, D.; Arnett, D.K. Methylation at CPT1A locus is associated with lipoprotein subfraction profiles. J. Lipid Res. 2014, 55, 1324–1330. [Google Scholar] [CrossRef] [PubMed]
  236. Irvin, M.R.; Zhi, D.; Joehanes, R.; Mendelson, M.; Aslibekyan, S.; Claas, S.A.; Thibeault, K.S.; Patel, N.; Day, K.; Jones, L.W.; et al. Epigenome-wide association study of fasting blood lipids in the Genetics of Lipid-lowering Drugs and Diet Network study. Circulation 2014, 130, 565–572. [Google Scholar] [CrossRef] [PubMed]
  237. Lai, C.Q.; Wojczynski, M.K.; Parnell, L.D.; Hidalgo, B.A.; Irvin, M.R.; Aslibekyan, S.; Province, M.A.; Absher, D.M.; Arnett, D.K.; Ordovás, J.M. Epigenome-wide association study of triglyceride postprandial responses to a high-fat dietary challenge. J. Lipid Res. 2016, 57, 2200–2207. [Google Scholar] [CrossRef] [PubMed]
  238. Das, M.; Sha, J.; Hidalgo, B.; Aslibekyan, S.; Do, A.N.; Zhi, D.; Sun, D.; Zhang, T.; Li, S.; Chen, W.; et al. Association of DNA Methylation at CPT1A Locus with Metabolic Syndrome in the Genetics of Lipid Lowering Drugs and Diet Network (GOLDN) Study. PLoS ONE 2016, 11, e0145789. [Google Scholar] [CrossRef] [PubMed]
  239. Moody, L.; Xu, G.B.; Chen, H.; Pan, Y.X. Epigenetic regulation of carnitine palmitoyltransferase 1 (Cpt1a) by high fat diet. Biochim. Biophys. Acta Gene Regul. Mech. 2019, 1862, 141–152. [Google Scholar] [CrossRef] [PubMed]
  240. Ohashi, K.; Munetsuna, E.; Yamada, H.; Ando, Y.; Yamazaki, M.; Taromaru, N.; Nagura, A.; Ishikawa, H.; Suzuki, K.; Teradaira, R.; et al. High fructose consumption induces DNA methylation at PPARα and CPT1A promoter regions in the rat liver. Biochem. Biophys. Res. Commun. 2015, 468, 185–189. [Google Scholar] [CrossRef] [PubMed]
  241. Contreras, A.V.; Torres, N.; Tovar, A.R. PPAR-α as a key nutritional and environmental sensor for metabolic adaptation. Adv. Nutr. 2013, 4, 439–452. [Google Scholar] [CrossRef] [PubMed]
  242. Nagai, Y.; Nishio, Y.; Nakamura, T.; Maegawa, H.; Kikkawa, R.; Kashiwagi, A. Amelioration of high fructose-induced metabolic derangements by activation of PPARalpha. Am. J. Physiol. Endocrinol. Metab. 2002, 282, E1180–E1190. [Google Scholar] [CrossRef] [PubMed]
  243. Balli, D.; Bellumori, M.; Pucci, L.; Gabriele, M.; Longo, V.; Paoli, P.; Melani, F.; Mulinacci, N.; Innocenti, M. Does fermentation really increase the phenolic content in cereals? A study on millet. Foods 2020, 9, 303. [Google Scholar] [CrossRef] [PubMed]
  244. Varzakas, T.; Zakynthinos, G.; Verpoort, F. Plant Food Residues as a Source of Nutraceuticals and Functional Foods. Foods 2016, 5, 88. [Google Scholar] [CrossRef] [PubMed]
  245. Munekata, P.E.; Pérez-Álvarez, J.Á.; Pateiro, M.; Viuda-Matos, M.; Fernández-López, J.; Lorenzo, J.M. Satiety from healthier and functional foods. Trends Food Sci. Technol. 2021, 113, 397–410. [Google Scholar] [CrossRef]
  246. Modesti, M.; Tonacci, A.; Sansone, F.; Billeci, L.; Bellincontro, A.; Cacopardo, G.; Sanmartin, C.; Taglieri, I.; Venturi, F. E-senses, panel tests and wearable sensors: A teamwork for food quality assessment and prediction of consumer’s choices. Chemosensors 2022, 10, 244. [Google Scholar] [CrossRef]
  247. Tonacci, A.; Scalzini, G.; Díaz-Guerrero, P.; Sanmartin, C.; Taglieri, I.; Ferroni, G.; Flamini, G.; Odello, L.; Billeci, L.; Venturi, F. Chemosensory analysis of emotional wines: Merging of explicit and implicit methods to measure emotions aroused by red wines. Food Res. Int. 2024, 190, 114611. [Google Scholar] [CrossRef] [PubMed]
Figure 1. Schematic representation of the trade-off between quantity and quality of carbohydrate consumption and the risk of human disease.
Nutrients 17 02350 g001
Figure 2. Summary of biological processes involved in glycemic control following whole grain consumption. Abbreviations: GLP-1: glucagon-like peptide-1; SCFAs: short-chain fatty acids.
Nutrients 17 02350 g002
Figure 3. Effects of carbohydrate intake on blood parameters and other key biomarkers associated with glycemic status. Abbreviations: apo B: apolipoprotein B; BMI: body mass index; CRP: C-reactive protein; GI: glycemic index; GL: glycemic load; Hb1Ac: glycated hemoglobin; HDL: high-density lipoprotein; HOMA-IR: Homeostatic Model Assessment for Insulin Resistance; IL-6: interleukin 6; LDL: low-density lipoprotein; TNF-α: tumor necrosis factor alpha.
Nutrients 17 02350 g003
Figure 4. Summary of the interconnections between carbohydrate intake and genetics and epigenetics in the onset of type 2 diabetes.
Nutrients 17 02350 g004
Table 3. Clues and pitfalls in the association between carbohydrate intake and risk of type 2 diabetes.
CluesReferencePitfallsReference
High intake of carbohydrates significantly associated with an increased risk of T2D[27]Carbohydrate intake not associated with an increased risk of T2D[162,163,168]
GI and GL significantly and positively associated with risk of T2D[161,163,164,165]No significant association of GI and GL with T2D incidence[163]
No evidence of publication bias[27,161,162]Potential residual confounding[27,161,162,169]
Possibility of misclassification error and bias in the diagnosis and assessment of T2D (mostly based on self-reports)[27,161,163,165,166]
Most studies measure dietary intakes at baseline only[27,161,163,165]
Nutrition assessment used only FFQ and is therefore susceptible to large random and systemic errors[27,161,162,163,164]
Possibility of measurement errors in dietary assessment despite the improvement of methods[169]
Heterogeneity between studies due to differences in participant characteristics, geographical areas, and confounding factors[27,161,164,165,166]
No possibility to establish to what extent the effect of GL is attributable to carbohydrate intake[161]
Most studies conducted in female participants[27]
No causal relationship defined due to observational study design[27,161,162,163,164,165]
Publication bias between studies[164,165,168]
Possibility of misclassification in the assignment of GI and GL to food items[166]
Predominance of participants of European American descent[164,169]
Abbreviations: FFQ; food frequency questionnaire; T2D: type 2 diabetes.
Table 4. Qualitative level of evidence on the interaction between carbohydrate intake and key genes for the risk of type 2 diabetes.
Carbohydrate TypeGeneVariantEffect of Interaction on T2D RiskLevel of Evidence
High intake of total fiber/cereal fiber/whole grainsTCF7L2rs7903146 TT
rs7903146 CC
rs4506565 AA
rs12255372
Harmful
Protective
Protective
Harmful/Protective
Moderate
Low
Low
Low
High intake of dietary fiberNOTCH2
ZEBD2
rs10923931
rs445705
Protective
Protective
Low
Low
High whole grain intakeGCKRrs780094 C/CCHarmfulModerate
Low carbohydrate diet
High carbohydrate intake
Low short fatty acid -to-carbohydrate ratio
IRS1rs2943641 T
rs2943641 CC
rs2943641 T
rs7578326 G
Protective
Protective
Protective
Protective
Low
High
Low
Moderate
Disclaimer/Publisher’s Note: The statements, opinions and data contained in all publications are solely those of the individual author(s) and contributor(s) and not of MDPI and/or the editor(s). MDPI and/or the editor(s) disclaim responsibility for any injury to people or property resulting from any ideas, methods, instructions or products referred to in the content.

