
The Alpha and Beta Diversities of Dietary Patterns Differed by Age and Sex in Young and Middle-Aged Japanese Participants

 ,
,  ,
,
Abstract
1. Introduction
2. Materials and Methods
2.1. Study Design and Participants
2.2. Detailed Physical Examination
2.3. Food Intake Frequency Questionnaire on Food Groups
2.4. Statistical Analysis
2.4.1. Alpha Diversity Indices
2.4.2. Visualization and Multivariate Analysis
2.4.3. Redundancy Analysis (RDA)
3. Results
3.1. Background of the Participants in This Study
3.2. Individual Food Frequencies of the Participants in This Study
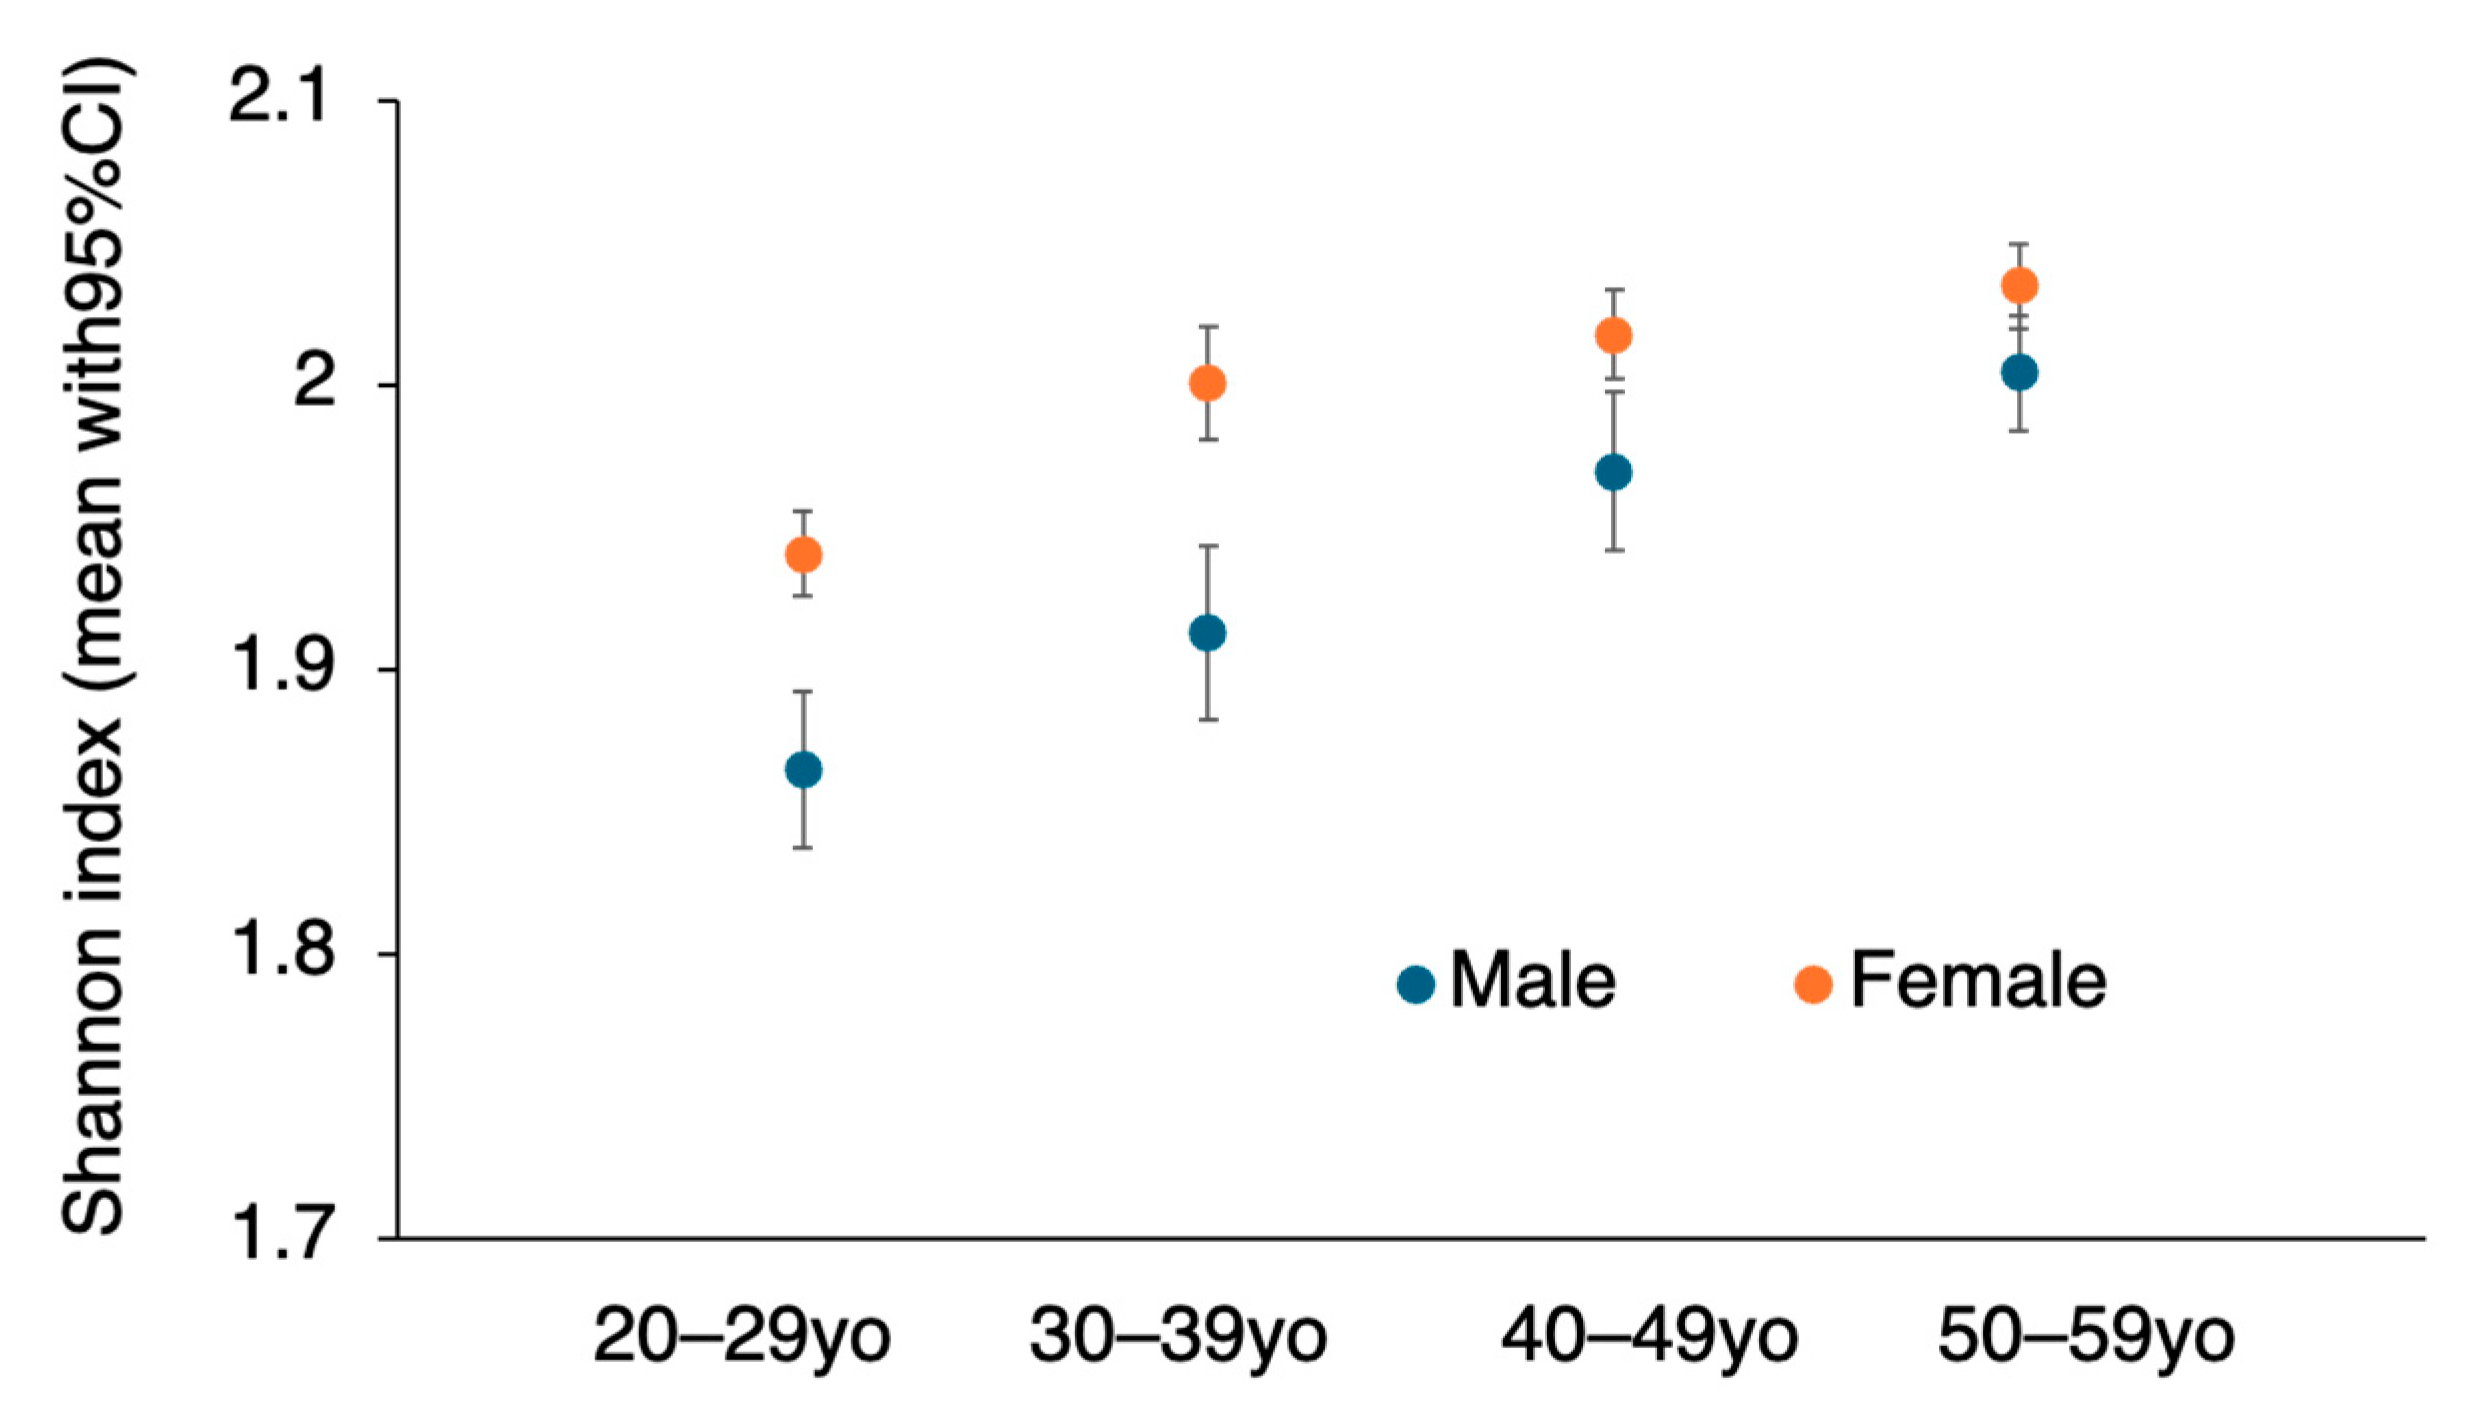
3.3. Alpha Diversity by Age and Sex
3.4. Investigation of Dietary Patterns Focusing on Beta Diversity
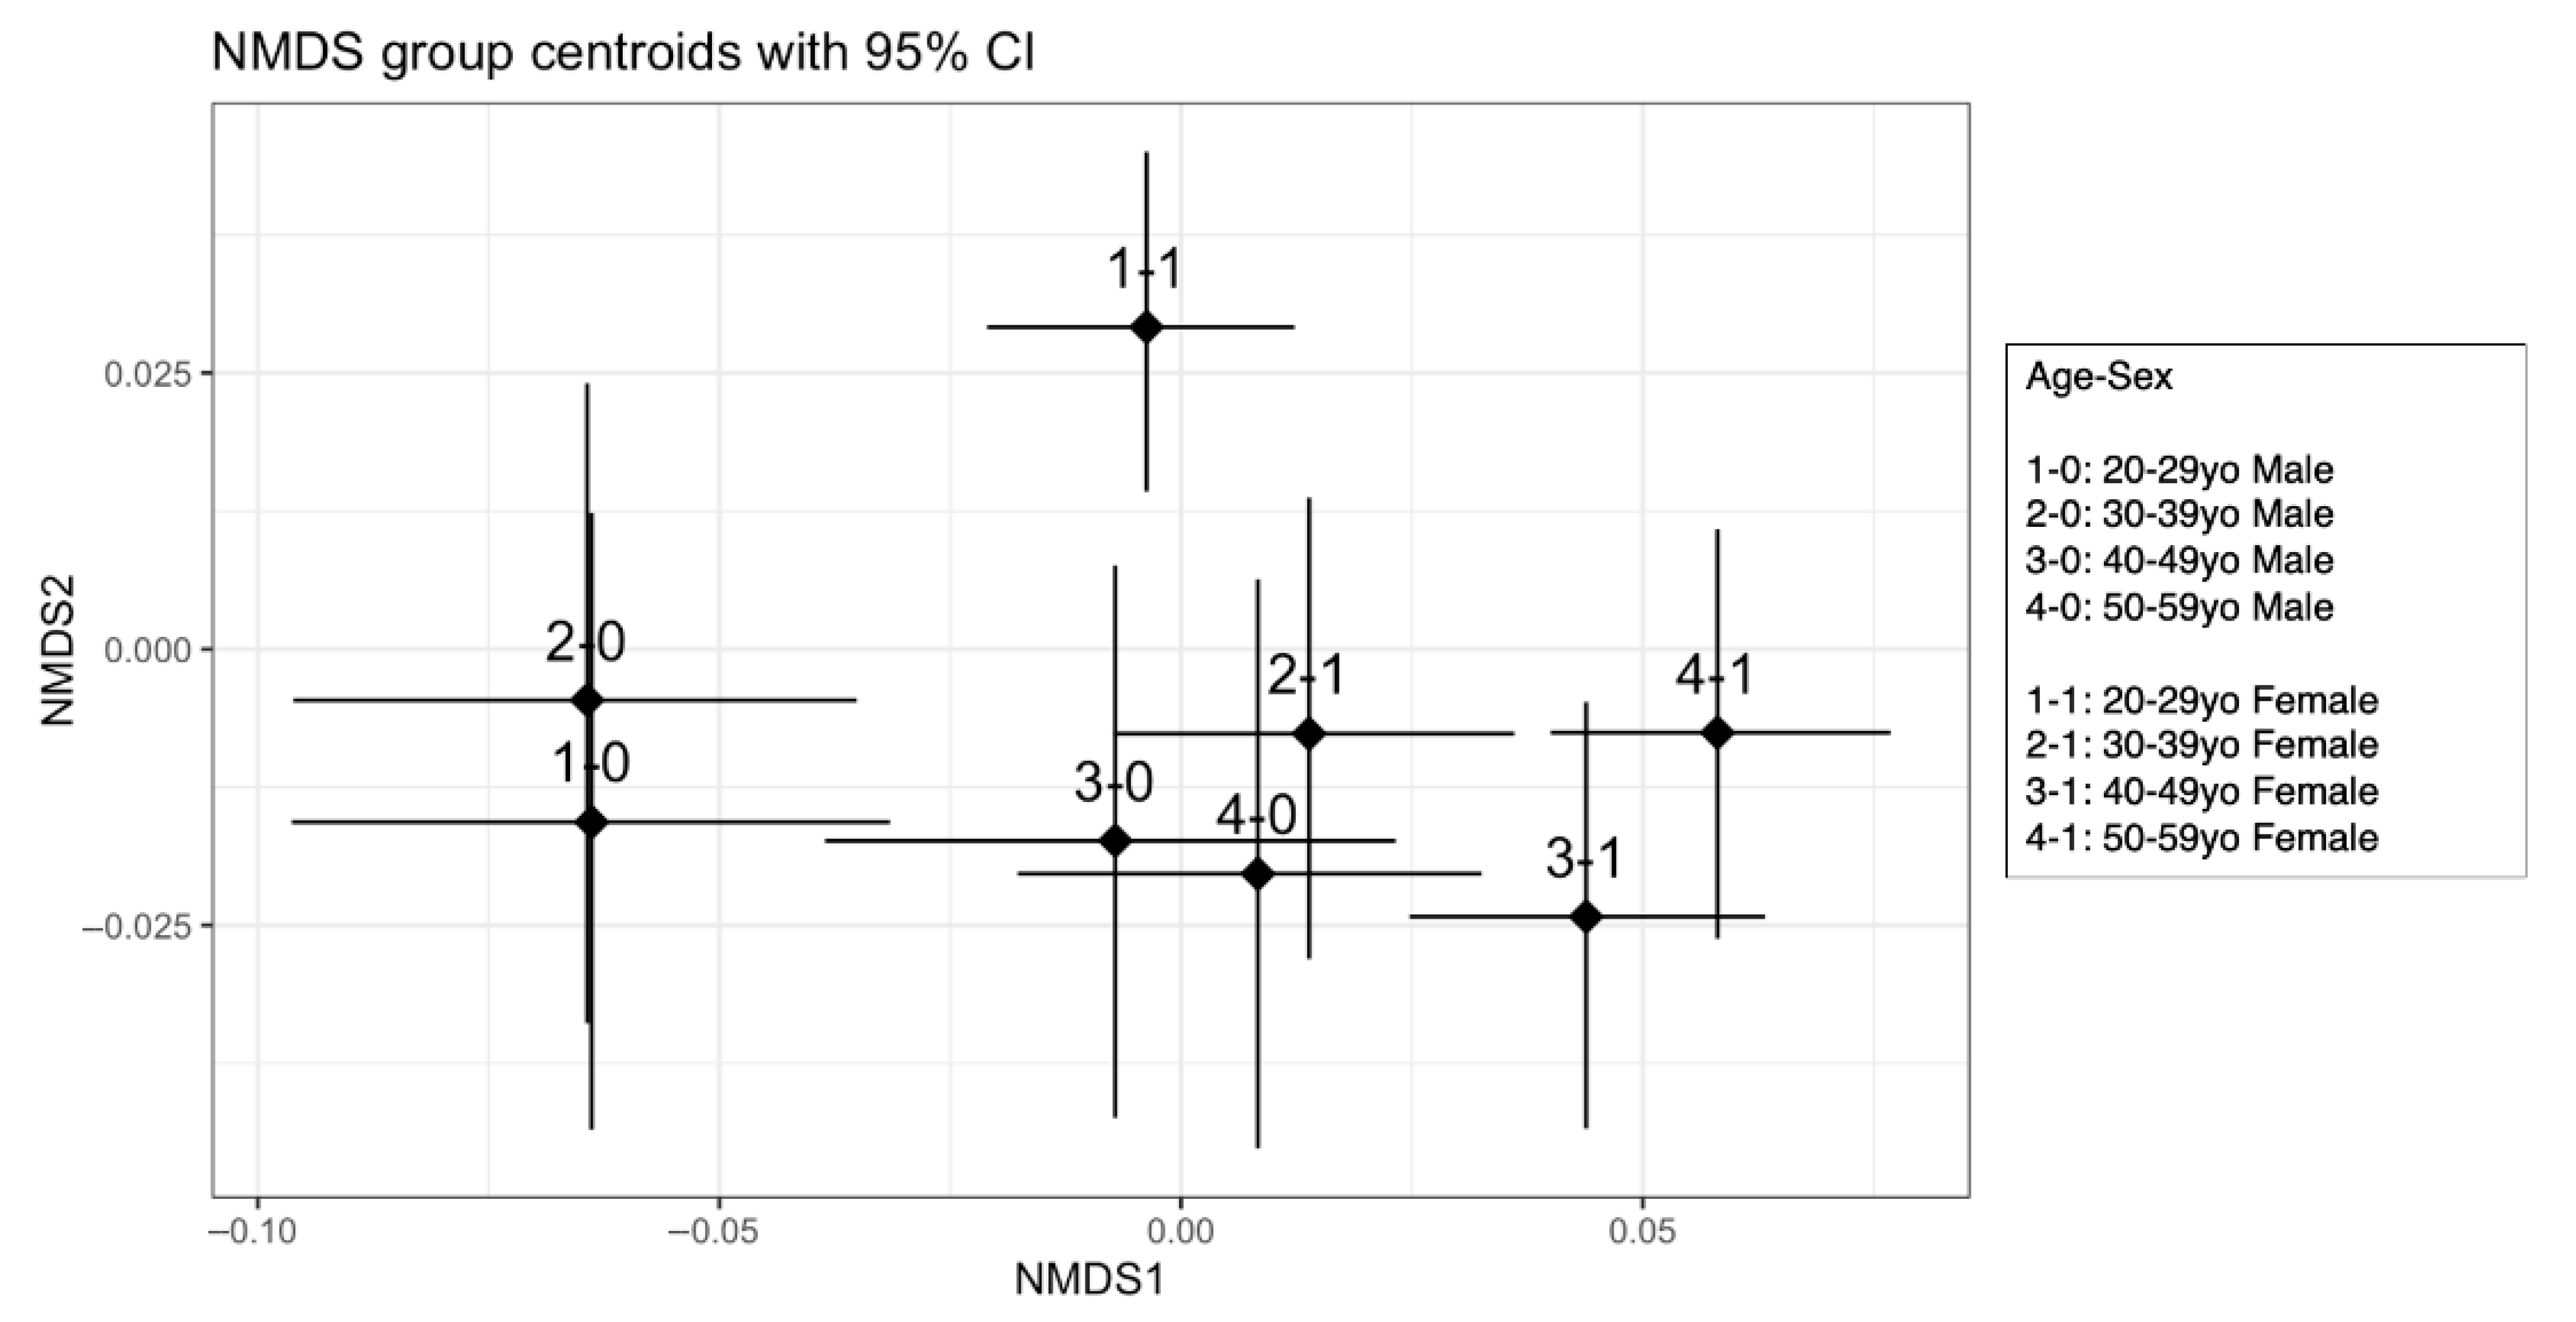
3.4.1. Visualization of Dietary Patterns with NMDS
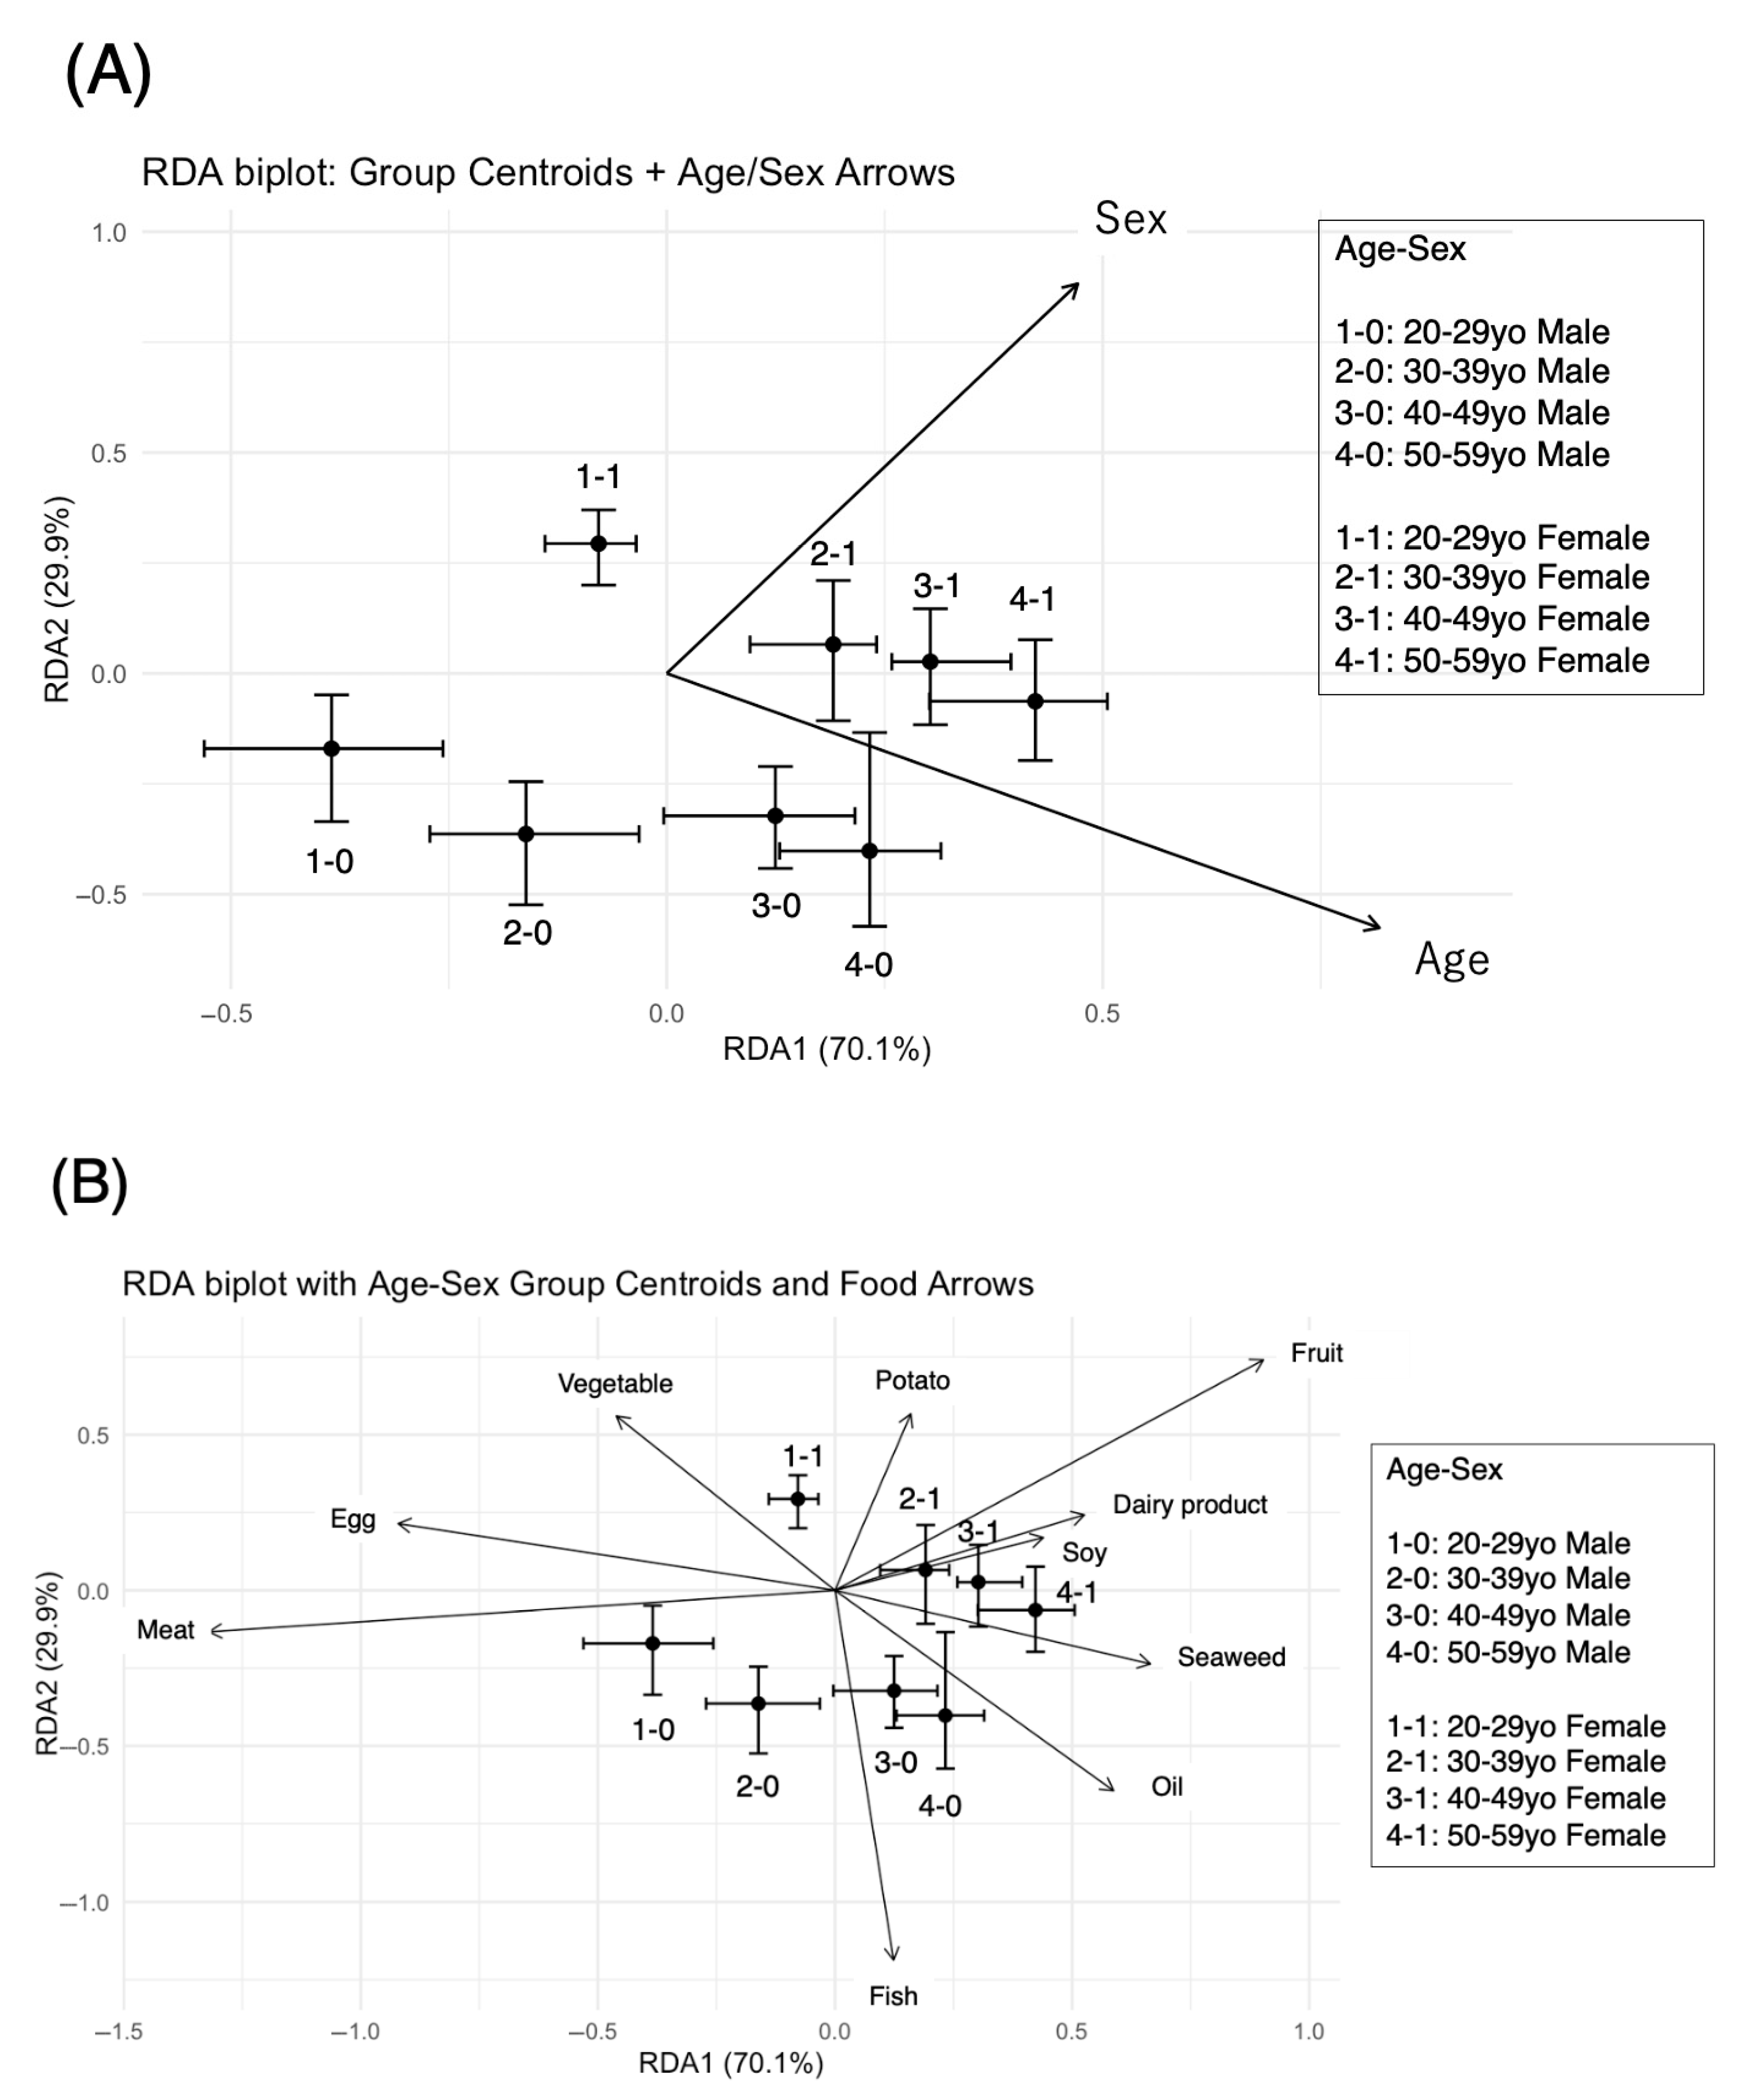
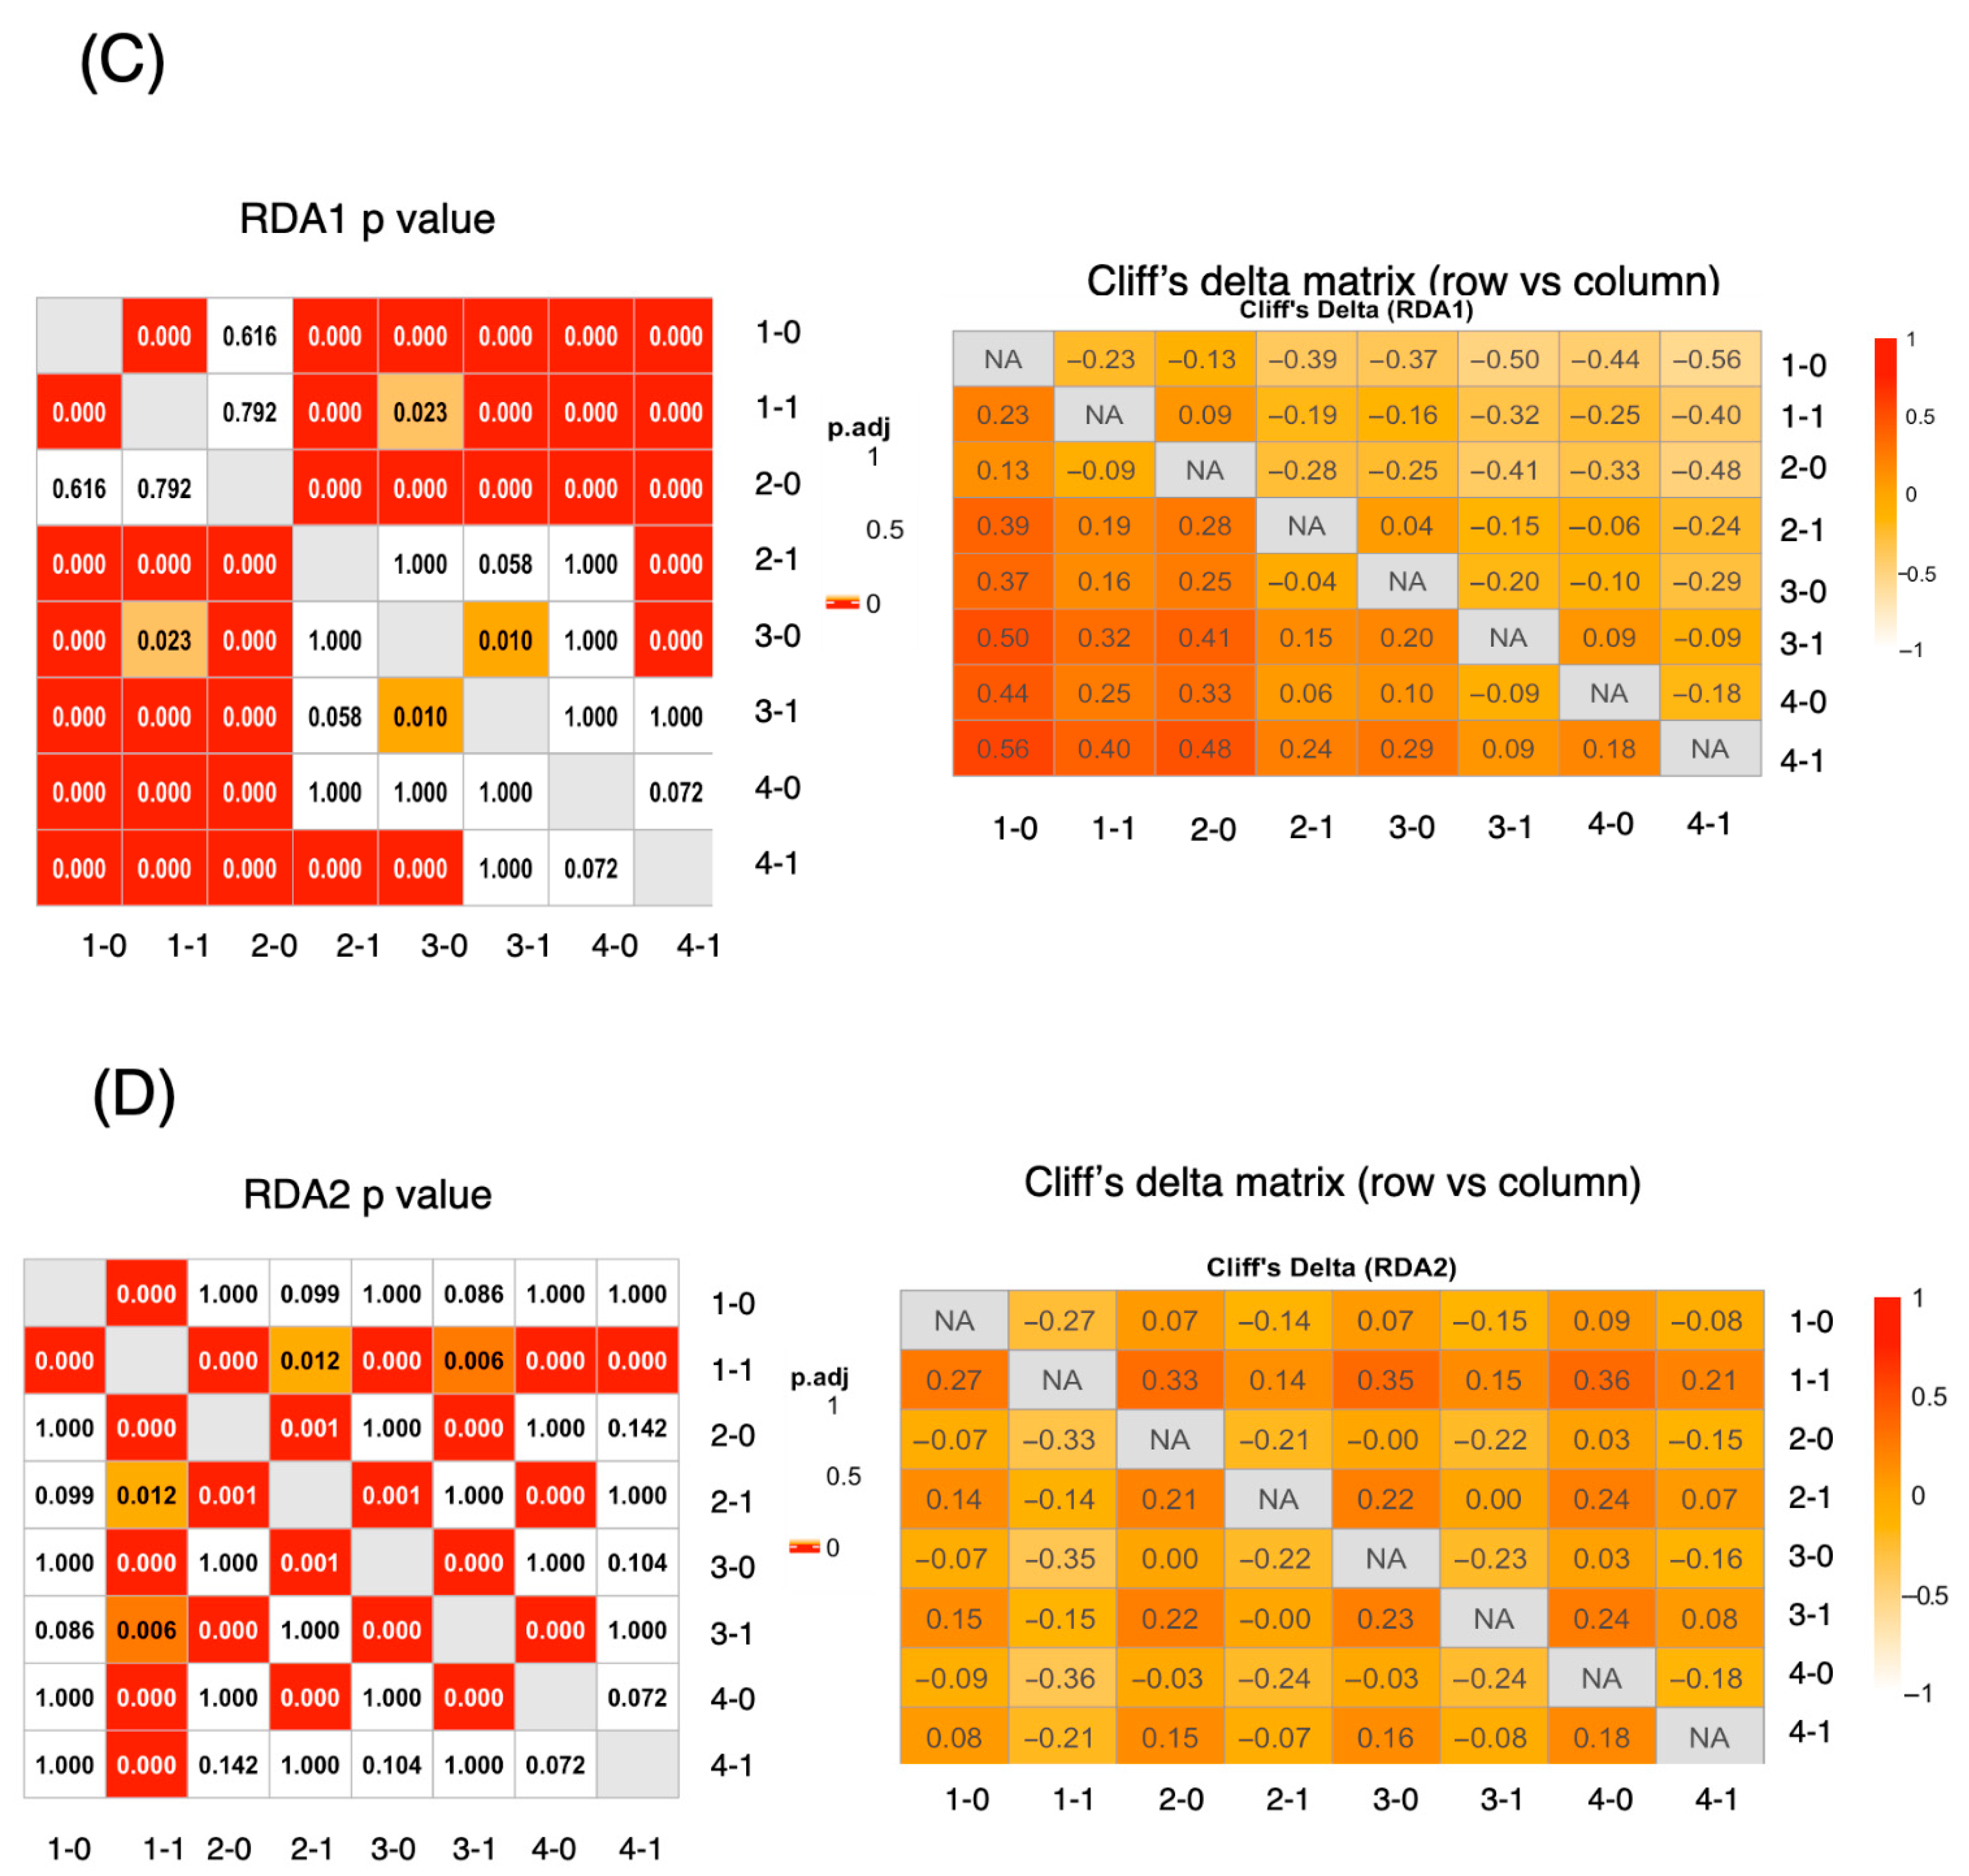
3.4.2. The RDA Results Suggested That Dietary Patterns Varied by Age and Sex
4. Discussion
5. Conclusions
Author Contributions
Funding
Institutional Review Board Statement
Informed Consent Statement
Data Availability Statement
Acknowledgments
Conflicts of Interest
References
- Imamura, F.; Micha, R.; Khatibzadeh, S.; Fahimi, S.; Shi, P.; Powles, J.; Mozaffarian, D.; Global Burden of Diseases Nutrition and Chronic Diseases Expert Group. Dietary quality among men and women in 187 countries in 1990 and 2010: A systematic assessment. Lancet Glob. Health 2015, 3, e132–e142. [Google Scholar] [CrossRef] [PubMed]
- Kaufman, M.R.; Eschliman, E.L.; Karver, T.S. Differentiating sex and gender in health research to achieve gender equity. Bull. World Health Organ 2023, 101, 666–671. [Google Scholar] [CrossRef]
- Wardle, J.; Haase, A.M.; Steptoe, A.; Nillapun, M.; Jonwutiwes, K.; Bellisle, F. Gender differences in food choice: The contribution of health beliefs and dieting. Ann. Behav. Med. 2024, 27, 107–116. [Google Scholar] [CrossRef]
- Iizuka, K.; Yanagi, K.; Deguchi, K.; Ushiroda, C.; Yamamoto-Wada, R.; Kobae, K.; Yamada, Y.; Naruse, H. Sex and Age Differences in the Effects of Food Frequency on Metabolic Parameters in Japanese Adults. Nutrients 2024, 16, 2931. [Google Scholar] [CrossRef] [PubMed]
- Otsuka, R.; Nishita, Y.; Tange, C.; Tomida, M.; Kato, Y.; Imai, T.; Ando, F.; Shimokata, H. Age-Related 12-Year Changes in Dietary Diversity and Food Intakes among Community-Dwelling Japanese Aged 40 to 79 Years. J. Nutr. Health Aging 2018, 22, 594–600. [Google Scholar] [CrossRef]
- Moe, Å.M.; Sørbye, S.H.; Hopstock, L.A.; Carlsen, M.H.; Løvsletten, O.; Ytterstad, E. Identifying dietary patterns across age, educational level and physical activity level in a cross-sectional study: The Tromsø Study 2015—2016. BMC Nutr. 2022, 8, 102. [Google Scholar] [CrossRef] [PubMed]
- Liu, Y.; Kang, M.; Wei, W.; Hui, J.; Gou, Y.; Liu, C.; Zhou, R.; Wang, B.; Shi, P.; Liu, H.; et al. Dietary diversity score and the acceleration of biological aging: A population-based study of 88,039 participants. J. Nutr. Health Aging 2024, 28, 100271. [Google Scholar] [CrossRef]
- Katanoda, K.; Kim, H.S.; Matsumura, Y. New Quantitative Index for Dietary Diversity (QUANTIDD) and its annual changes in the Japanese. Nutrition 2006, 22, 283–287. [Google Scholar] [CrossRef]
- Badal, V.D.; Vaccariello, E.D.; Murray, E.R.; Yu, K.E.; Knight, R.; Jeste, D.V.; Nguyen, T.T. The Gut Microbiome, Aging, and Longevity: A Systematic Review. Nutrients 2020, 12, 3759. [Google Scholar] [CrossRef]
- Mori, A.S.; Isbell, F.; Seidl, R. β-Diversity, Community Assembly, and Ecosystem Functioning. Trends Ecol. Evol. 2018, 33, 549–564. [Google Scholar] [CrossRef]
- Dong, T.S.; Luu, K.; Lagishetty, V.; Sedighian, F.; Woo, S.L.; Dreskin, B.W.; Katzka, W.; Chang, C.; Zhou, Y.; Arias-Jayo, N.; et al. A High Protein Calorie Restriction Diet Alters the Gut Microbiome in Obesity. Nutrients 2020, 12, 3221. [Google Scholar] [CrossRef] [PubMed]
- Panagiotakos, D.; Bountziouka, V.; Zeimbekis, A.; Vlachou, I.; Polychronopoulos, E. Food pattern analysis and prevalence of cardiovascular disease risk factors among elderly people from Mediterranean islands. J. Med. Food 2007, 10, 615–621. [Google Scholar] [CrossRef] [PubMed]
- Zhu, C.; Yu, J. Nonmetric multidimensional scaling corrects for population structure in association mapping with different sample types. Genetics 2009, 182, 875–888. [Google Scholar] [CrossRef]
- Verma, S.; Awasthi, M.K.; Liu, T.; Awasthi, S.K.; Syed, A.; Bahkali, A.H.; Verma, M.; Zhang, Z. Influence of biochar on succession of fungal communities during food waste composting. Bioresour. Technol. 2023, 385, 129437. [Google Scholar] [CrossRef]
- Kaibara, N.; Kimoto, K. A study of the characteristics of the age-related meal intake tendency of Japanese. J. Integr. Study Diet. Habits. 2016, 27, 127–132. [Google Scholar] [CrossRef]
- Murakami, K.; Shinozaki, N.; Fujiwara, A.; Yuan, X.; Hashimoto, A.; Fujihashi, H.; Wang, H.C.; Livingstone, M.B.E.; Sasaki, S. A Systematic Review of Principal Component Analysis-Derived Dietary Patterns in Japanese Adults: Are Major Dietary Patterns Reproducible Within a Country? Adv. Nutr. 2019, 10, 237–249. [Google Scholar] [CrossRef]
- Ramette, A. Multivariate analyses in microbial ecology. FEMS Microbiol. Ecol. 2007, 62, 142–160. [Google Scholar] [CrossRef]
- Takahashi, K. Food Frequency Questionnaire Based on Food Groups for Estimating Individual Nutrient Intake. Jpn. J. Nutr. Diet. 2003, 61, 161–169. [Google Scholar] [CrossRef]
- Romano, J.; Kromrey, J.D.; Coraggio, J.; Skowronek, J.; Levine, L. Exploring methods for evaluating group differences on the NSSE and other surveys: Are the t-test and Cohen’s d indices the most appropriate choices? In Proceedings of the Annual Meeting of the Southern Association for Institutional Research, Arlington, VA, USA, 14–17 October 2006. [Google Scholar]
- Cassol, I.; Ibañez, M.; Bustamante, J.P. Key features and guidelines for the application of microbial alpha diversity metrics. Sci. Rep. 2025, 15, 622. [Google Scholar] [CrossRef]
- Takabayashi, S.; Okada, E.; Hirata, T.; Takimoto, H.; Nakamura, M.; Sasaki, S.; Takahashi, K.; Nakamura, K.; Ukawa, S.; Tamakoshi, A. Nutritional Adequacy Assessment of the Japanese Diet Using the Number of Dishes Compared to Existing Dietary Diversity Indices: A Cross-Sectional Analysis from the 2012 National Health and Nutrition Survey, Japan. J. Nutr. Sci. Vitaminol. 2023, 69, 197–205. [Google Scholar] [CrossRef]
- The Ministry of Health, Labor, and Welfare. Available online: https://www.mhlw.go.jp/content/10900000/001338334.pdf (accessed on 15 May 2025).
- Gupta, A.; Stead, T.S.; Ganti, L. Determining a Meaningful R-squared Value in Clinical Medicine. Acad. Med. Surg. 2024. [Google Scholar] [CrossRef]
- Soam, S.K.; Yashavanth, B.S.; Dhumantarao, T.R.; Maruthamuthu, B.; Balasani, R.; Rakesh, S. Factors influencing dietary patterns among the youth from higher educational institutions in India. Front. Nutr. 2023, 10, 1134455. [Google Scholar] [CrossRef] [PubMed]
- da Costa, G.G.; da Conceição Nepomuceno, G.; da Silva Pereira, A.; Simões, B.F.T. Worldwide dietary patterns and their association with socioeconomic data: An ecological exploratory study. Global Health 2022, 18, 31. [Google Scholar] [CrossRef] [PubMed]
- Kelly English, L.; Scinto-Madonich, S.; Higgins, M.; Bates, M.; Nevins, J.; Kim, J.H.; Callahan, E. What is the relationship between income or Federal Assistance participation/eligibility and following a dietary pattern that aligns with the Dietary Guidelines for Americans, as measured by the Healthy Eating Index (HEI)? In Income, Cost, Time, and Convenience of Food: A Series of Rapid Reviews and Evidence Scans [Internet]; Callahan, E., Bates, M., Kelly English, L., Higgins, M., Kim, J.H., Nevins, J., Scinto-Madonich, S., Eds.; USDA Nutrition Evidence Systematic Review: Alexandria, VA, USA, 2021; Chapter 2. Available online: https://www.ncbi.nlm.nih.gov/books/NBK597887/ (accessed on 5 May 2025).
- Kushitor, S.B.; Alangea, D.O.; Aryeetey, R.; de-Graft Aikins, A. Dietary patterns among adults in three low-income urban communities in Accra, Ghana. PLoS ONE 2023, 18, e0293726. [Google Scholar] [CrossRef] [PubMed] [PubMed Central]

| Total (n = 2743) | Male (n = 921) | Female (n = 1822) | |
|---|---|---|---|
| Age (years old) | 36.05 (11.39) | 38.24 (10.73) | 34.94 (11.56) |
| BMI (kg/m2) | 22.05 (3.45) | 23.30 (3.45) | 21.42 (3.27) |
| HbA1c (%) | 5.45 (0.35) | 5.48 (0.40) | 5.44 (0.33) |
| eGFR (mL/min/1.73 m2) | 89.78 (17.86) | 85.36 (16.46) | 92.02 (18.13) |
| Total Cholesterol (mg/dL) | 190.32 (32.42) | 192.60 (33.08) | 189.17 (32.02) |
| Triglyceride (mg/dL) | 105.31 (86.31) | 135.53 (118.06) | 90.03 (58.99) |
| HDL-C (mg/dL) | 62.54 (14.45) | 54.87 (13.19) | 66.42 (13.49) |
| Total (n = 2743) | Male (n = 921) | Female (n = 1822) | p | Cliff‘s Delta (Male vs. Female) | |
|---|---|---|---|---|---|
| Meat | 8.0 (6.0–11.0) | 9.0 (6.0–12.0) | 8.0 (5.0–11.0) | <0.001 | 0.099 |
| Fish | 4.0 (2.0–6.0) | 4.0 (2.0–6.0) | 4.0 (2.0–6.0) | <0.001 | 0.11 |
| Egg | 4.0 (3.0–6.0) | 4.0 (3.0–7.0) | 4.0 (3.0–6.0) | 0.83 | 0.005 |
| Soy | 5.0 (3.0–8.0) | 5.0 (2.0–8.0) | 5.0 (3.0–8.0) | 0.0036 | −0.068 |
| Dairy product | 5.0 (2.0–10.0) | 4.0 (1.0–9.0) | 5.0 (2.0–10.0) | <0.001 | −0.11 |
| Seaweed | 2.0 (0.0–3.0) | 2.0 (0.0–3.0) | 2.0 (0.0–3.0) | 0.086 | −0.039 |
| Vegetable | 8.0 (6.0–12.0) | 8.0 (5.0–11.0) | 8.0 (6.0–12.0) | 0.0059 | −0.064 |
| Fruit | 2.0 (1.0–5.0) | 2.0 (0.0–4.0) | 3.0 (1.0–5.0) | <0.001 | −0.19 |
| Potato | 2.0 (1.0–3.0) | 2.0 (1.0–3.0) | 2.0 (1.0–3.0) | <0.001 | −0.10 |
| Oil | 11.0 (7.0–15.0) | 11.0 (7.0–15.0) | 11.0 (7.0–15.0) | 0.98 | −0.0007 |
| Value | |
|---|---|
| Total variance explained (R2) | 2.01% |
| Adjusted R2 | 1.94% |
| Variance explained by RDA axes | |
| -RDA1 | 1.41% |
| -RDA2 | 0.60% |
| Variance explained within constrained space | |
| -RDA1 | 70.1% |
| -RDA2 | 29.9% |
| Contribution of each predictor | |
| -Age | 56.7% |
| -Sex | 43.3% |
| Correlation between predictors and RDA axes | |
| -RDA1—Age | r = 0.26 |
| -RDA2—Age | r = −0.14 |
| -RDA1—Sex | r = 0.15 |
| -RDA2—Sex | r = 0.21 |
| Permutation test results (n = 999) | |
| -Age: F = 31.95, Variance = 0.114 | p = 0.001 |
| -Sex: F = 24.36, Variance = 0.087 | p = 0.001 |
| RDA1 | RDA2 | |
|---|---|---|
| 20–29 y/o male | −0.38 (−0.53, −0.26) | −0.17 (−0.34, −0.049) |
| 30–39 y/o male | −0.16 (−0.27, −0.032) | −0.36 (−0.52, −0.25) |
| 40–49 y/o male | 0.13 (−0.003, 0.22) | −0.32 (−0.44, −0.21) |
| 50–59 y/o male | 0.23 (0.13, 0.32) | −0.40 (−0.57, −0.13) |
| 20–29 y/o female | −0.078 (−0.14, −0.035) | 0.29 (0.20, 0.37) |
| 30–39 y/o female | 0.19 (0.095, 0.24) | 0.065 (−0.11, 0.21) |
| 40–49yo female | 0.30 (0.26, 0.40) | 0.026 (−0.12, 0.15) |
| 50–59 y/o female | 0.42 (0.30, 0.51) | −0.063 (−0.20, 0.076) |
| Predictor | RDA1 | RDA2 | Interpretation |
|---|---|---|---|
| Age | 0.817 | −0.576 | Age increases along the RDA1 (right) and slightly down RDA2 |
| Sex (1 = female) | 0.471 | 0.882 | Female-associated direction is upper-right in RDA space |
| Food Group | RDA1 | RDA2 | Vector Length (√(RDA12 + RDA22)) |
|---|---|---|---|
| Fruit | 0.62 | 0.41 | 1.04 |
| Meat | −0.91 | −0.074 | 0.98 |
| Oil | 0.41 | −0.36 | 0.76 |
| Egg | −0.64 | 0.12 | 0.75 |
| Fish | 0.085 | −0.66 | 0.75 |
| Vegetable | −0.32 | 0.31 | 0.63 |
| Seaweed | 0.46 | −0.13 | 0.59 |
| Dairy product | 0.36 | 0.14 | 0.5 |
| Potato | 0.11 | 0.32 | 0.43 |
| Soy | 0.3 | 0.095 | 0.39 |
Disclaimer/Publisher’s Note: The statements, opinions and data contained in all publications are solely those of the individual author(s) and contributor(s) and not of MDPI and/or the editor(s). MDPI and/or the editor(s) disclaim responsibility for any injury to people or property resulting from any ideas, methods, instructions or products referred to in the content. |
© 2025 by the authors. Licensee MDPI, Basel, Switzerland. This article is an open access article distributed under the terms and conditions of the Creative Commons Attribution (CC BY) license (https://creativecommons.org/licenses/by/4.0/).
Share and Cite
Iizuka, K.; Yanagi, K.; Deguchi, K.; Ushiroda, C.; Yamamoto-Wada, R.; Ishihara, T.; Naruse, H. The Alpha and Beta Diversities of Dietary Patterns Differed by Age and Sex in Young and Middle-Aged Japanese Participants. Nutrients 2025, 17, 2205. https://doi.org/10.3390/nu17132205
Iizuka K, Yanagi K, Deguchi K, Ushiroda C, Yamamoto-Wada R, Ishihara T, Naruse H. The Alpha and Beta Diversities of Dietary Patterns Differed by Age and Sex in Young and Middle-Aged Japanese Participants. Nutrients. 2025; 17(13):2205. https://doi.org/10.3390/nu17132205
Chicago/Turabian StyleIizuka, Katsumi, Kotone Yanagi, Kanako Deguchi, Chihiro Ushiroda, Risako Yamamoto-Wada, Takuma Ishihara, and Hiroyuki Naruse. 2025. "The Alpha and Beta Diversities of Dietary Patterns Differed by Age and Sex in Young and Middle-Aged Japanese Participants" Nutrients 17, no. 13: 2205. https://doi.org/10.3390/nu17132205
APA StyleIizuka, K., Yanagi, K., Deguchi, K., Ushiroda, C., Yamamoto-Wada, R., Ishihara, T., & Naruse, H. (2025). The Alpha and Beta Diversities of Dietary Patterns Differed by Age and Sex in Young and Middle-Aged Japanese Participants. Nutrients, 17(13), 2205. https://doi.org/10.3390/nu17132205