
Association Between Plant-Based Diets and Metabolic Syndrome in Zhejiang, China: A Cross-Sectional Study

 ,
,
Abstract
1. Introduction
2. Materials and Methods
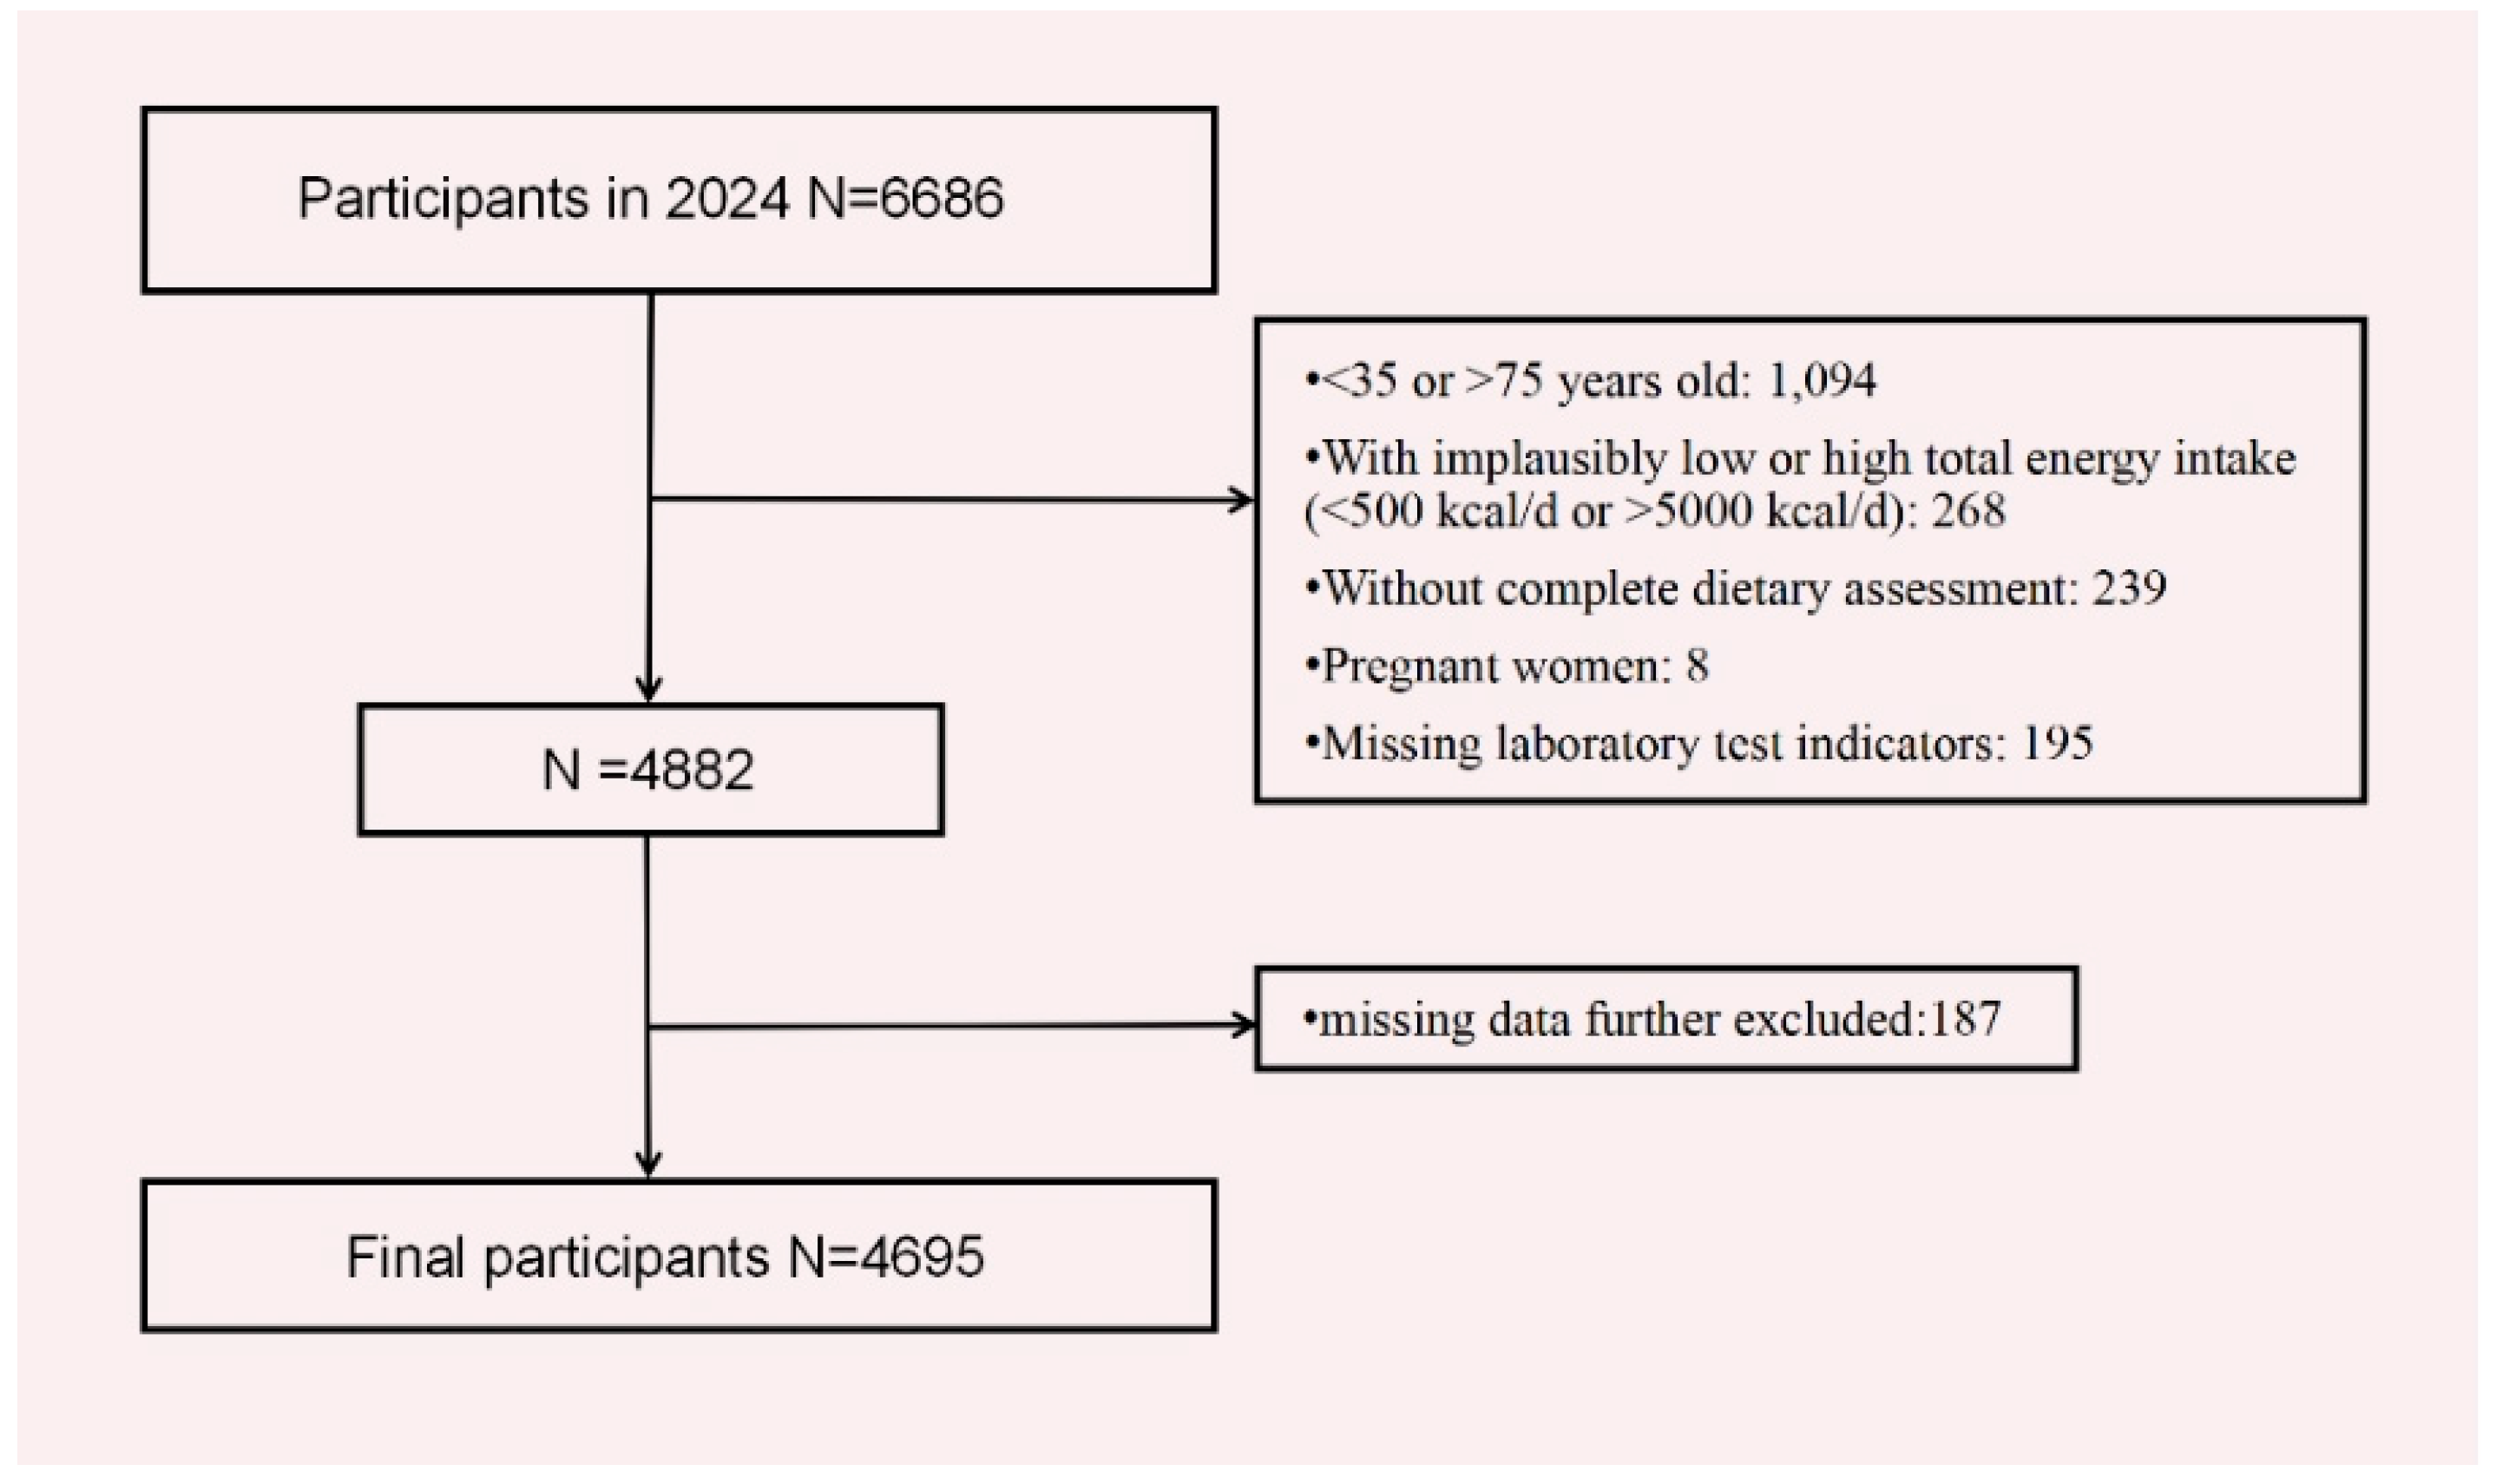
2.1. Study Design and Study Population
2.2. Data Collection
2.3. Assessment of Plant-Based Diet Indices
2.4. Definition of the Metabolic Syndrome
2.5. Assessment of Covariates
2.6. Statistical Analysis
3. Results
3.1. Characteristics of Participants
3.2. Food Characteristics
3.3. Association Between Plant-Based Diet Indices and MetS
3.4. Subgroup Analysis
4. Discussion
5. Conclusions
Supplementary Materials
Author Contributions
Funding
Institutional Review Board Statement
Informed Consent Statement
Data Availability Statement
Acknowledgments
Conflicts of Interest
References
- Alberti, K.G.; Zimmet, P.; Shaw, J. The metabolic syndrome—A new worldwide definition. Lancet 2005, 366, 1059–1062. [Google Scholar] [CrossRef] [PubMed]
- Noubiap, J.J.; Nansseu, J.R.; Lontchi-Yimagou, E.; Nkeck, J.R.; Nyaga, U.F.; Ngouo, A.T.; Tounouga, D.N.; Tianyi, F.L.; Foka, A.J.; Ndoadoumgue, A.L.; et al. Geographic distribution of metabolic syndrome and its components in the general adult population: A meta-analysis of global data from 28 million individuals. Diabetes Res. Clin. Pract. 2022, 188, 109924. [Google Scholar] [CrossRef]
- Yao, F.; Bo, Y.; Zhao, L.; Li, Y.; Ju, L.; Fang, H.; Piao, W.; Yu, D.; Lao, X. Prevalence and Influencing Factors of Metabolic Syndrome among Adults in China from 2015 to 2017. Nutrients 2021, 13, 4475. [Google Scholar] [CrossRef]
- Zhao, X.; Lu, C.; Song, B.; Chen, D.; Teng, D.; Shan, Z.; Teng, W. The prevalence and clustering of metabolic syndrome risk components in Chinese population: A cross-sectional study. Front. Endocrinol. 2023, 14, 1290855. [Google Scholar] [CrossRef] [PubMed]
- Devaraj, S.; Valleggi, S.; Siegel, D.; Jialal, I. Correction to: Role of C-Reactive Protein in Contributing to Increased Cardiovascular Risk in Metabolic Syndrome. Curr. Atheroscler. Rep. 2019, 21, 4. [Google Scholar] [CrossRef] [PubMed]
- Turner-McGrievy, G.; Harris, M. Key elements of plant-based diets associated with reduced risk of metabolic syndrome. Curr. Diabetes Rep. 2014, 14, 524. [Google Scholar] [CrossRef]
- Jafari, F.; Amini Kahrizsangi, M.; Najam, W.; Fattahi, M.R.; Nouri, M.; Ghalandari, H.; Askarpour, M.; Hamidian Shirazi, M.; Akbarzadeh, M. Association of plant-based dietary patterns with metabolic syndrome: Baseline results from the Persian Kavar cohort study (PKCS). Int. J. Food Sci. Nutr. 2023, 74, 291–301. [Google Scholar] [CrossRef]
- Yuan, L.; Jiang, Q.; Zhai, Y.; Zhao, Z.; Liu, Y.; Hu, F.; Qian, Y.; Sun, J. Association between Plant-based Diet and Risk of Chronic Diseases and All-Cause Mortality in Centenarians in China: A Cohort Study. Curr. Dev. Nutr. 2024, 8, 102065. [Google Scholar] [CrossRef]
- Wang, Y.; Liu, B.; Han, H.; Hu, Y.; Zhu, L.; Rimm, E.B.; Hu, F.B.; Sun, Q. Associations between plant-based dietary patterns and risks of type 2 diabetes, cardiovascular disease, cancer, and mortality—A systematic review and meta-analysis. Nutr. J. 2023, 22, 46. [Google Scholar] [CrossRef]
- Hargreaves, S.M.; Rosenfeld, D.L.; Moreira, A.V.B.; Zandonadi, R.P. Plant-based and vegetarian diets: An overview and definition of these dietary patterns. Eur. J. Nutr. 2023, 62, 1109–1121. [Google Scholar] [CrossRef]
- Satija, A.; Bhupathiraju, S.N.; Rimm, E.B.; Spiegelman, D.; Chiuve, S.E.; Borgi, L.; Willett, W.C.; Manson, J.E.; Sun, Q.; Hu, F.B. Plant-Based Dietary Patterns and Incidence of Type 2 Diabetes in US Men and Women: Results from Three Prospective Cohort Studies. PLoS Med. 2016, 13, e1002039. [Google Scholar] [CrossRef] [PubMed]
- Satija, A.; Bhupathiraju, S.N.; Spiegelman, D.; Chiuve, S.E.; Manson, J.E.; Willett, W.; Rexrode, K.M.; Rimm, E.B.; Hu, F.B. Healthful and Unhealthful Plant-Based Diets and the Risk of Coronary Heart Disease in U.S. Adults. J. Am. Coll. Cardiol. 2017, 70, 411–422. [Google Scholar] [CrossRef]
- Kim, H.; Lee, K.; Rebholz, C.M.; Kim, J. Association between unhealthy plant-based diets and the metabolic syndrome in adult men and women: A population-based study in South Korea. Br. J. Nutr. 2021, 125, 577–590. [Google Scholar] [CrossRef]
- Lanuza, F.; Meroño, T.; Zamora-Ros, R.; Bondonno, N.P.; Rostgaard-Hansen, A.L.; Sánchez-Pla, A.; Miro, B.; Carmona-Pontaque, F.; Riccardi, G.; Tjønneland, A.; et al. Plasma metabolomic profiles of plant-based dietary indices reveal potential pathways for metabolic syndrome associations. Atherosclerosis 2023, 382, 117285. [Google Scholar] [CrossRef]
- Qi, Q.; Li, J.; Yu, B.; Moon, J.Y.; Chai, J.C.; Merino, J.; Hu, J.; Ruiz-Canela, M.; Rebholz, C.; Wang, Z.; et al. Host and gut microbial tryptophan metabolism and type 2 diabetes: An integrative analysis of host genetics, diet, gut microbiome and circulating metabolites in cohort studies. Gut 2022, 71, 1095–1105. [Google Scholar] [CrossRef] [PubMed]
- Salehin, S.; Rasmussen, P.; Mai, S.; Mushtaq, M.; Agarwal, M.; Hasan, S.M.; Salehin, S.; Raja, M.; Gilani, S.; Khalife, W.I. Plant Based Diet and Its Effect on Cardiovascular Disease. Int. J. Environ. Res. Public Health 2023, 20, 3337. [Google Scholar] [CrossRef] [PubMed]
- Zhuang, P.; Wang, F.; Yao, J.; Liu, X.; Li, Y.; Ao, Y.; Ye, H.; Wan, X.; Zhang, Y.; Jiao, J. Unhealthy plant-based diet is associated with a higher cardiovascular disease risk in patients with prediabetes and diabetes: A large-scale population-based study. BMC Med. 2024, 22, 485. [Google Scholar] [CrossRef]
- Langmann, F.; Prioux, C.; Touvier, M.; Kesse-Guyot, E.; Fezeu, L.K.; Baudry, J.; Dahm, C.C.; Allès, B. Plant-based diets, legumes, and prevalence of cardiometabolic risk factors in the NutriNet-Santé cohort. Eur. J. Nutr. 2025, 64, 193. [Google Scholar] [CrossRef]
- Nie, G.; Wan, J.J.; Jiang, L.; Hou, S.K.; Peng, W. Correlation Analysis between Uric Acid and Metabolic Syndrome in the Chinese Elderly Population: A Cross-Sectional Study. Int. J. Endocrinol. 2023, 2023, 8080578. [Google Scholar] [CrossRef]
- Gui, X.Y.; Yu, X.L.; Jin, H.Z.; Zuo, Y.G.; Wu, C. Prevalence of metabolic syndrome in Chinese psoriasis patients: A hospital-based cross-sectional study. J. Diabetes Investig. 2018, 9, 39–43. [Google Scholar] [CrossRef]
- Jovanovic, C.E.S.; Hoelscher, D.M.; Chen, B.; Ranjit, N.; van den Berg, A.E. The associations of plant-based food and metabolic syndrome using NHANES 2015–2016 data. J. Public Health 2023, 45, e22–e29. [Google Scholar] [CrossRef] [PubMed]
- McGrath, L.; Fernandez, M.-L. Plant-based diets and metabolic syndrome: Evaluating the influence of diet quality. J. Agric. Food Res. 2022, 9, 100322. [Google Scholar] [CrossRef]
- Huo, Y.; Cao, S.; Liu, J.; Zhang, B.; Xu, K.; Wang, Y.; Liu, H.; Yang, P.; Zeng, L.; Yan, H.; et al. The Association between Plant-Based Diet Indices and Metabolic Syndrome in Chinese Adults: Longitudinal Analyses from the China Health and Nutrition Survey. Nutrients 2023, 15, 1341. [Google Scholar] [CrossRef] [PubMed]
- Shahdadian, F.; Saneei, P.; Lotfi, K.; Feizi, A.; Askari, G.; Safavi, S.M. Association of plant-based diets with adropin, atherogenic index of plasma, and metabolic syndrome and its components: A cross-sectional study on adults. Front. Nutr. 2023, 10, 1077709. [Google Scholar] [CrossRef]
- Wiśniewska, K.; Okręglicka, K.M.; Nitsch-Osuch, A.; Oczkowski, M. Plant-Based Diets and Metabolic Syndrome Components: The Questions That Still Need to Be Answered-A Narrative Review. Nutrients 2024, 16, 165. [Google Scholar] [CrossRef]
- Chen, B.; Zeng, J.; Qin, M.; Xu, W.; Zhang, Z.; Li, X.; Xu, S. The Association Between Plant-Based Diet Indices and Obesity and Metabolic Diseases in Chinese Adults: Longitudinal Analyses From the China Health and Nutrition Survey. Front. Nutr. 2022, 9, 881901. [Google Scholar] [CrossRef]
- Nutrition Society. Dietary Guidelines for Chinese Residents (2022); People’s Medical Publishing House: Beijing, China, 2022. [Google Scholar]
- National Health Commission of the People’s Republic of China. Report on Nutrition and Chronic Diseases of Chinese Residents (2020); People’s Medical Publishing House: Beijing, China, 2020. [Google Scholar]
- Diabetes Branch of Chinese Medical Association. Guidelines for the Prevention and Treatment of Type 2 Diabetes Mellitus in China (2020 Edition) (Part 2). Chin. J. Pract. Intern. Med. 2021, 41, 757–784. [Google Scholar] [CrossRef]
- World Health Organization. WHO Guidelines Approved by the Guidelines Review Committee. In WHO Guidelines on Physical Activity and Sedentary Behaviour; World Health Organization: Geneva, Switzerland, 2020. [Google Scholar]
- Kim, H.; Lee, K.; Rebholz, C.M.; Kim, J. Plant-based diets and incident metabolic syndrome: Results from a South Korean prospective cohort study. PLoS Med. 2020, 17, e1003371. [Google Scholar] [CrossRef]
- Amini, M.R.; Shahinfar, H.; Djafari, F.; Sheikhhossein, F.; Naghshi, S.; Djafarian, K.; Clark, C.C.; Shab-Bidar, S. The association between plant-based diet indices and metabolic syndrome in Iranian older adults. Nutr. Health 2021, 27, 435–444. [Google Scholar] [CrossRef]
- Tang, S.; Zhou, J.; Liu, C.; Wang, S.; Cong, Y.; Chen, L.; Zhang, L.; Tan, X.; Li, T.; Li, Y.; et al. Association of plant-based diet index with sleep quality in middle-aged and older adults: The Healthy Dance Study. Sleep Health 2023, 9, 698–703. [Google Scholar] [CrossRef]
- Qiu, M.; Fang, Y.; Lian, Y.; He, Y. Regional Distribution Characteristics of Dietary Patterns Among Chinese Adults. China Food Nutr. 2023, 29, 62–66. [Google Scholar] [CrossRef]
- Pan, X.-F.; Wang, L.; Pan, A. Epidemiology and determinants of obesity in China. Lancet Diabetes Endocrinol. 2021, 9, 373–392. [Google Scholar] [CrossRef] [PubMed]
- Prioux, C.; Wagner, S.; Fézeu, L.K.; Deschamps, V.; Verdot, C.; Baudry, J.; Touvier, M.; Herberg, S.; Nazare, J.A.; Hoge, A.; et al. Cross-sectional associations between healthy and unhealthy plant-based diets and metabolic syndrome in three distinct French populations, a meta-analysis. Br. J. Nutr. 2025, 133, 949–965. [Google Scholar] [CrossRef] [PubMed]
- Jung, S.; Park, S. Positive association of unhealthy plant-based diets with the incidence of abdominal obesity in Korea: A comparison of baseline, most recent, and cumulative average diets. Epidemiol. Health 2022, 44, e2022063. [Google Scholar] [CrossRef] [PubMed]
- Wang, X.J.; Voortman, T.; de Crom, T.O.E.; Tilly, M.; Kavousi, M.; Ikram, M.K.; Steur, M. Healthy and unhealthy plant-based diets and the risk of cardiovascular diseases: The Rotterdam study and updated meta-analysis. Prog. Cardiovasc. Dis. 2024, 87, 8–15. [Google Scholar] [CrossRef]
- Daneshzad, E.; Keshavarz, S.A.; Qorbani, M.; Larijani, B.; Bellissimo, N.; Azadbakht, L. Association of dietary acid load and plant-based diet index with sleep, stress, anxiety and depression in diabetic women. Br. J. Nutr. 2020, 123, 901–912. [Google Scholar] [CrossRef]
- He, J.; Chen, G.; Wu, S.; Niu, R.; Fan, X. Patterns of negative emotional eating among Chinese young adults: A latent class analysis. Appetite 2020, 155, 104808. [Google Scholar] [CrossRef]
- Pitcho, S.; Kagan, M. Exploring gender differences in the mediating effect of emotional eating on anxiety and body image. Appetite 2025, 214, 108143. [Google Scholar] [CrossRef]
- Huang, Z. Reason’s Triumph over Passion? Chinese Adults’ Attention to Information on Ultra-Processed Foods’ Fat and Sodium Contents in Nutrition Facts Tables. Nutrients 2025, 17, 174. [Google Scholar] [CrossRef]
- Suliga, E.; Kozieł, D.; Cieśla, E.; Głuszek, S. Association between dietary patterns and metabolic syndrome in individuals with normal weight: A cross-sectional study. Nutr. J. 2015, 14, 55. [Google Scholar] [CrossRef]
- O’Neill, B.J. Effect of low-carbohydrate diets on cardiometabolic risk, insulin resistance, and metabolic syndrome. Curr. Opin. Endocrinol. Diabetes Obes. 2020, 27, 301–307. [Google Scholar] [CrossRef]
- Kwon, Y.J.; Lee, H.S.; Lee, J.W. Association of carbohydrate and fat intake with metabolic syndrome. Clin. Nutr. 2018, 37, 746–751. [Google Scholar] [CrossRef]
- Cooke, A.A.; Connaughton, R.M.; Lyons, C.L.; McMorrow, A.M.; Roche, H.M. Fatty acids and chronic low grade inflammation associated with obesity and the metabolic syndrome. Eur. J. Pharmacol. 2016, 785, 207–214. [Google Scholar] [CrossRef] [PubMed]
- Zhao, Q.; Wu, Q.; Zhong, H.; Yan, B.; Wu, J.; Guo, W. Association of dietary habits with body mass index and waist circumference, and their interaction effect on hypertension. Medicine 2024, 103, e38178. [Google Scholar] [CrossRef] [PubMed]
- Nikparast, A.; Etesami, E.; Rahmani, J.; Rafiei, N.; Ghanavati, M. The association between plant-based diet indices and metabolic syndrome: A systematic review and dose-response meta-analysis. Front. Nutr. 2023, 10, 1305755. [Google Scholar] [CrossRef]
- Kou, L.; Sun, J.; Wu, P.; Cheng, Z.; Zhou, P.; Li, N.; Cheng, L.; Xu, P.; Xue, Y.; Tian, J.; et al. Associations of dietary pattern, insulin resistance and risk of developing metabolic syndrome among Chinese population. PLoS ONE 2024, 19, e0308090. [Google Scholar] [CrossRef] [PubMed]
- Remde, A.; DeTurk, S.N.; Almardini, A.; Steiner, L.; Wojda, T. Plant-predominant eating patterns—How effective are they for treating obesity and related cardiometabolic health outcomes?—A systematic review. Nutr. Rev. 2022, 80, 1094–1104. [Google Scholar] [CrossRef]
- da Silva, F.M.O.; Pimenta, A.M.; Juvanhol, L.L.; Hermsdorff, H.H.M.; Bressan, J. Healthful plant-based diet and incidence of hypertension in Brazilian adults: A six-year follow-up of the CUME study. Nutrition 2025, 133, 112711. [Google Scholar] [CrossRef]
- Nikparast, A.; Mirzaei, P.; Tadayoni, Z.S.; Asghari, G. The Association Between Overall, Healthy, and Unhealthy Plant-Based Diet Index and Risk of Prediabetes and Type 2 Diabetes Mellitus: A Systematic Review and Dose-Response Meta-Analysis of Prospective Studies. Nutr. Rev. 2025, 83, e157–e177. [Google Scholar] [CrossRef]
- Wang, Y.B.; Shivappa, N.; Hébert, J.R.; Page, A.J.; Gill, T.K.; Melaku, Y.A. Association between Dietary Inflammatory Index, Dietary Patterns, Plant-Based Dietary Index and the Risk of Obesity. Nutrients 2021, 13, 1536. [Google Scholar] [CrossRef]
- Clemente-Suárez, V.J.; Beltrán-Velasco, A.I.; Redondo-Flórez, L.; Martín-Rodríguez, A.; Tornero-Aguilera, J.F. Global Impacts of Western Diet and Its Effects on Metabolism and Health: A Narrative Review. Nutrients 2023, 15, 2749. [Google Scholar] [CrossRef] [PubMed]
- Wang, J.; Lin, X.; Bloomgarden, Z.T.; Ning, G. The Jiangnan diet, a healthy diet pattern for Chinese. J. Diabetes 2020, 12, 365–371. [Google Scholar] [CrossRef] [PubMed]
- Yu, X.; Zhang, J.; Ying, Y.; Wang, L.; Zhu, S. Analysis of Fatty Acid Content in Jiangnan Cuisine Dishes in Hangzhou. J. Hyg. Res. 2024, 53, 923–927. [Google Scholar] [CrossRef]
- Han, Z.; Zheng, X.; Hou, L.; Xiao, N.; Deng, X. Changes in China’s food security driven by nutrition security and resource constraints. Environ. Dev. Sustain. 2023, 26, 7927–7945. [Google Scholar] [CrossRef]
- Tang, D.; Bu, T.; Feng, Q.; Liu, Y.; Dong, X. Differences in Overweight and Obesity between the North and South of China. Am. J. Health Behav. 2020, 44, 780–793. [Google Scholar] [CrossRef]


| Characteristic | Total | Q1 | Q2 | Q3 | Q4 | Q5 | p |
|---|---|---|---|---|---|---|---|
| PDI | |||||||
| Sample size, n | 4695 | 897 | 976 | 836 | 985 | 1001 | |
| Ethnic group, n (%) | 0.307 | ||||||
| Han | 4663 (99.3) | 889 (99.1) | 970 (99.4) | 827 (98.9) | 979 (99.4) | 998 (99.7) | |
| Others | 32 (0.7) | 8 (0.9) | 6 (0.6) | 9 (1.1) | 6 (0.6) | 3 (0.3) | |
| Sex, n (%) | 0.704 | ||||||
| Male | 2144 (45.7) | 396 (44.2) | 448 (45.9) | 385 (46) | 442 (44.9) | 473 (47.2) | |
| Female | 2551 (54.3) | 501 (55.8) | 528 (54.1) | 451 (54) | 543 (55.1) | 528 (52.8) | |
| Age, year | 0.002 | ||||||
| 35–44 | 1237 (26.4) | 259 (28.9) | 265 (27.2) | 233 (27.9) | 262 (26.6) | 218 (21.8) | |
| 45–54 | 835 (17.8) | 168 (18.7) | 191 (19.6) | 149 (17.8) | 166 (16.8) | 161 (16.1) | |
| 55–64 | 1184 (25.2) | 224 (25) | 236 (24.2) | 215 (25.7) | 246 (25) | 263 (26.3) | |
| 64–75 | 1439 (30.6) | 246 (27.4) | 284 (29.1) | 239 (28.6) | 311 (31.6) | 359 (35.9) | |
| Residency, n (%) | 0.038 | ||||||
| Urban area | 2113 (45) | 407 (45.4) | 409 (41.9) | 360 (43.1) | 477 (48.4) | 460 (46) | |
| Rural area | 2582 (55) | 490 (54.6) | 567 (58.1) | 476 (56.9) | 508 (51.6) | 541 (54) | |
| Education, year | <0.001 | ||||||
| Illiteracy | 325 (6.9) | 66 (7.4) | 68 (7) | 72 (8.6) | 73 (7.4) | 46 (4.6) | |
| Middle school and below | 2659 (56.6) | 485 (54.1) | 535 (54.8) | 449 (53.7) | 557 (56.6) | 633 (63.2) | |
| Secondary schools and junior Colleges | 1070 (22.8) | 190 (21.2) | 239 (24.5) | 203 (24.3) | 223 (22.6) | 215 (21.5) | |
| University and above | 641 (13.6) | 156 (17.4) | 134 (13.7) | 112 (13.4) | 132 (13.4) | 107 (10.7) | |
| Physical activity, n (%) | <0.001 | ||||||
| Insufficient | 2046 (43.6) | 447 (49.8) | 426 (43.6) | 337 (40.3) | 443 (45) | 393 (39.3) | |
| Sufficient | 2649 (56.4) | 450 (50.2) | 550 (56.4) | 499 (59.7) | 542 (55) | 608 (60.7) | |
| Smoking status, n (%) | 0.155 | ||||||
| Never | 3648 (77.7) | 726 (80.9) | 771 (79) | 646 (77.3) | 741 (75.2) | 764 (76.3) | |
| Former | 263 (5.6) | 41 (4.6) | 54 (5.5) | 47 (5.6) | 65 (6.6) | 56 (5.6) | |
| Current | 784 (16.7) | 130 (14.5) | 151 (15.5) | 143 (17.1) | 179 (18.2) | 181 (18.1) | |
| Drinking status, n (%) | 0.002 | ||||||
| Never | 3558 (75.8) | 721 (80.4) | 743 (76.1) | 612 (73.2) | 735 (74.6) | 747 (74.6) | |
| Former | 129 (2.8) | 13 (1.4) | 18 (1.8) | 27 (3.2) | 37 (3.8) | 34 (3.4) | |
| Current | 1008 (21.5) | 163 (18.2) | 215 (22) | 197 (23.6) | 213 (21.6) | 220 (22) | |
| Takeaway, n (times/week) | 0.201 | ||||||
| ≤2 | 4406 (93.8) | 845 (94.2) | 917 (94) | 777 (92.9) | 925 (93.9) | 942 (94.1) | |
| 3–6 | 248 (5.3) | 46 (5.1) | 49 (5) | 54 (6.5) | 49 (5) | 50 (5) | |
| 7–10 | 25 (0.5) | 2 (0.2) | 3 (0.3) | 3 (0.4) | 9 (0.9) | 8 (0.8) | |
| >10 | 16 (0.3) | 4 (0.4) | 7 (0.7) | 2 (0.2) | 2 (0.2) | 1 (0.1) | |
| Family history | |||||||
| Diabetes, n (%) | 0.397 | ||||||
| No | 3918 (83.4) | 754 (84.1) | 808 (82.8) | 706 (84.4) | 832 (84.5) | 818 (81.7) | |
| Yes | 777 (16.6) | 143 (15.9) | 168 (17.2) | 130 (15.6) | 153 (15.5) | 183 (18.3) | |
| Hypertension, n (%) | 0.019 | ||||||
| No | 2825 (60.2) | 554 (61.8) | 618 (63.4) | 508 (60.8) | 580 (58.9) | 565 (56.4) | |
| Yes | 1869 (39.8) | 343 (38.2) | 357 (36.6) | 328 (39.2) | 405 (41.1) | 436 (43.6) | |
| BMI, n (kg/m2) | 0.569 | ||||||
| Lean (<18.5) | 163 (3.5) | 30 (3.3) | 32 (3.3) | 21 (2.5) | 43 (4.4) | 37 (3.7) | |
| Normal (18.5~23.9) | 2318 (49.4) | 440 (49) | 479 (49.1) | 420 (50.2) | 494 (50.2) | 485 (48.4) | |
| Overweight (24~27.9) | 1695 (36.1) | 314 (35) | 349 (35.8) | 310 (37.1) | 348 (35.3) | 374 (37.4) | |
| Obesity (≥28) | 519 (11) | 113 (12.6) | 116 (11.9) | 85 (10.2) | 100 (10.2) | 105 (10.5) | |
| WC, (cm) | 83.9 ± 10.0 | 83.2 ± 10.6 | 84.1 ± 10.2 | 83.9 ± 9.8 | 83.9 ± 9.8 | 84.1 ± 9.8 | 0.29 |
| SBP, mmHg | 126.1 ± 15.4 | 125.6 ± 15.7 | 125.0 ± 14.5 | 126.5 ± 15.6 | 126.0 ± 15.9 | 127.4 ± 15.4 | 0.011 |
| DBP, mmHg | 77.7 ± 9.3 | 77.5 ± 9.0 | 77.2 ± 8.7 | 77.86 ± 9.4 | 77.7 ± 9.6 | 78.2 ± 9.7 | 0.131 |
| Abdominal obesity, n (%) | 0.575 | ||||||
| No | 3035 (64.6) | 598 (66.7) | 632 (64.8) | 541 (64.7) | 620 (62.9) | 644 (64.3) | |
| Yes | 1660 (35.4) | 299 (33.3) | 344 (35.2) | 295 (35.3) | 365 (37.1) | 357 (35.7) | |
| High fasting glucose, n (%) | 0.059 | ||||||
| No | 3655 (77.9) | 708 (78.9) | 775 (79.4) | 668 (79.9) | 748 (76) | 756 (75.5) | |
| Yes | 1039 (22.1) | 189 (21.1) | 201 (20.6) | 168 (20.1) | 236 (24) | 245 (24.5) | |
| Elevated blood pressure, n (%) | 0.089 | ||||||
| No | 2678 (57) | 514 (57.3) | 576 (59) | 483 (57.8) | 572 (58.1) | 533 (53.2) | |
| Yes | 2017 (43) | 383 (42.7) | 400 (41) | 353 (42.2) | 413 (41.9) | 468 (46.8) | |
| Hypertriglyceridemia, n (%) | 0.577 | ||||||
| No | 2981 (63.5) | 578 (64.4) | 608 (62.3) | 547 (65.4) | 624 (63.4) | 624 (62.3) | |
| Yes | 1714 (36.5) | 319 (35.6) | 368 (37.7) | 289 (34.6) | 361 (36.6) | 377 (37.7) | |
| Low HDL-C, n (%) | 0.701 | ||||||
| No | 3837 (81.7) | 741 (82.6) | 803 (82.3) | 689 (82.4) | 797 (80.9) | 807 (80.6) | |
| Yes | 858 (18.3) | 156 (17.4) | 173 (17.7) | 147 (17.6) | 188 (19.1) | 194 (19.4) | |
| MetS, n (%) | 0.826 | ||||||
| No | 3573 (76.1) | 684 (76.2) | 750 (76.8) | 641 (76.7) | 750 (76.1) | 748 (74.7) | |
| Yes | 1122 (23.9) | 213 (23.8) | 226 (23.2) | 195 (23.3) | 235 (23.9) | 253 (25.3) | |
| Healthy plant foods (g/day) | 371.6 ± 200.6 | 284.3 ± 146.8 | 336.0 ± 200.4 | 375.5 ± 194.9 | 394.8 ± 185.8 | 458.5 ± 220.4 | <0.001 |
| Less-healthy plant foods (g/day) | 224.1 ± 105.7 | 184.4 ± 82.4 | 211.3 ± 97.1 | 223.9 ± 97.4 | 234.0 ± 100.9 | 262.7 ± 126.8 | <0.001 |
| Animal Total, Mean ± SD | 274.3 ± 139.0 | 339.3 ± 136.4 | 294.9 ± 140.3 | 280.9 ± 148.2 | 249.4 ± 119.6 | 214.8 ± 118.2 | <0.001 |
| Total engery, kcal | 1691.9 ± 446.4 | 1569.2 ± 398.0 | 1662.4 ± 441.0 | 1717.2 ± 449.8 | 1714.8 ± 446.2 | 1787.1 ± 463.0 | <0.001 |
| Total Protein, g | 70.1 ± 22.7 | 70.6 ± 21.9 | 70.7 ± 23.3 | 71.6 ± 24.3 | 68.9 ± 21.6 | 68.7 ± 22.7 | 0.024 |
| Total Fat, g | 69.8 ± 27.8 | 68.1 ± 27.2 | 69.8 ± 27.9 | 70.9 ± 28.1 | 69.2 ± 27.2 | 71.2 ± 28.4 | 0.094 |
| Total Carbohydrate, g | 199.6 ± 67.5 | 172.3 ± 60.3 | 191.7 ± 67.9 | 201.3 ± 67.6 | 208.0 ± 65.9 | 222.1 ± 65.0 | <0.001 |
| hPDI | |||||||
| Sample size, n | 4695 | 889 | 764 | 908 | 1114 | 1020 | |
| Ethnic group, n (%) | 0.207 | ||||||
| Han | 4663 (99.3) | 887 (99.8) | 756 (99.0) | 904 (99.6) | 1105 (99.2) | 1011 (99.1) | |
| Others | 32 (0.7) | 2 (0.2) | 8 (1.0) | 4 (0.4) | 9 (0.8) | 9 (0.9) | |
| Sex, n (%) | 0.012 | ||||||
| Male | 2144 (45.7) | 435 (48.9) | 363 (47.5) | 408 (44.9) | 516 (46.3) | 422 (41.4) | |
| Female | 2551 (54.3) | 454 (51.1) | 401 (52.5) | 500 (55.1) | 598 (53.7) | 598 (58.6) | |
| Age, year | <0.001 | ||||||
| 35–44 | 1237 (26.4) | 261 (29.4) | 225 (29.4) | 235 (25.9) | 295 (26.5) | 221 (21.7) | |
| 45–54 | 835 (17.8) | 174 (19.6) | 141 (18.5) | 172 (18.9) | 186 (16.7) | 162 (15.9) | |
| 55–64 | 1184 (25.2) | 200 (22.5) | 171 (22.4) | 218 (24) | 294 (26.4) | 301 (29.5) | |
| 64–75 | 1439 (30.6) | 254 (28.6) | 227 (29.7) | 283 (31.2) | 339 (30.4) | 336 (32.9) | |
| Residency, n (%) | <0.001 | ||||||
| Urban area | 2113 (45) | 383 (43.1) | 373 (48.8) | 395 (43.5) | 444 (39.9) | 518 (50.8) | |
| Rural area | 2582 (55) | 506 (56.9) | 391 (51.2) | 513 (56.5) | 670 (60.1) | 502 (49.2) | |
| Education, year | 0.001 | ||||||
| Illiteracy | 325 (6.9) | 71 (8) | 44 (5.8) | 62 (6.8) | 83 (7.4) | 65 (6.4) | |
| Middle school and below | 2659 (56.6) | 466 (52.4) | 401 (52.5) | 515 (56.7) | 670 (60.1) | 607 (59.5) | |
| Secondary schools and junior Colleges | 1070 (22.8) | 210 (23.6) | 191 (25) | 217 (23.9) | 228 (20.5) | 224 (22) | |
| University and above | 641 (13.6) | 142 (16) | 128 (16.8) | 114 (12.6) | 133 (11.9) | 124 (12.2) | |
| Physical activity, n (%) | 0.05 | ||||||
| Insufficient | 2046 (43.6) | 401 (45.1) | 356 (46.6) | 405 (44.6) | 475 (42.6) | 409 (40.1) | |
| Sufficient | 2649 (56.4) | 488 (54.9) | 408 (53.4) | 503 (55.4) | 639 (57.4) | 611 (59.9) | |
| Smoking status, n (%) | 0.056 | ||||||
| Never | 3648 (77.7) | 672 (75.6) | 594 (77.8) | 710 (78.2) | 849 (76.2) | 823 (80.7) | |
| Former | 263 (5.6) | 49 (5.5) | 43 (5.6) | 51 (5.6) | 58 (5.2) | 62 (6.1) | |
| Current | 784 (16.7) | 168 (18.9) | 127 (16.6) | 147 (16.2) | 207 (18.6) | 135 (13.2) | |
| Drinking status, n (%) | 0.667 | ||||||
| Never | 3558 (75.8) | 659 (74.1) | 585 (76.6) | 682 (75.1) | 842 (75.6) | 790 (77.4) | |
| Former | 129 (2.8) | 21 (2.4) | 25 (3.3) | 25 (2.8) | 32 (2.9) | 26 (2.6) | |
| Current | 1008 (21.5) | 209 (23.5) | 154 (20.2) | 201 (22.1) | 240 (21.5) | 204 (20) | |
| Takeaway, n (times/week) | 0.043 | ||||||
| ≤2 | 4406 (93.8) | 838 (94.3) | 699 (91.5) | 848 (93.4) | 1051 (94.3) | 970 (95.1) | |
| 3–6 | 248 (5.3) | 44 (5) | 56 (7.3) | 50 (5.5) | 56 (5) | 42 (4.1) | |
| 7–10 | 25 (0.5) | 1 (0.1) | 7 (0.9) | 6 (0.7) | 4 (0.4) | 7 (0.7) | |
| >10 | 16 (0.3) | 6 (0.7) | 2 (0.3) | 4 (0.4) | 3 (0.3) | 1 (0.1) | |
| Family history | |||||||
| Diabetes, n (%) | 0.701 | ||||||
| No | 3918 (83.4) | 747 (84) | 641 (83.9) | 767 (84.5) | 923 (82.8) | 840 (82.4) | |
| Yes | 777 (16.6) | 142 (16) | 123 (16.1) | 141 (15.5) | 191 (17.2) | 180 (17.6) | |
| Hypertension, n (%) | 0.338 | ||||||
| No | 2825 (60.2) | 519 (58.4) | 463 (60.6) | 571 (63) | 667 (59.9) | 605 (59.3) | |
| Yes | 1869 (39.8) | 370 (41.6) | 301 (39.4) | 336 (37) | 447 (40.1) | 415 (40.7) | |
| BMI, n (kg/m2) | 0.548 | ||||||
| Lean (<18.5) | 163 (3.5) | 32 (3.6) | 29 (3.8) | 29 (3.2) | 37 (3.3) | 36 (3.5) | |
| Normal (18.5~23.9) | 2318 (49.4) | 426 (47.9) | 387 (50.6) | 430 (47.4) | 552 (49.6) | 523 (51.3) | |
| Overweight (24~27.9) | 1695 (36.1) | 323 (36.3) | 263 (34.4) | 339 (37.3) | 398 (35.7) | 372 (36.5) | |
| Obesity (≥28) | 519 (11) | 108 (12.2) | 85 (11.1) | 110 (12.1) | 127 (11.4) | 89 (8.7) | |
| WC, (cm) | 83.9 ± 10.0 | 83.9 ± 10.1 | 83.9 ± 10.3 | 84.3 ± 10.0 | 84.0 ± 10.1 | 83.3 ± 9.7 | 0.221 |
| SBP, mmHg | 126.1 ± 15.4 | 126.4 ± 14.5 | 125.5 ± 14.9 | 125.6 ± 15.8 | 126.3 ± 15.7 | 126.5 ± 16.0 | 0.556 |
| DBP, mmHg | 77.7 ± 9.3 | 77.9 ± 8.9 | 77.4 ± 9.0 | 77.5 ± 9.4 | 77.9 ± 9.5 | 77.6 ± 9.5 | 0.787 |
| Abdominal obesity, n (%) | 0.582 | ||||||
| No | 3035 (64.6) | 565 (63.6) | 507 (66.4) | 574 (63.2) | 718 (64.4) | 671 (65.8) | |
| Yes | 1660 (35.4) | 324 (36.4) | 257 (33.6) | 334 (36.8) | 396 (35.6) | 349 (34.2) | |
| High fasting glucose, n (%) | 0.455 | ||||||
| No | 3655 (77.9) | 705 (79.3) | 603 (78.9) | 709 (78.2) | 862 (77.4) | 776 (76.1) | |
| Yes | 1039 (22.1) | 184 (20.7) | 161 (21.1) | 198 (21.8) | 252 (22.6) | 244 (23.9) | |
| Elevated blood pressure, n (%) | 0.689 | ||||||
| No | 2678 (57) | 505 (56.8) | 454 (59.4) | 517 (56.9) | 626 (56.2) | 576 (56.5) | |
| Yes | 2017 (43) | 384 (43.2) | 310 (40.6) | 391 (43.1 | 488 (43.8) | 444 (43.5) | |
| Hypertriglyceridemia, n (%) | 0.387 | ||||||
| No | 2981 (63.5) | 560 (63) | 504 (66) | 584 (64.3) | 686 (61.6) | 647 (63.4) | |
| Yes | 1714 (36.5) | 329 (37) | 260 (34) | 324 (35.7) | 428 (38.4) | 373 (36.6) | |
| Low HDL-C, n (%) | 0.969 | ||||||
| No | 3837 (81.7) | 727 (81.8) | 628 (82.2) | 743 (81.8) | 913 (82) | 826 (81) | |
| Yes | 858 (18.3) | 162 (18.2) | 136 (17.8) | 165 (18.2) | 201 (18) | 194 (19) | |
| MetS, n (%) | 0.948 | ||||||
| No | 3573 (76.1) | 671 (75.5) | 582 (76.2) | 685 (75.4) | 853 (76.6) | 782 (76.7) | |
| Yes | 1122 (23.9) | 218 (24.5) | 182 (23.8) | 223 (24.6) | 261 (23.4) | 238 (23.3) | |
| Healthy plant foods (g/day) | 371.6 ± 200.6 | 293.5 ± 179.7 | 347.9 ± 202.0 | 361.9 ± 200.9 | 388.4 ± 193.2 | 447.7 ± 195.2 | <0.001 |
| Less-healthy plant foods (g/day) | 224.1 ± 105.7 | 245.3 ± 101.6 | 230.0 ± 99.0 | 229.4 ± 111.8 | 217.7 ± 109.9 | 203.4 ± 99.5 | <0.001 |
| Animal Total, Mean ± SD | 274.3 ± 139.0 | 325.6 ± 137.3 | 304.7 ± 135.4 | 279.7 ± 137.7 | 252.5 ± 126.9 | 225.6 ± 135.7 | <0.001 |
| Total engery, kcal | 1691.9 ± 446.4 | 1702.1 ± 433.7 | 1699.5 ± 419.1 | 1696.3 ± 451.9 | 1672.3 ± 457.5 | 1694.9 ± 459.8 | 0.566 |
| Total Protein, g | 70.1 ± 22.7 | 75.7 ± 22.7 | 72.5 ± 21.1 | 70.5 ± 22.5 | 67.1 ± 22.3 | 66.2 ± 23.5 | <0.001 |
| Total Fat, g | 69.8 ± 27.8 | 68.8 ± 27.7 | 71.1 ± 28.5 | 70.7 ± 28.1 | 69.2 ± 28.4 | 69.6 ± 26.3 | 0.359 |
| Total Carbohydrate, g | 199.6 ± 67.5 | 197.5 ± 64.0 | 196.2 ± 65.2 | 199.2 ± 69.3 | 198.6 ± 66.3 | 205.4 ± 71.4 | 0.033 |
| uPDI | |||||||
| Sample size, n | 4695 | 891 | 968 | 727 | 1100 | 1009 | |
| Ethnic group, n (%) | 0.8 | ||||||
| Han | 4663 (99.3) | 883 (99.1) | 960 (99.2) | 723 (99.4) | 1093 (99.4) | 1004 (99.5) | |
| Others | 32 (0.7) | 8 (0.9) | 8 (0.8) | 4 (0.6) | 7 (0.6) | 5 (0.5) | |
| Sex, n (%) | 0.939 | ||||||
| Male | 2144 (45.7) | 409 (45.9) | 447 (46.2) | 329 (45.2) | 509 (46.3) | 450 (44.6) | |
| Female | 2551 (54.3) | 482 (54.1) | 521 (53.8) | 398 (54.8) | 591 (53.7) | 559 (55.4) | |
| Age, year | <0.001 | ||||||
| 35–44 | 1237 (26.4) | 293 (32.9) | 292 (30.2) | 193 (26.6) | 255 (23.2) | 204 (20.2) | |
| 45–54 | 835 (17.8) | 179 (20.1) | 155 (16) | 141 (19.4) | 185 (16.8) | 175 (17.3) | |
| 55–64 | 1184 (25.2) | 208 (23.3) | 232 (24) | 174 (23.9) | 313 (28.4) | 257 (25.5) | |
| 64–75 | 1439 (30.6) | 211 (23.7) | 289 (29.9) | 219 (30.1) | 347 (31.6) | 373 (37) | |
| Residency, n (%) | <0.001 | ||||||
| Urban area | 2113 (45) | 578 (64.9) | 508 (52.5) | 293 (40.3) | 431 (39.2) | 303 (30) | |
| Rural area | 2582 (55) | 313 (35.1) | 460 (47.5) | 434 (59.7) | 669 (60.8) | 706 (70) | |
| Education, year | <0.001 | ||||||
| Illiteracy | 325 (6.9) | 32 (3.6) | 56 (5.8) | 67 (9.2) | 82 (7.4) | 88 (8.7) | |
| Middle school and below | 2659 (56.6) | 412 (46.2) | 516 (53.3) | 399 (54.9) | 657 (59.7) | 675 (66.9) | |
| Secondary schools and junior colleges | 1070 (22.8) | 260 (29.2) | 247 (25.5) | 166 (22.8) | 226 (20.6) | 171 (17) | |
| University and above | 641 (13.6) | 187 (21) | 149 (15.4) | 95 (13.1) | 135 (12.3) | 75 (7.4) | |
| Physical activity, n (%) | 0.037 | ||||||
| Insufficient | 2046 (43.6) | 362 (40.6) | 427 (44.1) | 310 (42.6) | 468 (42.6) | 479 (47.5) | |
| Sufficient | 2649 (56.4) | 529 (59.4) | 541 (55.9) | 417 (57.4) | 632 (57.4) | 530 (52.5) | |
| Smoking status, n (%) | 0.018 | ||||||
| Never | 3648 (77.7) | 714 (80.1) | 771 (79.6) | 553 (76.1) | 837 (76.1) | 773 (76.6) | |
| Former | 263 (5.6) | 51 (5.7) | 49 (5.1) | 34 (4.7) | 79 (7.2) | 50 (5) | |
| Current | 784 (16.7) | 126 (14.1) | 148 (15.3) | 140 (19.3) | 184 (16.7) | 186 (18.4) | |
| Drinking status, n (%) | 0.229 | ||||||
| Never | 3558 (75.8) | 689 (77.3) | 740 (76.4) | 565 (77.7) | 822 (74.7) | 742 (73.5) | |
| Former | 129 (2.8) | 19 (2.1) | 31 (3.2) | 14 (1.9) | 37 (3.4) | 28 (2.8) | |
| Current | 1008 (21.5) | 183 (20.5) | 197 (20.4) | 148 (20.4) | 241 (21.9) | 239 (23.7) | |
| Takeaway, n (times/week) | <0.001 | ||||||
| ≤2 | 4406 (93.8) | 813 (91.2) | 902 (93.2) | 671 (92.3) | 1046 (95.1) | 974 (96.5) | |
| 3–6 | 248 (5.3) | 67 (7.5) | 60 (6.2) | 44 (6) | 48 (4.4) | 29 (2.9) | |
| 7–10 | 25 (0.5) | 8 (0.9) | 3 (0.3) | 6 (0.8) | 5 (0.4) | 3 (0.3) | |
| >10 | 16 (0.3) | 3 (0.3) | 3 (0.3) | 6 (0.8) | 1 (0.1) | 3 (0.3) | |
| Family history | |||||||
| Diabetes, n (%) | 0.09 | ||||||
| No | 3918 (83.4) | 717 (80.5) | 808 (83.5) | 609 (83.8) | 926 (84.2) | 858 (85) | |
| Yes | 777 (16.6) | 174 (19.5) | 160 (16.5) | 118 (16.2) | 174 (15.8) | 151 (15) | |
| Hypertension, n (%) | 0.033 | ||||||
| No | 2825 (60.2) | 499 (56) | 578 (59.7) | 436 (60.1) | 678 (61.6) | 634 (62.8) | |
| Yes | 1869 (39.8) | 392 (44) | 390 (40.3) | 290 (39.9) | 422 (38.4) | 375 (37.2) | |
| BMI, n (kg/m2) | 0.349 | ||||||
| Lean (<18.5) | 163 (3.5) | 31 (3.5) | 28 (2.9) | 31 (4.3) | 38 (3.4) | 35 (3.5) | |
| Normal (18.5~23.9) | 2318 (49.4) | 466 (52.3) | 494 (51) | 345 (47.5) | 536 (48.7) | 477 (47.3) | |
| Overweight (24~27.9) | 1695 (36.1) | 313 (35.1) | 349 (36) | 261 (35.9) | 400 (36.4) | 372 (36.9) | |
| Obesity (≥28) | 519 (11) | 81 (9.1) | 97 (10) | 90 (12.4) | 126 (11.4) | 125 (12.4) | |
| WC, (cm) | 83.87 ± 10.02 | 83.17 ± 9.94 | 83.36 ± 9.94 | 83.62 ± 10.66 | 84.26 ± 9.82 | 84.73 ± 9.85 | 0.003 |
| SBP, mmHg | 126.09 ± 15.44 | 123.68 ± 14.32 | 125.30 ± 15.21 | 126.35 ± 16.03 | 127.12 ± 16.21 | 127.68 ± 15.04 | <0.001 |
| DBP, mmHg | 77.68 ± 9.29 | 76.41 ± 8.88 | 77.02 ± 8.84 | 78.42 ± 9.87 | 77.90 ± 9.34 | 78.68 ± 9.41 | <0.001 |
| Abdominal obesity, n (%) | 0.011 | ||||||
| No | 3035 (64.6) | 596 (66.9) | 653 (67.5) | 476 (65.5) | 697 (63.4) | 613 (60.8) | |
| Yes | 1660 (35.4) | 295 (33.1) | 315 (32.5) | 251 (34.5) | 403 (36.6) | 396 (39.2) | |
| High fasting glucose, n (%) | 0.013 | ||||||
| No | 3655 (77.9) | 725 (81.4) | 756 (78.1) | 570 (78.4) | 851 (77.4) | 753 (74.6) | |
| Yes | 1039 (22.1) | 166 (18.6) | 212 (21.9) | 157 (21.6) | 248 (22.6) | 256 (25.4) | |
| Elevated blood pressure, n (%) | <0.001 | ||||||
| No | 2678 (57) | 582 (65.3) | 548 (56.6) | 412 (56.7) | 598 (54.4) | 538 (53.3) | |
| Yes | 2017 (43) | 309 (34.7) | 420 (43.4) | 315 (43.3) | 502 (45.6) | 471 (46.7) | |
| Hypertriglyceridemia, n (%) | 0.443 | ||||||
| No | 2981 (63.5) | 580 (65.1) | 628 (64.9) | 460 (63.3) | 693 (63) | 620 (61.4) | |
| Yes | 1714 (36.5) | 311 (34.9) | 340 (35.1) | 267 (36.7) | 407 (37) | 389 (38.6) | |
| Low HDL-C, n (%) | 0.785 | ||||||
| No | 3837 (81.7) | 715 (80.2) | 791 (81.7) | 598 (82.3) | 903 (82.1) | 830 (82.3) | |
| Yes | 858 (18.3) | 176 (19.8) | 177 (18.3) | 129 (17.7) | 197 (17.9) | 179 (17.7) | |
| MetS, n (%) | 0.025 | ||||||
| No | 3573 (76.1) | 705 (79.1) | 745 (77) | 558 (76.8) | 830 (75.4) | 735 (72.8) | |
| Yes | 1122 (23.9) | 186 (20.9) | 223 (23) | 169 (23.2) | 270 (24.6) | 274 (27.2) | |
| Healthy plant foods (g/day) | 371.6 ± 200.6 | 491.3 ± 205.1 | 409.3 ± 181.7 | 362.3 ± 150.9 | 332.2 ± 190.7 | 279.5 ± 195.8 | <0.001 |
| Less-healthy plant foods (g/day) | 224.1 ± 105.7 | 183.0 ± 74.3 | 207.1 ± 93.5 | 223.7 ± 109.0 | 234.7 ± 111.6 | 265.4 ± 114.2 | <0.001 |
| Animal Total, Mean ± SD | 274.3 ± 139.0 | 379.6 ± 136.5 | 315.8 ± 128.1 | 263.2 ± 117.4 | 241.3 ± 116.3 | 185.3 ± 111.2 | <0.001 |
| Total engery, kcal | 1691.9 ± 446.4 | 1809.3 ± 434.1 | 1735.3 ± 423.1 | 1684.1 ± 451.1 | 1655.0 ± 457.3 | 1592.5 ± 435.5 | <0.001 |
| Total Protein, g | 70.1 ± 22.7 | 80.6 ± 22.3 | 74.5 ± 21.4 | 69.8 ± 21.4 | 66.8 ± 21.3 | 60.1 ± 21.9 | <0.001 |
| Total Fat, g | 69.8 ± 27.8 | 78.7 ± 25.7 | 74.6 ± 26.8 | 69.8 ± 27.0 | 67.1 ± 28.0 | 60.5 ± 27.5 | <0.001 |
| Total Carbohydrate, g | 199.6 ± 67.5 | 199.7 ± 61.5 | 195.8 ± 63.4 | 197.9 ± 67.5 | 198.8 ± 70.1 | 205.2 ± 72.8 | 0.031 |
| Q1 | Q2 | Q3 | Q4 | Q5 | p-Trend | |
|---|---|---|---|---|---|---|
| uPDI | ||||||
| Model 1 | Ref | 1.13 (0.91~1.41) | 1.15 (0.91~1.45) | 1.23 (1.00~1.52) | 1.41 (1.14~1.75) | 0.001 |
| Model 2 | Ref | 1.10 (0.88~1.38) | 1.12 (0.88~1.42) | 1.16 (0.93~1.44) | 1.33 (1.07~1.65) | 0.01 |
| Model 3 | Ref | 1.16 (0.92~1.46) | 1.20 (0.93~1.54) | 1.19 (0.95~1.49) | 1.37 (1.08~1.73) | 0.013 |
| Q1 | Q2 | Q3 | Q4 | Q5 | p-Trend | |
|---|---|---|---|---|---|---|
| uPDI | ||||||
| Abdominal obesity | Ref | 1.01 (0.81~1.26) | 1.21 (0.95~1.54) | 1.09 (0.87~1.35) | 1.27 (1.01~1.59) | 0.032 |
| High fasting glucose | Ref | 1.21 (0.95~1.54) | 1.20 (0.92~1.56) | 1.18 (0.93~1.49) | 1.35 (1.06~1.72) | 0.037 |
| Elevated blood pressure | Ref | 1.41 (1.16~1.73) | 1.38 (1.11~1.72) | 1.44 (1.18~1.75) | 1.43 (1.16~1.75) | 0.003 |
| Hypertriglyceridemia | Ref | 1.02 (0.84~1.24) | 1.10 (0.89~1.35) | 1.09 (0.90~1.32) | 1.17 (0.95~1.42) | 0.104 |
| Low HDL-C | Ref | 0.92 (0.73~1.18) | 0.92 (0.70~1.19) | 0.93 (0.73~1.18) | 0.94 (0.73~1.21) | 0.685 |
Disclaimer/Publisher’s Note: The statements, opinions and data contained in all publications are solely those of the individual author(s) and contributor(s) and not of MDPI and/or the editor(s). MDPI and/or the editor(s) disclaim responsibility for any injury to people or property resulting from any ideas, methods, instructions or products referred to in the content. |
© 2025 by the authors. Licensee MDPI, Basel, Switzerland. This article is an open access article distributed under the terms and conditions of the Creative Commons Attribution (CC BY) license (https://creativecommons.org/licenses/by/4.0/).
Share and Cite
Zhou, M.; Zhao, Y.; He, M.; Su, D.; Han, D.; Huang, L.; Xu, P.; Zhang, R. Association Between Plant-Based Diets and Metabolic Syndrome in Zhejiang, China: A Cross-Sectional Study. Nutrients 2025, 17, 2159. https://doi.org/10.3390/nu17132159
Zhou M, Zhao Y, He M, Su D, Han D, Huang L, Xu P, Zhang R. Association Between Plant-Based Diets and Metabolic Syndrome in Zhejiang, China: A Cross-Sectional Study. Nutrients. 2025; 17(13):2159. https://doi.org/10.3390/nu17132159
Chicago/Turabian StyleZhou, Mengyi, Ya Zhao, Mengjie He, Danting Su, Dan Han, Lichun Huang, Peiwei Xu, and Ronghua Zhang. 2025. "Association Between Plant-Based Diets and Metabolic Syndrome in Zhejiang, China: A Cross-Sectional Study" Nutrients 17, no. 13: 2159. https://doi.org/10.3390/nu17132159
APA StyleZhou, M., Zhao, Y., He, M., Su, D., Han, D., Huang, L., Xu, P., & Zhang, R. (2025). Association Between Plant-Based Diets and Metabolic Syndrome in Zhejiang, China: A Cross-Sectional Study. Nutrients, 17(13), 2159. https://doi.org/10.3390/nu17132159