
The Influence of Solar-Simulated UV Radiation on Circulating 25(OH)D3, 24,25(OH)2D3 and Their Ratio in Younger and Older Adults

 ,
,  , and
, and 
Abstract
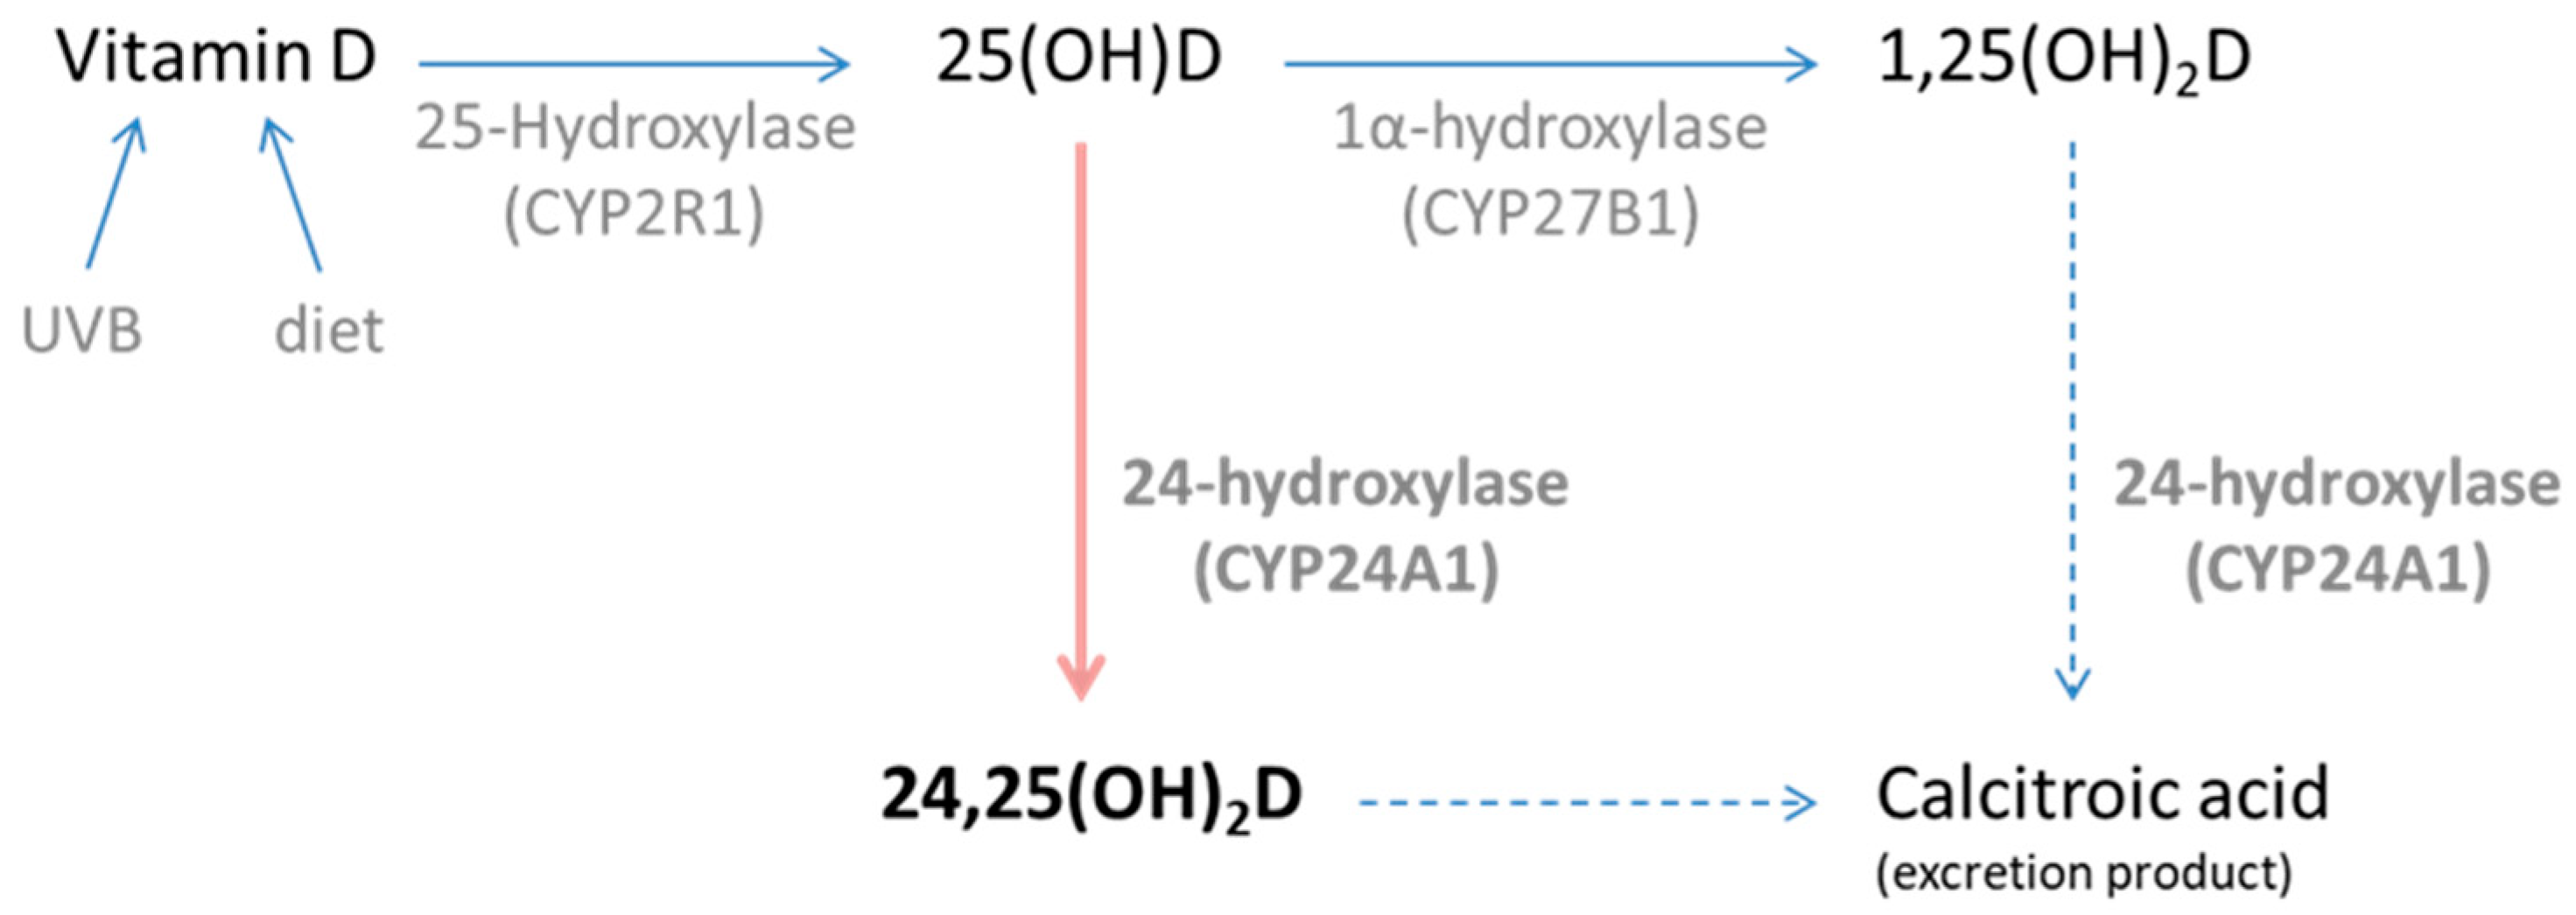
1. Introduction
2. Materials and Methods
2.1. Study Cohort
2.2. Simulated Summer Sunlight Exposures
2.3. Parathyroid Hormone and Serum Biochemistry
2.4. Circulating Vitamin D Derivatives Analysis
2.5. Statistical Analyses
3. Results
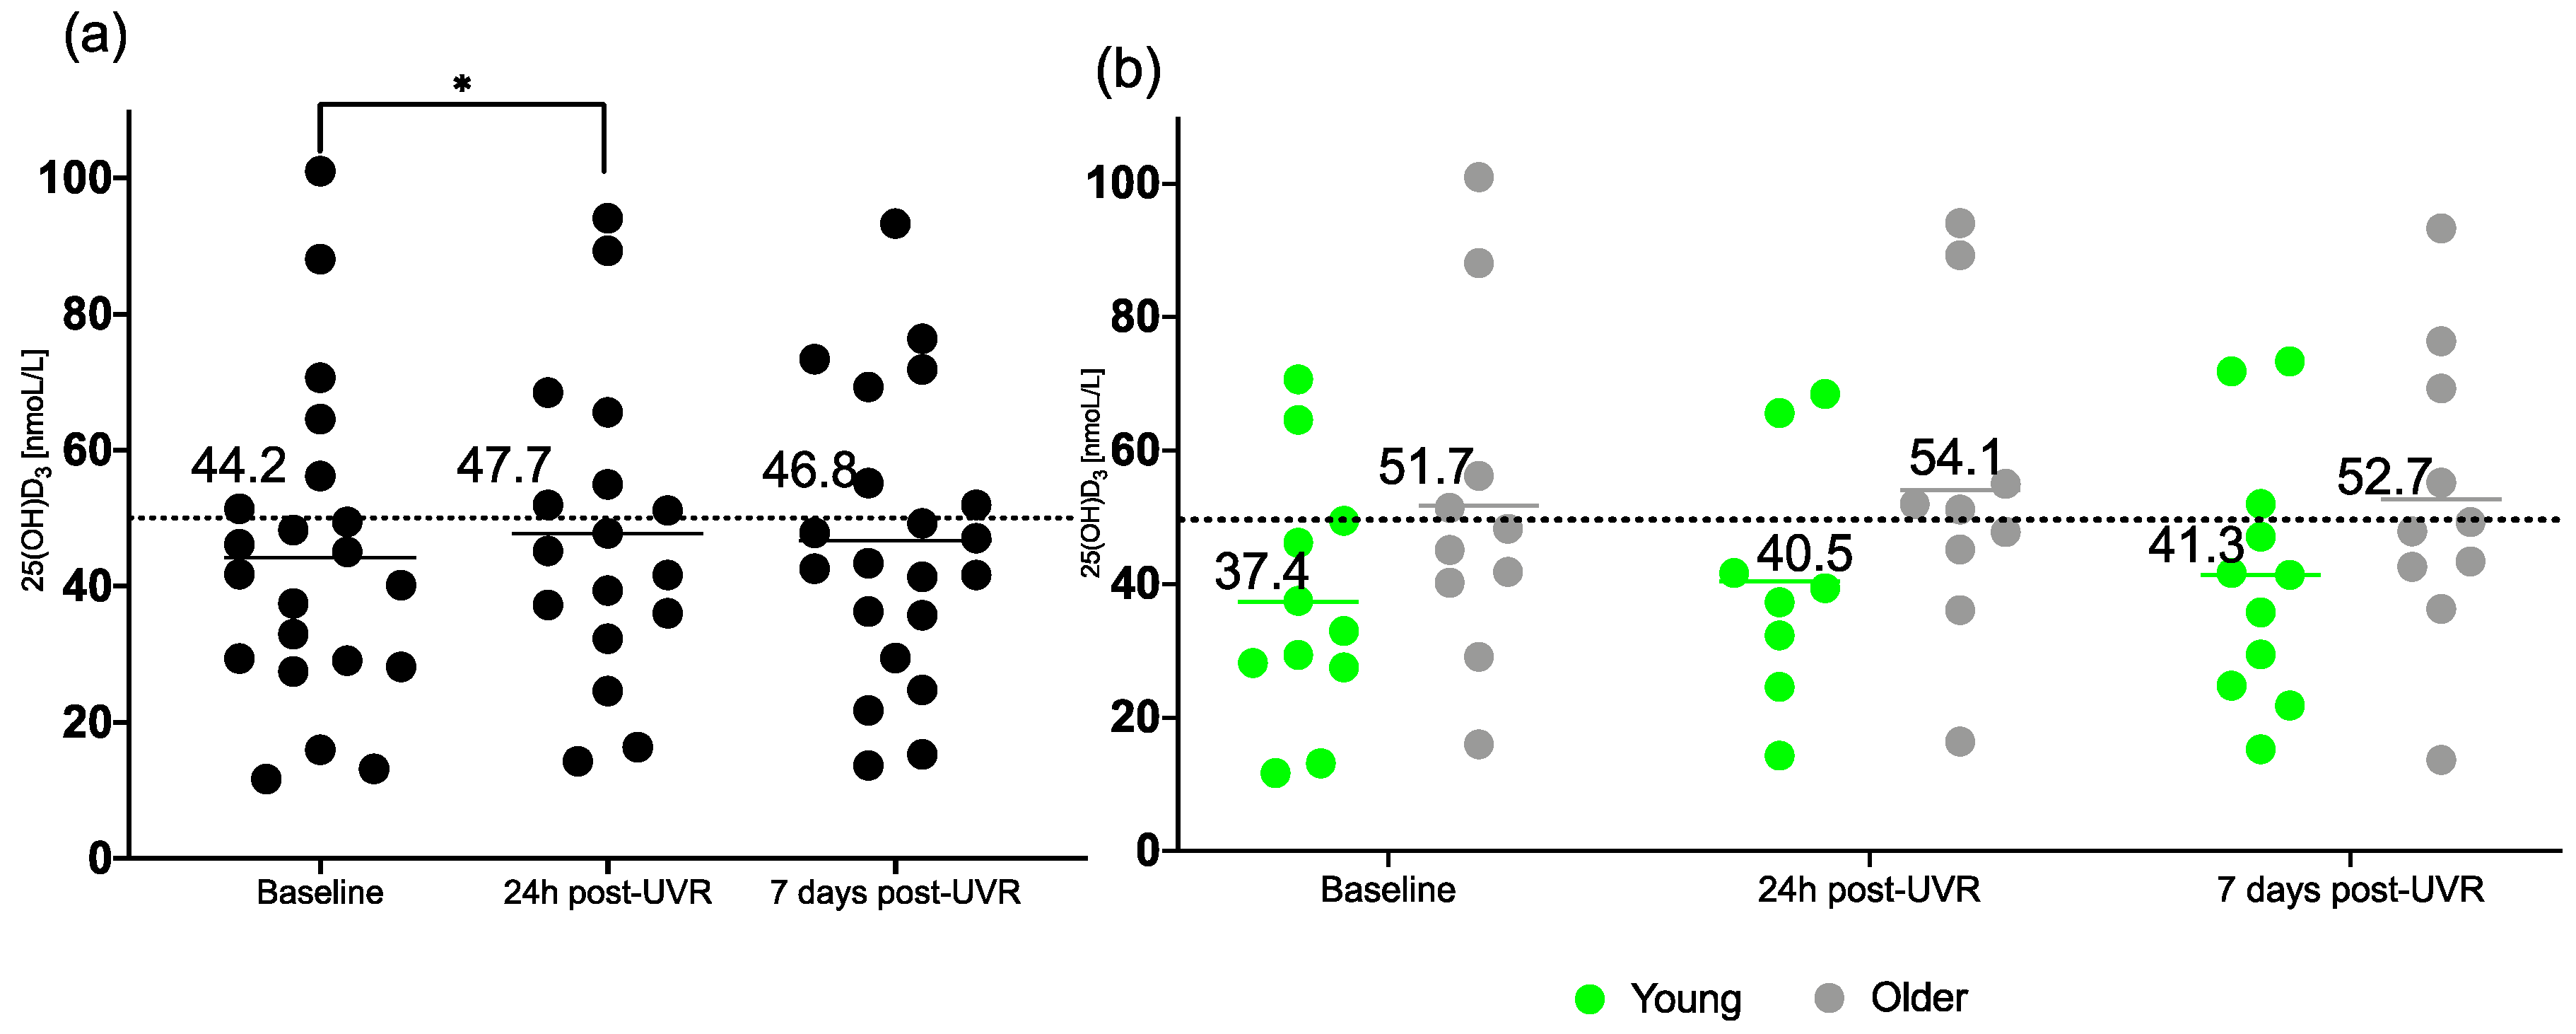
3.1. 25(OH)D3
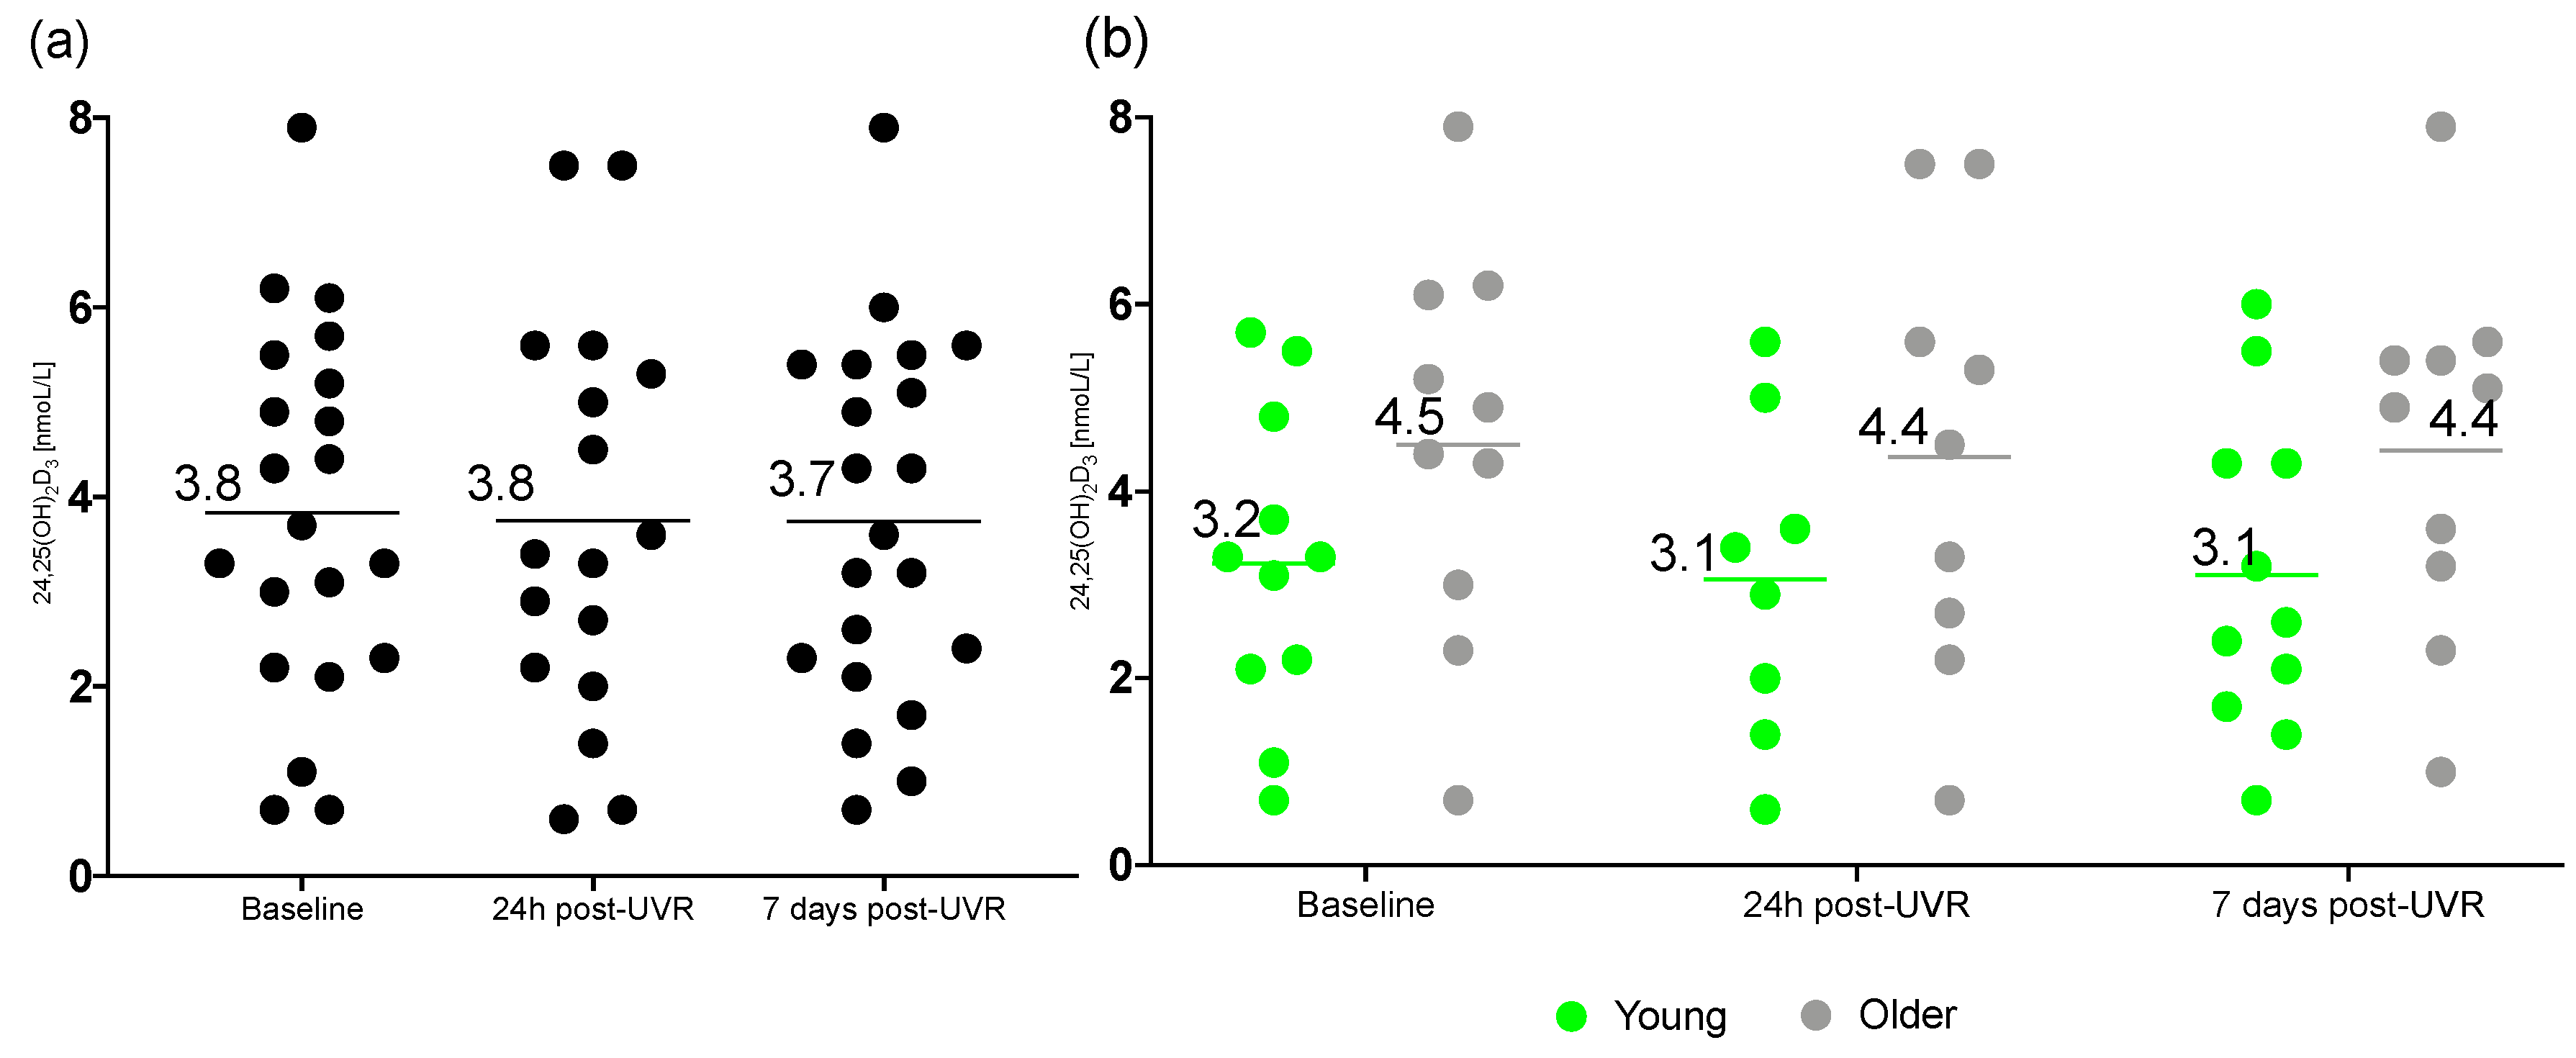
3.2. 24,25(OH)2D3
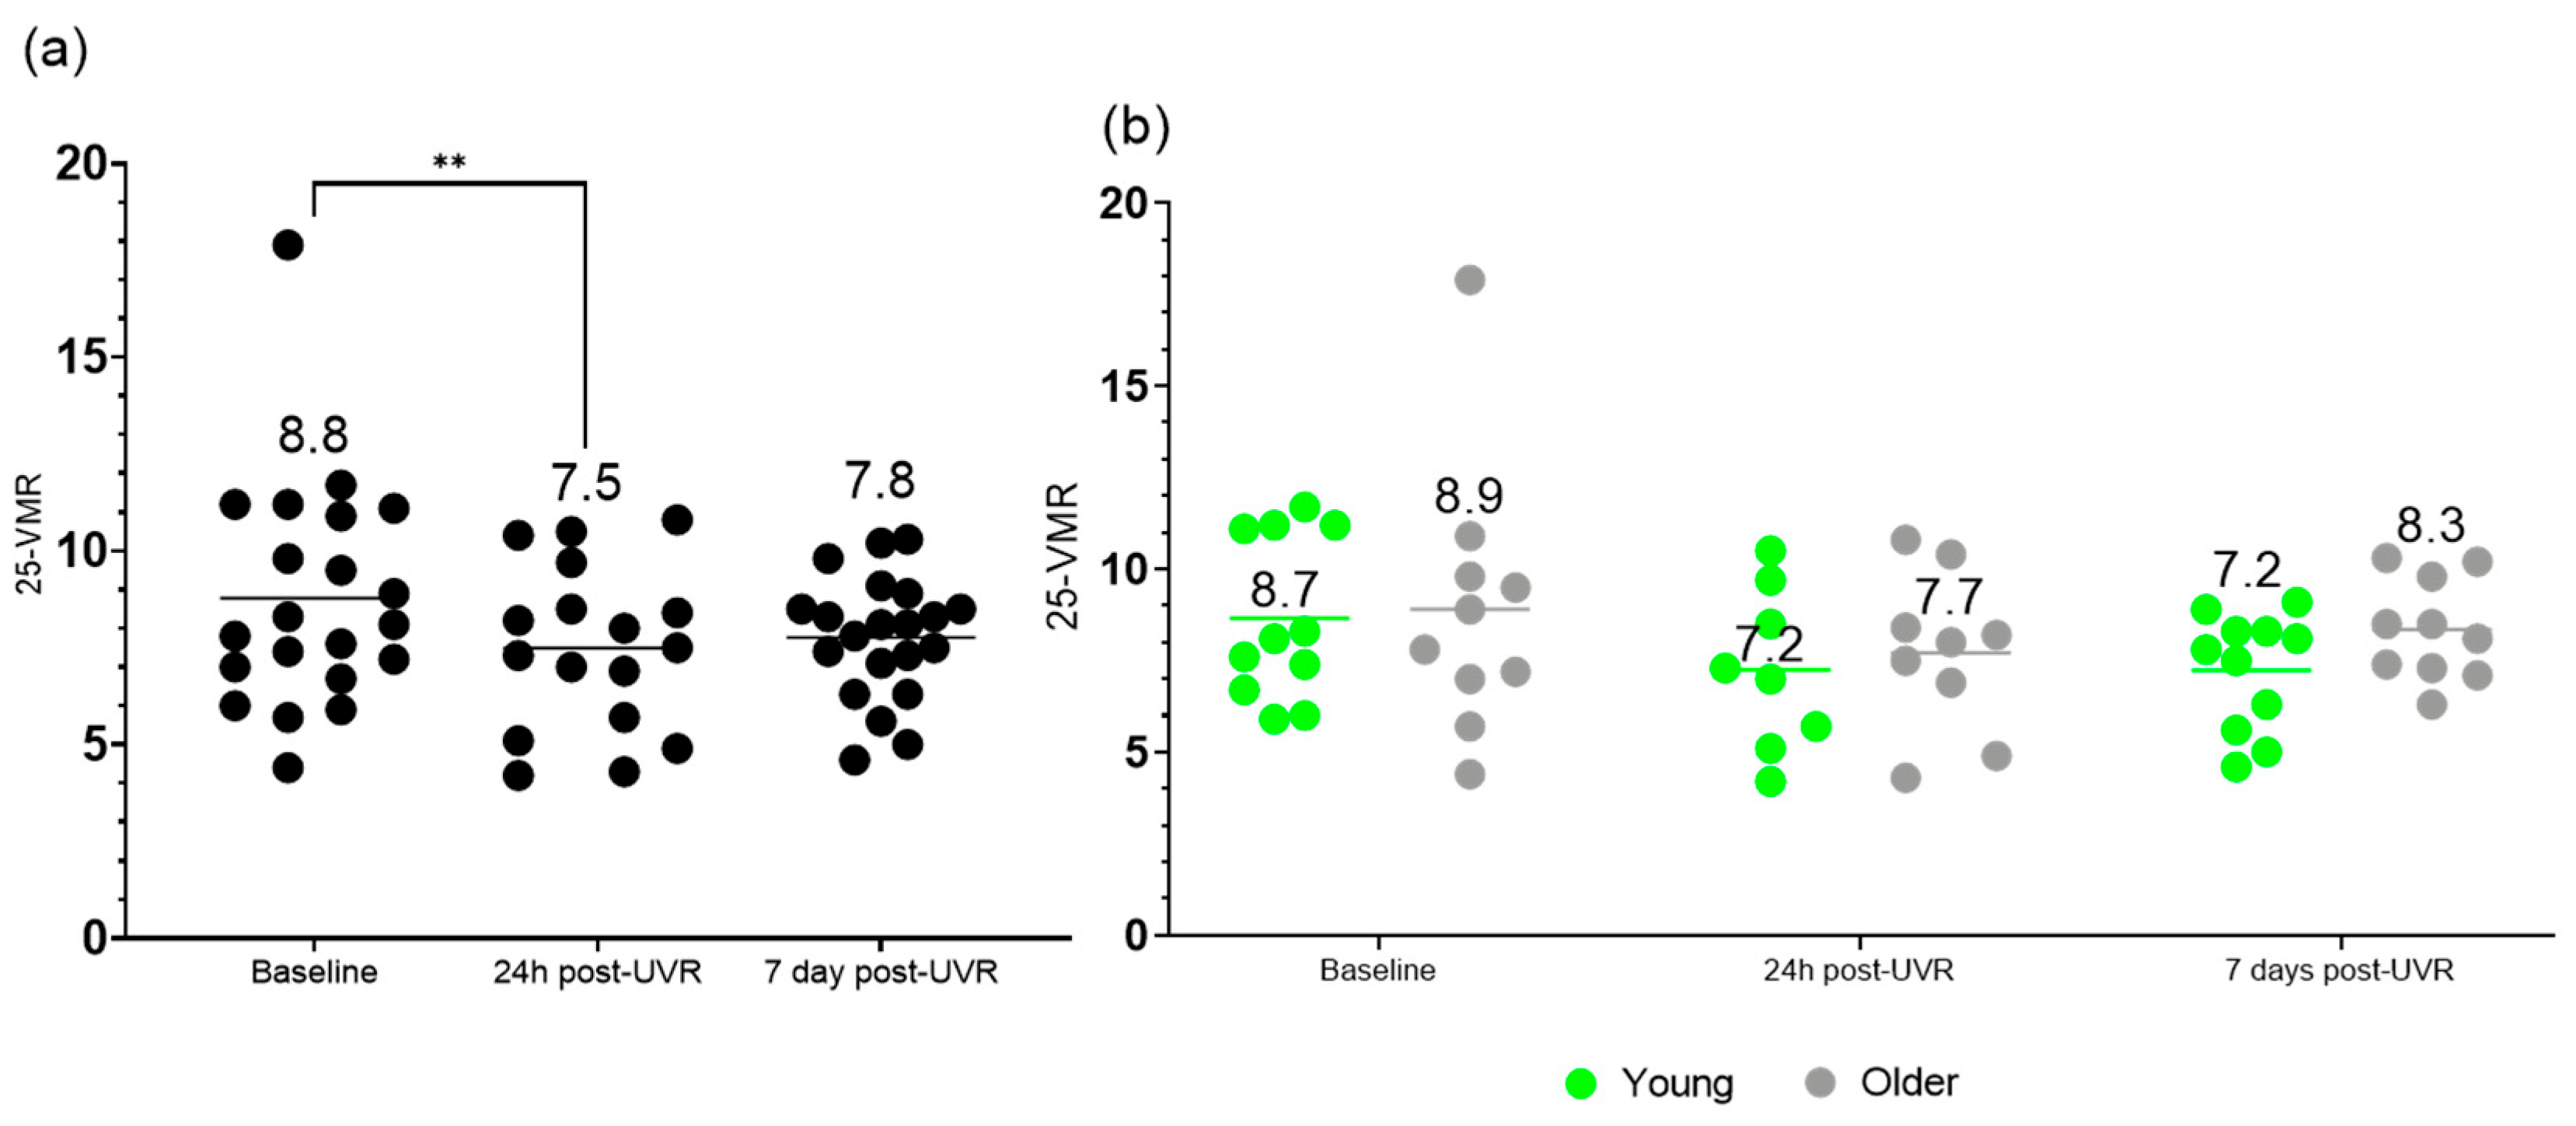
3.3. Vitamin D3 Metabolite Ratio (25-VMR)
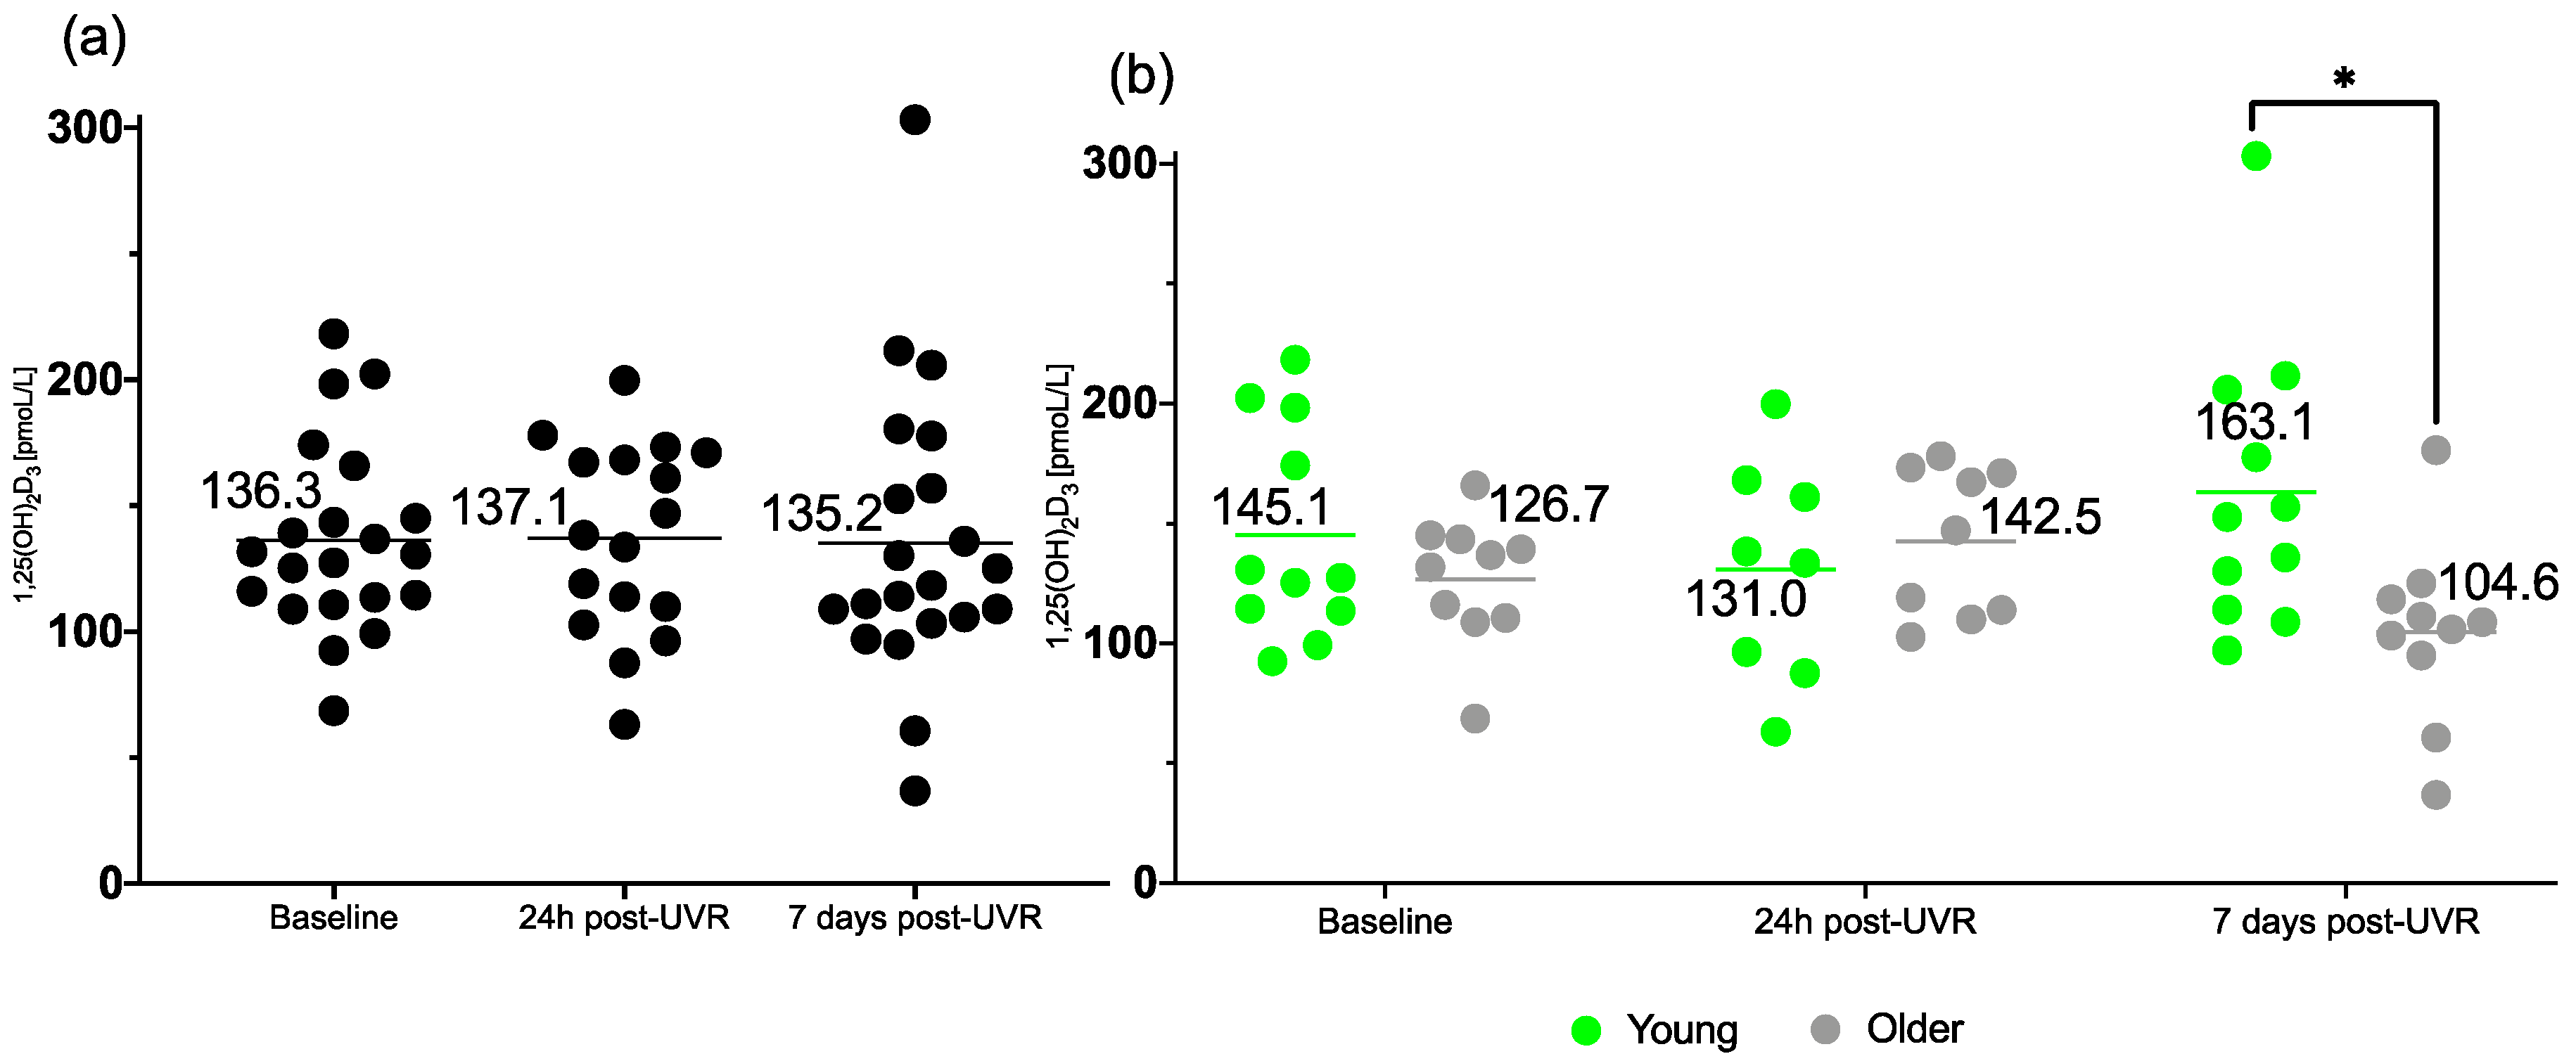
3.4. 1,25(OH)2D3
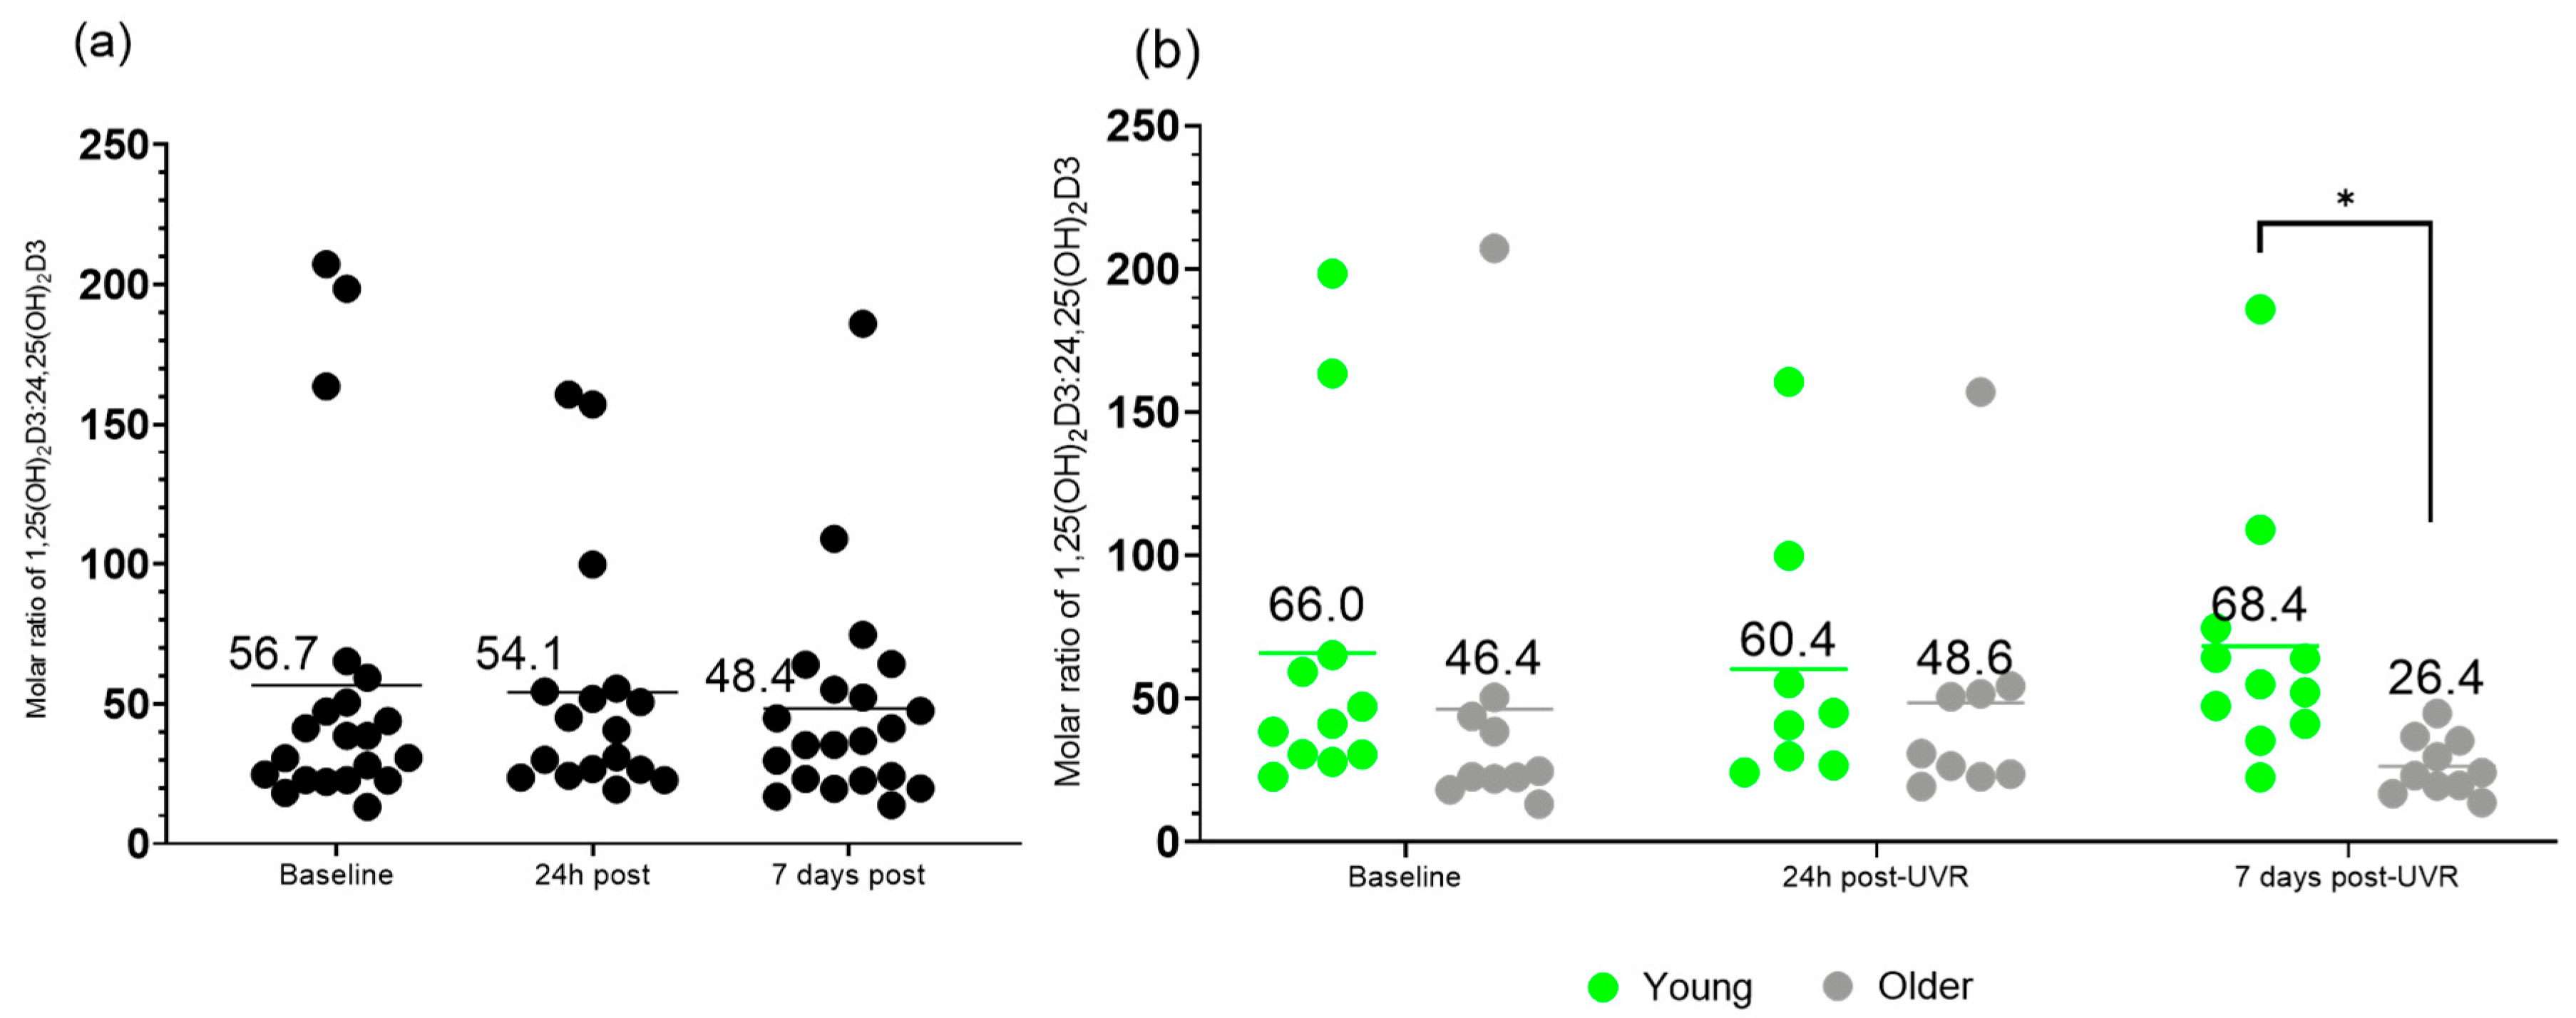
3.5. Molar Ratio of 1,25(OH)2D3 to 24,25(OH)2D3 VMR
4. Discussion
5. Conclusions
Author Contributions
Funding
Institutional Review Board Statement
Informed Consent Statement
Data Availability Statement
Acknowledgments
Conflicts of Interest
References
- Lehmann, B.; Meurer, M. Vitamin D metabolism. Dermatol. Ther. 2010, 23, 2–12. [Google Scholar] [CrossRef] [PubMed]
- Schlingmann, K.P.; Kaufmann, M.; Weber, S.; Irwin, A.; Goos, C.; John, U.; Misselwitz, J.; Klaus, G.; Kuwertz-Bröking, E.; Fehrenbach, H.; et al. Mutations in CYP24A1 and Idiopathic Infantile Hypercalcemia. N. Engl. J. Med. 2011, 365, 410–421. [Google Scholar] [CrossRef] [PubMed]
- Veldurthy, V.; Wei, R.; Campbell, M.; Lupicki, K.; Dhawan, P.; Christakos, S. 25-Hydroxyvitamin D3 24-Hydroxylase: A Key Regulator of 1,25(OH)2D3 Catabolism and Calcium Homeostasis. Vitam. Horm. 2016, 100, 137–150. [Google Scholar] [CrossRef]
- Theodoratou, E.; Tzoulaki, I.; Zgaga, L.; Ioannidis, J.P.A. Vitamin D and Multiple Health Outcomes: Umbrella Review of Systematic Reviews and Meta-Analyses of Observational Studies and Randomised Trials. BMJ 2014, 348, g2035. [Google Scholar] [CrossRef]
- Zhang, Y.; Fang, F.; Tang, J.; Jia, L.; Feng, Y.; Xu, P.; Faramand, A. Association between Vitamin D Supplementation and Mortality: Systematic Review and Meta-Analysis. BMJ 2019, 366, l4673. [Google Scholar] [CrossRef] [PubMed]
- Jones, G.; Prosser, D.E.; Kaufmann, M. 25-Hydroxyvitamin D-24-Hydroxylase (CYP24A1): Its Important Role in the Degradation of Vitamin D. Arch. Biochem. Biophys. 2012, 523, 9–18. [Google Scholar] [CrossRef]
- Kanis, J.A.; Cundy, T.; Bartlett, M.; Smith, R.; Heynen, G.; Warner, G.T.; Russell, R.G. Is 24,25-Dihydroxycholecalciferol a Calcium-Regulating Hormone in Man? Br. Med. J. 1978, 1, 1382–1386. [Google Scholar] [CrossRef]
- Martineau, C.; Kaufmann, M.; Arabian, A.; Jones, G.; St-Arnaud, R. Preclinical Safety and Efficacy of 24R,25-Dihydroxyvitamin D3 or Lactosylceramide Treatment to Enhance Fracture Repair. J. Orthop. Transl. 2020, 23, 77–88. [Google Scholar] [CrossRef]
- Ornoy, A.; Goodwin, D.; Noff, D.; Edelstein, S. 24, 25-Dihydroxyvitamin D Is a Metabolite of Vitamin D Essential for Bone Formation. Nature 1978, 276, 517–519. [Google Scholar] [CrossRef]
- Petkovich, M.; Jones, G. CYP24A1 and Kidney Disease. Curr. Opin. Nephrol. Hypertens. 2011, 20, 337–344. [Google Scholar] [CrossRef]
- Berg, A.H.; Powe, C.E.; Evans, M.K.; Wenger, J.; Ortiz, G.; Zonderman, A.B.; Suntharalingam, P.; Lucchesi, K.; Powe, N.R.; Karumanchi, S.A.; et al. 24,25-Dihydroxyvitamin D3 and Vitamin D Status of Community Dwelling Black and White Americans. Clin. Chem. 2015, 61, 877–884. [Google Scholar] [CrossRef] [PubMed]
- Tang, J.C.Y.; Nicholls, H.; Piec, I.; Washbourne, C.J.; Dutton, J.J.; Jackson, S.; Greeves, J.; Fraser, W.D. Reference Intervals for Serum 24,25-Dihydroxyvitamin D and the Ratio with 25-Hydroxyvitamin D Established Using a Newly Developed LC-MS/MS Method. J. Nutr. Biochem. 2017, 46, 21–29. [Google Scholar] [CrossRef] [PubMed]
- Saleh, L.; Tang, J.; Gawinecka, J.; Boesch, L.; Fraser, W.D.; von Eckardstein, A.; Nowak, A. Impact of a Single Oral Dose of 100,000 IU Vitamin D3 on Profiles of Serum 25(OH)D3 and Its Metabolites 24,25(OH)2D3, 3-Epi-25(OH)D3, and 1,25(OH)2D3 in Adults with Vitamin D Insufficiency. Clin. Chem. Lab. Med. 2017, 55, 1912–1921. [Google Scholar] [CrossRef] [PubMed]
- Ketha, H.; Thacher, T.D.; Oberhelman, S.S.; Fischer, P.R.; Singh, R.J.; Kumar, R. Comparison of the Effect of Daily Versus Bolus Dose Maternal Vitamin D3 Supplementation on the 24,25-Dihydroxyvitamin D3 to 25-Hydroxyvitamin D3 Ratio. Bone 2018, 110, 321–325. [Google Scholar] [CrossRef]
- Wagner, D.; Hanwell, H.E.; Schnabl, K.; Yazdanpanah, M.; Kimball, S.; Fu, L.; Sidhom, G.; Rousseau, D.; Cole, D.E.C.; Vieth, R. The Ratio of Serum 24,25-Dihydroxyvitamin D(3) to 25-Hydroxyvitamin D(3) Is Predictive of 25-Hydroxyvitamin D(3) Response to Vitamin D(3) Supplementation. J. Steroid Biochem. Mol. Biol. 2011, 126, 72–77. [Google Scholar] [CrossRef]
- Cashman, K.D.; Hayes, A.; O’Donovan, S.M.; Zhang, J.Y.; Kinsella, M.; Galvin, K.; Kiely, M.; Seamans, K.M. Dietary Calcium Does Not Interact with Vitamin D3 in Terms of Determining the Response and Catabolism of Serum 25-Hydroxyvitamin D during Winter in Older Adults. Am. J. Clin. Nutr. 2014, 99, 1414–1423. [Google Scholar] [CrossRef]
- Cashman, K.D.; Hayes, A.; Galvin, K.; Merkel, J.; Jones, G.; Kaufmann, M.; Hoofnagle, A.N.; Carter, G.D.; Durazo-Arvizu, R.A.; Sempos, C.T. Significance of Serum 24,25-Dihydroxyvitamin D in the Assessment of Vitamin D Status: A Double-Edged Sword? Clin. Chem. 2015, 61, 636–645. [Google Scholar] [CrossRef]
- Tang, J.C.Y.; Jackson, S.; Walsh, N.P.; Greeves, J.; Fraser, W.D. Bioanalytical Facility team The Dynamic Relationships between the Active and Catabolic Vitamin D Metabolites, Their Ratios, and Associations with PTH. Sci. Rep. 2019, 9, 6974. [Google Scholar] [CrossRef]
- SACN. Vitamin D and Health. Available online: https://www.gov.uk/government/uploads/system/uploads/attachment_data/file/537616/SACN_Vitamin_D_and_Health_report.pdf (accessed on 12 June 2025).
- German Nutrition Society. New reference values for vitamin D. Ann. Nutr. Metab. 2012, 60, 241–246. [Google Scholar] [CrossRef]
- Pilz, S.; Zittermann, A.; Trummer, C.; Theiler-Schwetz, V.; Lerchbaum, E.; Keppel, M.H.; Grübler, M.R.; März, W.; Pandis, M. Vitamin D testing and treatment: A narrative review of current evidence. Endocr. Connect. 2019, 8, R27–R43. [Google Scholar] [CrossRef] [PubMed] [PubMed Central]
- Tang, J.C.Y.; Dunn, R.; Dutton, J.J.; Farag, A.; Piec, I.; Chipchase, A.; Greeves, J.; Fraser, W.D.; Webb, E.A. Measurement of 1,25-dihydroxyvitamin D in serum by LC-MS/MS compared to immunoassay reveals inconsistent agreement in paediatric samples. Clin. Chem. Lab. Med. 2024, 63, 962–971. [Google Scholar] [CrossRef] [PubMed]
- Borecka, O.; Dutton, J.J.; Tang, J.C.Y.; Fraser, W.D.; Webb, A.R.; Rhodes, L.E. Comparative Study of Healthy Older and Younger Adults Shows They Have the Same Skin Concentration of Vitamin D3 Precursor, 7-Dehydrocholesterol, and Similar Response to UVR. Nutrients 2024, 16, 1147. [Google Scholar] [CrossRef] [PubMed]
- Borecka, O.; Farrar, M.D.; Osman, J.E.; Rhodes, L.E.; Webb, A.R. Older Adults Who Spend More Time Outdoors in Summer and Have Higher Dietary Vitamin D Than Younger Adults Can Present at Least as High Vitamin D Status: A Pilot Study. Int. J. Environ. Res. Public Health 2021, 18, 3364. [Google Scholar] [CrossRef]
- Boucher, B.J. The Problems of Vitamin D Insufficiency in Older People. Aging Dis. 2012, 3, 313–329. [Google Scholar]
- Meehan, M.; Penckofer, S. The Role of Vitamin D in the Aging Adult. J. Aging Gerontol. 2014, 2, 60–71. [Google Scholar] [CrossRef]
- Anderson, P.H.; O’Loughlin, P.D.; May, B.K.; Morris, H.A. Determinants of Circulating 1,25-Dihydroxyvitamin D3 Levels: The Role of Renal Synthesis and Catabolism of Vitamin D. J. Steroid Biochem. Mol. Biol. 2004, 89, 111–113. [Google Scholar] [CrossRef]
- Breslau, N.A. Normal and Abnormal Regulation of 1,25-(OH)2D Synthesis. Am. J. Med. Sci. 1988, 296, 417–425. [Google Scholar] [CrossRef] [PubMed]
- Webb, A.R.; Kline, L.; Holick, M.F. Influence of Season and Latitude on the Cutaneous Synthesis of Vitamin D3: Exposure to Winter Sunlight in Boston and Edmonton Will Not Promote Vitamin D3 Synthesis in Human Skin. J. Clin. Endocrinol. Metab. 1988, 67, 373–378. [Google Scholar] [CrossRef]
- Webb, A.R.; Decosta, B.R.; Holick, M.F. Sunlight Regulates the Cutaneous Production of Vitamin D3 by Causing Its Photodegradation. J. Clin. Endocrinol. Metab. 1989, 68, 882–887. [Google Scholar] [CrossRef]
- Weinstein, J.R.; Anderson, S. The Aging Kidney: Physiological Changes. Adv. Chronic Kidney Dis. 2010, 17, 302–307. [Google Scholar] [CrossRef]
- Burchell, K.; Rhodes, L.E.; Webb, A.R. Public Awareness and Behaviour in Great Britain in the Context of Sunlight Exposure and Vitamin D: Results from the First Large-Scale and Representative Survey. Int. J. Environ. Res. Public Health 2020, 17, 6924. [Google Scholar] [CrossRef] [PubMed]
- Webb, A.R.; Alghamdi, R.; Kift, R.; Rhodes, L.E. 100 Years of Vitamin D: Dose-response for change in 25-hydroxyvitamin D after UV exposure: Outcome of a systematic review. Endocr. Connect. 2021, 10, R248–R266. [Google Scholar] [CrossRef] [PubMed]
- Berger, C.; Greene-Finestone, L.S.; Langsetmo, L.; Kreiger, N.; Joseph, L.; Kovacs, C.S.; Richards, J.B.; Hidiroglou, N.; Sarafin, K.; Davison, K.S.; et al. Temporal trends and determinants of longitudinal change in 25-hydroxyvitamin D and parathyroid hormone levels. J. Bone Miner. Res. 2012, 27, 1381–1389. [Google Scholar] [CrossRef] [PubMed]
- Bosworth, C.; Levin, G.; Robinson-Cohen, C.; Hoofnagle, A.N.; Ruzinski, J.; Young, B.; Schwartz, S.; Himmelfarb, J.; Kestenbaum, B.; de Boer, I.H. The Serum 24,25-Dihydroxyvitamin D Concentration, a Marker of Vitamin D Catabolism, Is Reduced in Chronic Kidney Disease. Kidney Int. 2012, 82, 693–700. [Google Scholar] [CrossRef]
- Kaufmann, M.; Gallagher, J.C.; Peacock, M.; Schlingmann, K.-P.; Konrad, M.; DeLuca, H.F.; Sigueiro, R.; Lopez, B.; Mourino, A.; Maestro, M.; et al. Clinical Utility of Simultaneous Quantitation of 25-Hydroxyvitamin D and 24,25-Dihydroxyvitamin D by LC-MS/MS Involving Derivatization with DMEQ-TAD. J. Clin. Endocrinol. Metab. 2014, 99, 2567–2574. [Google Scholar] [CrossRef]
- Ketha, H.; Kumar, R.; Singh, R.J. LC-MS/MS for Identifying Patients with CYP24A1 Mutations. Clin. Chem. 2016, 62, 236–242. [Google Scholar] [CrossRef]
- Edouard, T.; Husseini, A.; Glorieux, F.H.; Rauch, F. Serum 24,25-Dihydroxyvitamin D Concentrations in Osteogenesis Imperfecta: Relationship to Bone Parameters. J. Clin. Endocrinol. Metab. 2012, 97, 1243–1249. [Google Scholar] [CrossRef]
- Ginsberg, C.; Katz, R.; de Boer, I.H.; Kestenbaum, B.R.; Chonchol, M.; Shlipak, M.G.; Sarnak, M.J.; Hoofnagle, A.N.; Rifkin, D.E.; Garimella, P.S.; et al. The 24,25 to 25-Hydroxyvitamin D Ratio and Fracture Risk in Older Adults: The Cardiovascular Health Study. Bone 2018, 107, 124–130. [Google Scholar] [CrossRef]
- Stubbs, J.R.; Zhang, S.; Friedman, P.A.; Nolin, T.D. Decreased Conversion of 25-Hydroxyvitamin D3 to 24,25-Dihydroxyvitamin D3 Following Cholecalciferol Therapy in Patients with CKD. Clin. J. Am. Soc. Nephrol. 2014, 9, 1965–1973. [Google Scholar] [CrossRef]
- Fraser, W.D.; Tang, J.C.Y.; Dutton, J.J.; Schoenmakers, I. Vitamin D Measurement, the Debates Continue, New Analytes Have Emerged, Developments Have Variable Outcomes. Calcif. Tissue Int. 2020, 106, 3–13. [Google Scholar] [CrossRef]
- Glendenning, P.; Taranto, M.; Noble, J.M.; Musk, A.A.; Hammond, C.; Goldswain, P.R.; Fraser, W.D.; Vasikaran, S.D. Current Assays Overestimate 25-Hydroxyvitamin D3 and Underestimate 25-Hydroxyvitamin D2 Compared with HPLC: Need for Assay-Specific Decision Limits and Metabolite-Specific Assays. Ann. Clin. Biochem. 2006, 43, 23–30. [Google Scholar] [CrossRef] [PubMed]

| Younger | Older | |
|---|---|---|
| Participants, n | 11 (after 1 withdrew, 2 excluded) | 10 (after 1 excluded) |
| Sex: male, female (n) | 7, 4 | 6, 4 |
| Age (years) ± SD | 29.5 ± 6.3 | 70.2 ± 3.8 |
| BMI (kg/m2) ± SD | 27.1 ± 4.8 | 26.8 ± 5.6 |
| Skin type I, II, III (n) | 3, 2, 6 | 1, 2, 7 |
| Oral vitamin D intake (IU/day) | 96 ± 10 | 160 ± 22 |
| Younger | Older | ||||||||||
|---|---|---|---|---|---|---|---|---|---|---|---|
| Minimum | Lower Quartile | Median | Upper Quartile | Maximum | Minimum | Lower Quartile | Median | Upper Quartile | Maximum | Normal Range | |
| Parathyroid hormone (pmoL/L) | 2.4 | 3.2 | 4.1 | 4.5 | 8.2 | 2.5 | 3.5 | 4.3 | 5.4 | 6.6 | 1.5–7.6 |
| eGFR | 77 | 93 | 110 | 114 | 127 | 59 | 66 | 74 | 85 | 131 | >60 |
| Sodium (mmoL/L) | 137 | 138 | 139 | 140 | 144 | 137 | 138 | 139 | 140 | 142 | 133–146 |
| Potassium (mmoL/L) | 3.9 | 4.2 | 4.2 | 4.4 | 4.6 | 3.6 | 4.1 | 4.2 | 4.5 | 4.7 | 3.5–5.3 |
| Urea (mmoL/L) | 3.4 | 4.0 | 4.4 | 5.1 | 7.9 | 4.5 | 5.4 | 5.9 | 6.4 | 7.0 | 2.5–7.8 |
| Creatinine (μmoL/L) | 49 | 61 | 73 | 80 | 95 | 52 | 76 | 81 | 84 | 100 | 62–115 (m) 44–97 (f) |
| Adjusted Calcium (mmoL/L) | 2.3 | 2.3 | 2.4 | 2.4 | 2.5 | 2.3 | 2.3 | 2.4 | 2.4 | 2.6 | 2.2–2.6 |
| Phosphate (mmoL/L) | 0.95 | 1.04 | 1.12 | 1.27 | 1.39 | 0.97 | 1.15 | 1.17 | 1.21 | 1.5 | 0.8–1.5 |
| Albumin (g/L) | 46 | 47 | 47 | 48 | 51 | 43 | 45 | 45 | 47 | 48 | 35–50 |
| Groups Combined | Younger | Older | |
|---|---|---|---|
| 25(OH)D3 (nmoL/L) | |||
| Baseline | 44.2 ± 22.9 * | 37.4 ± 18.9 | 51.7 ± 25.5 |
| 24 h post-UVR | 47.7 ± 22.3 * | 40.5 ± 18.6 | 54.1 ± 24.3 |
| 7 d post-UVR | 46.8 ± 21.0 | 41.3 ± 19.0 | 52.7 ± 22.4 |
| 24,25(OH)2D3 (nmoL/L) | |||
| Baseline | 3.8 ± 1.9 ** | 3.2 ± 1.7 | 4.5 ± 2.1 |
| 24 h post-UVR | 3.8 ± 2.1 ** | 3.1 ± 1.7 | 4.4 ± 2.3 |
| 7 d post-UVR | 3.7 ± 1.9 | 3.1 ± 1.7 | 4.4 ± 2.0 |
| Vitamin D Metabolite Ratio [25-VMR = 100 * (24,25(OH)2D3/25(OH)D3)] | |||
| Baseline | 8.8 ± 2.9 | 8.7 ± 2.2 | 8.9 ± 3.7 |
| 24 h post-UVR | 7.5 ± 2.1 | 7.2 ± 2.2 | 7.7 ± 2.0 |
| 7 d post-UVR | 7.8 ± 1.0 | 7.2 ± 1.6 | 8.3 ± 1.4 |
| 1,25(OH)2D3 (pmoL/L) | |||
| Baseline | 136.3 ± 37.6 | 145.1 ± 44.7 | 126.7 ± 26.9 |
| 24 h post-UVR | 137.1 ± 37.9 | 131.0 ± 45.9 | 142.5 ± 30.9 |
| 7 d post-UVR | 135.2 ± 57.8 | 163.1 ± 59.7 * | 104.6 ± 38.1 * |
| Molar ratio of 1,25(OH)2D3 to 24,25(OH)2D3 | |||
| Baseline | 56.7 ± 57.7 | 66.0 ± 58.8 | 46.4 ± 57.8 |
| 24 h post-UVR | 54.1 ± 44.0 | 60.4 ± 47.2 | 48.6 ± 40.5 |
| 7 d post-UVR | 48.4 ± 39.0 | 68.4 ± 45.1 | 26.4 ± 10.0 |
Disclaimer/Publisher’s Note: The statements, opinions and data contained in all publications are solely those of the individual author(s) and contributor(s) and not of MDPI and/or the editor(s). MDPI and/or the editor(s) disclaim responsibility for any injury to people or property resulting from any ideas, methods, instructions or products referred to in the content. |
© 2025 by the authors. Licensee MDPI, Basel, Switzerland. This article is an open access article distributed under the terms and conditions of the Creative Commons Attribution (CC BY) license (https://creativecommons.org/licenses/by/4.0/).
Share and Cite
Borecka, O.P.; Tang, J.C.Y.; Fraser, W.D.; Rhodes, L.E.; Webb, A.R. The Influence of Solar-Simulated UV Radiation on Circulating 25(OH)D3, 24,25(OH)2D3 and Their Ratio in Younger and Older Adults. Nutrients 2025, 17, 2039. https://doi.org/10.3390/nu17122039
Borecka OP, Tang JCY, Fraser WD, Rhodes LE, Webb AR. The Influence of Solar-Simulated UV Radiation on Circulating 25(OH)D3, 24,25(OH)2D3 and Their Ratio in Younger and Older Adults. Nutrients. 2025; 17(12):2039. https://doi.org/10.3390/nu17122039
Chicago/Turabian StyleBorecka, Oktawia P., Jonathan C. Y. Tang, William D. Fraser, Lesley E. Rhodes, and Ann R. Webb. 2025. "The Influence of Solar-Simulated UV Radiation on Circulating 25(OH)D3, 24,25(OH)2D3 and Their Ratio in Younger and Older Adults" Nutrients 17, no. 12: 2039. https://doi.org/10.3390/nu17122039
APA StyleBorecka, O. P., Tang, J. C. Y., Fraser, W. D., Rhodes, L. E., & Webb, A. R. (2025). The Influence of Solar-Simulated UV Radiation on Circulating 25(OH)D3, 24,25(OH)2D3 and Their Ratio in Younger and Older Adults. Nutrients, 17(12), 2039. https://doi.org/10.3390/nu17122039