

The Role of Genetic Variation in Modulating the Effects of Blended Fruits and Vegetables Versus Fruit- and Vegetable-Coated Food Products on Antioxidant Capacity, DNA Protection, and Vascular Health: A Randomized Controlled Trial


Abstract

1. Introduction
2. Materials and Methods
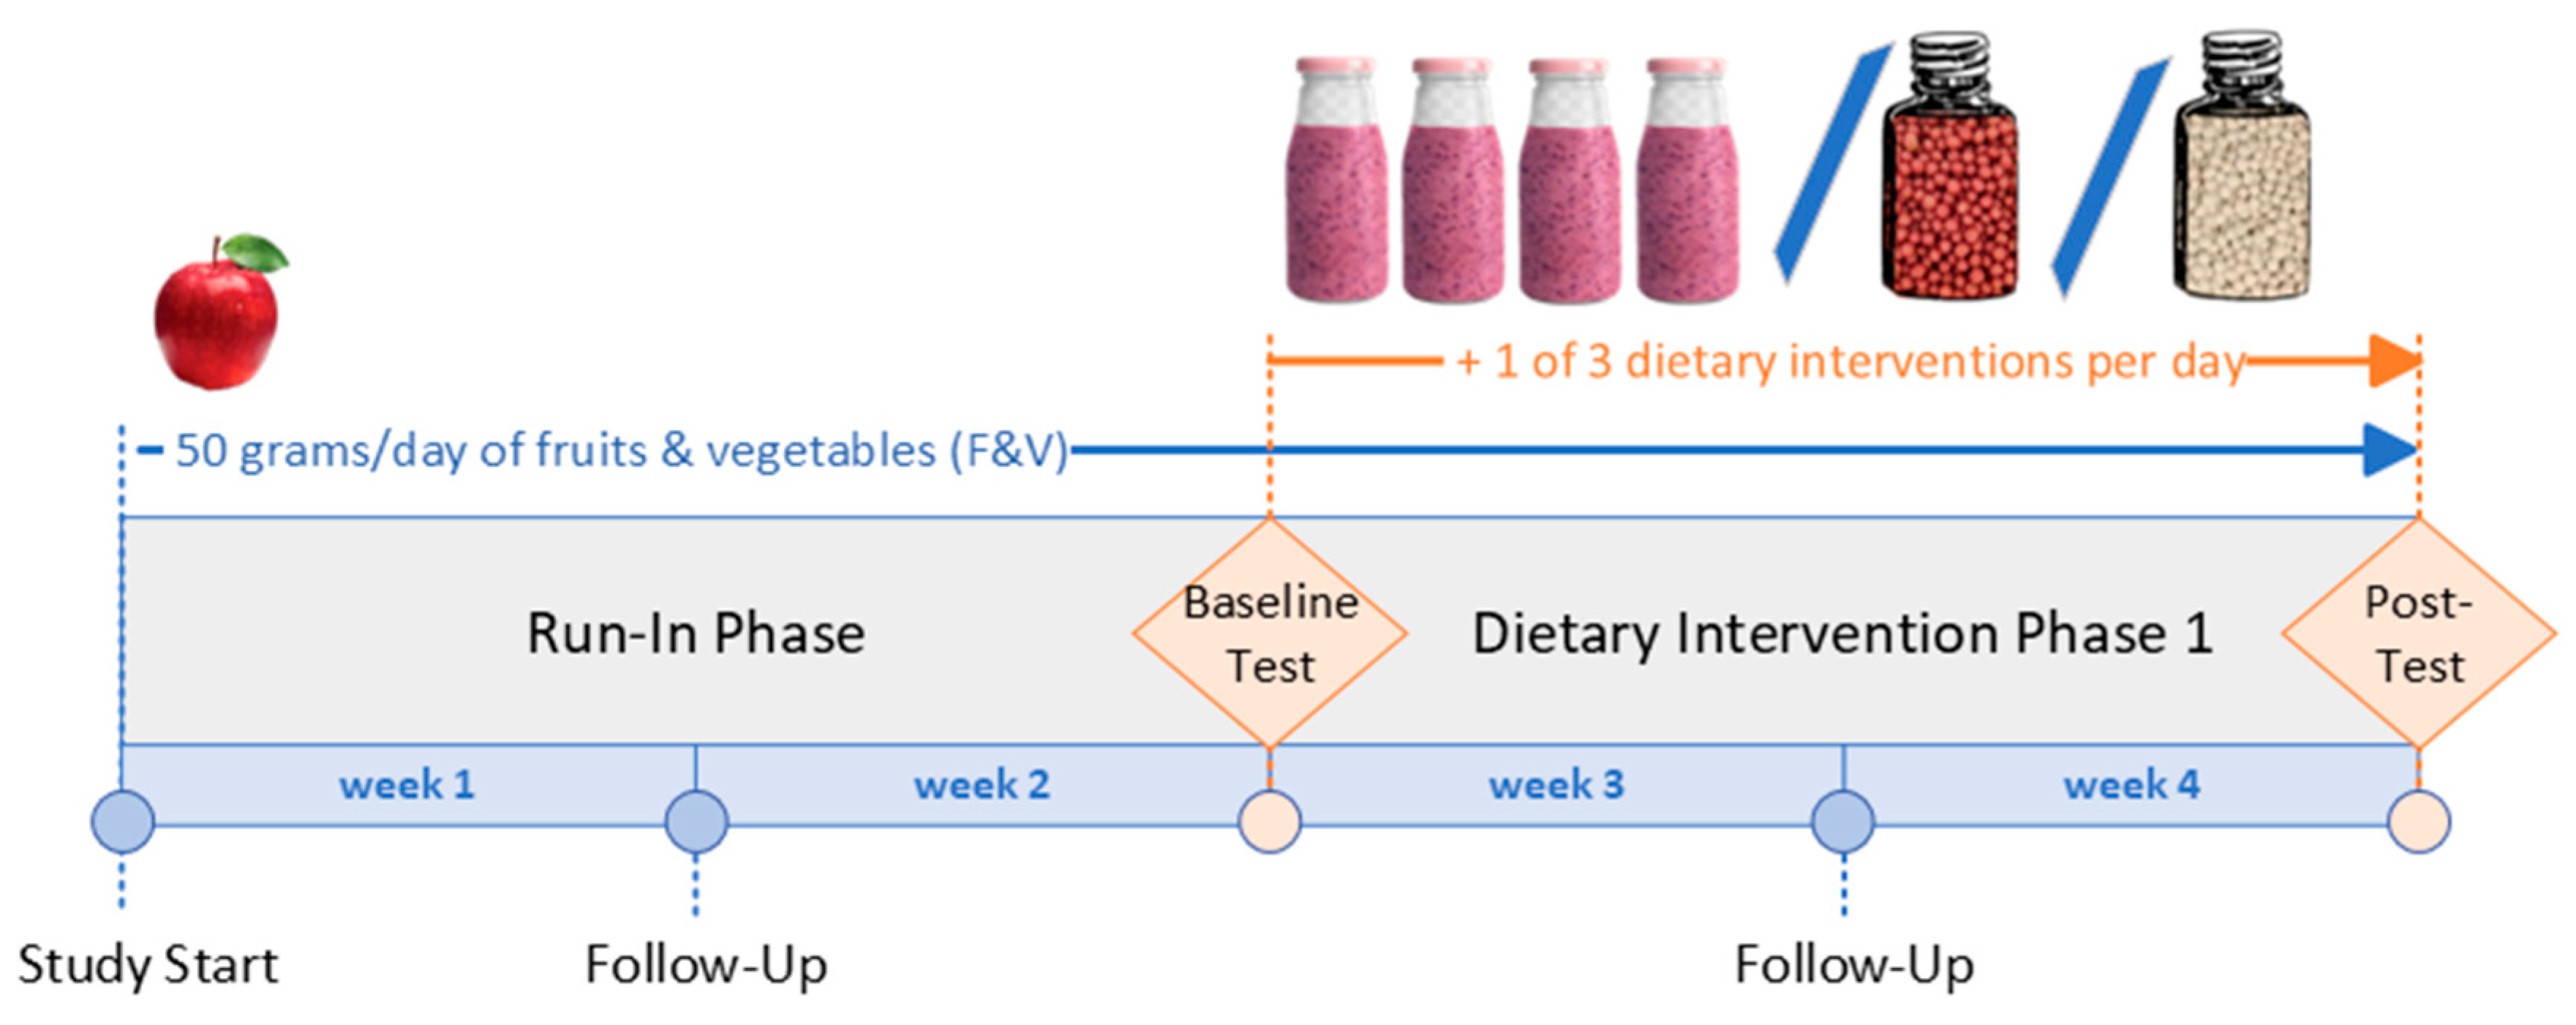
2.1. Study Design
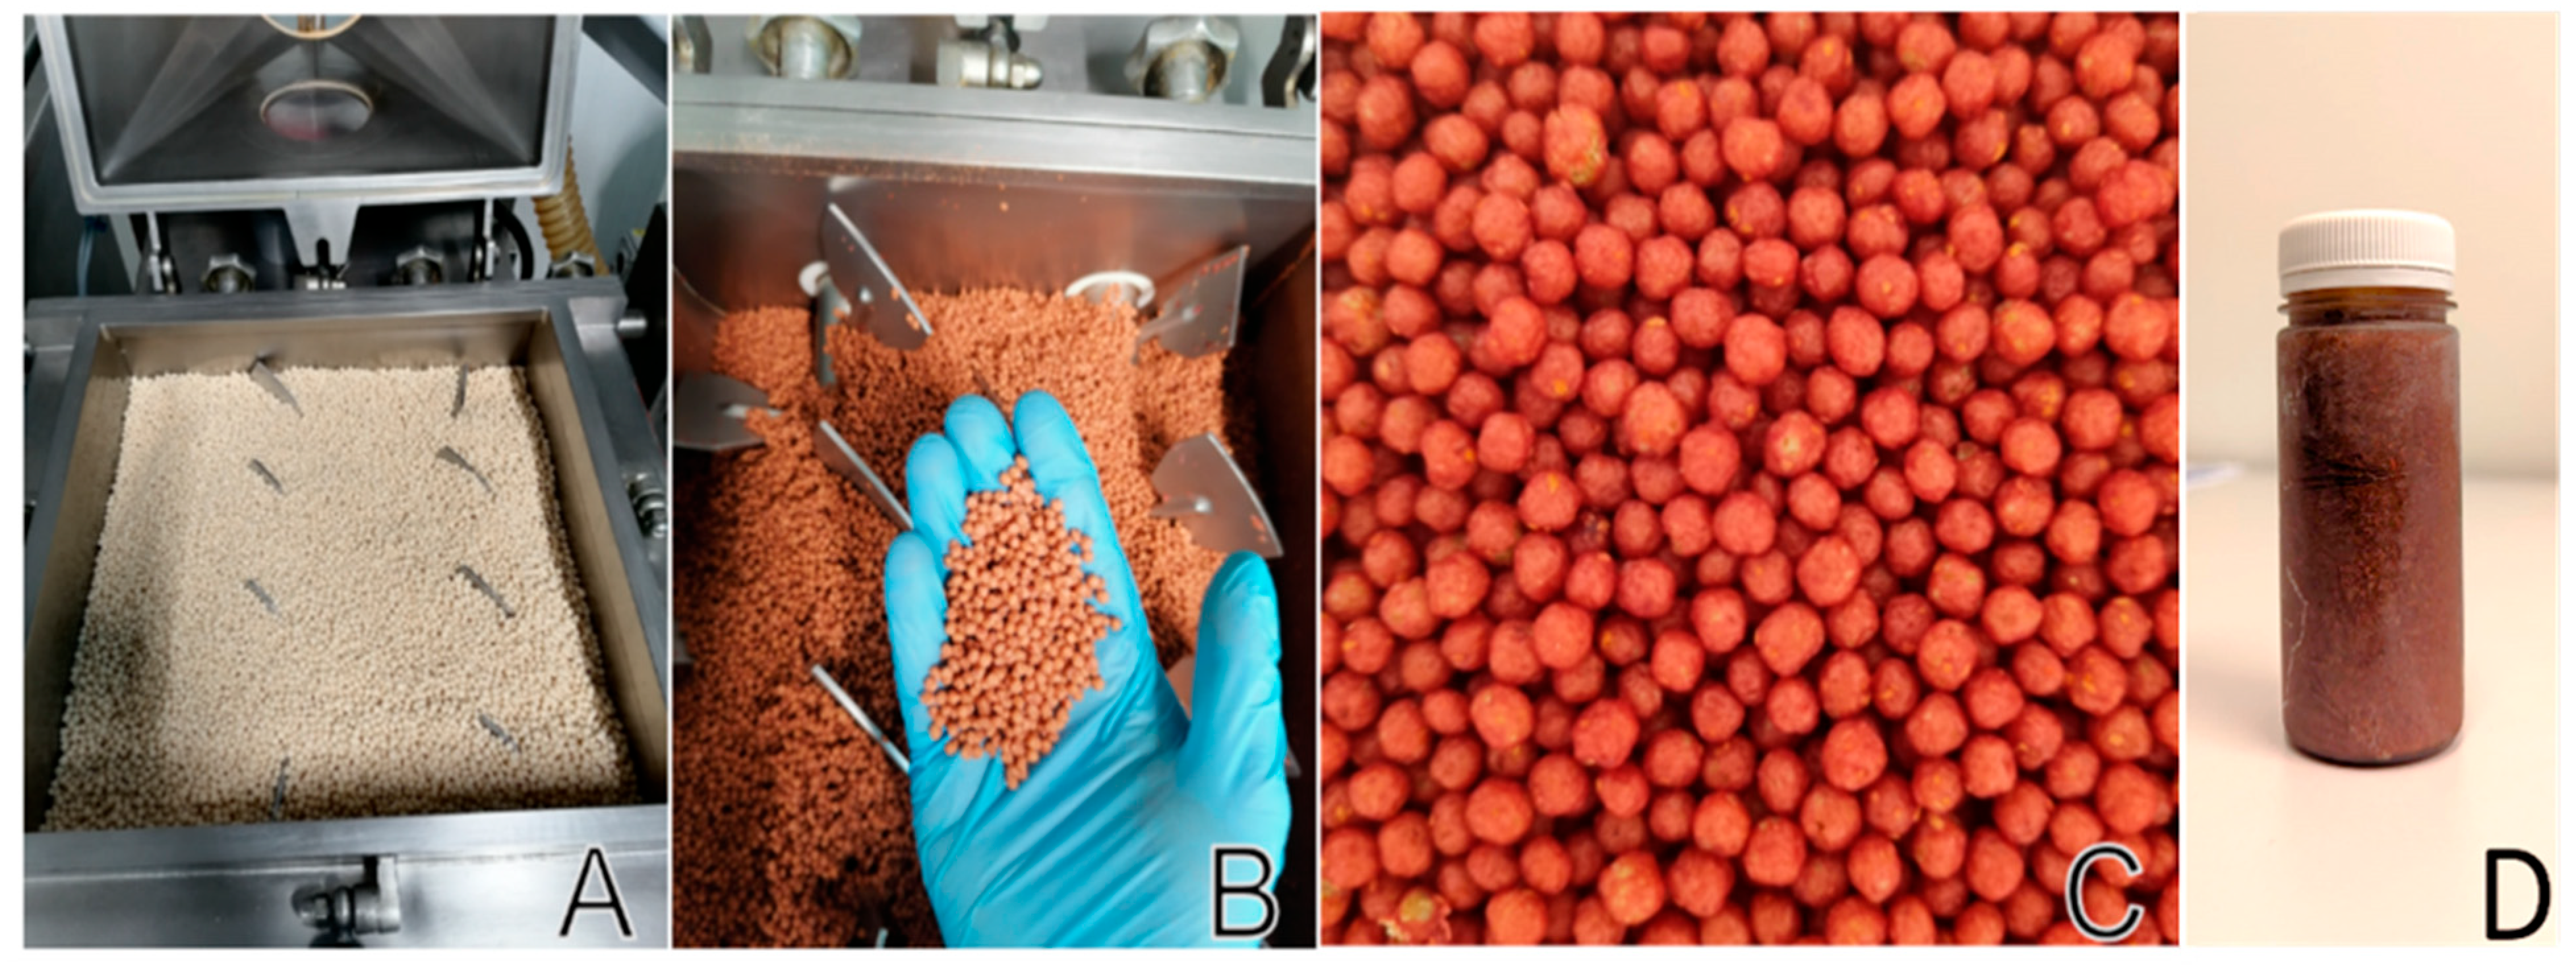
2.2. Dietary Interventions
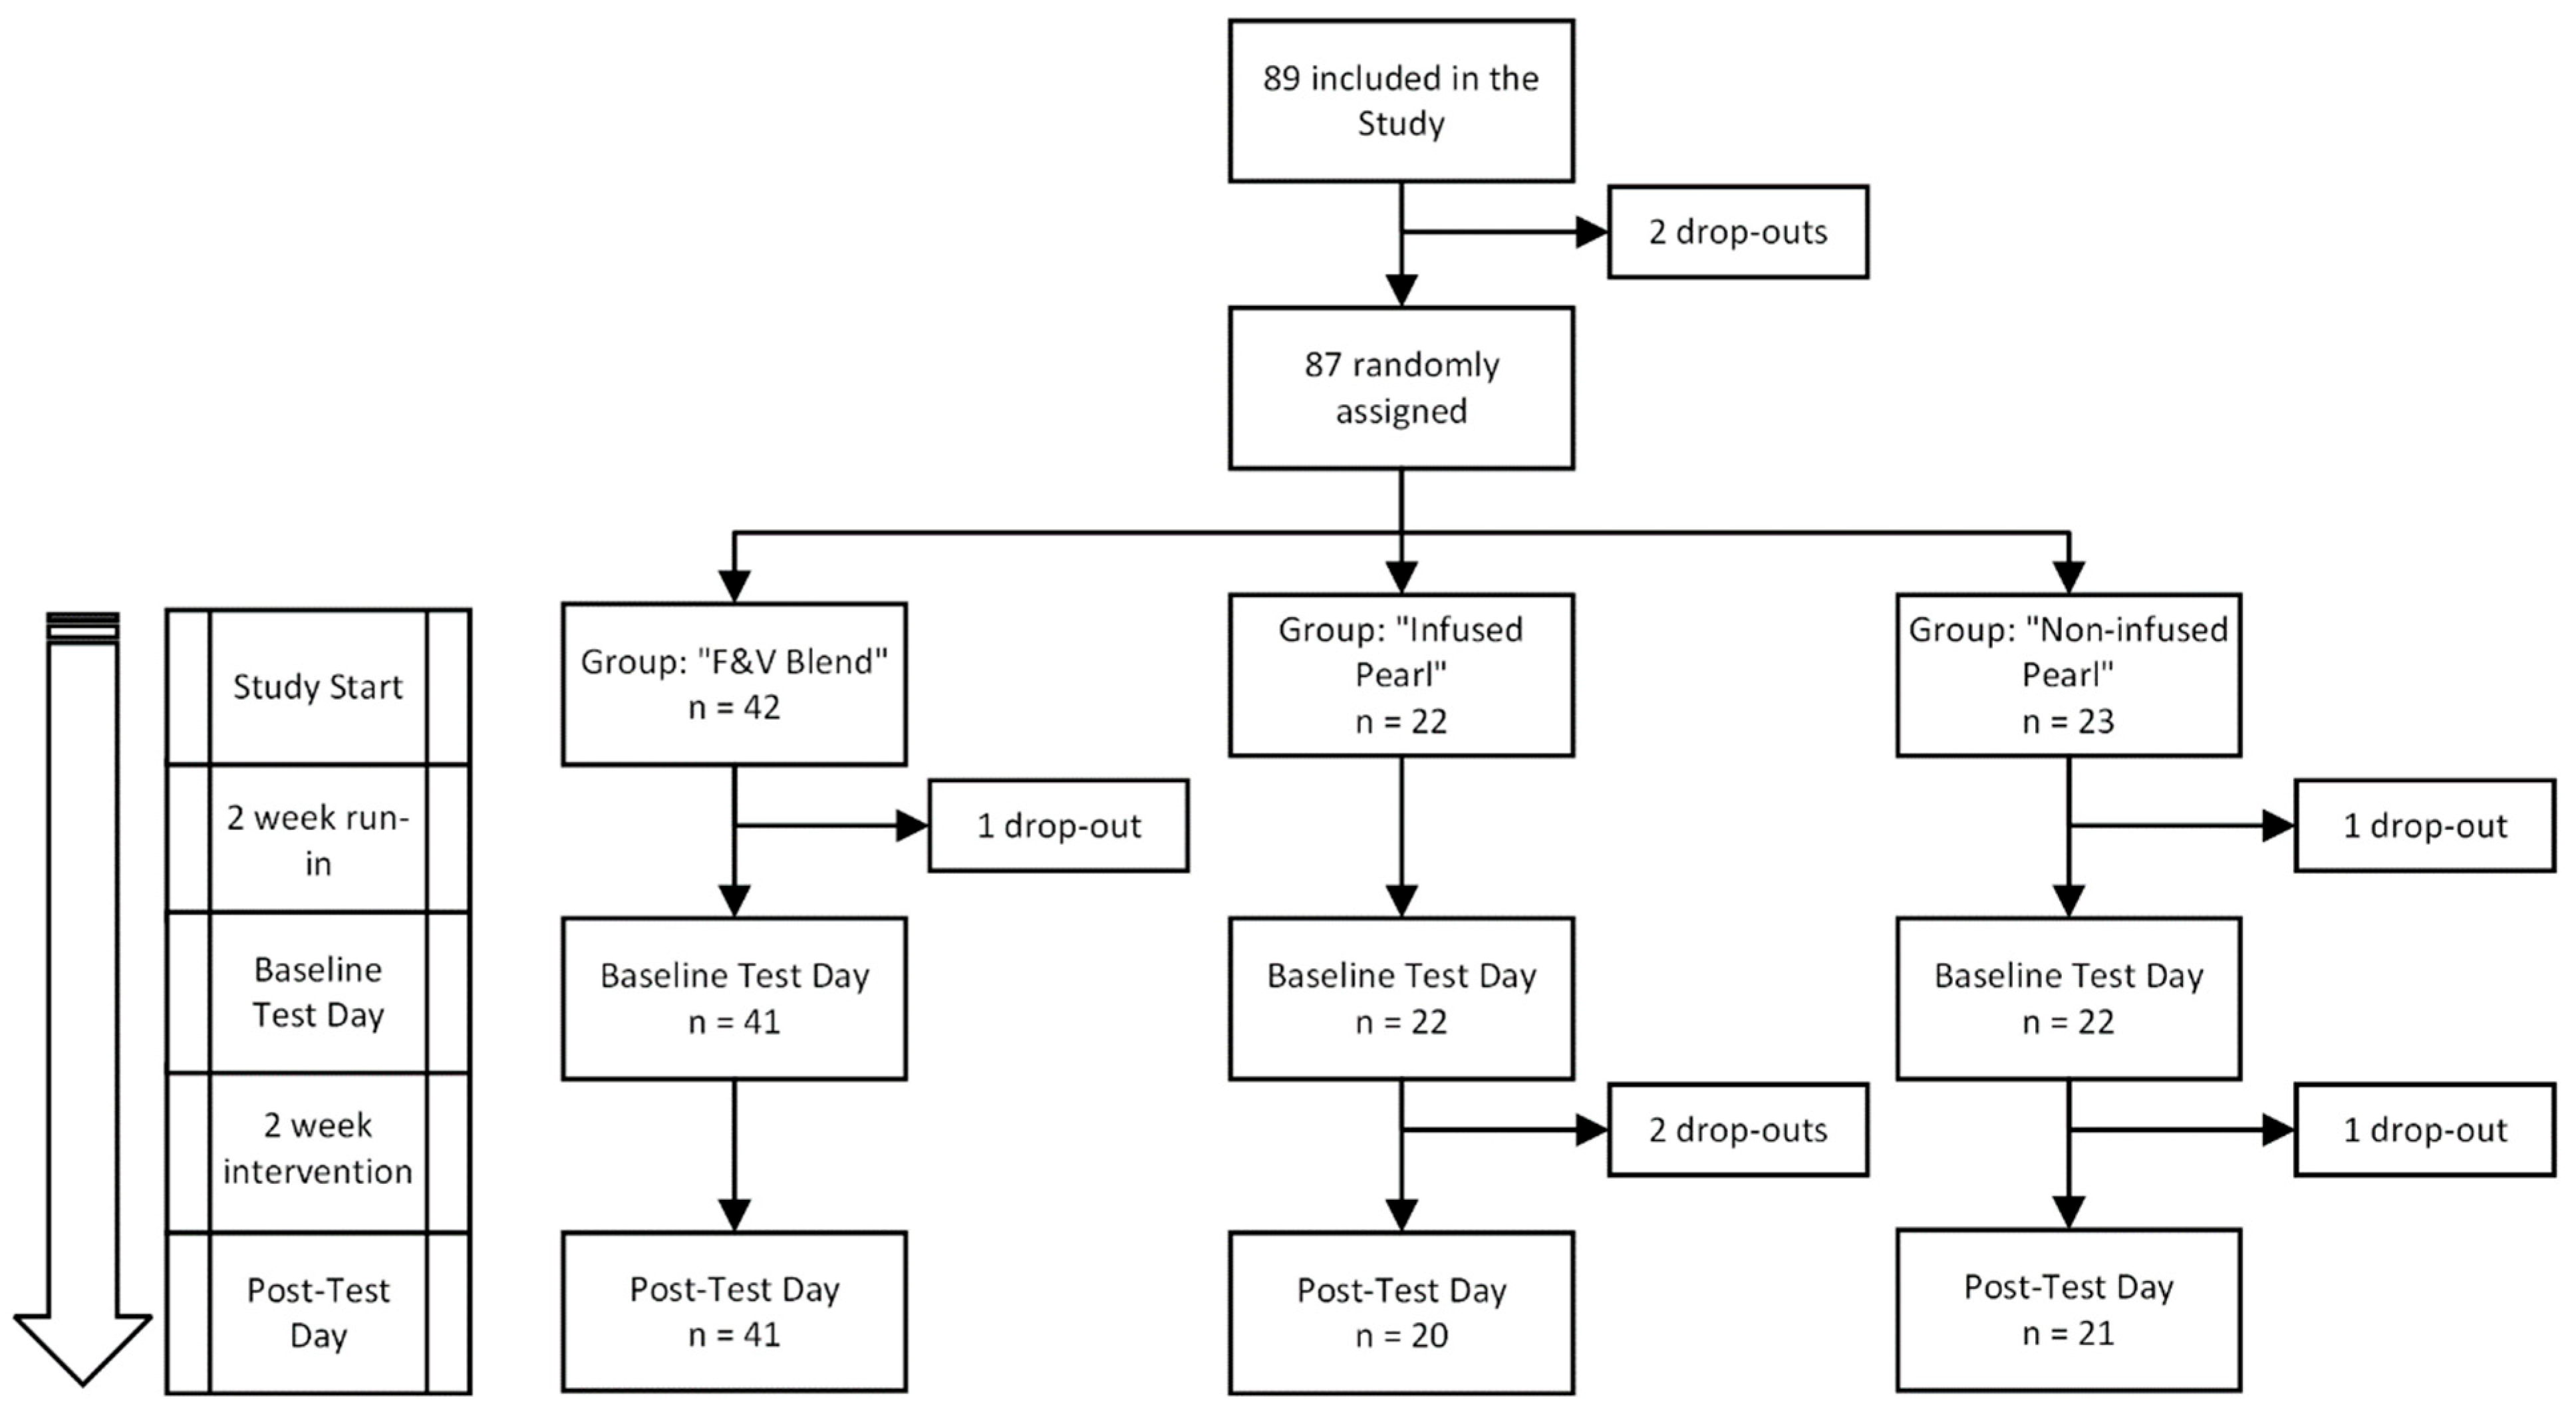
2.3. Participants
2.4. Test Days
2.5. DNA Strand Breaks
2.6. Oxidative Stress Markers
2.6.1. Antioxidant Capacity
2.6.2. Superoxide Scavenging
2.7. Retinal Microvasculature
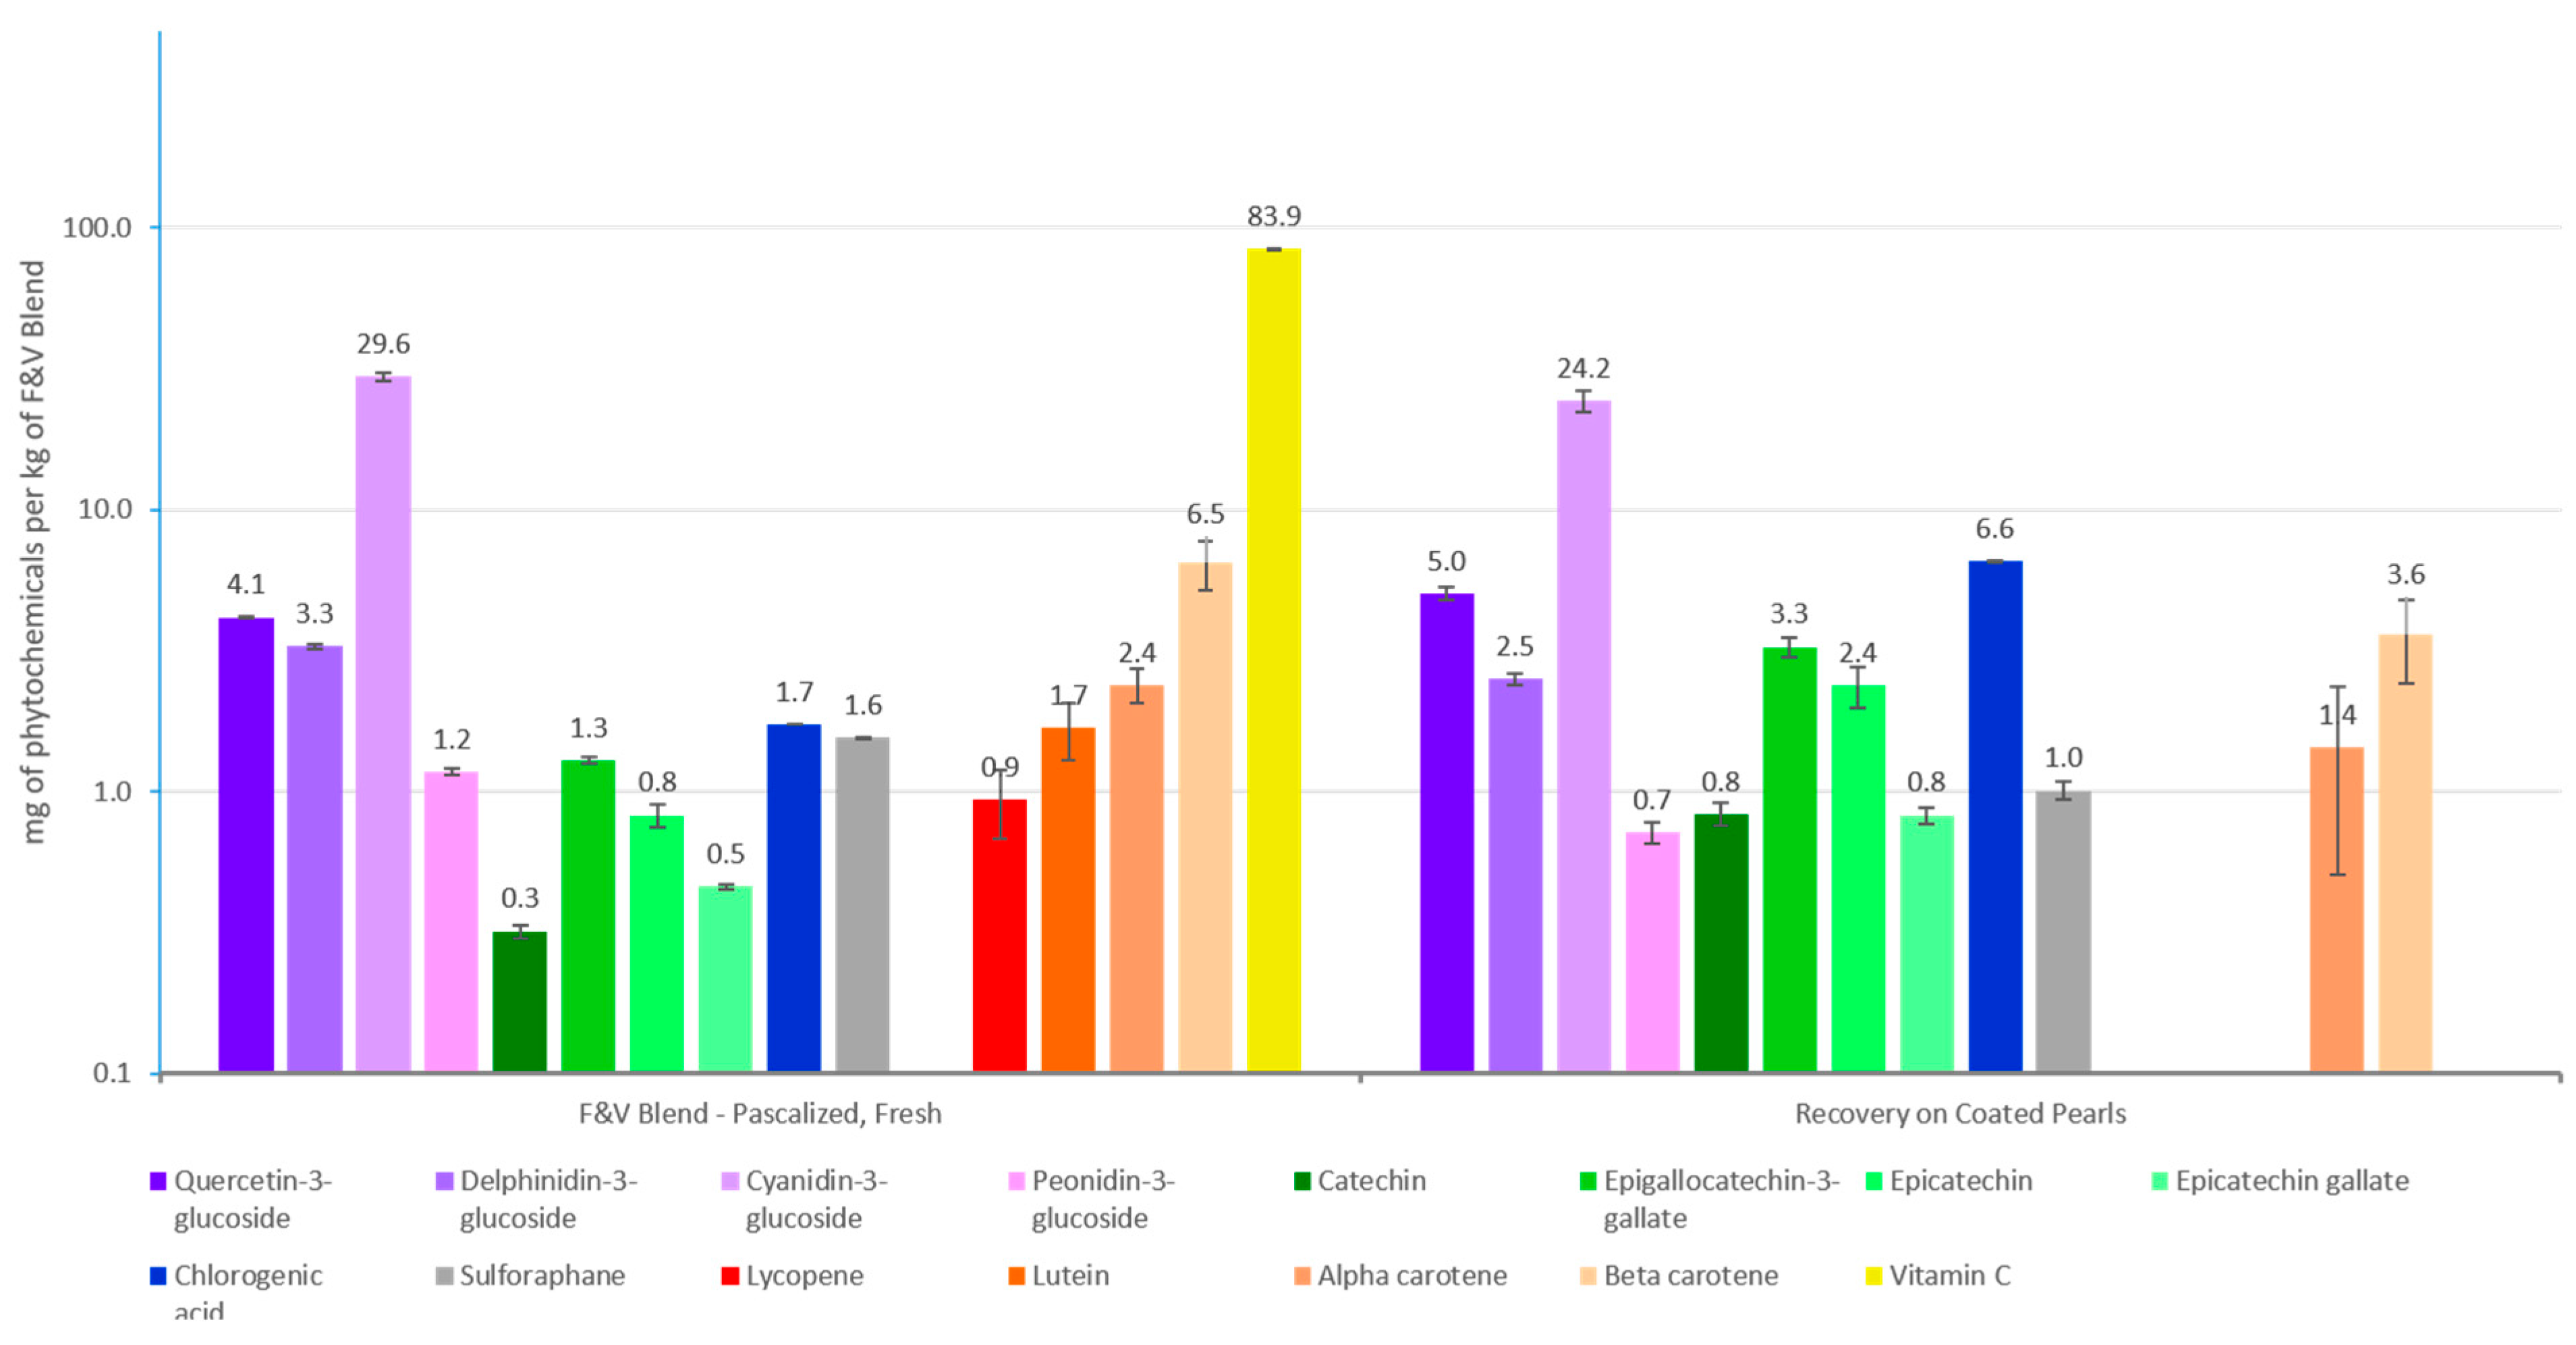
2.8. Phytochemical Absorption
2.8.1. Total Polyphenols
2.8.2. Carotenoids
2.8.3. Vitamin C
2.9. Selection of Gene Polymorphisms
2.10. Genotyping Participants
2.10.1. DNA Isolation
2.10.2. Genotyping
2.10.3. Multiplex PCR Assay
2.10.4. Taqman Assay
2.11. Sample Size Calculation, Randomization and Statistical Analysis
3. Results
3.1. Participants
3.2. Phytochemical Absorption
3.2.1. Total Polyphenols
3.2.2. Carotenoids
3.2.3. Vitamin C
3.3. DNA Strand Breaks
3.4. Oxidative Stress Markers
3.4.1. Antioxidant Capacity
3.4.2. Superoxide Levels
3.5. Retinal Microvasculature
3.6. SNPs
4. Discussion
5. Conclusions
Author Contributions
Funding
Institutional Review Board Statement
Informed Consent Statement
Data Availability Statement
Acknowledgments
Conflicts of Interest
Abbreviations
| F&V | fruits and vegetables |
| SNP | single nucleotide polymorphism |
| TEAC | Trolox equivalent antioxidant capacity |
| ICTRP | International Trial Registry Platform |
| ESR | electron spin resonance spectroscopy. |
| CRAE | central retinal artery equivalent |
| CRVE | central retinal vein equivalent |
| AVR | arteriolar-to-venular ratio |
| DI | dietary intervention |
| MUMC+ | Maastricht University Medical Center + |
| Bp | base pair |
| Wt | wildtype |
| Hz | heterozygous |
| Hm | homozygous |
References
- Kang, S.; Kang, M.; Lim, H. Global and Regional Patterns in Noncommunicable Diseases and Dietary Factors across National Income Levels. Nutrients 2021, 13, 3595. [Google Scholar] [CrossRef] [PubMed]
- van Breda, S.G.J.; de Kok, T.M.C.M. Smart Combinations of Bioactive Compounds in Fruits and Vegetables May Guide New Strategies for Personalized Prevention of Chronic Diseases. Mol. Nutr. Food Res. 2018, 62, 1700597. [Google Scholar] [CrossRef] [PubMed]
- Van Breda, S.G.J.; Briedé, J.J.; De Kok, T.M.C.M. Improved Preventive Effects of Combined Bioactive Compounds Present in Different Blueberry Varieties as Compared to Single Phytochemicals. Nutrients 2019, 11, 61. [Google Scholar] [CrossRef] [PubMed]
- van Breda, S.G.J.; Wilms, L.C.; Gaj, S.; Jennen, D.G.J.; Briedé, J.J.; Helsper, J.P.; Kleinjans, J.C.S.; De Kok, T.M.C.M. Can Transcriptomics Provide Insight into the Chemopreventive Mechanisms of Complex Mixtures of Phytochemicals in Humans? Antioxid. Redox Signal 2014, 20, 2107. [Google Scholar] [CrossRef]
- Smith, A.E.; Ogunseye, K.O.; Debenedictis, J.N.; Peris, J.; Kasper, J.M.; Hommel, J.D. Glutamatergic Projections from Homeostatic to Hedonic Brain Nuclei Regulate Intake of Highly Palatable Food. Sci. Rep. 2020, 10, 22093. [Google Scholar] [CrossRef]
- Granato, D.; Barba, F.J.; Bursać Kovačević, D.; Lorenzo, J.M.; Cruz, A.G.; Putnik, P. Annual Review of Food Science and Technology Functional Foods: Product Development, Technological Trends, Efficacy Testing, and Safety. Annu. Rev. Food Sci. Technol. 2020, 11, 93–118. [Google Scholar] [CrossRef]
- Wilms, L.C.; Boots, A.W.; de Boer, V.C.J.; Maas, L.M.; Pachen, D.M.F.A.; Gottschalk, R.W.H.; Ketelslegers, H.B.; Godschalk, R.W.L.; Haenen, G.R.M.M.; van Schooten, F.J.; et al. Impact of Multiple Genetic Polymorphisms on Effects of a 4-Week Blueberry Juice Intervention on Ex Vivo Induced Lymphocytic DNA Damage in Human Volunteers. Carcinogenesis 2007, 28, 1800–1806. [Google Scholar] [CrossRef] [PubMed]
- Morand, C.; De Roos, B.; Garcia-Conesa, M.T.; Gibney, E.R.; Landberg, R.; Manach, C.; Milenkovic, D.; Rodriguez-Mateos, A.; Van De Wiele, T.; Tomas-Barberan, F. Why Interindividual Variation in Response to Consumption of Plant Food Bioactives Matters for Future Personalised Nutrition. Proc. Nutr. Soc. 2020, 79, 225–235. [Google Scholar] [CrossRef]
- Mullins, V.A.; Bresette, W.; Johnstone, L.; Hallmark, B.; Chilton, F.H. Genomics in Personalized Nutrition: Can You “Eat for Your Genes”? Nutrients 2020, 12, 3118. [Google Scholar] [CrossRef]
- Jakovljevic, A.; Nikolic, N.; Carkic, J.; Beljic-Ivanovic, K.; Soldatovic, I.; Miletic, M.; Andric, M.; Milasin, J.; Jakovljevic, A. Association of Polymorphisms in TNF-a, IL-1b, GSTM and GSTT Genes with Apical Periodontitis: Is There a Link with Herpesviral Infection? Int. Endod. J. 2020, 53, 895–904. [Google Scholar] [CrossRef]
- Ezema, B.O.; Eze, C.N.; Ayoka, T.O.; Nnadi, C.O. Antioxidantenzyme Interaction in Non-communicable Diseases. J. Explor. Res. Pharmacol. 2024, 9, 262–275. [Google Scholar] [CrossRef]
- Marrocco, I.; Altieri, F.; Peluso, I. Measurement and Clinical Significance of Biomarkers of Oxidative Stress in Humans. Oxid. Med. Cell Longev. 2017, 2017, 6501046. [Google Scholar] [CrossRef] [PubMed]
- Bonassi, S.; Ceppi, M.; Møller, P.; Azqueta, A.; Milić, M. DNA Damage in Circulating Leukocytes Measured with the Comet Assay May Predict the Risk of Death. Sci Rep. 2021, 11, 16793. [Google Scholar] [CrossRef] [PubMed]
- Fakhri, K.U.; Sharma, D.; Fatma, H.; Yasin, D.; Alam, M.; Sami, N.; Ahmad, F.J.; Shamsi, A.; Rizvi, M.A. The Dual Role of Dietary Phytochemicals in Oxidative Stress: Implications for Oncogenesis, Cancer Chemoprevention, and ncRNA Regulation. Antioxidants 2025, 14, 620. [Google Scholar] [CrossRef]
- Fenech, M.F.; Bull, C.F.; Van Klinken, B.J. Protective Effects of Micronutrient Supplements, Phytochemicals and Phytochemical-Rich Beverages and Foods Against DNA Damage in Humans: A Systematic Review of Randomized Controlled Trials and Prospective Studies. Adv. Nutr. 2023, 14, 1337–1358. [Google Scholar] [CrossRef]
- Cheung, C.Y.; Ikram, M.K.; Klein, R.; Wong, T.Y. The Clinical Implications of Recent Studies on the Structure and Function of the Retinal Microvasculature in Diabetes. Diabetologia 2015, 58, 871–885. [Google Scholar] [CrossRef]
- Festa, J.; Hussain, A.; Al-Hareth, Z.; Singh, H.; Da Boit, M. Anthocyanins and Vascular Health: A Matter of Metabolites. Foods 2023, 12, 1796. [Google Scholar] [CrossRef]
- Li, H.; Zhang, Q. Research Progress of Flavonoids Regulating Endothelial Function. Pharmaceuticals 2023, 16, 1201. [Google Scholar] [CrossRef]
- González-Vallinas, M.; González-Castejón, M.; Rodríguez-Casado, A.; Ramírez De Molina, A. Dietary Phytochemicals in Cancer Prevention and Therapy: A Complementary Approach with Promising Perspectives. Nutr. Rev. 2013, 71, 585–599. [Google Scholar] [CrossRef]
- Sram, R.J.; Binkova, B.; Rossner, P. Vitamin C for DNA Damage Prevention. Mutat. Res. 2012, 733, 39–49. [Google Scholar] [CrossRef]
- Aune, D.; Keum, N.; Giovannucci, E.; Fadnes, L.T.; Boffetta, P.; Greenwood, D.C.; Tonstad, S.; Vatten, L.J.; Riboli, E.; Norat, T. Dietary Intake and Blood Concentrations of Antioxidants and the Risk of Cardiovascular Disease, Total Cancer, and All-Cause Mortality: A Systematic Review and Dose-Response Meta-Analysis of Prospective Studies. Am. J. Clin. Nutr. 2018, 108, 1069–1091. [Google Scholar] [CrossRef]
- Li, W.; Zhu, L.; Huang, H.; He, Y.; Lv, J.; Li, W.; Chen, L.; He, W. Identification of Susceptible Genes for Complex Chronic Diseases Based on Disease Risk Functional SNPs and Interaction Networks. J. Biomed. Inform. 2017, 74, 137–144. [Google Scholar] [CrossRef]
- Walther, B.; Lett, A.M.; Bordoni, A.; Tomás-Cobos, L.; Nieto, J.A.; Dupont, D.; Danesi, F.; Shahar, D.R.; Echaniz, A.; Re, R.; et al. GutSelf: Interindividual Variability in the Processing of Dietary Compounds by the Human Gastrointestinal Tract. Mol. Nutr. Food Res. 2019, 63, 1900677. [Google Scholar] [CrossRef]
- Lampe, J.W. Interindividual Differences in Response to Plant-Based Diets: Implications for Cancer Risk. Am. J. Clin. Nutr. 2009, 89, 1553S–1557S. [Google Scholar] [CrossRef]
- DeBenedictis, J.N.; de Kok, T.M.; van Breda, S.G. Impact of Processing Method and Storage Time on Phytochemical Concentrations in an Antioxidant-Rich Food Mixture. Antioxidants 2023, 12, 1252. [Google Scholar] [CrossRef]
- Singh, N.P.; McCoy, M.T.; Tice, R.R.; Schneider, E.L. A simple technique for quantitation of low levels of DNA damage in individual cells. Exp. Cell Res. 1988, 175, 184–191. [Google Scholar] [CrossRef]
- Tice, R.R.; Agurell, E.; Anderson, D.; Burlinson, B.; Hartmann, A.; Kobayashi, H.; Miyamae, Y.; Rojas, E.; Ryu, J.C.; Sasaki, Y.F. Single cell gel/comet assay: Guidelines for in vitro and in vivo genetic toxicology testing. Environ. Mol. Mutagen. 2000, 35, 206–221. [Google Scholar] [CrossRef]
- Fischer, M.A.; Gransier, T.J.; Beckers, L.M.; Bekers, O.; Bast, A.; Haenen, G.R. Determination of the antioxidant capacity in blood. Clin. Chem. Lab. Med. 2005, 43, 735–740. [Google Scholar] [CrossRef]
- Mrakic-Sposta, S.; Gussoni, M.; Montorsi, M.; Porcelli, S.; Vezzoli, A. Assessment of a Standardized ROS Production Profile in Humans by Electron Paramagnetic Resonance. Oxid. Med. Cell Longev. 2012, 2012, 973927. [Google Scholar] [CrossRef]
- Louwies, T.; De Boever, P.; Hasso, R.; Tremblay, M.F.; Xu, D.; Blaber, A.P.; Goswami, N. Retinal blood vessel diameter changes with 60-day head-down bedrest are unaffected by antioxidant nutritional cocktail. npj Microgravity 2024, 10, 105. [Google Scholar] [CrossRef]
- Swain, T.; Hillis, E. The phenolic constituents of Prunus domestica. I. The quantitative analysis of phenolic constituents. J. Sci. Food Agric. 1959, 10, 63–68. [Google Scholar] [CrossRef]
- Dams, S.; Holasek, S.; Tsiountsioura, M.; Malliga, D.E.; Meier-Allard, N.; Poncza, B.; Lackner, S.; Jansenberger, Y.; Lamprecht, M. An Encapsulated Fruit, Vegetable and Berry Juice Powder Concentrate Increases Plasma Values of Specific Carotenoids and Vitamins. Int. J. Vitam. Nutr. Res. 2021, 91, 77–86. [Google Scholar] [CrossRef]
- Nielsen, S.S. Food Analysis Laboratory Manual; Food Science Text Series; Springer: Berlin/Heidelberg, Germany, 2017; pp. 143–146. [Google Scholar] [CrossRef]
- Benabdelkrim, M.; Djeffal, O.; Berredjem, H. GSTM1 and GSTT1 Polymorphisms and Susceptibility to Prostate Cancer: A Case-Control Study of the Algerian Population. Asian Pac. J. Cancer Prev. 2018, 19, 2853–2858. [Google Scholar] [CrossRef]
- Bi, J.; Zhong, C.; Li, K.; Chu, H.; Wang, B. Association Study of Single Nucleotide Polymorphisms in Xrcc1 Gene with Risk of Hepatocellular Carcinoma in Chinese Han Population. Biomed. Res. Int. 2013, 2013, 138785. [Google Scholar] [CrossRef]
- Hindy, G.; Mollet, I.G.; Rukh, G.; Ericson, U.; Orho-Melander, M. Several Type 2 Diabetes Associated Variants in Genes Annotated to WNT Signaling Interact with Dietary Fiber in Relation to Incidence of Type 2 Diabetes. Genes Nutr. 2016, 11, 6. [Google Scholar] [CrossRef]
- Levin, B.L.; Varga, E. MTHFR: Addressing Genetic Counseling Dilemmas Using Evidence-Based Literature. J. Genet. Couns. 2016, 25, 901–911. [Google Scholar] [CrossRef]
- Tijhuis, M.J.; Wark, P.A.; Aarts, J.M.M.J.G.; Visker, M.H.P.W.; Nagengast, F.M.; Kok, F.J.; Kampman, E. GSTP1 and GSTA1 Polymorphisms Interact with Cruciferous Vegetable Intake in Colorectal Adenoma Risk. Cancer Epidemiol. Biomark. Prev. 2005, 14, 2943–2951. [Google Scholar] [CrossRef]
- Borel, P. Genetic Variations Involved in Interindividual Variability in Carotenoid Status. Mol. Nutr. Food Res. 2012, 56, 228–240. [Google Scholar] [CrossRef]
- Palli, D.; Masala, G.; Peluso, M.; Gaspari, L.; Krogh, V.; Munnia, A.; Panico, S.; Saieva, C.; Tumino, R.; Vineis, P.; et al. The Effects of Diet on DNA Bulky Adduct Levels Are Strongly Modified by GSTM1 Genotype: A Study on 634 Subjects. Carcinogenesis 2004, 25, 577–584. [Google Scholar] [CrossRef]
- George, T.W.; Waroonphan, S.; Niwat, C.; Gordon, M.H.; Lovegrove, J.A. The Glu298Asp Single Nucleotide Polymorphism in the Endothelial Nitric Oxide Synthase Gene Differentially Affects the Vascular Response to Acute Consumption of Fruit and Vegetable Puree Based Drinks. Mol. Nutr. Food Res. 2012, 56, 1014–1024. [Google Scholar] [CrossRef]
- Kapiszewska, M.; Zajac, G.; Kalemba, M.; Sołtys, E. The Estrogenic Status and the COMT Genotype of Female Blood Donors Influence the Protective Ability of the Mediterranean Plant Extracts against the Hydrogen Peroxide-Induced DNA Damage in Lymphocytes. J. Physiol. Pharmacol. 2005, 56 (Suppl. S1), 199–217. [Google Scholar]
- Timpson, N.J.; Forouhi, N.G.; Brion, M.J.; Harbord, R.M.; Cook, D.G.; Johnson, P.; McConnachie, A.; Morris, R.W.; Rodriguez, S.; Luan, J.; et al. Genetic Variation at the SLC23A1 Locus Is Associated with Circulating Concentrations of L-Ascorbic Acid (Vitamin C): Evidence from 5 Independent Studies with >15,000 Participants. Am. J. Clin. Nutr. 2010, 92, 375–382. [Google Scholar] [CrossRef]
- Shin, D.; Lee, K.W. Fruit and Vegetable Consumption Interacts with HNF1A Variants on the C-Reactive Protein. Front. Nutr. 2022, 9, 900867. [Google Scholar] [CrossRef]
- Reding, K.W.; Weiss, N.S.; Chen, C.; Li, C.I.; Carlson, C.S.; Wilkerson, H.W.; Farin, F.M.; Thummel, K.E.; Daling, J.R.; Malone, K.E. Genetic Polymorphisms in the Catechol Estrogen Metabolism Pathway and Breast Cancer Risk. Cancer Epidemiol. Biomark. Prev. 2009, 18, 1461–1467. [Google Scholar] [CrossRef]
- Reddy, P.; Naidoo, R.N.; Robins, T.G.; Mentz, G.; London, S.J.; Li, H.; Naidoo, R. GSTM1, GSTP1, and NQO1 Polymorphisms and Susceptibility to Atopy and Airway Hyperresponsiveness among South African Schoolchildren. Lung 2010, 188, 409–414. [Google Scholar] [CrossRef]
- DbSNP. Available online: https://www.ncbi.nlm.nih.gov/snp/ (accessed on 15 January 2023).
- Nakanishi, G.; Pita-Oliveira, M.; Bertagnolli, L.S.; Torres-Loureiro, S.; Scudeler, M.M.; Cirino, H.S.; Chaves, M.L.; Miwa, B.; Rodrigues-Soares, F. Worldwide Systematic Review of GSTM1 and GSTT1 Null Genotypes by Continent, Ethnicity, and Therapeutic Area. OMICS 2022, 26, 528–541. [Google Scholar] [CrossRef]
- DeBenedictis, J.N.; Murrell, C.; Hauser, D.; van Herwijnen, M.; Elen, B.; de Kok, T.M.; van Breda, S.G. Effects of Different Combinations of Phytochemical-Rich Fruits and Vegetables on Chronic Disease Risk Markers and Gene Expression Changes: Insights from the MiBLEND Study, a Randomized Trial. Antioxidants 2024, 13, 915. [Google Scholar] [CrossRef]
- Latruffe, N.; Menzel, M.; Delmas, D.; Buchet, R.; Lançon, A. Compared Binding Properties between Resveratrol and Other Polyphenols to Plasmatic Albumin: Consequences for the Health Protecting Effect of Dietary Plant Microcomponents. Molecules 2014, 19, 17066–17077. [Google Scholar] [CrossRef]
- Qiao, Y.; Zhou, L.; Qu, Y.; Lu, K.; Han, F.; Li, E.; Liu, B.; Song, C.; Sun, C.; Qiao, Y.; et al. Effects of Different Dietary β-Glucan Levels on Antioxidant Capacity and Immunity, Gut Microbiota and Transcriptome Responses of White Shrimp (Litopenaeus vannamei) under Low Salinity. Antioxidants 2022, 11, 2282. [Google Scholar] [CrossRef]
- Kopiasz, Ł.; Dziendzikowska, K.; Gajewska, M.; Wilczak, J.; Harasym, J.; Zyła, E.; Kamola, D.; Oczkowski, M.; Królikowski, T.; Gromadzka-Ostrowska, J. Time-Dependent Indirect Antioxidative Effects of Oat Beta-Glucans on Peripheral Blood Parameters in the Animal Model of Colon Inflammation. Antioxidants 2020, 9, 375. [Google Scholar] [CrossRef]
- Lizárraga, D.; Gómez-Gil, B.; García-Gasca, T.; Ávalos-Soriano, A.; Casarini, L.; Salazar-Oroz, A.; García-Gasca, A.; Rafael Buelna Jesús Kumate, A. Gestational Diabetes Mellitus: Genetic Factors, Epigenetic Alterations, and Microbial Composition. Acta Diabetol. 2024, 61, 1–17. [Google Scholar] [CrossRef] [PubMed]
- Miyachi, Y.; Miyazawa, T.; Ogawa, Y. HNF1A Mutations and Beta Cell Dysfunction in Diabetes. Int. J. Mol. Sci. 2022, 23, 3222. [Google Scholar] [CrossRef] [PubMed]
- Kolb, H.; Kempf, K.; Röhling, M.; Martin, S. Insulin: Too Much of a Good Thing Is Bad. BMC Med. 2020, 18, 224. [Google Scholar] [CrossRef] [PubMed]


| Dietary Intervention | Overrepresented Phytochemicals | Fruits and Vegetables |
|---|---|---|
| F&V Blend | Total polyphenols Anthocyanins Carotenoids Diallyl sulfide Glucosinolates | 100 g apples, green tea polyphenols (0.5 g green tea in 25 mL water), 25 g blueberries, 25 g blue grape, 25 g blackberries, 25 g raspberries, 33 g tomato, 33 g carrots, 33 g sweet red pepper, 33 g broccoli, 33 g cauliflower, 33 g Brussels sprouts |
| Uncoated Pearls | Lacks significant concentrations of phytochemicals—mostly starch + minor beta glucan soluble fiber | 95 g rice flour + 5 g oat flour |
| Coated Pearls | Total polyphenols Anthocyanins Carotenoids Diallyl sulfide Glycosylates | 100 g apples, green tea polyphenols (0.5 g green tea in 25 mL water), 25 g blueberries, 25 g blue grape, 25 g blackberries, 25 g raspberries, 33 g tomato, 33 g carrots, 33 g sweet red pepper, 33 g broccoli, 33 g cauliflower, 33 g Brussels sprouts 95 g rice flour + 5 g oat flour |
| SNP Name | Full Name | Wildtype | Variation | Amino Acid Change | dbSNP ID | Expected Frequencies (%) 1 | Experimental Frequencies (%) 1 | ||||
|---|---|---|---|---|---|---|---|---|---|---|---|
| Wt | Hz | Hm | Wt (n) | Hz (n) | Hm (n) | ||||||
| GSTM1*0 | Glutathione s-transferase mu 1 | Present | Deletion | Deletion | - | 51.1 | - | 48.9 | 32.9 (27) | - | 67.9 (55) |
| NQO1*2 | NAD(P)H quinone dehydrogenase 1 | GG | G > A/G > C | p.R139W, p.R139G | rs1800566 | 63 | 33 | 4 | 92.6 (75) | - | 7.4 (6) |
| CAT1*1 | Catalase 1 | CC | C > G/C > T | N/A | rs1001179 | 62.7 | 33 | 4.3 | 63.0 (51) | 33.3 (27) | 3.7 (3) |
| GSTT1*0 | Glutathione S-transferase T1 | Present | Deletion | Deletion | - | 73 | - | 27 | 91.4 (74) | - | 8.6 (7) |
| XRCC1*4 | X-ray repair cross-complementing protein 1 | TT | T > C/T > G | p.Q399R, p.Q399P | rs25487 | 11.8 | 45.1 | 43 | 7.4 (6) | 45.7 (37) | 46.9 (38) |
| ZBED3 | Zinc finger BED domain-containing protein 3 | GG | G > A/G > T | N/A | rs4457053 | 9.2 | 42.3 | 48.5 | 9.9 (8) | 35.8 (29) | 54.3 (44) |
| Glu298Asp | Endothelial nitric oxide synthase | TT | T > A/T > G | p.D298E | rs1799983 | 8.8 | 41.8 | 49.4 | 4.9 (4) | 40.7 (33) | 54.3 (44) |
| COMT | Catechol-O-Methyltransferase | GG | G > A | p.V158M | rs4680 | 26.3 | 50 | 23.7 | 39.5 (32) | 44.4 (36) | 16.0 (13) |
| SLC23A1 | Solute carrier family 23 member 1 | TT | T > A/T > C/T > G | N/A | rs10063949 | 38.8 | 47 | 14.2 | 32.1 (26) | 40.7 (33) | 27.2 (22) |
| MTHFR | Methylenetetrahydrofolate reductase | GG | G > A/G > C | p.A263V, p.A263G | rs1801133 | 44 | 44.7 | 11.3 | 35.8 (29) | 51.9 (42) | 12.3 (10) |
| HNF1A | Hepatocyte nuclear factor-1 alpha | AA | A > C/A > T | p.I27L, p.I27P | rs1169288 | 45.3 | 44 | 10.7 | 37.0 (30) | 53.1 (43) | 9.9 (8) |
| GSTP1 | Glutathione S-transferase pi 1 | AA | A > G/A > T | p.I105V, p.I105P | rs1695 | 45 | 44.2 | 10.8 | 43.2 (35) | 45.7 (37) | 11.1 (9) |
| TCF7L2 | Transcription factor 7-like 2 | CC | C > G/C > T | N/A | rs7903146 | 50.8 | 40.9 | 8.2 | 55.6 (45) | 39.5 (32) | 4.9 (4) |
| BCMO1 | Beta-carotene 15,15′-monooxygenase 1 | CC | C > T | p.A379V | rs7501331 | 61.7 | 33.7 | 4.6 | 74.1 (60) | 21.0 (17) | 4.9 (4) |
| APOC1 | Apolipoprotein C1 | AA | A > G | N/A | rs4420638 | 69.1 | 28 | 2.8 | 77.8 (63) | 21.0 (17) | 1.2 (1) |
| Gene | Forward Primer | Reverse Primer | Product Size (bp) * |
|---|---|---|---|
| β-globin | 5′-CAACTTCATCCACGTTCACC-3′ | 5′-GAAGAG CCAAGGACAGGTAC-3′ | 268 |
| GSTM1*0 | 5′-GAACTCCCTGAAAAGCTAA AGC-3′ | 5′-GTTGGGCTCAAATATACGGTGG-3′ | 215 |
| GSTT1*0 | 5′-TTCCTT ACTGGTCCTCACATCTC-3′ | 5′-TCACCGGATCATGGCCAGCA-3′ | 480 |
| Baseline | F&V Blend | Uncoated Pearl | Coated Pearl | |
|---|---|---|---|---|
| n | 82 | 41 | 20 | 21 |
| Age | 29 ± 1 | 28 ± 9 | 32 ± 13 | 29 ± 11 |
| Sex | 78% female | 88% female | 70% female | 71% female |
| BMI | 22.8 ± 0.2 | 22.6 ± 1.9 | 22.8 ± 2.2 | 23.3 ± 1.9 |
| Plasma Total Polyphenol | 255 ± 3.4 | 255 ± 4.1 | 250 ± 5.1 | 256 ± 5.0 |
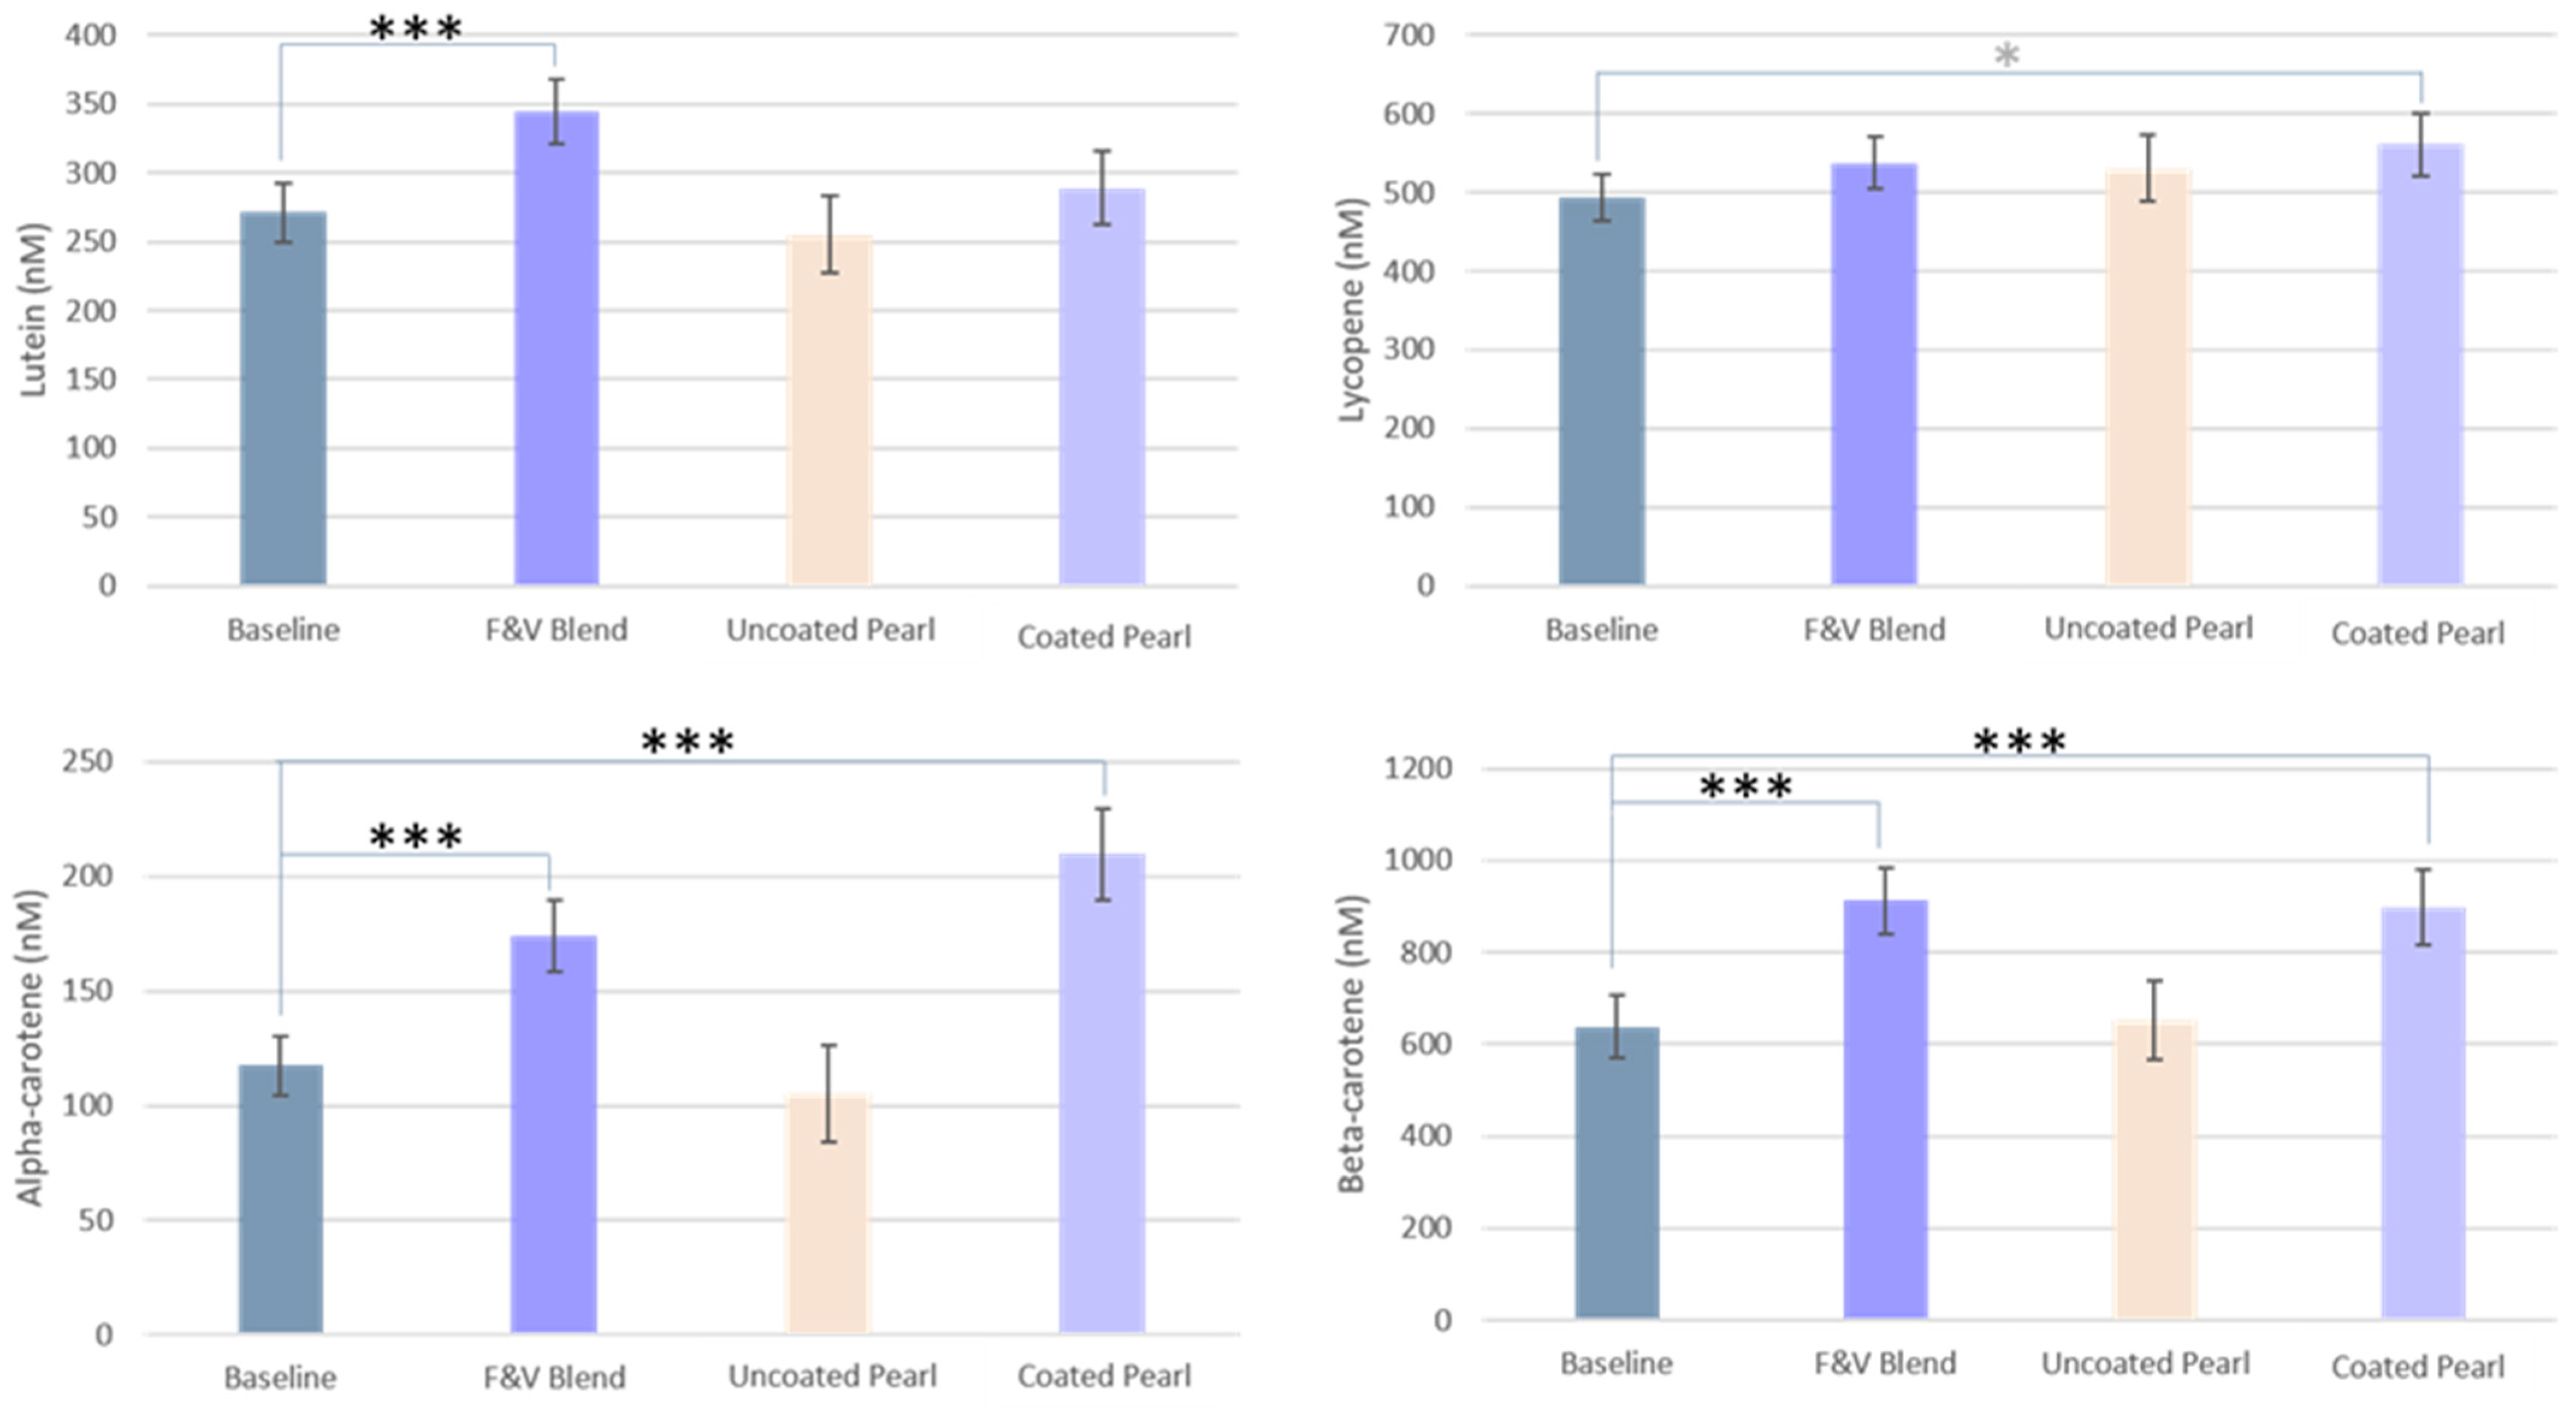
| Plasma Lutein (nM) | 271.0 ± 21.0 | 344.3 ± 23.3 *** | 255.3 ± 28.2 | 288.8 ± 26.9 |
| Plasma Lycopene (nM) | 493.3 ± 29.6 | 537.6 ± 33.6 | 530.9 ± 41.62 | 560.7 ± 39.5 * |
| Plasma Alpha-carotene (nM) | 117.5 ± 12.9 | 174.0 ± 15.8 *** | 105.3 ± 21.3 | 209.7 ± 19.9 *** |
| Plasma Beta-carotene (nM) | 637.4 ± 68.1 | 912.4 ± 73.1 *** | 652.5 ± 84.0 | 898.4 ± 81.1 *** |
| Urinary Vitamin C (mg/mL) | 0.77 ± 0.07 | 0.79 ± 0.09 | 0.73 ± 0.11 | 0.72 ± 0.11 |
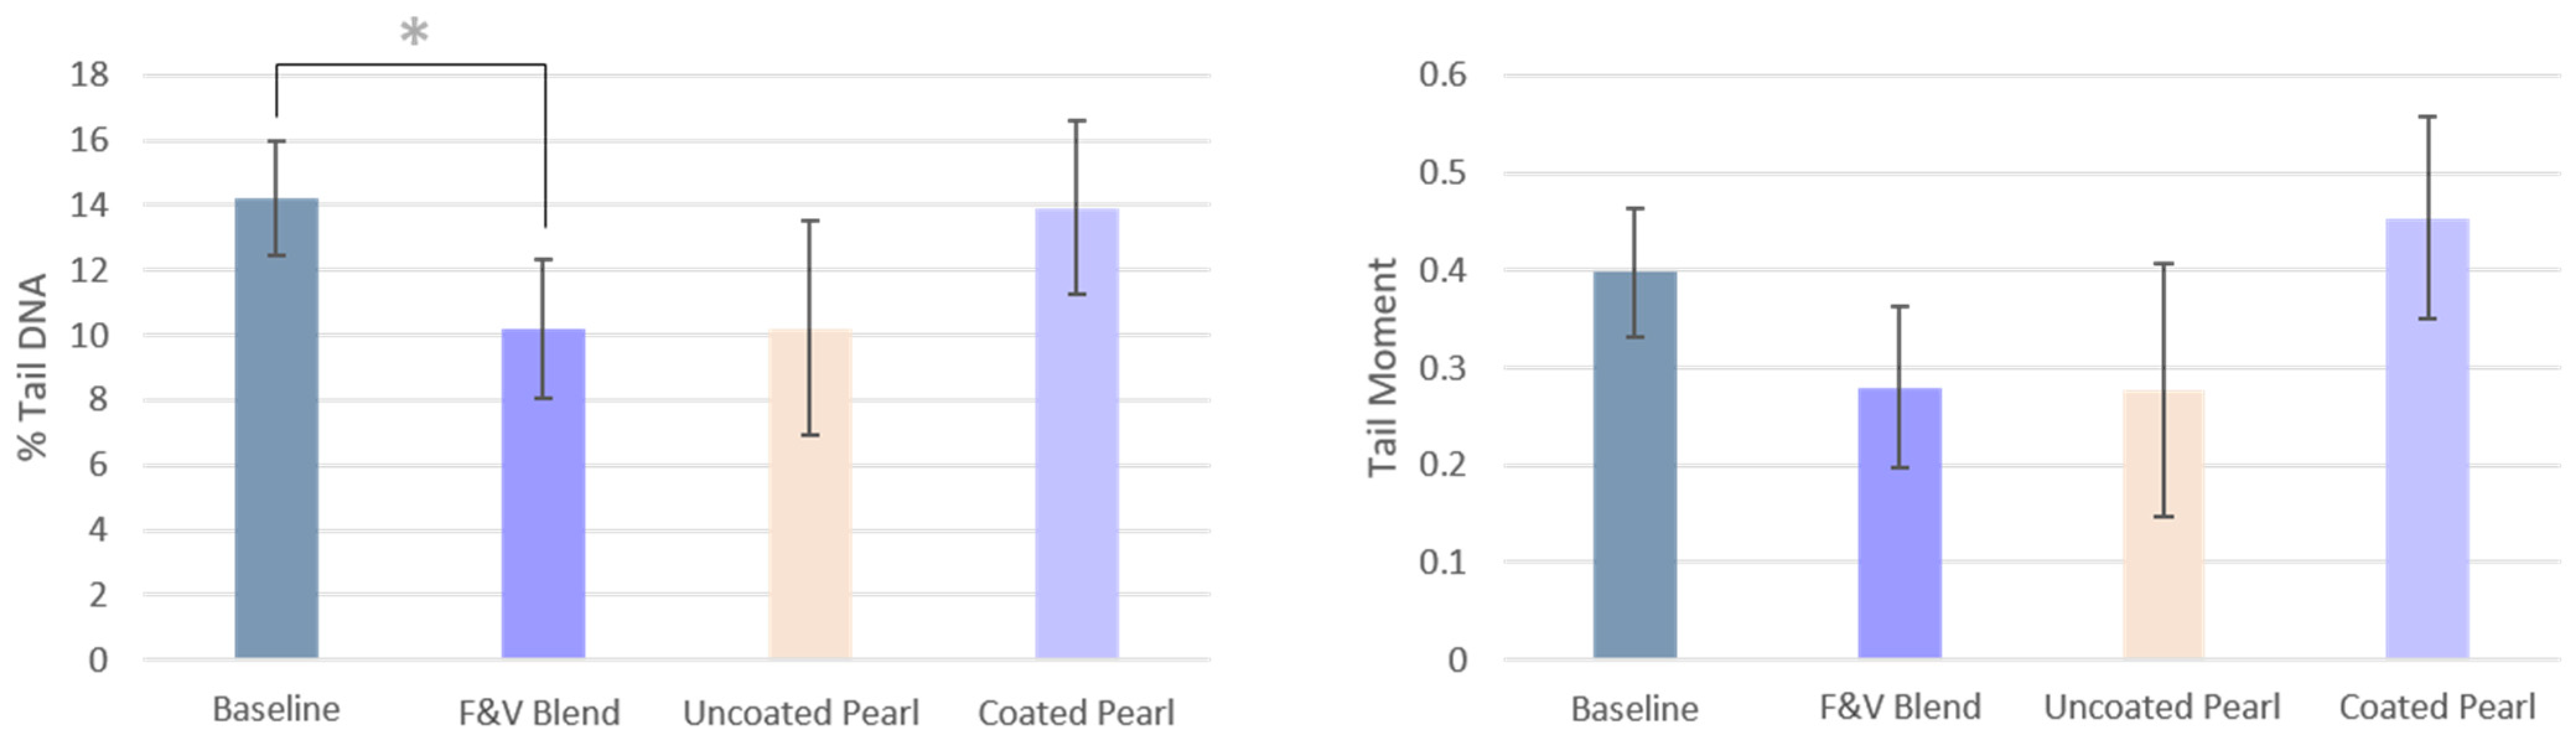
| % Tail DNA | 14.23 ± 1.76 | 10.17 ± 2.14 * | 10.20 ± 3.3 | 13.91 ± 2.67 |
| Tail Moment | 0.40 ± 0.066 | 0.28 ± 0.082 | 0.28 ± 0.13 | 0.45 ± 0.10 |
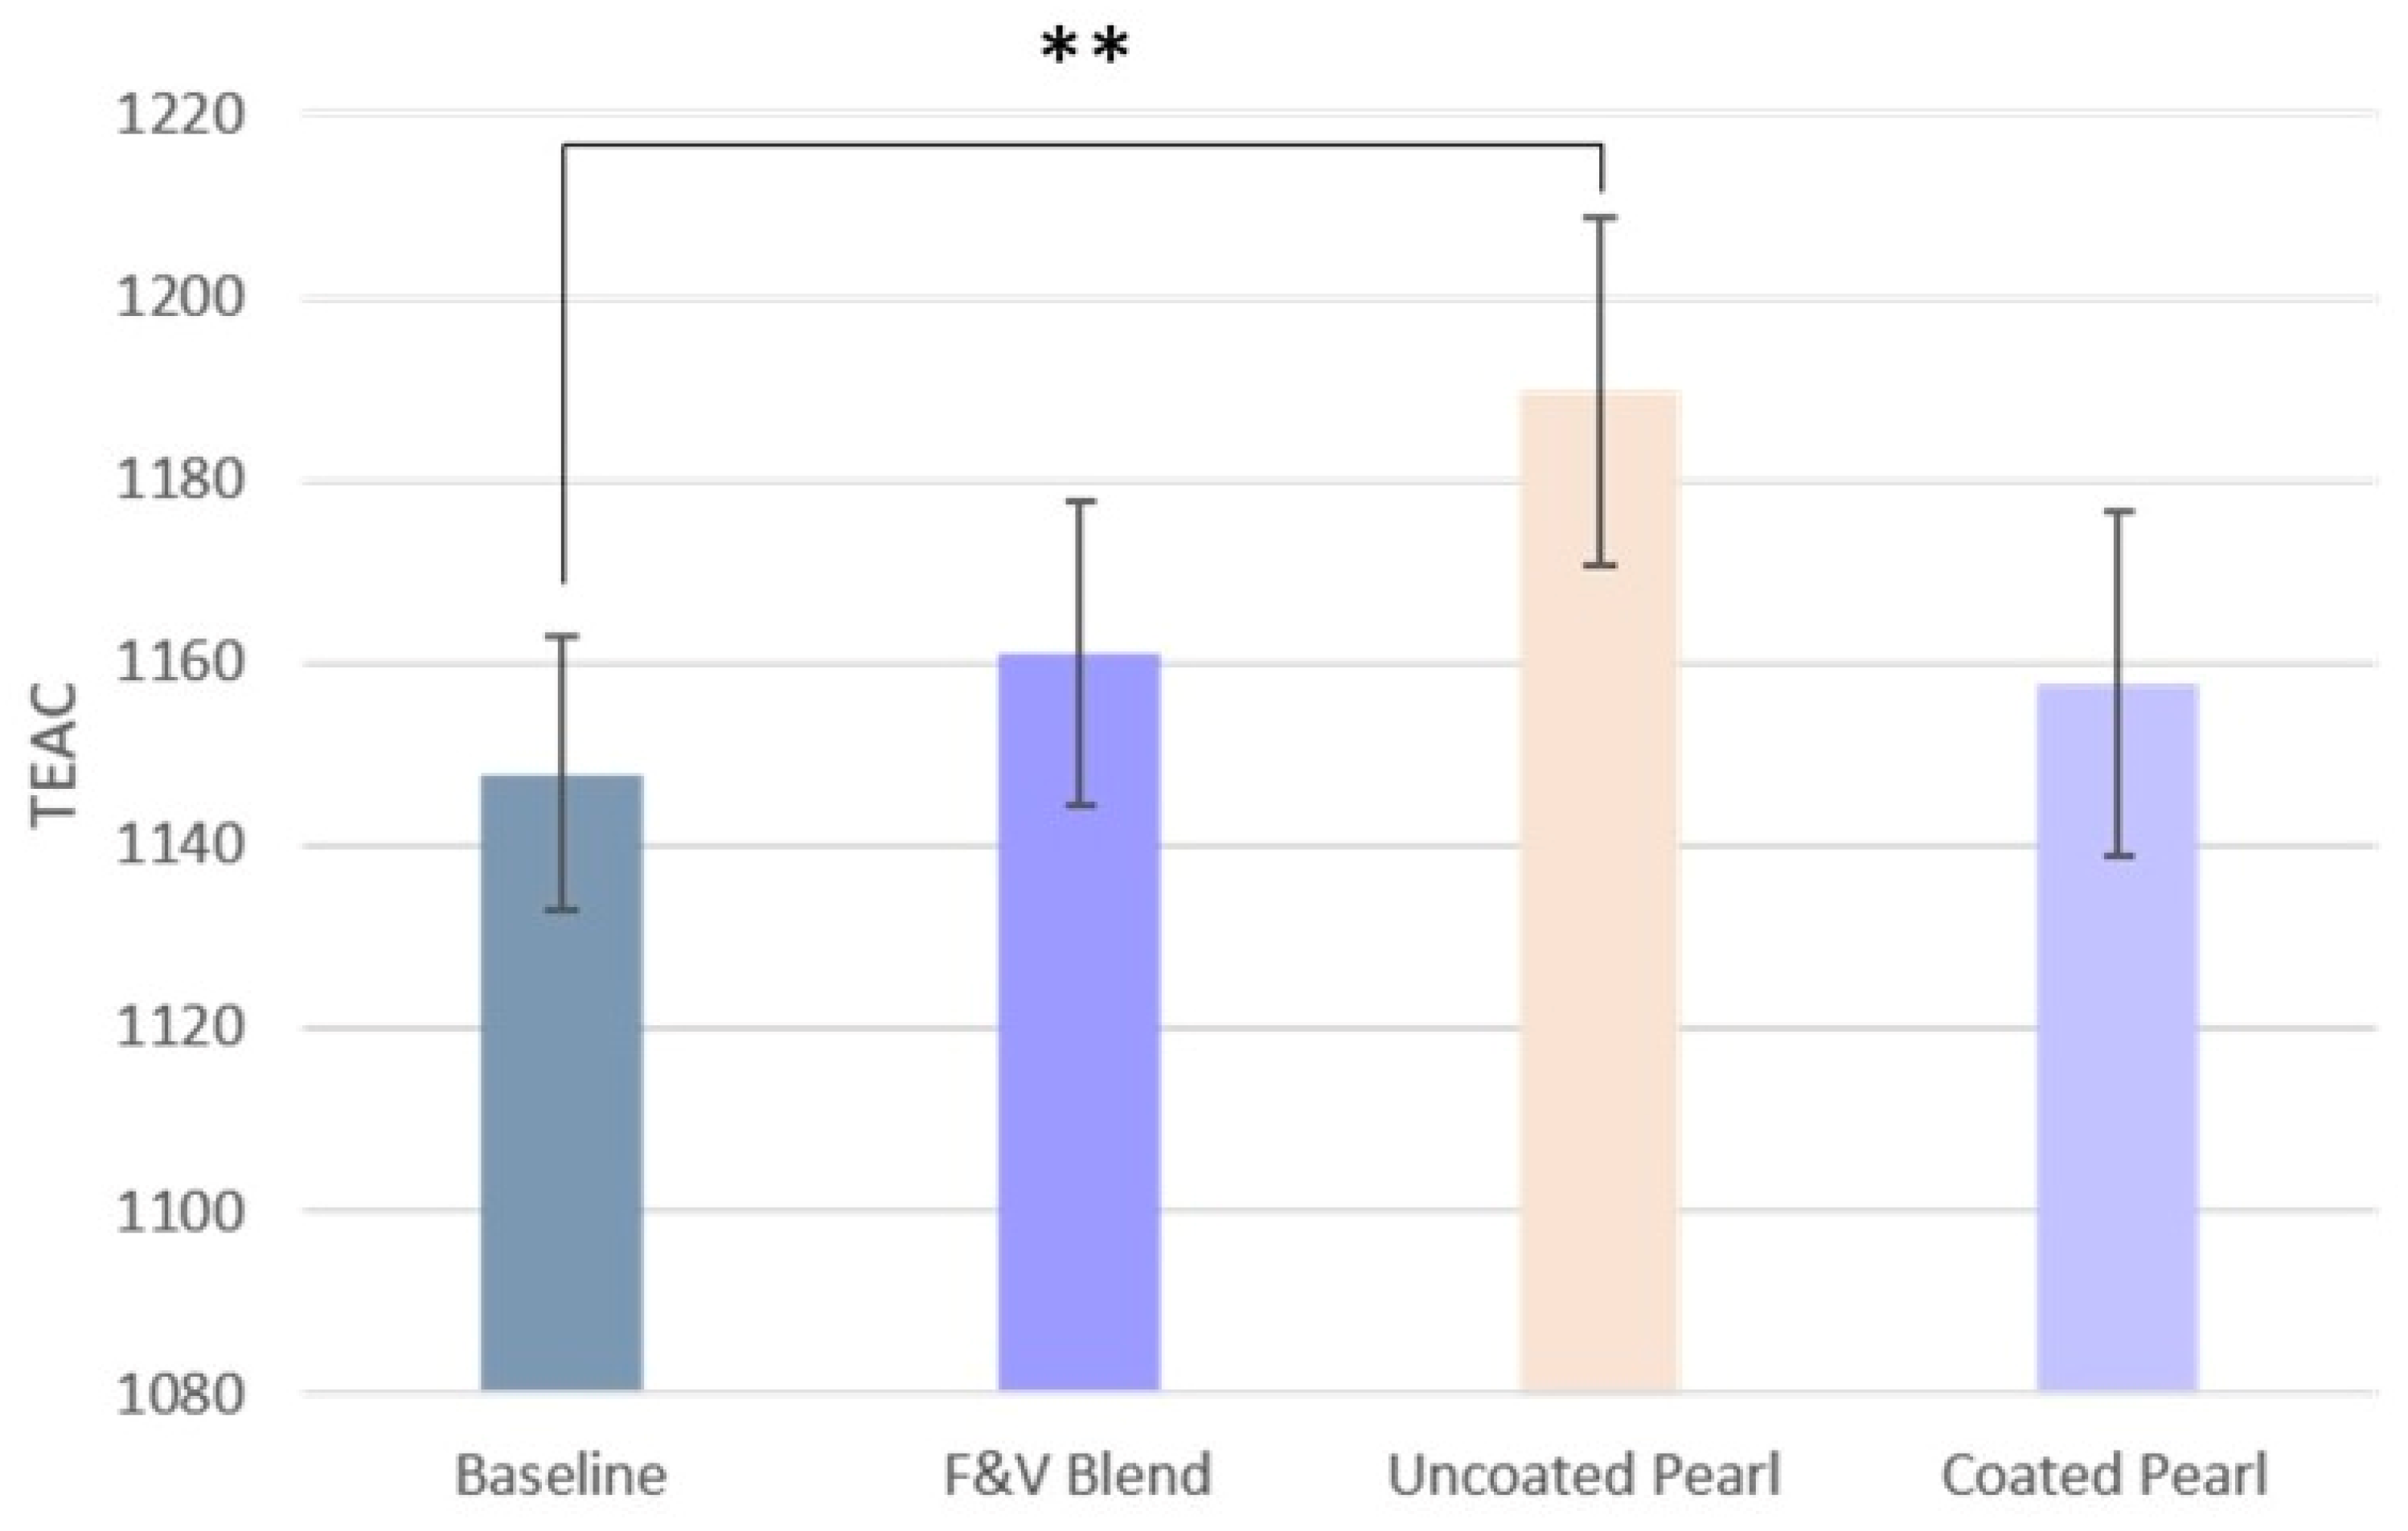
| TEAC levels | 1148 ± 2 | 1161 ± 3 | 1190 ± 4 ** | 1158 ± 4 |
| Superoxide anion height | 3259 ± 27 | 3735 ± 45 | 2858 ± 83 | 3186 ± 80 |
| Superoxide anion area | 1,217,296 ± 10,095 | 1,216,606 ± 16,626 | 1,019,482 ± 28,842 | 1,167,825 ± 27,612 |
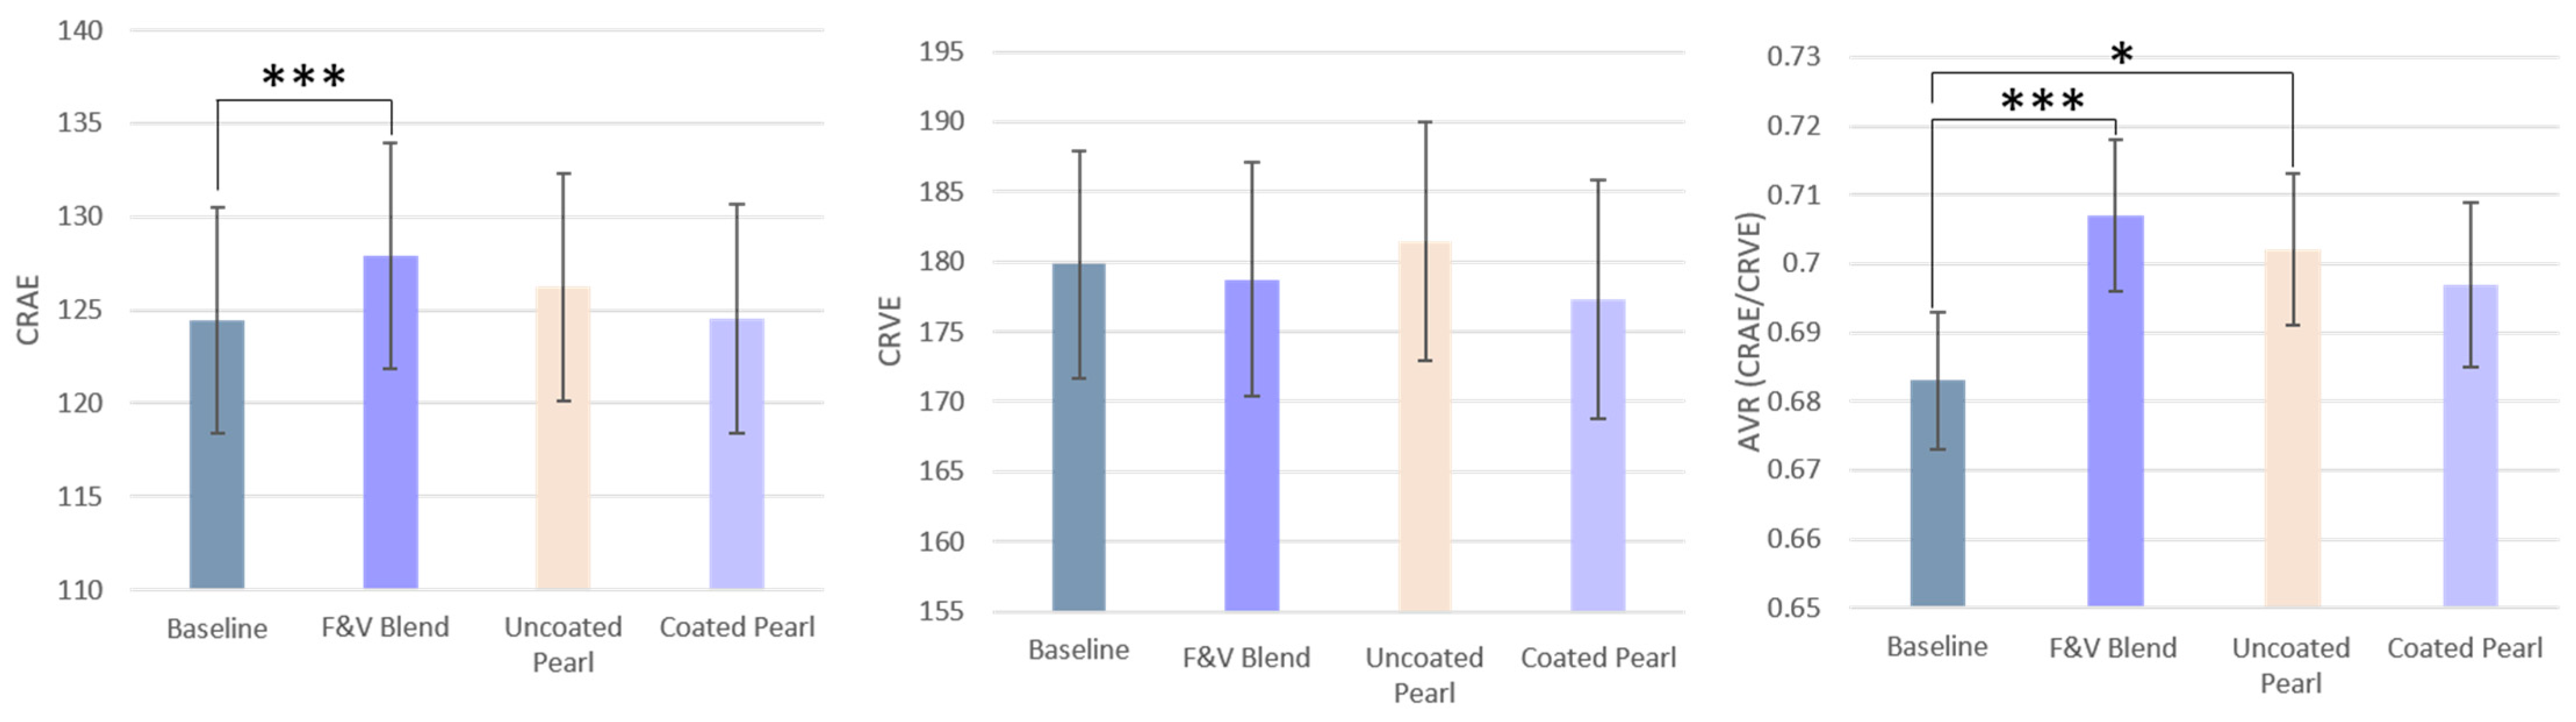
| CRAE | 119.96 ± 4.61 | 125.05 ± 4.66 *** | 122.74 ± 4.75 | 121.34 ± 4.74 |
| CRVE | 172.17 ± 5.45 | 174.73 ± 5.68 | 175.88 ± 6.04 | 173.37 ± 6.0 |
| AVR | 0.68 ± 0.01 | 0.71 ± 0.1 *** | 0.70 ± 0.01 * | 0.70 ± 0.01 |
| Calories (kcal) | 1755 ± 58 | 1835 ± 64 | 1945 ± 76 * | 1969 ± 77 * |
| Carbohydrates (g) [% of kcal] | 211 ± 12 [48%] | 220 ± 14 [48%] | 243 ± 18 [50%] | 238 ± 18 [48%] |
| Proteins (g) [% of kcal] | 83 ± 4 [19%] | 85 ± 4 [19%] | 84 ± 5 [17%] | 96 ± 5 * [19%] |
| Fats (g) [% of kcal] | 68 ± 4 [35%] | 66 ± 4 [32%] | 60 ± 5 [28%] | 66 ± 5 [30%] |
| Cholesterol (mg) | 139 ± 24 | 151 ± 27 | 162 ± 31 | 146 ± 32 |
| Sodium (mg) | 842 ± 117 | 889 ± 129 | 789 ± 150 | 667 ± 152 |
| Sugars (g) | 43 ± 4 | 59 ± 4 *** | 47 ± 5 | 44 ± 5 |
| Fibers (g) | 12 ± 1 | 22 ± 1 *** | 11 ± 1 | 13 ± 1 |
| SNP Name | F&V Blend | Uncoated Pearl | Coated Pearl | ||||||
|---|---|---|---|---|---|---|---|---|---|
| Wt (n) | Hz (n) | Hm (n) | Wt (n) | Hz (n) | Hm (n) | Wt (n) | Hz (n) | Hm (n) | |
| GSTM1*0 | 13 | - | 28 | 9 | - | 11 | 5 | - | 16 |
| NQO1*2 | 40 | - | 1 | 17 | 3 | 18 | 2 | ||
| CAT1*1 | 25 | 15 | 1 | 12 | 8 | - | 14 | 4 | 2 |
| GSTT1*0 | 39 | - | 2 | 18 | - | 2 | 17 | - | 3 |
| XRCC1*4 | 5 | 18 | 18 | - | 11 | 9 | 1 | 8 | 11 |
| ZBED3 | 4 | 14 | 23 | 2 | 8 | 10 | 2 | 7 | 11 |
| Glu298Asp | 2 | 19 | 20 | - | 6 | 14 | 2 | 8 | 10 |
| COMT | 18 | 17 | 6 | 6 | 11 | 3 | 8 | 8 | 4 |
| SLC23A1 | 15 | 21 | 5 | 8 | 5 | 7 | 3 | 7 | 10 |
| MTHFR | 19 | 17 | 5 | 4 | 13 | 3 | 6 | 12 | 2 |
| HNF1A | 17 | 23 | 1 | 5 | 12 | 3 | 8 | 8 | 4 |
| GSTP1 | 19 | 18 | 4 | 6 | 11 | 3 | 10 | 8 | 2 |
| TCF7L2 | 25 | 14 | 2 | 8 | 11 | 1 | 12 | 7 | 1 |
| BCMO1 | 32 | 8 | 1 | 15 | 3 | 2 | 13 | 6 | 1 |
| APOC1 | 34 | 6 | 1 | 14 | 6 | - | 15 | 5 | - |
Disclaimer/Publisher’s Note: The statements, opinions and data contained in all publications are solely those of the individual author(s) and contributor(s) and not of MDPI and/or the editor(s). MDPI and/or the editor(s) disclaim responsibility for any injury to people or property resulting from any ideas, methods, instructions or products referred to in the content. |
© 2025 by the authors. Licensee MDPI, Basel, Switzerland. This article is an open access article distributed under the terms and conditions of the Creative Commons Attribution (CC BY) license (https://creativecommons.org/licenses/by/4.0/).
Share and Cite
DeBenedictis, J.N.; Xu, N.; de Kok, T.M.; van Breda, S.G. The Role of Genetic Variation in Modulating the Effects of Blended Fruits and Vegetables Versus Fruit- and Vegetable-Coated Food Products on Antioxidant Capacity, DNA Protection, and Vascular Health: A Randomized Controlled Trial. Nutrients 2025, 17, 2036. https://doi.org/10.3390/nu17122036
DeBenedictis JN, Xu N, de Kok TM, van Breda SG. The Role of Genetic Variation in Modulating the Effects of Blended Fruits and Vegetables Versus Fruit- and Vegetable-Coated Food Products on Antioxidant Capacity, DNA Protection, and Vascular Health: A Randomized Controlled Trial. Nutrients. 2025; 17(12):2036. https://doi.org/10.3390/nu17122036
Chicago/Turabian StyleDeBenedictis, Julia N., Na Xu, Theo M. de Kok, and Simone G. van Breda. 2025. "The Role of Genetic Variation in Modulating the Effects of Blended Fruits and Vegetables Versus Fruit- and Vegetable-Coated Food Products on Antioxidant Capacity, DNA Protection, and Vascular Health: A Randomized Controlled Trial" Nutrients 17, no. 12: 2036. https://doi.org/10.3390/nu17122036
APA StyleDeBenedictis, J. N., Xu, N., de Kok, T. M., & van Breda, S. G. (2025). The Role of Genetic Variation in Modulating the Effects of Blended Fruits and Vegetables Versus Fruit- and Vegetable-Coated Food Products on Antioxidant Capacity, DNA Protection, and Vascular Health: A Randomized Controlled Trial. Nutrients, 17(12), 2036. https://doi.org/10.3390/nu17122036