
Liver Fibrosis Is Positively and Independently Associated with Leptin Circulating Levels in Individuals That Are Overweight and Obese: A FibroScan-Based Cross-Sectional Study

 , , ,
, , ,  , , ,
, , ,  , , , ,
  and
and
Abstract
1. Introduction
2. Materials and Methods
2.1. Study Design and Population
2.2. Anthropometric Parameters
2.3. Assessment of Liver Steatosis and Fibrosis
2.4. Laboratory Tests and Lifestyle Assessments
2.5. Study Outcomes
2.6. Variables of Exposure and Confounders
2.7. Statistical Analyses
3. Results
4. Discussion
Strengths and Limitations
5. Conclusions
Author Contributions
Funding
Institutional Review Board Statement
Informed Consent Statement
Data Availability Statement
Acknowledgments
Conflicts of Interest
Abbreviations
| MASLD | Metabolic Dysfunction-Associated Steatotic Liver Disease |
| CVD | Cardiovascular Diseases |
| BMI | Body Mass Index |
| WC | Waist Circumference |
| CAP | Controlled Attenuation Parameter |
| LSM | Liver Stiffness Measurement |
| FSG | Fasting Serum Glucose |
| LDL-C | Low-Density Lipoprotein Cholesterol |
| HDL-C | High-Density Lipoprotein Cholesterol |
| AST | Aspartate-Amino Transferase |
| ALT | Alanine-Amino Transferase |
| γGT | Gamma Glutaminyl-Transferase |
| HbA1c | Glycated Hemoglobin |
| HOMA-IR | Homeostasis Model Assessment of Insulin Resistance |
| IPAQ | International Physical Activity Questionnaire |
References
- European Association for the Study of the Liver (EASL); European Association for the Study of Diabetes (EASD); European Association for the Study of Obesity (EASO). EASL–EASD–EASO Clinical Practice Guidelines on the management of MASLD. J. Hepatol. 2024, 81, 492–542. [Google Scholar] [CrossRef] [PubMed]
- Ciardullo, S.; Carbone, M.; Invernizzi, P.; Perseghin, G. Exploring the Landscape of Steatotic Liver Disease in the General US Population. Liver Int. 2023, 43, 2425–2433. [Google Scholar] [CrossRef]
- Kalligeros, M.; Vassilopoulos, A.; Vassilopoulos, S.; Victor, D.W.; Mylonakis, E.; Noureddin, M. Prevalence of Steatotic Liver Disease (MASLD, MetALD, and ALD) in the United States: NHANES 2017–2020. Clin. Gastroenterol. Hepatol. 2023, 22, 1330–1332.e4. [Google Scholar] [CrossRef]
- Targher, G.; Byrne, C.D. MASLD and increased risk of cardiovascular events. Nat. Rev. Cardiol. 2021, 18, 593–604. [Google Scholar]
- Dulai, P.S.; Singh, S.; Patel, J.; Soni, M.; Prokop, L.J.; Younossi, Z.; Sebastiani, G.; Ekstedt, M.; Hagstrom, H.; Nasr, P.; et al. Increased risk of mortality by fibrosis stage in NAFLD: Systematic review and meta-analysis. Hepatology 2017, 65, 1557–1565. [Google Scholar] [CrossRef]
- Eddowes, P.J.; Sasso, M.; Allison, M.; Tsochatzis, E.; Anstee, Q.M.; Sheridan, D.; Guha, I.N.; Cobbold, J.F.; Deeks, J.J.; Paradis, V.; et al. Accuracy of FibroScan Controlled Attenuation Parameter and Liver Stiffness Measurement in Assessing Steatosis and Fibrosis in Patients With Nonalcoholic Fatty Liver Disease. Gastroenterology 2019, 156, 1717–1730. [Google Scholar] [CrossRef] [PubMed]
- Chatterjee, S.; Ganini, D.; Tokar, E.J.; Kumar, A.; Das, S.; Corbett, J.; Kadiiska, M.B.; Waalkes, M.P.; Diehl, A.M.; Mason, R.P. Leptin is key to peroxynitrite-mediated oxidative stress and Kupffer cell activation in experimental non-alcoholic steatohepatitis. J. Hepatol. 2013, 58, 778–784. [Google Scholar] [CrossRef] [PubMed]
- Wang, J.; Leclercq, I.; Brymora, J.M.; Xu, N.; Ramezani-Moghadam, M.; London, R.M.; Brigstock, D.; George, J. Kupffer cells mediate leptin-induced liver fibrosis. Gastroenterology 2009, 137, 713–723. [Google Scholar] [CrossRef]
- Polyzos, S.A.; Kountouras, J. Leptin in NAFLD: A friend or a foe? Hepatol. Res. 2016, 46, E95–E107. [Google Scholar]
- Nuttall, F.Q. Body Mass Index: Obesity, BMI, and Health: A Critical Review. Nutr. Today 2015, 50, 117–128. [Google Scholar] [CrossRef]
- Matthews, D.R.; Hosker, J.P.; Rudenski, A.S.; Naylor, B.A.; Treacher, D.F.; Turner, R.C. Homeostasis model assessment: Insulin resistance and beta-cell function from fasting plasma glucose and insulin concentrations in man. Diabetologia 1985, 28, 412–419. [Google Scholar] [CrossRef] [PubMed]
- Craig, C.L.; Marshall, A.L.; Sjöström, M.; Bauman, A.E.; Booth, M.L.; Ainsworth, B.E.; Pratt, M.; Ekelund, U.; Yngve, A.; Sallis, J.F.; et al. International physical activity questionnaire: 12-country reliability and validity. Med. Sci. Sports Exerc. 2003, 35, 1381–1395. [Google Scholar] [CrossRef] [PubMed]
- Berzigotti, A.; Tsochatzis, E.; Boursier, J.; Castera, L.; Cazzagon, N.; Friedrich-Rust, M.; Petta, S.; Thiele, M.; European Association for the Study of the Liver. EASL Clinical Practice Guidelines on non-invasive tests for evaluation of liver disease severity and prognosis—2021 update. J. Hepatol. 2021, 75, 659–689. [Google Scholar] [CrossRef]
- Expert Panel on Liver Stiffness Measurement. Clinical Application of Transient Elastography in the Diagnosis of Liver Fibrosis: An Expert Panel Review and Opinion. J. Clin. Transl. Hepatol. 2014, 2, 110–116. [Google Scholar] [CrossRef]
- Wang, X. Firth logistic regression for rare variant association tests. Front. Genet. 2014, 5, 187. [Google Scholar] [CrossRef]
- Crespi, C.M. Power and Sample Size in R; Chapman & Hall: Boca Raton, FL, USA, 2020; ISBN 9781138591622. [Google Scholar]
- Hoening, J.M.; Heisey, D.M. The Abuse of Power: The Pervasive Fallacy of Power Calculations for Data Analysis. Am. Stat. 2001, 55, 19–24. [Google Scholar] [CrossRef]
- Shoukri, M.M. Analysis of Correlated Data with SAS and R, 4th ed.Chapman and Hall/CRC: London, UK, 2018. [Google Scholar] [CrossRef]
- Cohen, J. Statistical Power Analysis for the Behavioral Sciences, 2nd ed.; Academic Press: New York, NY, USA, 1988. [Google Scholar]
- Cohen, J. Things I have learned (so far). Am. Psychol. 1990, 45, 1304–1312. [Google Scholar] [CrossRef]
- Stekhoven, D.J. MissForest: Nonparametric Missing Value Imputation Using Random Forest, R Package Version 1.5. Available online: https://CRAN.R-project.org/package=missForest (accessed on 8 April 2025).
- Stekhoven, D.J.; Buehlmann, P. MissForest—Non-parametric missing value imputation for mixed-type data. Bioinformatics 2012, 28, 112–118. [Google Scholar] [CrossRef]
- Harrison, E.; Drake, T.; Pius, R. Finalfit: Quickly Create Elegant Regression Results Tables and Plots when Modelling. R Package Version 1.0.8. 2024. Available online: https://CRAN.R-project.org/package=finalfit (accessed on 8 April 2025).
- Wickham, H. ggplot2: Elegant Graphics for Data Analysis; Springer: New York, NY, USA, 2016. [Google Scholar]
- Harrell, J.R.; Hmisc: Harrell Miscellaneous. R Package Version 5.2-0. 2024. Available online: https://CRAN.R-project.org/package=Hmisc (accessed on 8 April 2025).
- Kosmidis, I.; Brglm: Bias Reduction in Binary-Response Generalized Linear Models. R Package Version 0.7.2. 2021. Available online: https://cran.r-project.org/package=brglm (accessed on 8 April 2025).
- Kosmidis, I.; Firth, D. Jeffreys-prior penalty, finiteness and shrinkage in binomial-response generalized linear models. Biometirka 2021, 108, 71–82. [Google Scholar] [CrossRef]
- Champely, S.; Pwr: Basic Functions for Power Analysis. R Package Version 1.3-0. 2020. Available online: https://CRAN.R-project.org/package=pwr (accessed on 8 April 2025).
- R Core Team. A Language and Environment for Statistical Computing. R Foundation for Statistical Computing; R Core Team: Vienna, Austria, 2024; Available online: https://www.R-project.org/ (accessed on 26 September 2024).
- Tilg, H.; Moschen, A.R. Evolution of inflammation in nonalcoholic fatty liver disease: The multiple parallel hits hypothesis. Hepatology 2010, 52, 1836–1846. [Google Scholar] [CrossRef]
- Marra, F. Leptin and liver fibrosis: A matter of fat. Gastroenterology 2002, 122, 1529–1532. [Google Scholar] [CrossRef] [PubMed]
- Saxena, N.K.; Yang, Y.; Floyd, J.; Anania, F.A. Leptin promotes the development of hepatic fibrosis in a rodent model of nonalcoholic steatohepatitis. Hepatology 2004, 40, 1237–1245. [Google Scholar]
- Saxena, N.K.; Ikeda, K.; Rockey, D.C.; Friedman, S.L.; Anania, F.A. Leptin in hepatic fibrosis: Evidence for increased collagen production in stellate cells and lean littermates of ob/ob mice. Hepatology 2002, 35, 762–771. [Google Scholar] [CrossRef]
- Stefanou, N.; Papanikolaou, V.; Furukawa, Y.; Nakamura, Y.; Tsezou, A. Leptin as a critical regulator of hepatocellular carcinoma development through modulation of human telomerase reverse transcriptase. BMC Cancer 2010, 10, 442. [Google Scholar] [CrossRef]
- Polyzos, S.A.; Aronis, K.N.; Kountouras, J.; Raptis, D.D.; Vasiloglou, M.F.; Mantzoros, C.S. Serum leptin in nonalcoholic fatty liver disease: A systematic review and meta-analysis. Diabetologia 2016, 59, 30–43. [Google Scholar] [CrossRef]
- Machado, M.V.; Cortez-Pinto, H. Insulin resistance and steatosis in chronic hepatitis C. Ann. Hepatol. 2009, 8 (Suppl. S1), S67–S75. [Google Scholar]
- Considine, R.V.; Sinha, M.K.; Heiman, M.L.; Kriauciunas, A.; Stephens, T.W.; Nyce, M.R.; Ohannesian, J.P.; Marco, C.C.; McKee, L.J.; Bauer, T.L.; et al. Serum immunoreactive-leptin concentrations in normal-weight and obese humans. N. Engl. J. Med. 1996, 334, 292–295. [Google Scholar] [CrossRef]
- Lisco, G.; Guido, D.; Cerabino, N.; Di Chito, M.; Donvito, R.; Bonfiglio, C.; Shahini, E.; Zappimbulso, M.; Randazzo, C.; Barletta, D.; et al. Liver steatosis is positively associated with plasminogen activator inhibitor-1 in apparently healthy individuals with overweight and obesity: A FibroScan-Based Cross-Sectional study. J. Transl. Med. 2025, 23, 487. [Google Scholar] [CrossRef]
- Friedman, S.L. Liver fibrosis—From bench to bedside. J. Hepatol. 2003, 38 (Suppl. S1), S38–S53. [Google Scholar] [CrossRef]

| Overall (n = 86) | |
|---|---|
| Ultrasonographic measures of liver steatosis and fibrosis * | |
| FibroScan CAP (dB/m) | 301.9 ± 64.2 |
| FibroScan LSM (kPa) | 6.87 ± 4.0 |
| Steatosis * (yes/no; n and %) | 63/23 (73.3%/26.7%) |
| Fibrosis * (yes/no; n and %) | 17/69 (19.8%/80.2%) |
| Variable of exposure | |
| Leptin (ng/mL) | 22.32 ± 14.12 |
| Hallmarks of glucose control and insulin resistance | |
| FSG (mg/dL) | 97.1 ± 12.3 |
| HbA1c (%) | 5.5 ± 0.5 |
| Fasting serum insulin (U/mL) | 19.2 ± 12.5 |
| HOMA-IR (score) | 4.7 ± 3.5 |
| Diabetes (yes/no) | 7/79 (8.1%/91.9%) |
| Demographic and lifestyle characteristics | |
| Age (yrs) | 41.7 ± 12.6 |
| Gender (male/female; n and %) | 35/51 (41%/59%) |
| Current smokers (yes/no; n and %) | 19/67 (22%/78%) |
| IPAQ (score) | 1809.3 ± 1566.9 |
| Anthropometric and clinical parameters | |
| BMI (kg/m2) | 36.7 ± 7.2 |
| Waist circumference (cm) | 114.5 ± 16.4 |
| Systolic blood pressure (mmHg) | 131.6± 12.52 |
| Diastolic blood pressure (mmHg) | 82.80± 10.24 |
| Laboratory tests | |
| Triglycerides (mg/dL) | 120.57± 71.67 |
| HDL cholesterol (mg/dL) | 51.53 ± 14.70 |
| LDL cholesterol (mg/dL) | 137.6 ± 33.01 |
| Total cholesterol (mg/dL) | 203.7 ± 41.13 |
| TSH (µmU/mL) | 1.96 ± 1.31 |
| FT3 (pg/mL) | 3.36 ± 0.40 |
| FT4 (ng/dL) | 10.92 ± 1.96 |
| 25-hydroxyvitamin D (ng/mL) | 19.95 ± 6.73 |
| Uric acid (mg/dL) | 5.35 ± 1.23 |
| Creatinine (mg/dL) | 0.80 ± 0.14 |
| AST (U/L) | 23.85 ± 13.14 |
| ALT (U/L) | 35.21 ± 28.76 |
| γGT (U/L) | 28.44 ± 19.34 |
| High-sensitive C-reactive protein (mg/dL) | 1.14 ± 5.75 |
| Ferritin (ng/mL) | 149.2 ± 163.84 |
| Adiponectin (u) | 0.00 ± 1 |
| RBP4 (μg/mL) | 29.71 ± 29.84 |
| Visfatin (ng/mL) | 2.15 ± 1.63 |
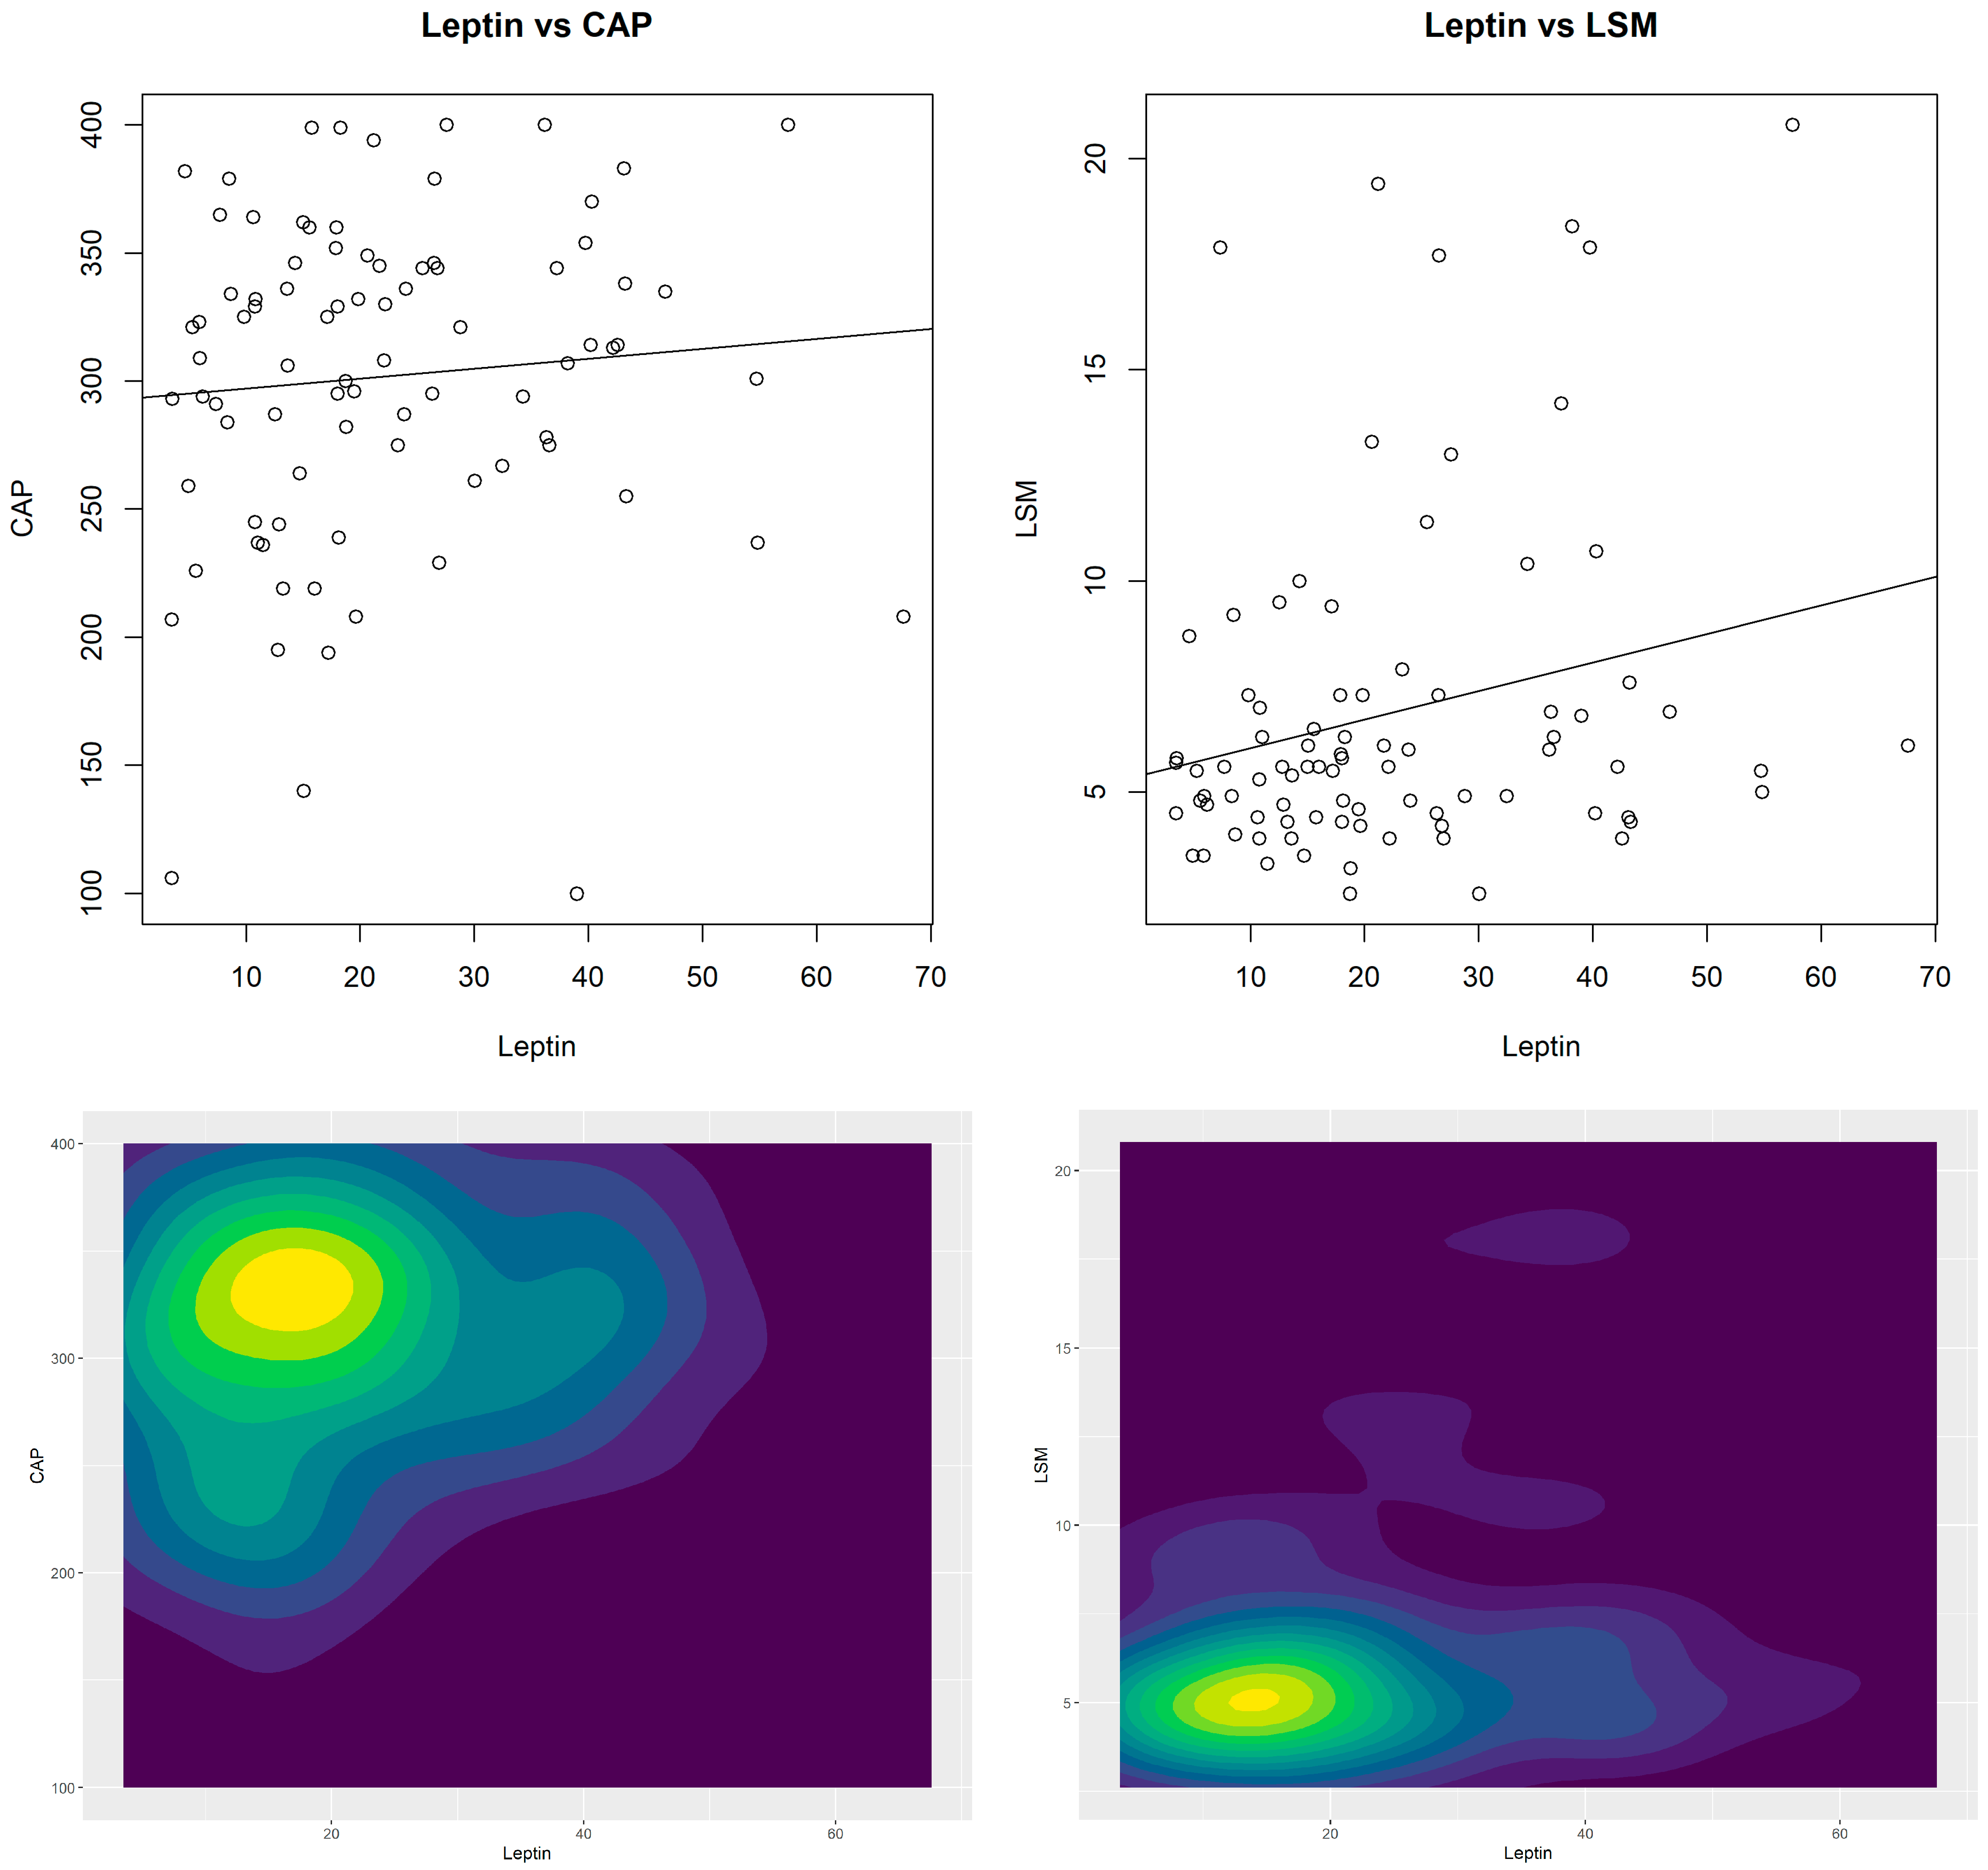
| CAP r (p-Value) | LSM r (p-Value) | Leptin r (p-Value) | |
|---|---|---|---|
| LSM | 0.36 (0.001) | - | - |
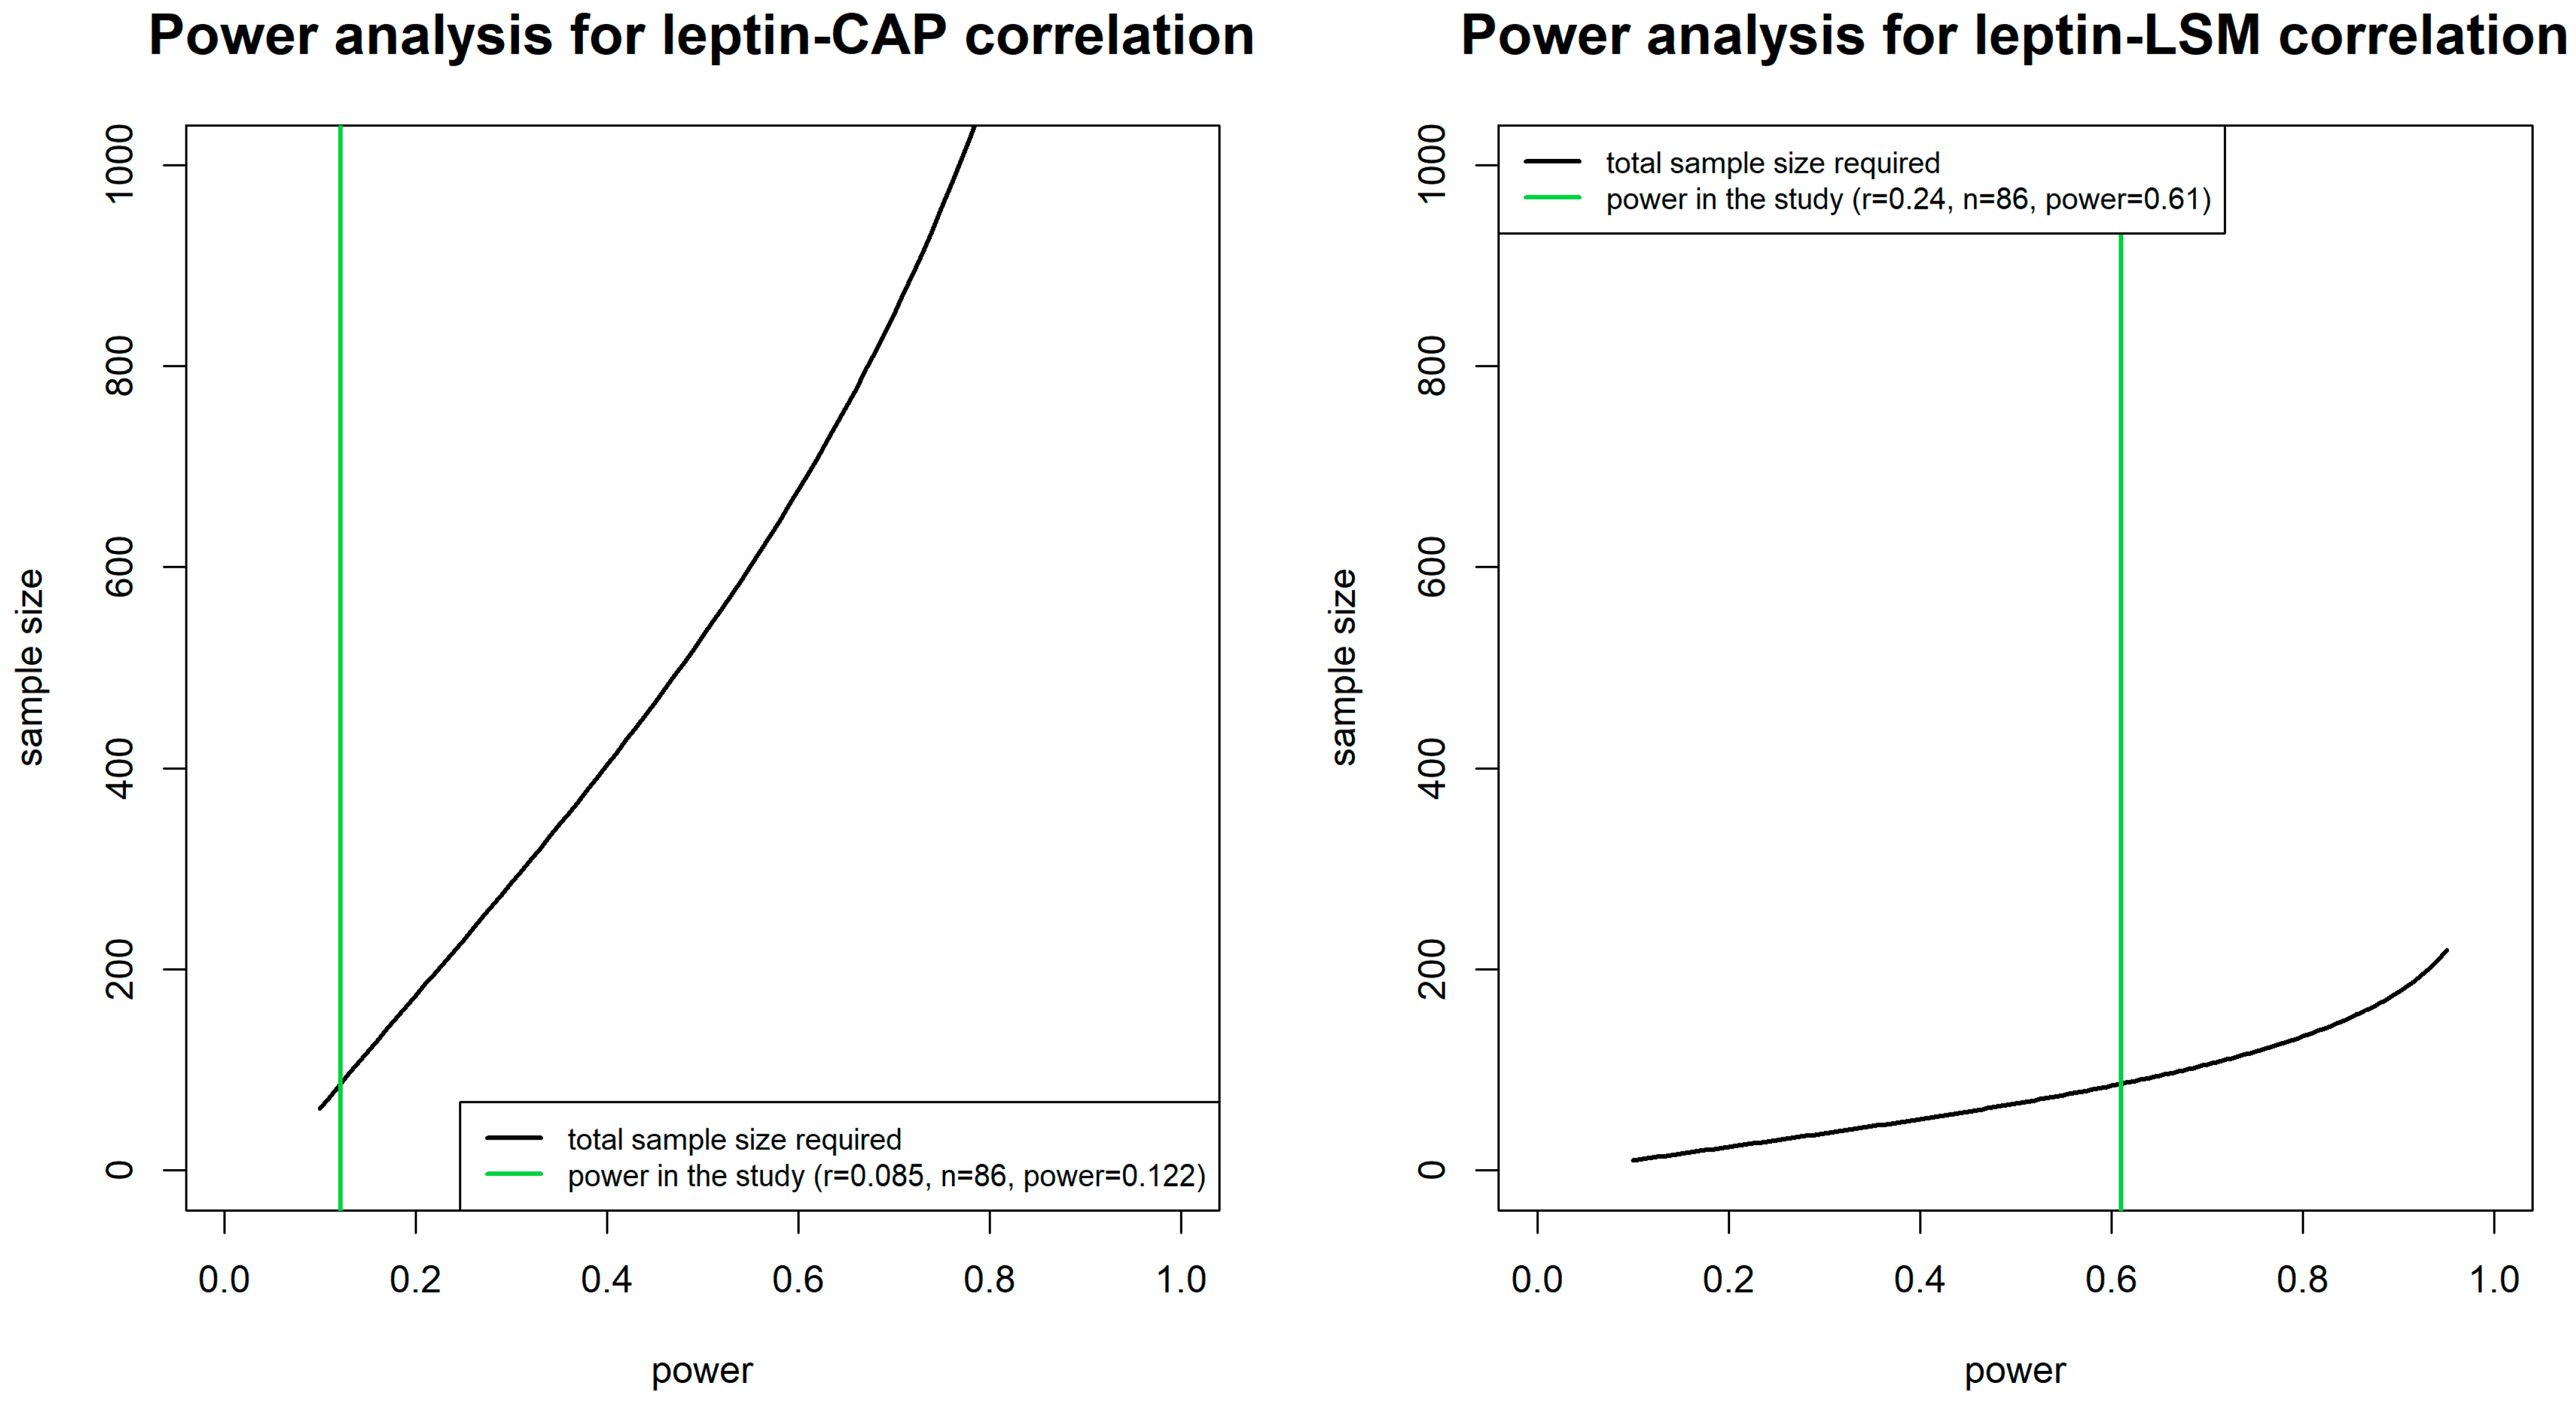
| Leptin | 0.09 (0.436) | 0.24 (0.026) | - |
| FSG | 0.23 (0.033) | 0.24 (0.026) | −0.07 (0.526) |
| HbA1c | 0.34 (0.002) | 0.36 (<0.001) | 0.09 (0.389) |
| Insulin | 0.50 (<0.001) | 0.47 (<0.001) | 0.18 (0.104) |
| HOMA-IR | 0.49 (<0.001) | 0.50 (<0.001) | 0.14 (0.187) |
| IPAQ | −0.15 (0.154) | −0.03 (0.762) | −0.15 (0.154) |
| BMI | 0.48 (<0.001) | 0.62 (<0.001) | 0.49 (<0.001) |
| WC | 0.59 (<0.001) | 0.48 (<0.001) | 0.20 (0.066) |
| Systolic blood pressure | 0.21 (0.047) | 0.17 (0.110) | 0.05 (0.653) |
| Diastolic blood pressure | 0.35 (0.001) | 0.15 (0.162) | 0.08 (0.472) |
| Triglycerides | 0.33 (0.002) | 0.12 (0.272) | −0.17 (0.120) |
| HDL cholesterol | −0.27 (0.013) | −0.13 (0.229) | 0.18 (0.094) |
| LDL cholesterol | −0.05 (0.630) | −0.21 (0.055) | −0.45 (<0.001) |
| Total cholesterol | −0.14 (0.208) | −0.17 (0.108) | −0.35 (0.001) |
| TSH | 0.22 (0.042) | 0.00 (0.991) | 0.10 (0.359) |
| FT3 | 0.08 (0.479) | −0.03 (0.807) | 0.03 (0.811) |
| FT4 | 0.23 (0.030) | 0.08 (0.446) | −0.07 (0.526) |
| 25-hydroxyvitamin D | −0.06 (0.560) | 0.00 (0.969) | −0.11 (0.322) |
| Uric acid | 0.42 (<0.001) | 0.19 (0.083) | −0.20 (0.064) |
| Creatinine | 0.21 (0.054) | 0.04 (0.723) | −0.23 (0.034) |
| AST | 0.32 (0.002) | 0.38 (<0.001) | −0.23 (0.030) |
| ALT | 0.39 (<0.001) | 0.32 (0.003) | −0.25 (0.022) |
| γGT | 0.35 (0.001) | 0.29 (0.007) | −0.21 (0.054) |
| Ferritin | 0.39 (<0.001) | 0.20 (0.063) | −0.22 (0.040) |
| Adiponectin | −0.04 (0.744) | −0.07 (0.494) | 0.04 (0.681) |
| RBP4 | 0.22 (0.046) | 0.03 (0.788) | −0.07 (0.494) |
| Visfatin | −0.34 (0.001) | −0.23 (0.031) | −0.02 (0.835) |
| β of Leptin on FibroScan CAP | β of Leptin on FibroScan LSM | OR of Leptin on Steatosis | OR of Leptin on Fibrosis | |
|---|---|---|---|---|
| Linear Model | Linear Model | Logistic Models | Firth’s Logistic Models | |
| Ordinary model | β = 0.386 p = 0.436 95%CI = −0.596; 1.369 | β= 0.067 p = 0.026 95%CI = 0.008; 0.127 | OR = 1.009 p = 0.620 95%CI = 0.974; 1.045 | OR = 1.019 p = 0.305 95%CI = 0.982; 1.056 |
| Multiple model * | β = 0.817 p = 0.090 95%CI = −0.127; 1.761 | β = 0.065 p = 0.038 95%CI = 0.004; 0.127 | OR = 1.025 p = 0.345 95%CI = 0.974; 1.078 | OR = 1.015 p = 0.533 95%CI = 0.967; 1.066 |
Disclaimer/Publisher’s Note: The statements, opinions and data contained in all publications are solely those of the individual author(s) and contributor(s) and not of MDPI and/or the editor(s). MDPI and/or the editor(s) disclaim responsibility for any injury to people or property resulting from any ideas, methods, instructions or products referred to in the content. |
© 2025 by the authors. Licensee MDPI, Basel, Switzerland. This article is an open access article distributed under the terms and conditions of the Creative Commons Attribution (CC BY) license (https://creativecommons.org/licenses/by/4.0/).
Share and Cite
Cerabino, N.; Di Chito, M.; Guido, D.; Di Stasi, V.; Bonfiglio, C.; Lisco, G.; Shahini, E.; Zappimbulso, M.; Cozzolongo, R.; Tutino, V.; et al. Liver Fibrosis Is Positively and Independently Associated with Leptin Circulating Levels in Individuals That Are Overweight and Obese: A FibroScan-Based Cross-Sectional Study. Nutrients 2025, 17, 1908. https://doi.org/10.3390/nu17111908
Cerabino N, Di Chito M, Guido D, Di Stasi V, Bonfiglio C, Lisco G, Shahini E, Zappimbulso M, Cozzolongo R, Tutino V, et al. Liver Fibrosis Is Positively and Independently Associated with Leptin Circulating Levels in Individuals That Are Overweight and Obese: A FibroScan-Based Cross-Sectional Study. Nutrients. 2025; 17(11):1908. https://doi.org/10.3390/nu17111908
Chicago/Turabian StyleCerabino, Nicole, Martina Di Chito, Davide Guido, Vincenza Di Stasi, Caterina Bonfiglio, Giuseppe Lisco, Endrit Shahini, Marianna Zappimbulso, Raffaele Cozzolongo, Valeria Tutino, and et al. 2025. "Liver Fibrosis Is Positively and Independently Associated with Leptin Circulating Levels in Individuals That Are Overweight and Obese: A FibroScan-Based Cross-Sectional Study" Nutrients 17, no. 11: 1908. https://doi.org/10.3390/nu17111908
APA StyleCerabino, N., Di Chito, M., Guido, D., Di Stasi, V., Bonfiglio, C., Lisco, G., Shahini, E., Zappimbulso, M., Cozzolongo, R., Tutino, V., Diciolla, A., Mallamaci, R., Stabile, D., Ancona, A., Coletta, S., Pesole, P. L., Giannelli, G., & De Pergola, G. (2025). Liver Fibrosis Is Positively and Independently Associated with Leptin Circulating Levels in Individuals That Are Overweight and Obese: A FibroScan-Based Cross-Sectional Study. Nutrients, 17(11), 1908. https://doi.org/10.3390/nu17111908