
Integrating Metabolomics and Gut Microbiota to Identify Key Biomarkers and Regulatory Pathways Underlying Metabolic Heterogeneity in Childhood Obesity
 , , ,
, , , 
Highlights
- Integrated untargeted metabolomics (Orbitrap ID-X Tribrid™) and 16S rRNA sequencing revealed 225 differential metabolites and 12 bacterial genera potentially associated with metabolic heterogeneity in Chinese children with obesity.
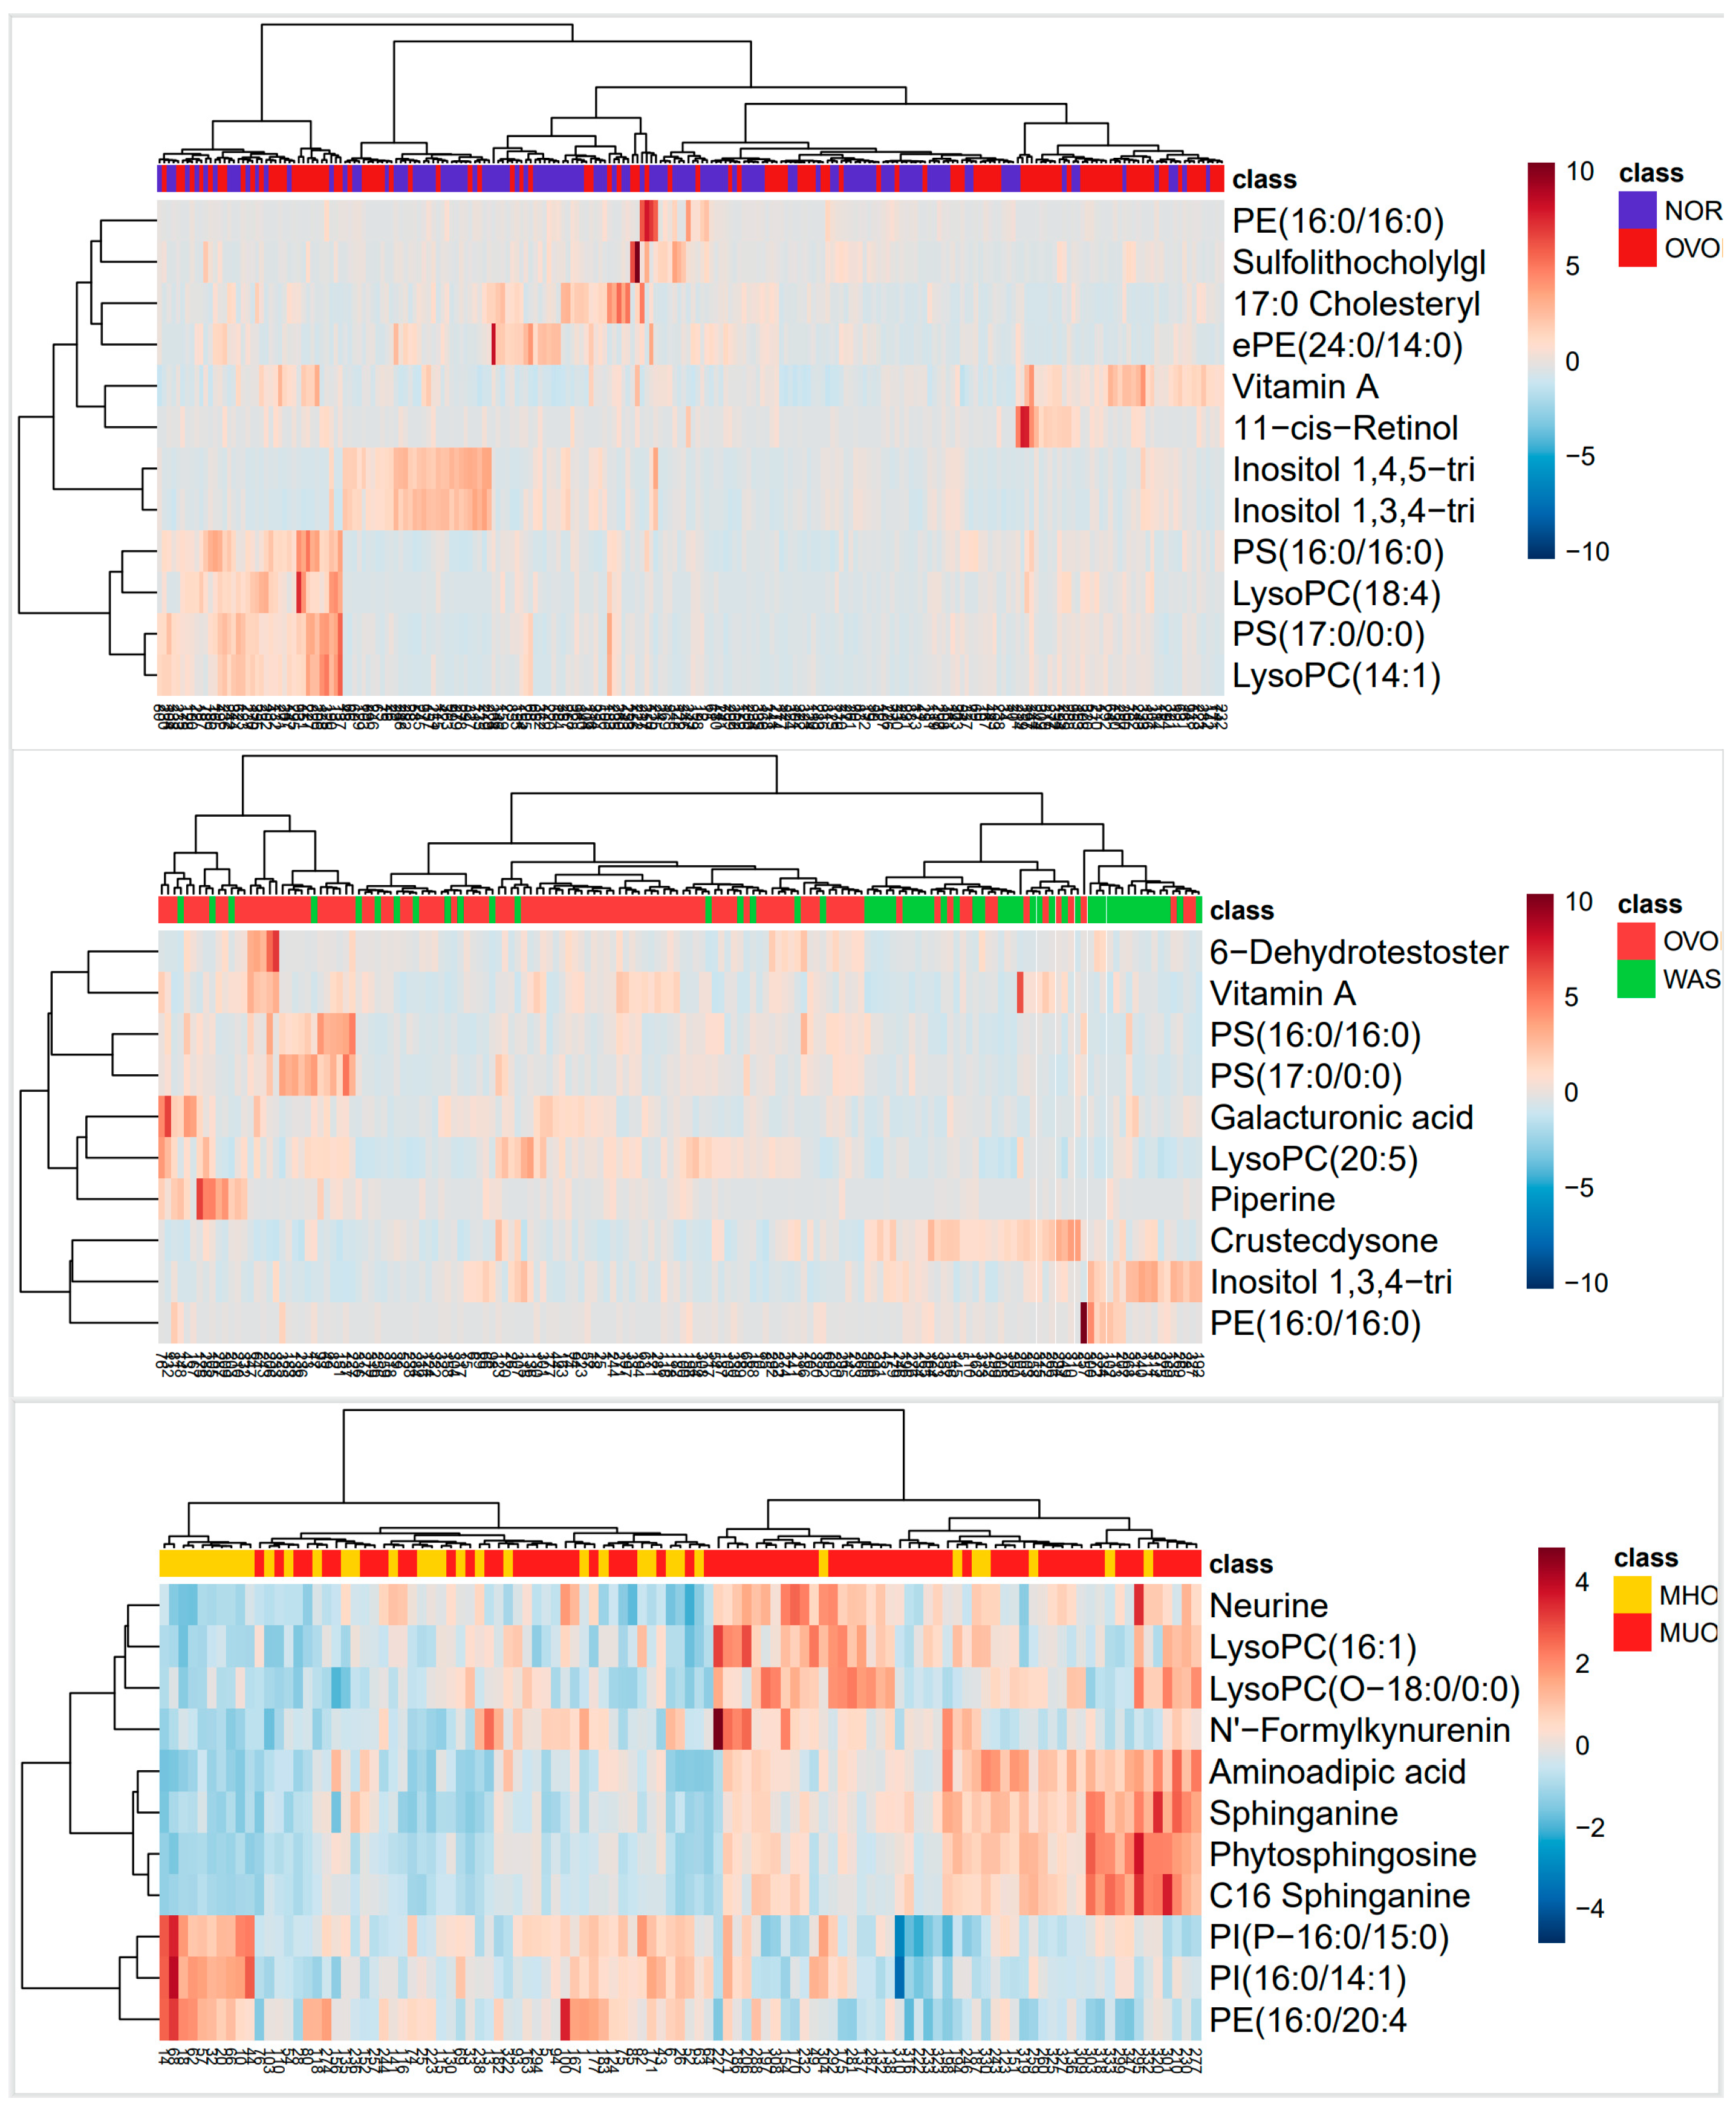
- Observed metabolic variations included steroid/terpenoid deficits and sphingolipid dysregulation in the MUO group, combined with phospholipid imbalances (↑LPC/PS↓PE) in obese children, which may serve as candidate biomarkers for metabolic risk assessment.
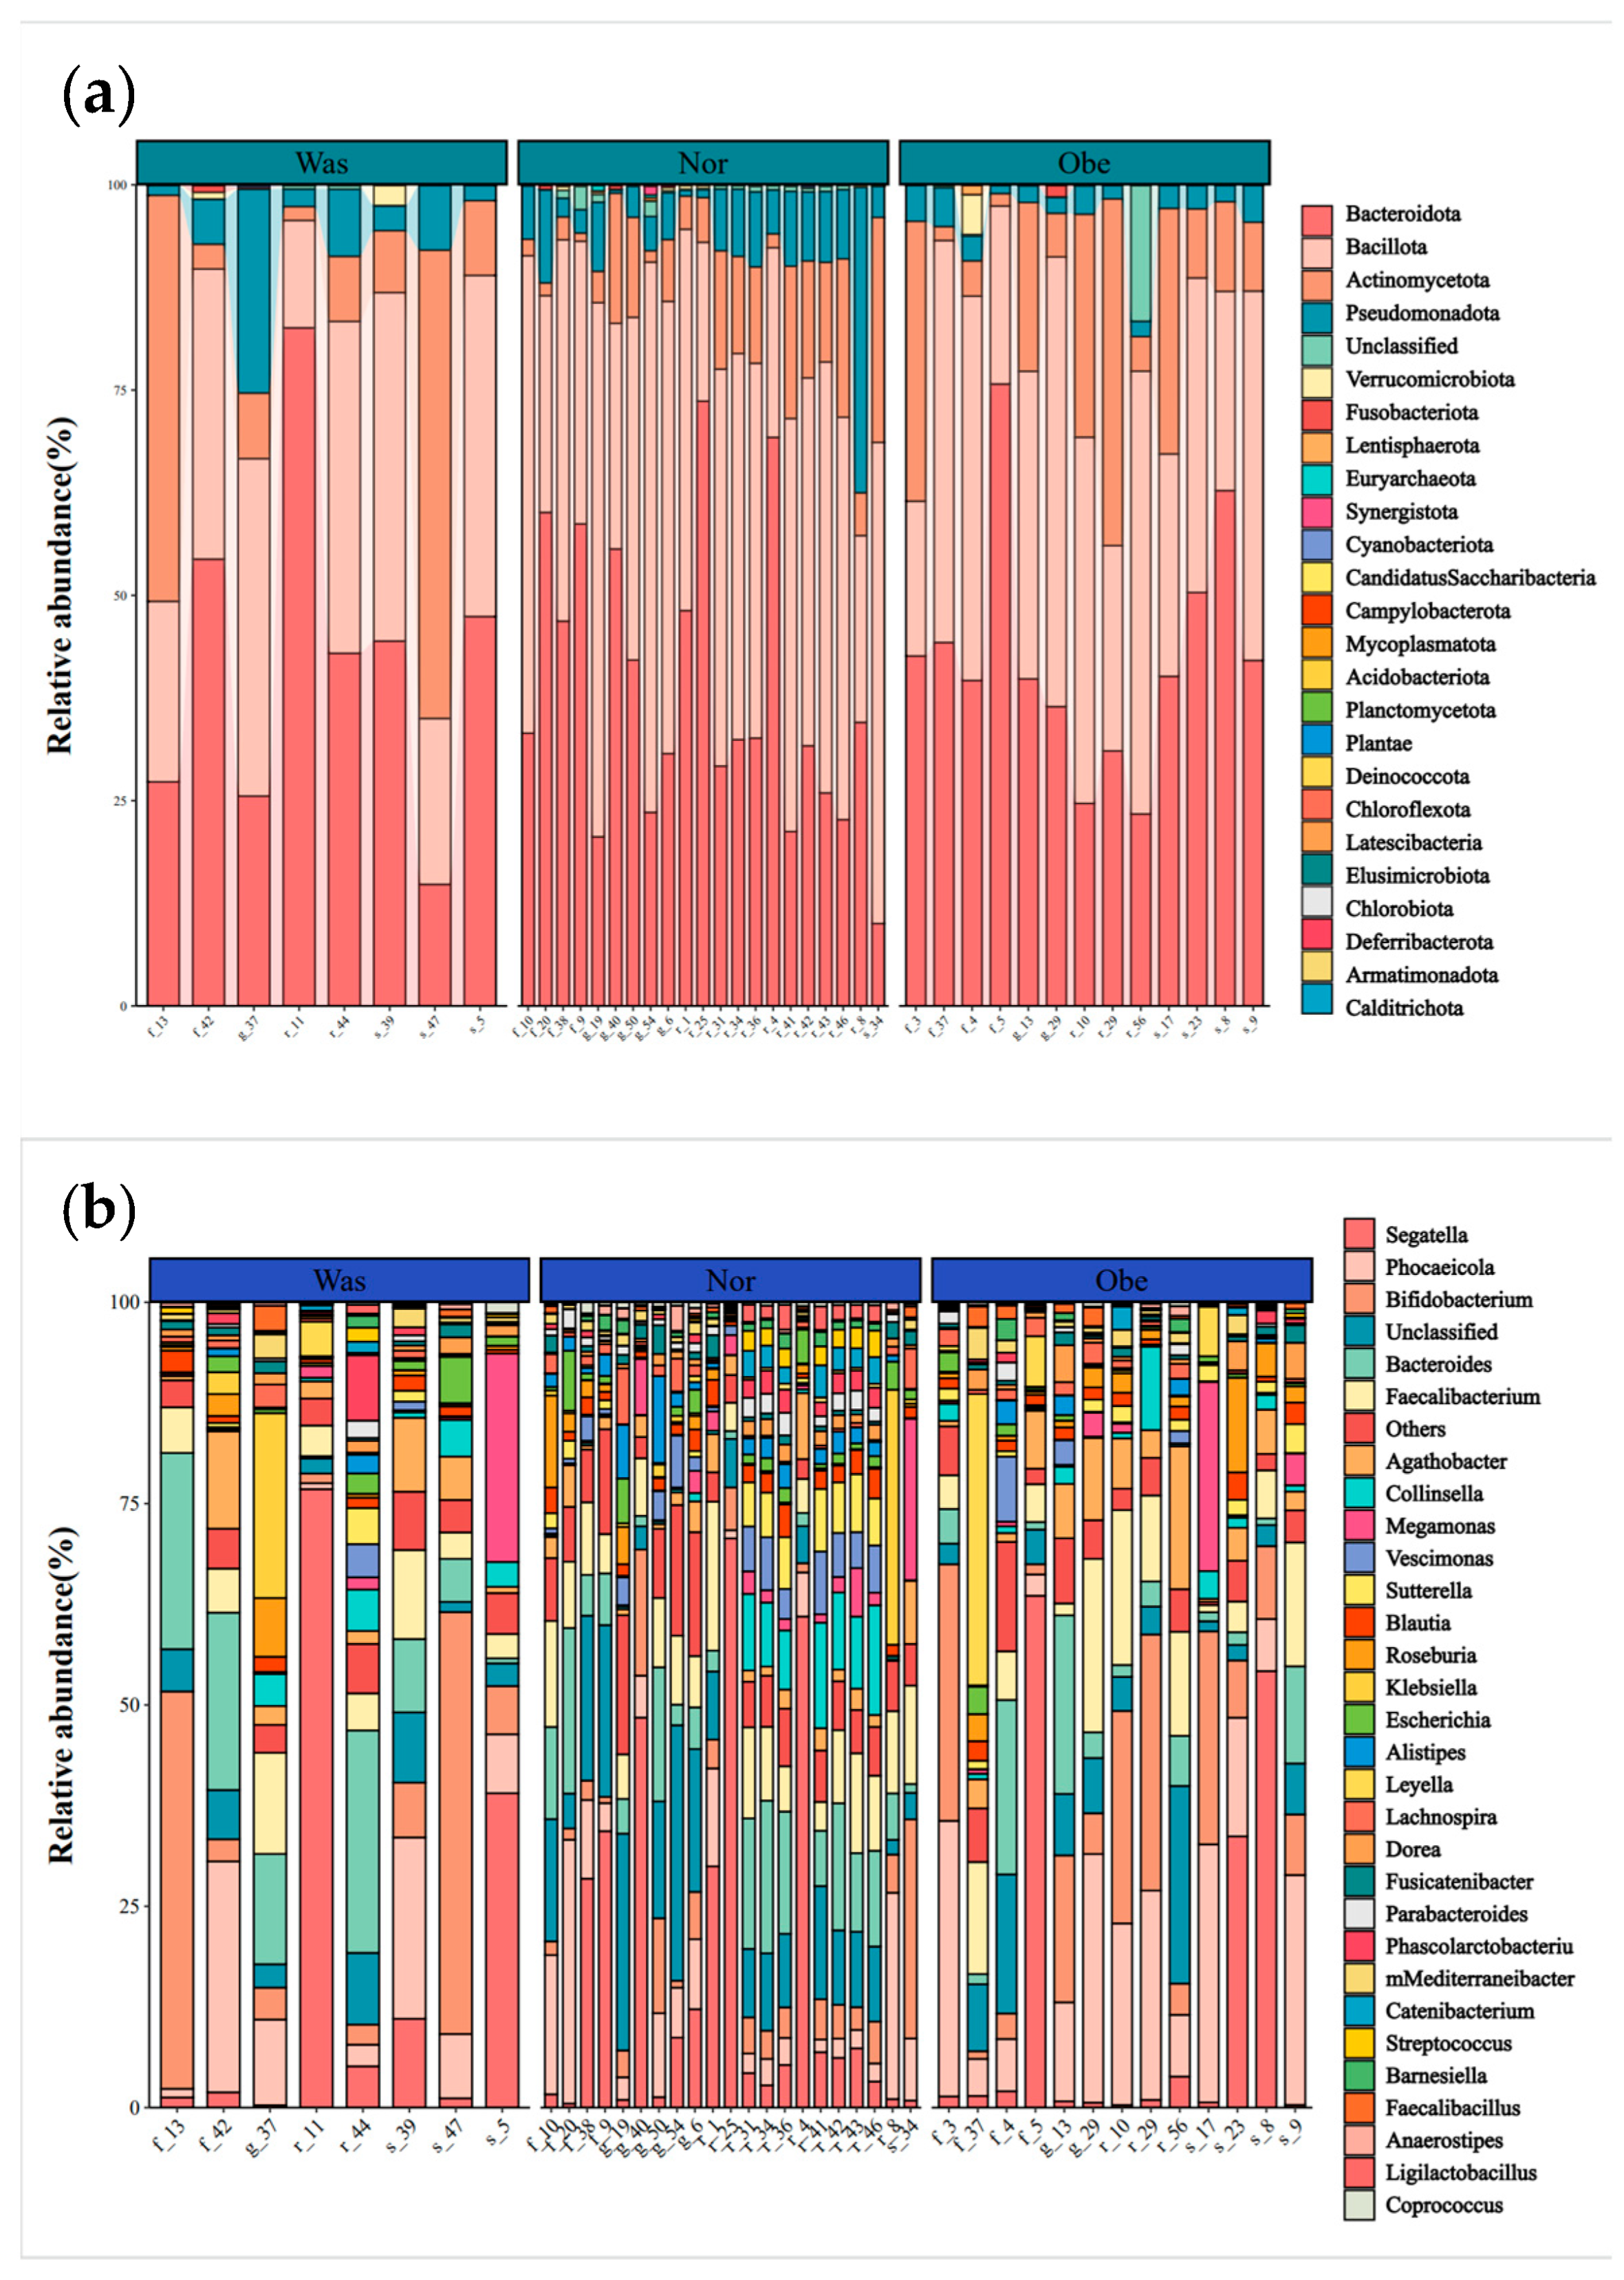
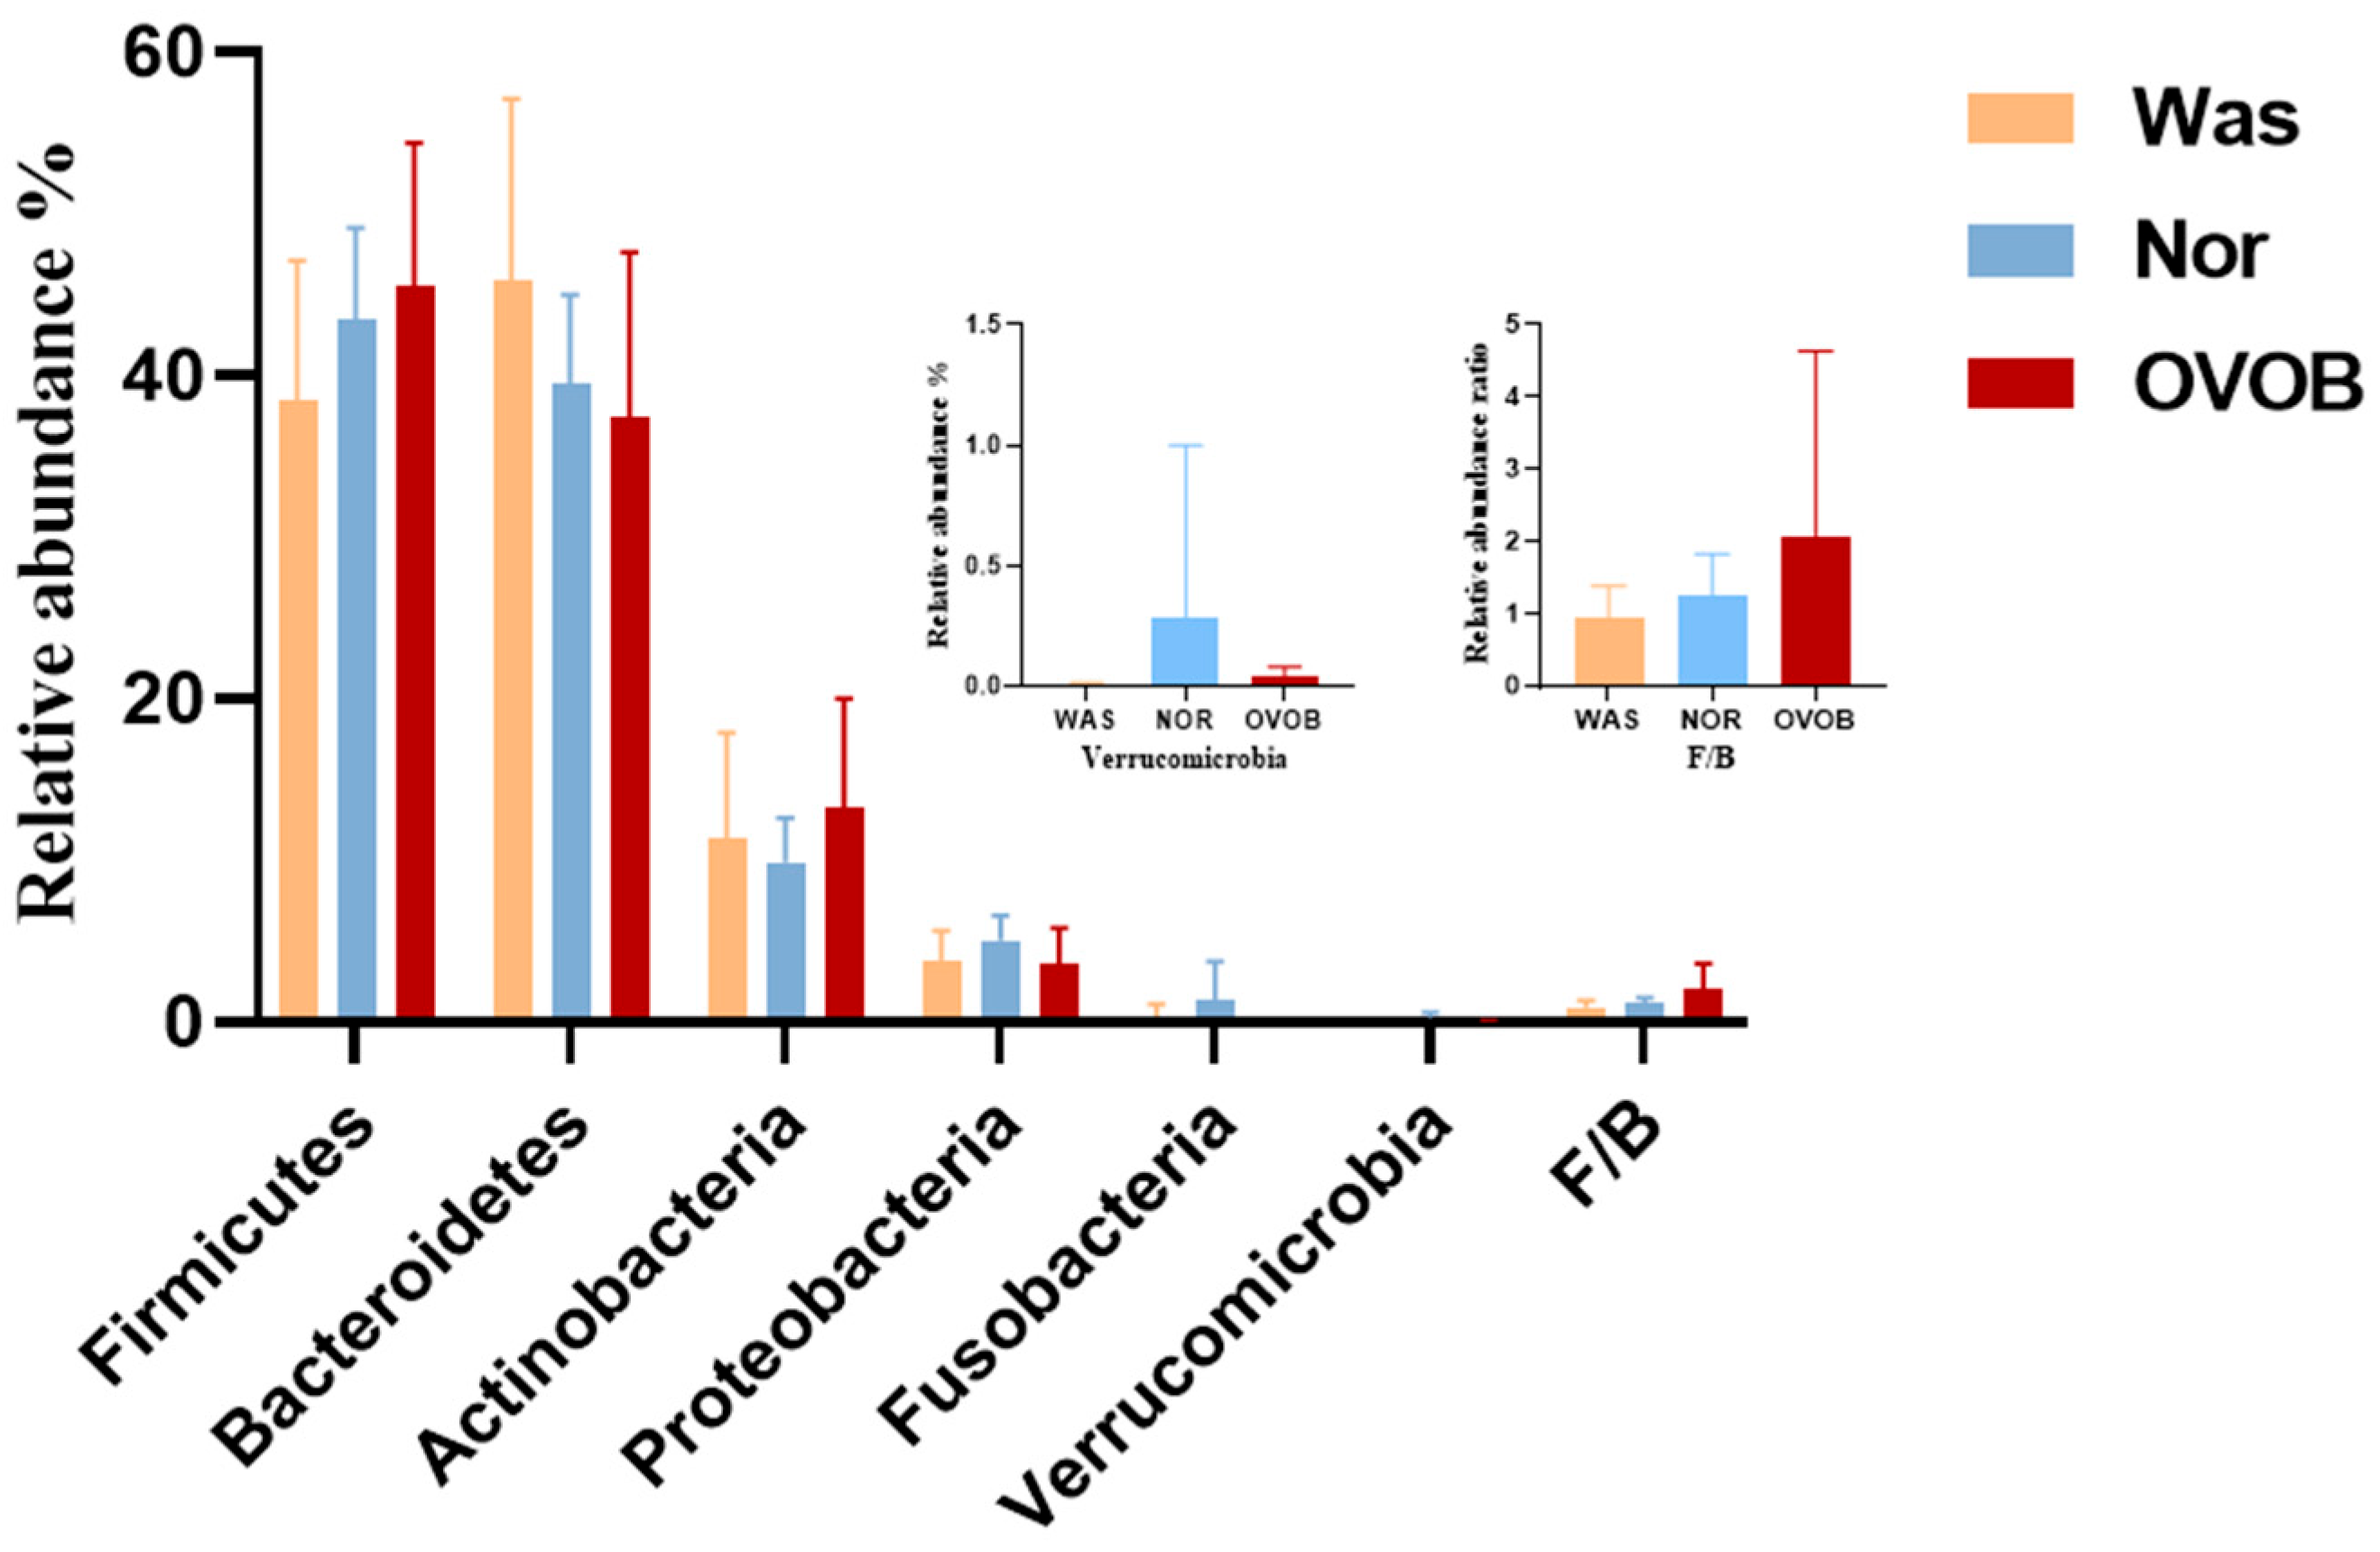
- Gut microbiota analysis (Maaslin2) showed tentative associations between obesity and reduced α diversity, increased Firmicutes/Bacteroidetes ratio, and decreased relative abundance of SCFA-producing genera.
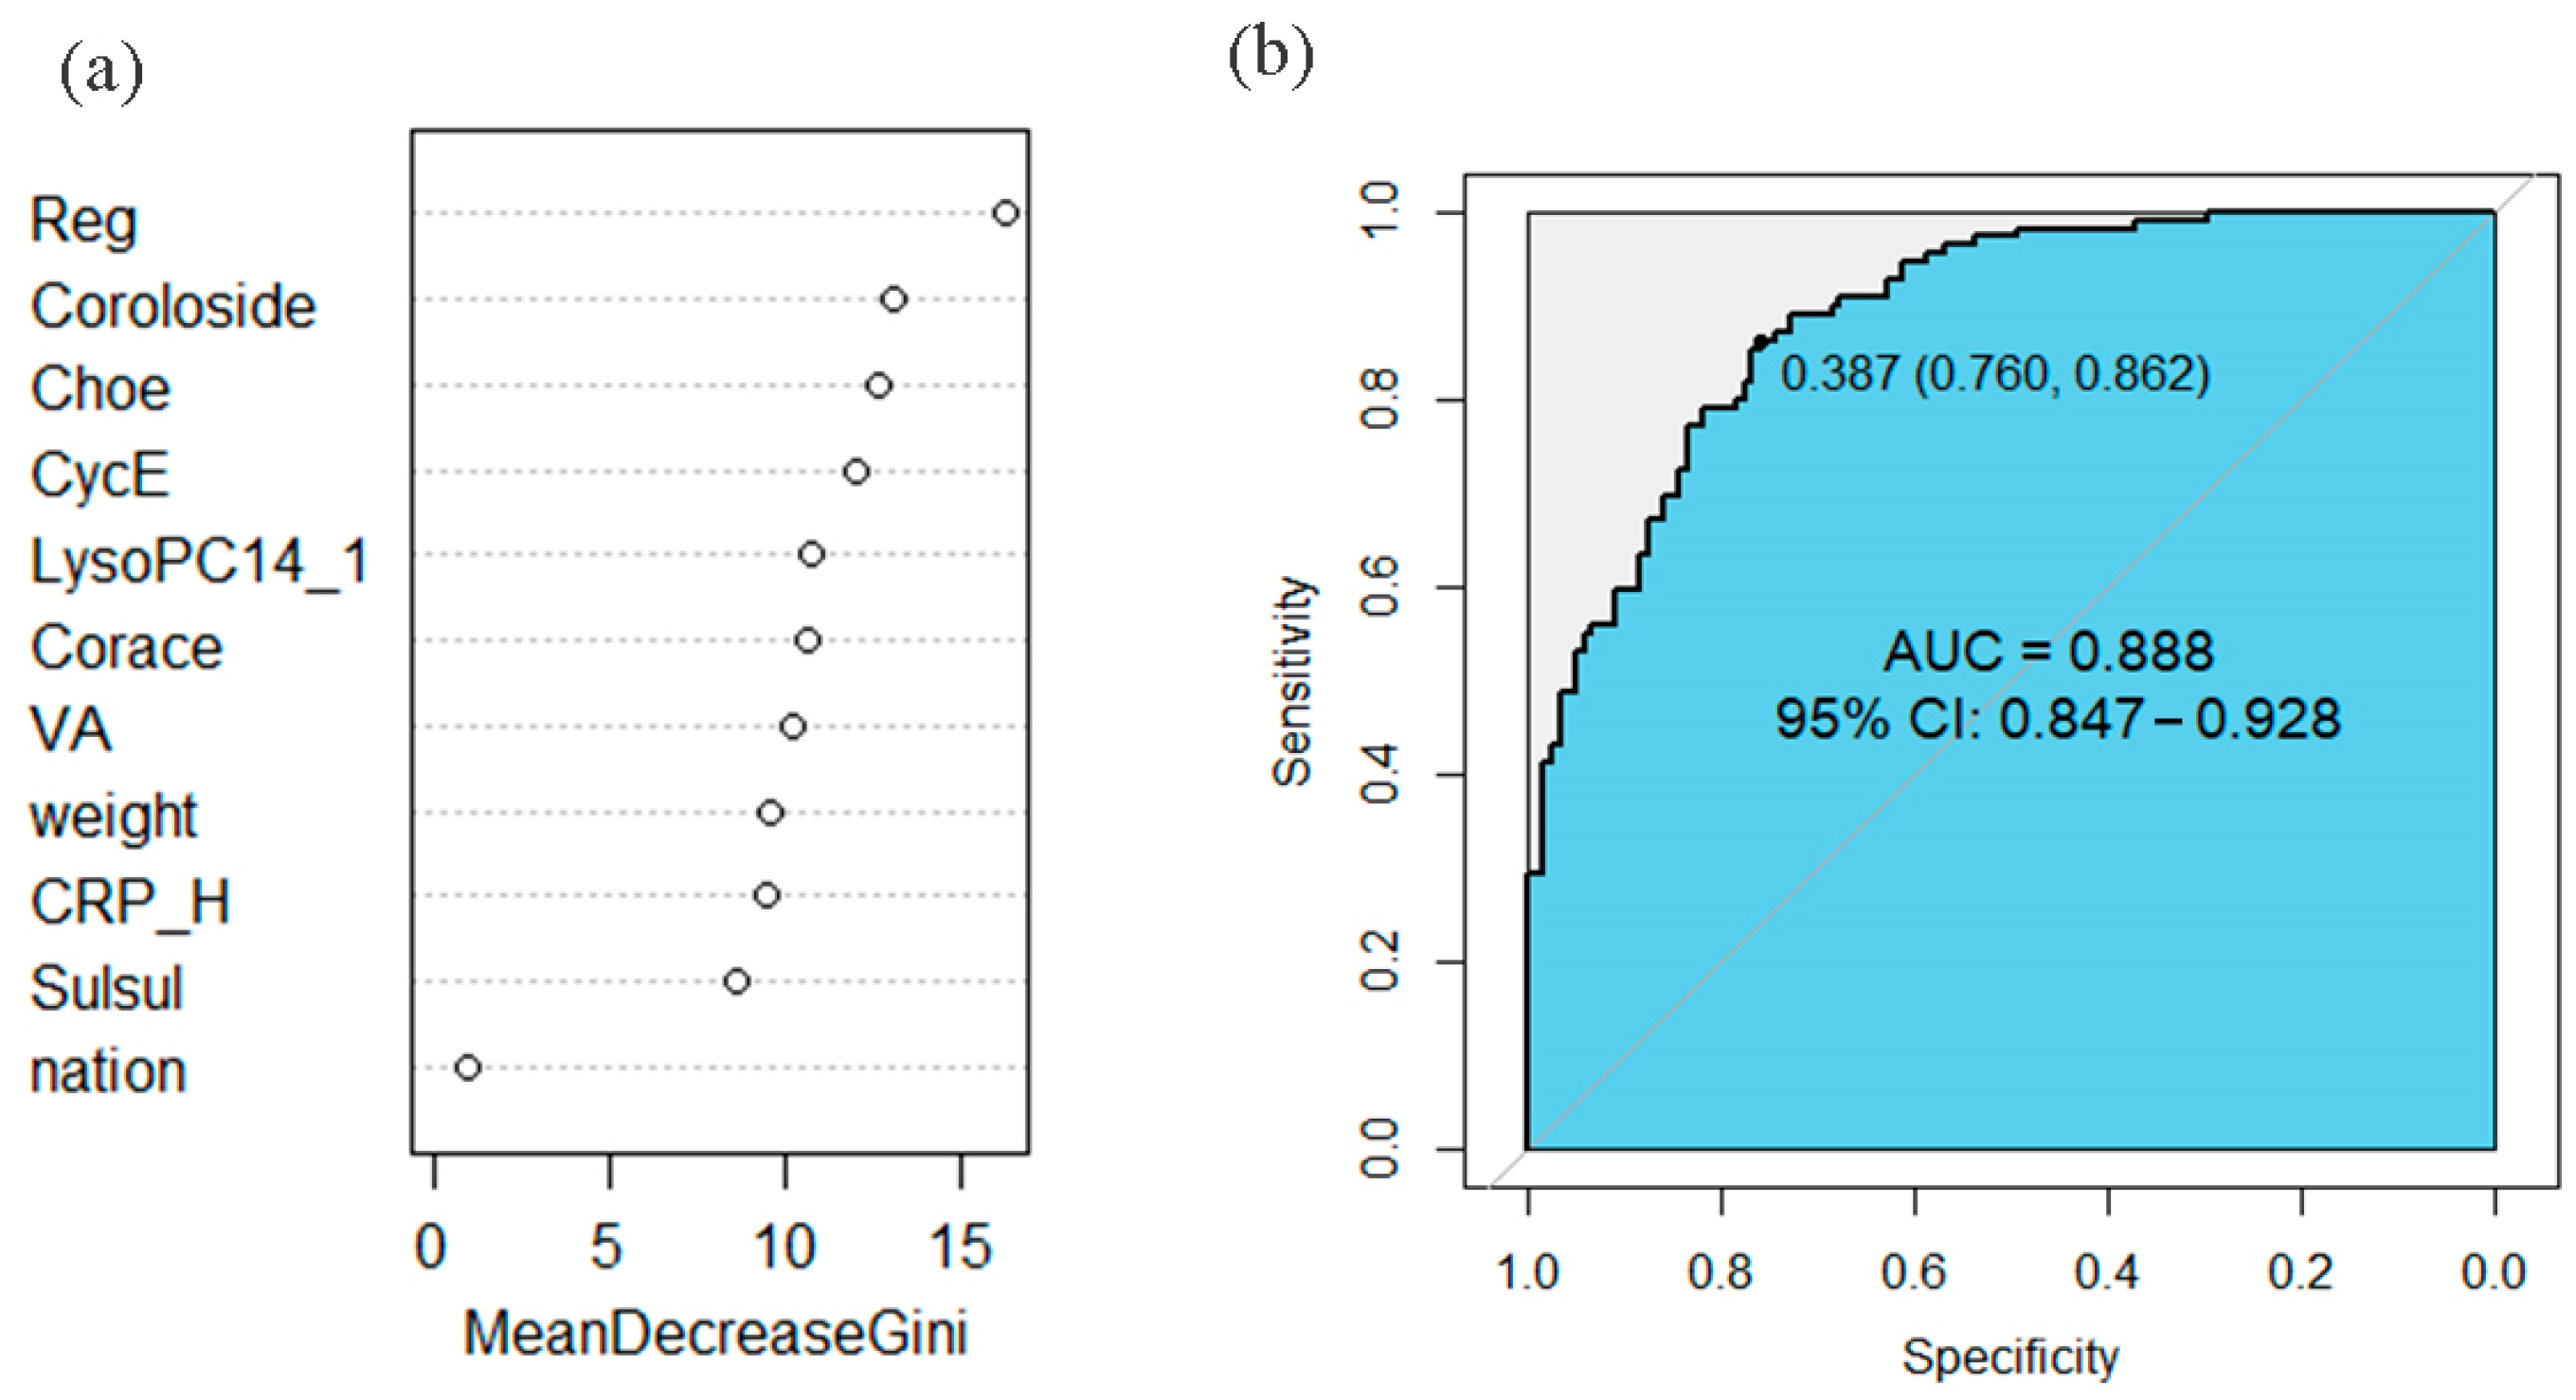
- Preliminary predictive models using differential metabolites showed promising discrimination capacity (AUC = 0.967 for MUO/MHO; AUC = 0.888 for obese/normal-weight), though further validation is warranted.
Abstract

1. Introduction
1.1. Global Burden and Clinical Significance of Childhood Obesity
1.2. Metabolic Heterogeneity in Pediatric Obesity: Challenges in Phenotyping
1.3. Gut Microbiota in Obesity: Current Evidence and Controversies
1.4. Objective of This Study
2. Materials and Methods
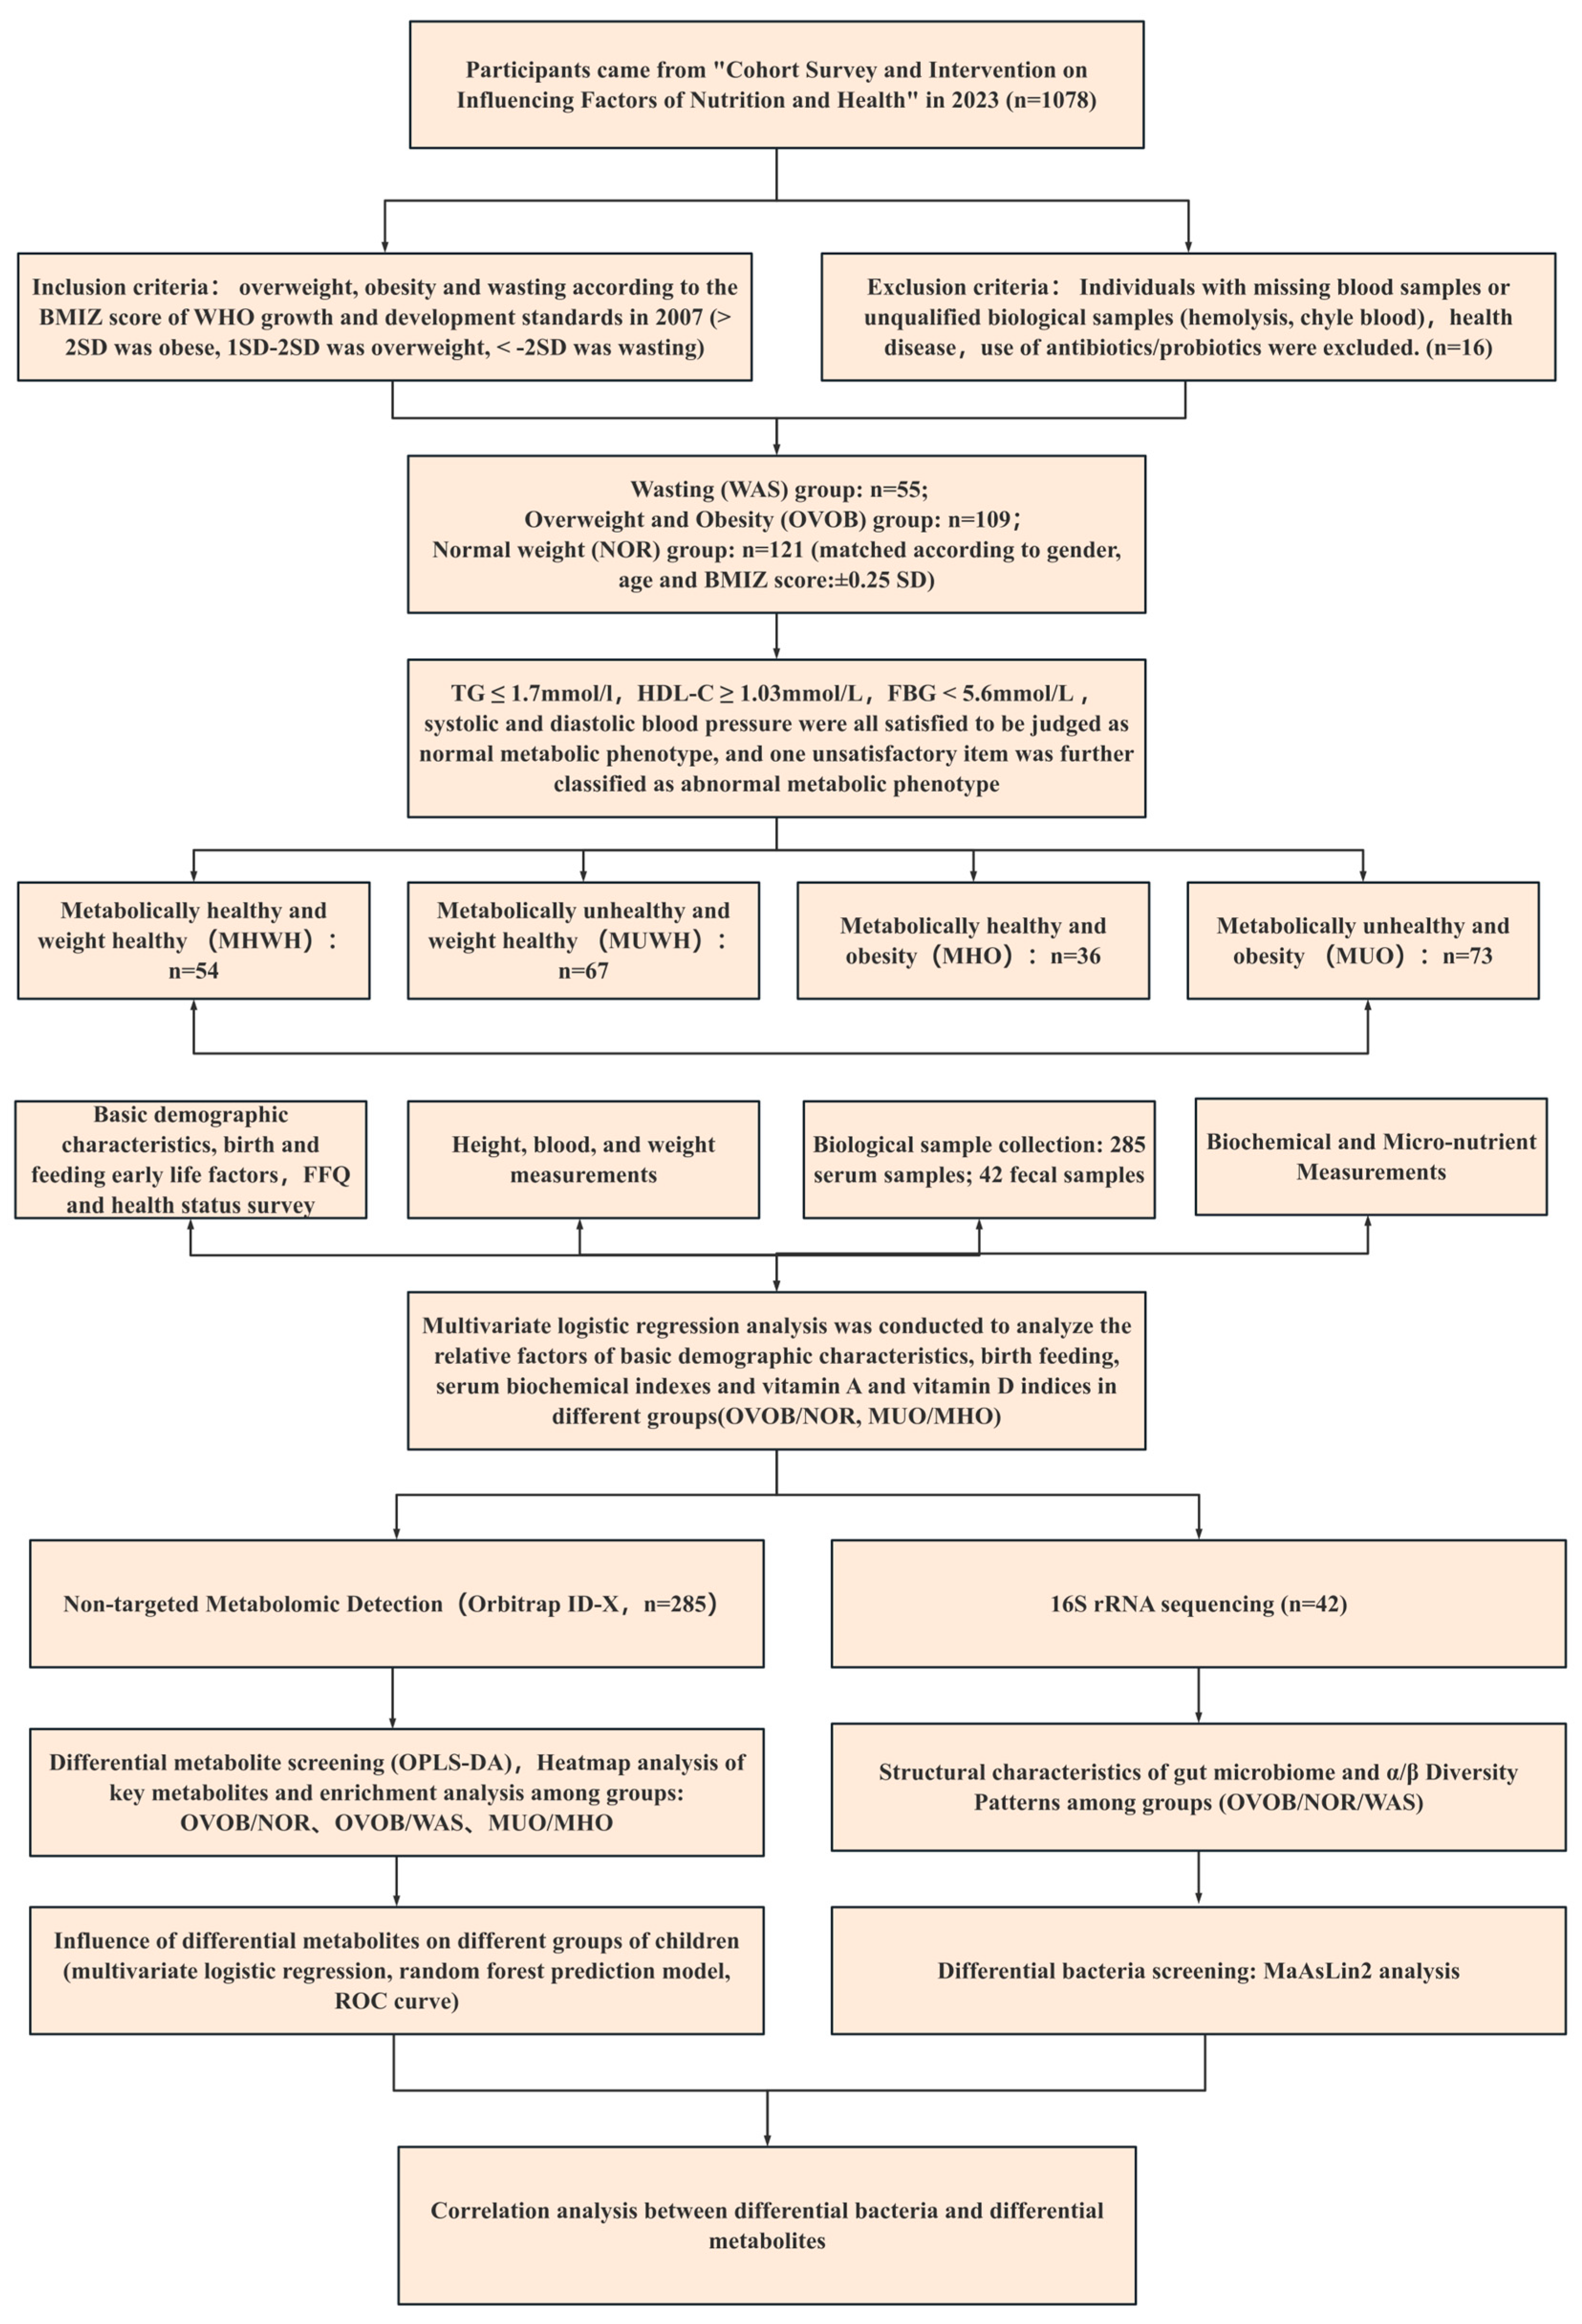
2.1. Study Design and Participants
2.2. Questionnaire Survey
2.3. Anthropometry
2.4. Biological Sample Collection
2.5. Biochemical and Micronutrient Measurements
2.6. Nontargeted Metabolomic Detection
2.6.1. Reagents and Instrumentation
2.6.2. Sample Preparation
2.6.3. Chromatographic Conditions
2.6.4. Mass Spectrometric Parameters
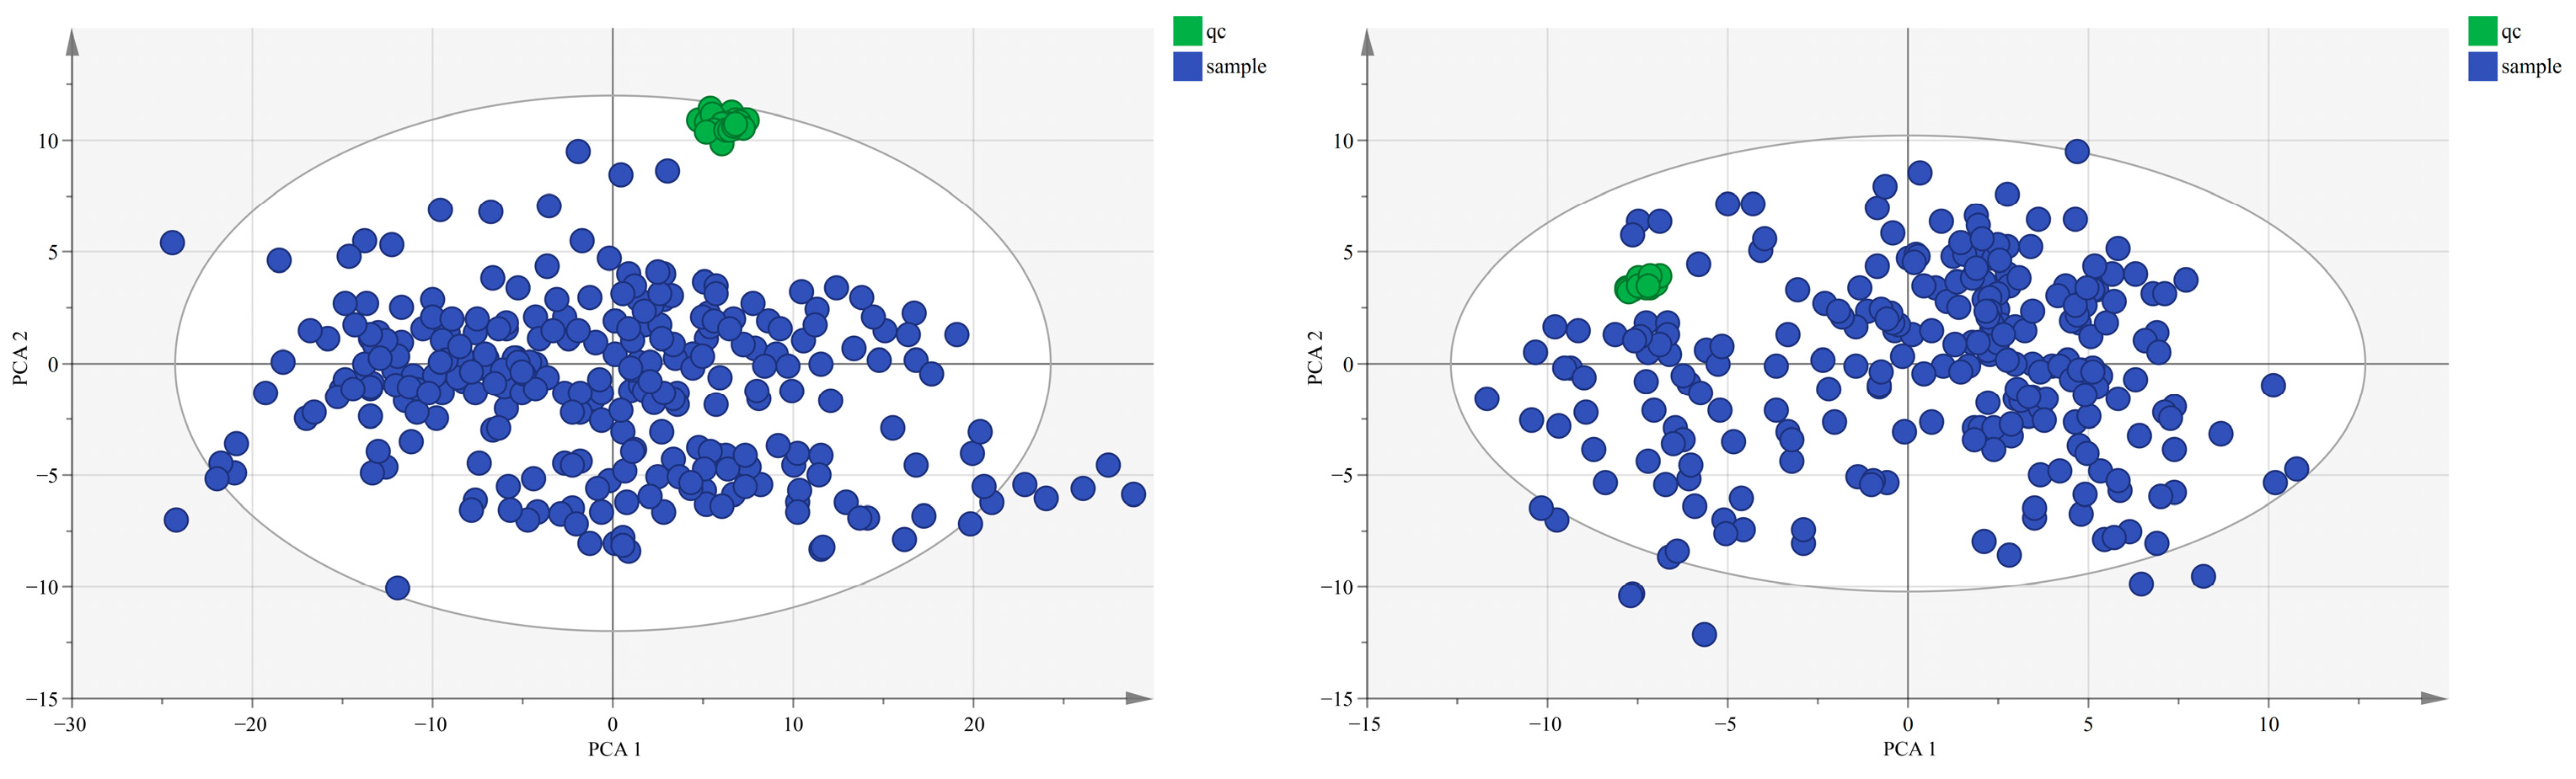
2.6.5. Quality Assurance Protocol
2.7. Gut Microbiota 16S rRNA Detection
2.8. Data Analysis
2.8.1. Omics Data Preprocessing
2.8.2. Statistical Analysis
3. Results
3.1. Characteristics of Study Participants
3.2. Metabolomic Characteristics
3.2.1. Metabolic Profile Characteristics
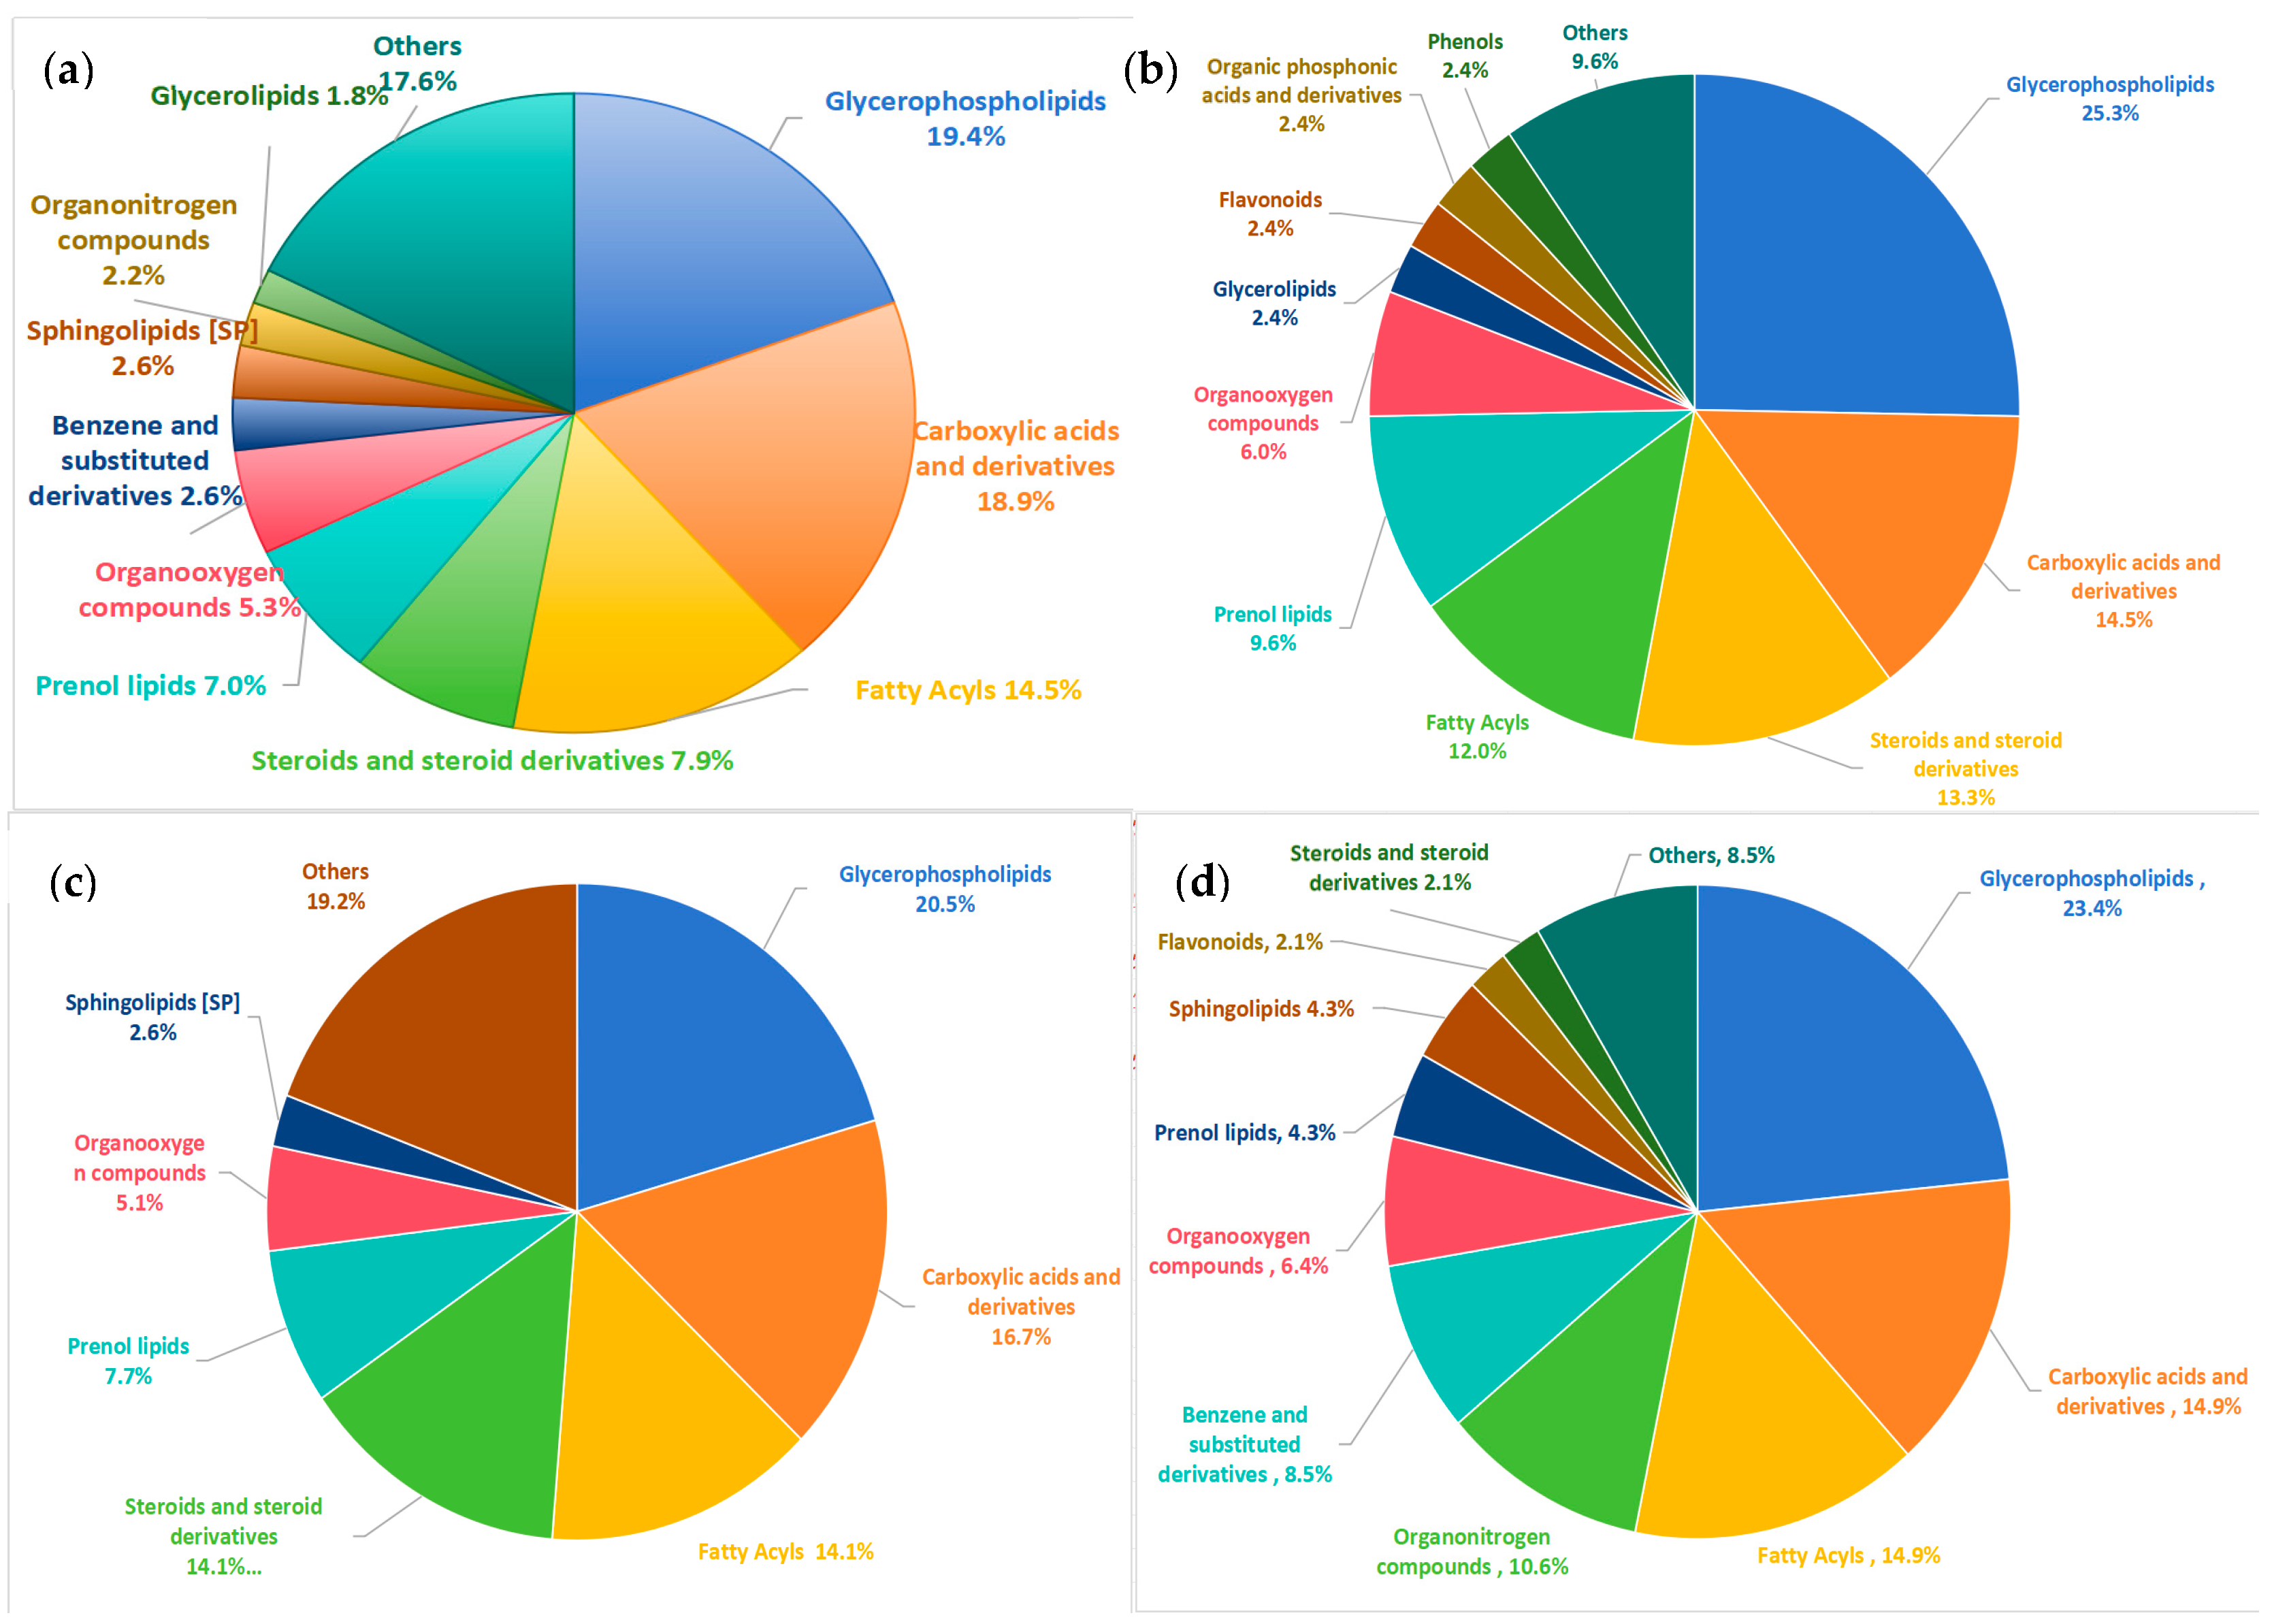
3.2.2. Classification of Differential Metabolites
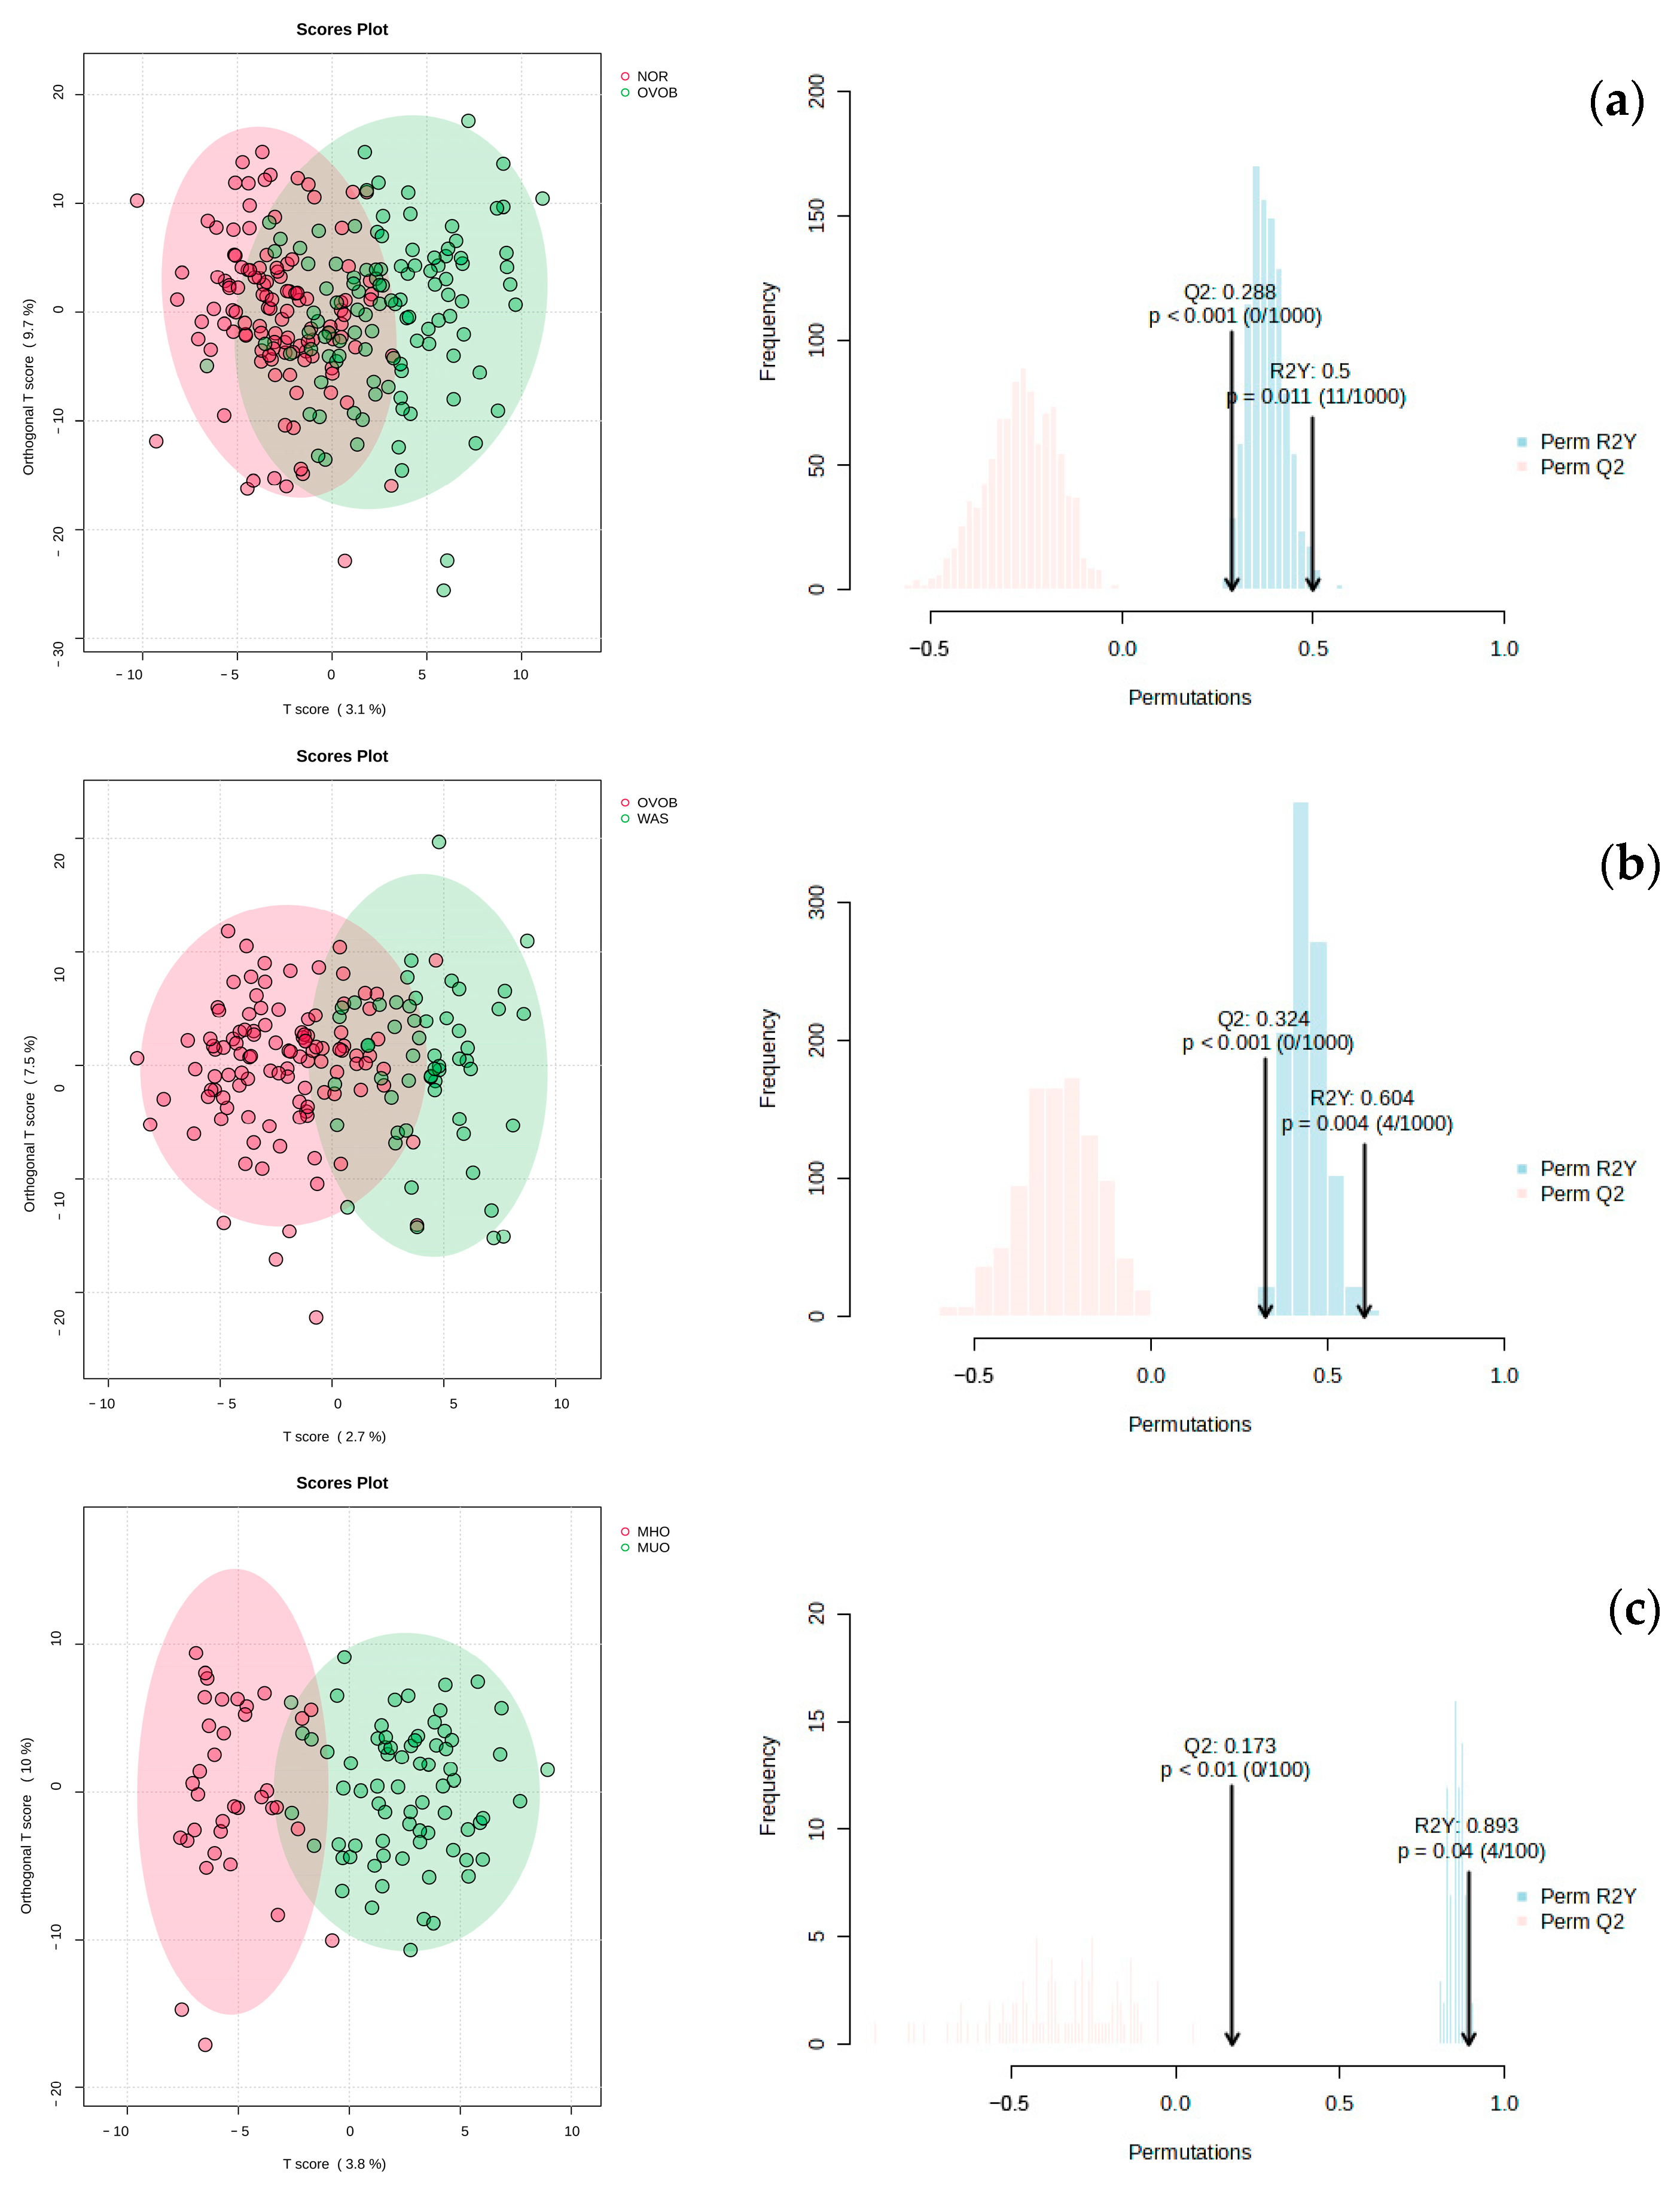
3.2.3. Screening of Differential Metabolites and Pathway Enrichment Analysis
3.2.4. Prediction of the Clinical Efficacy of Differential Metabolites
3.3. Gut Microbiome Characteristics
3.3.1. Structural Characteristics of the Gut Microbiome
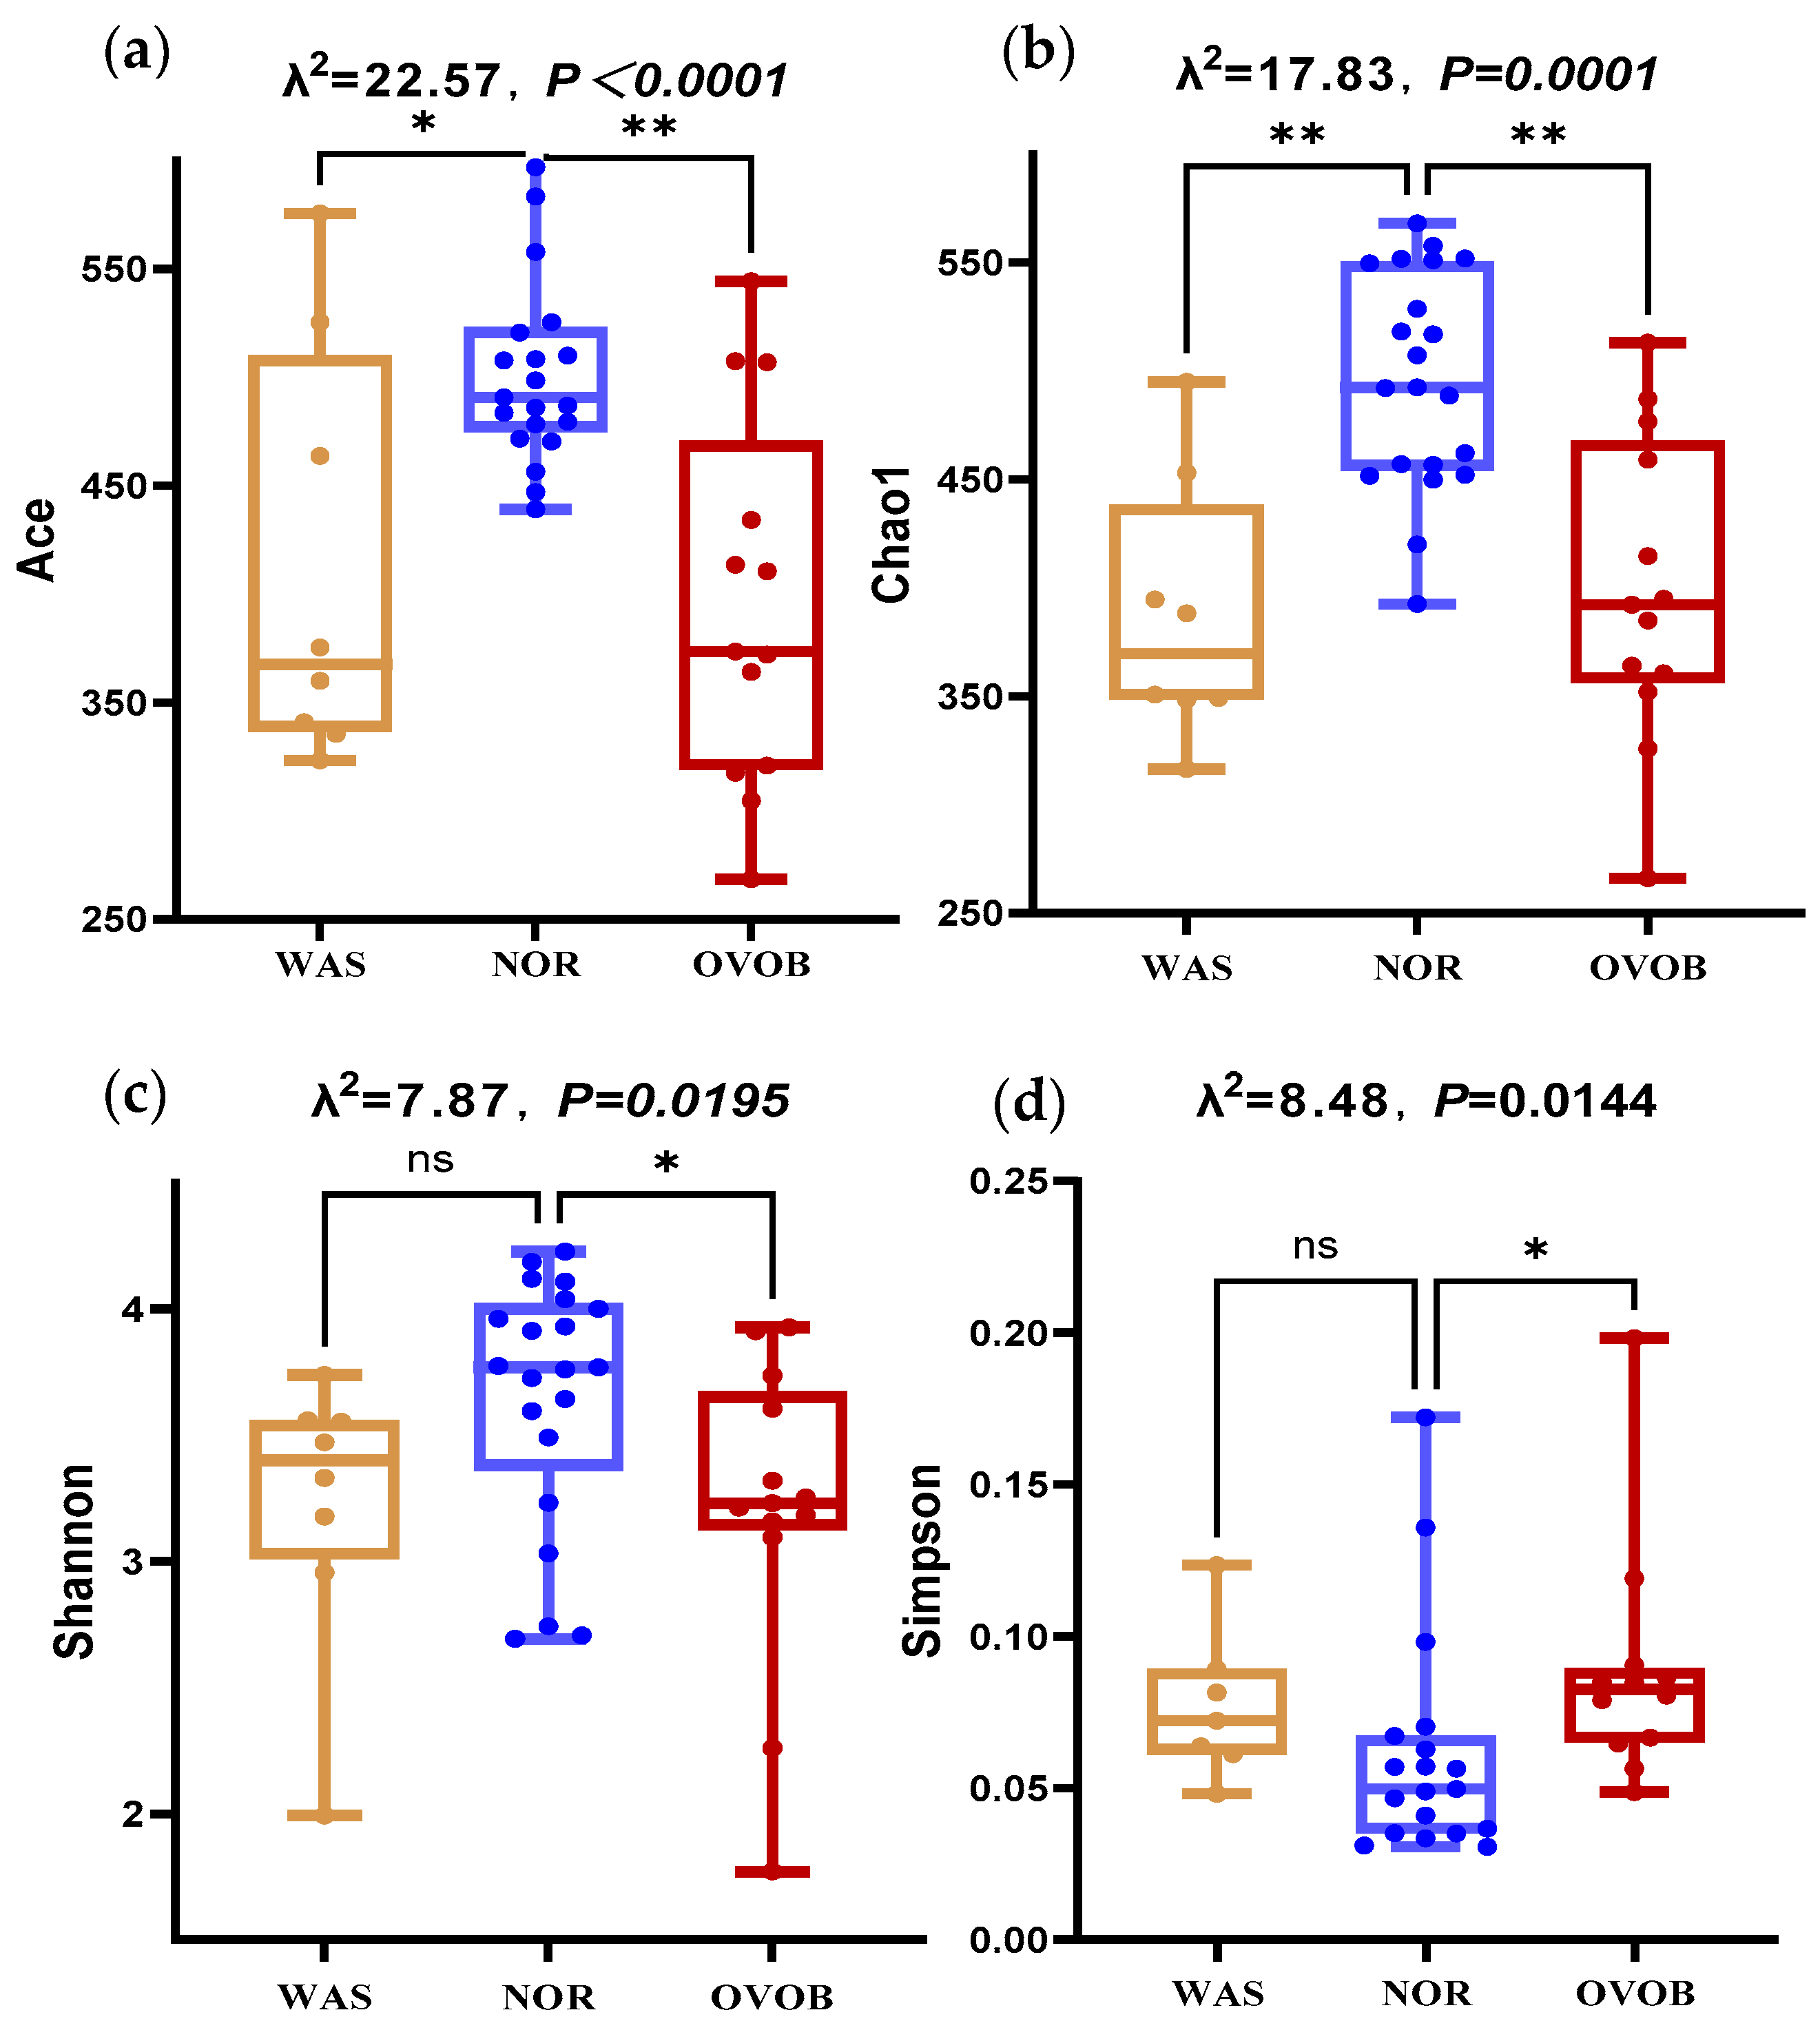
3.3.2. Microbial Diversity Signatures
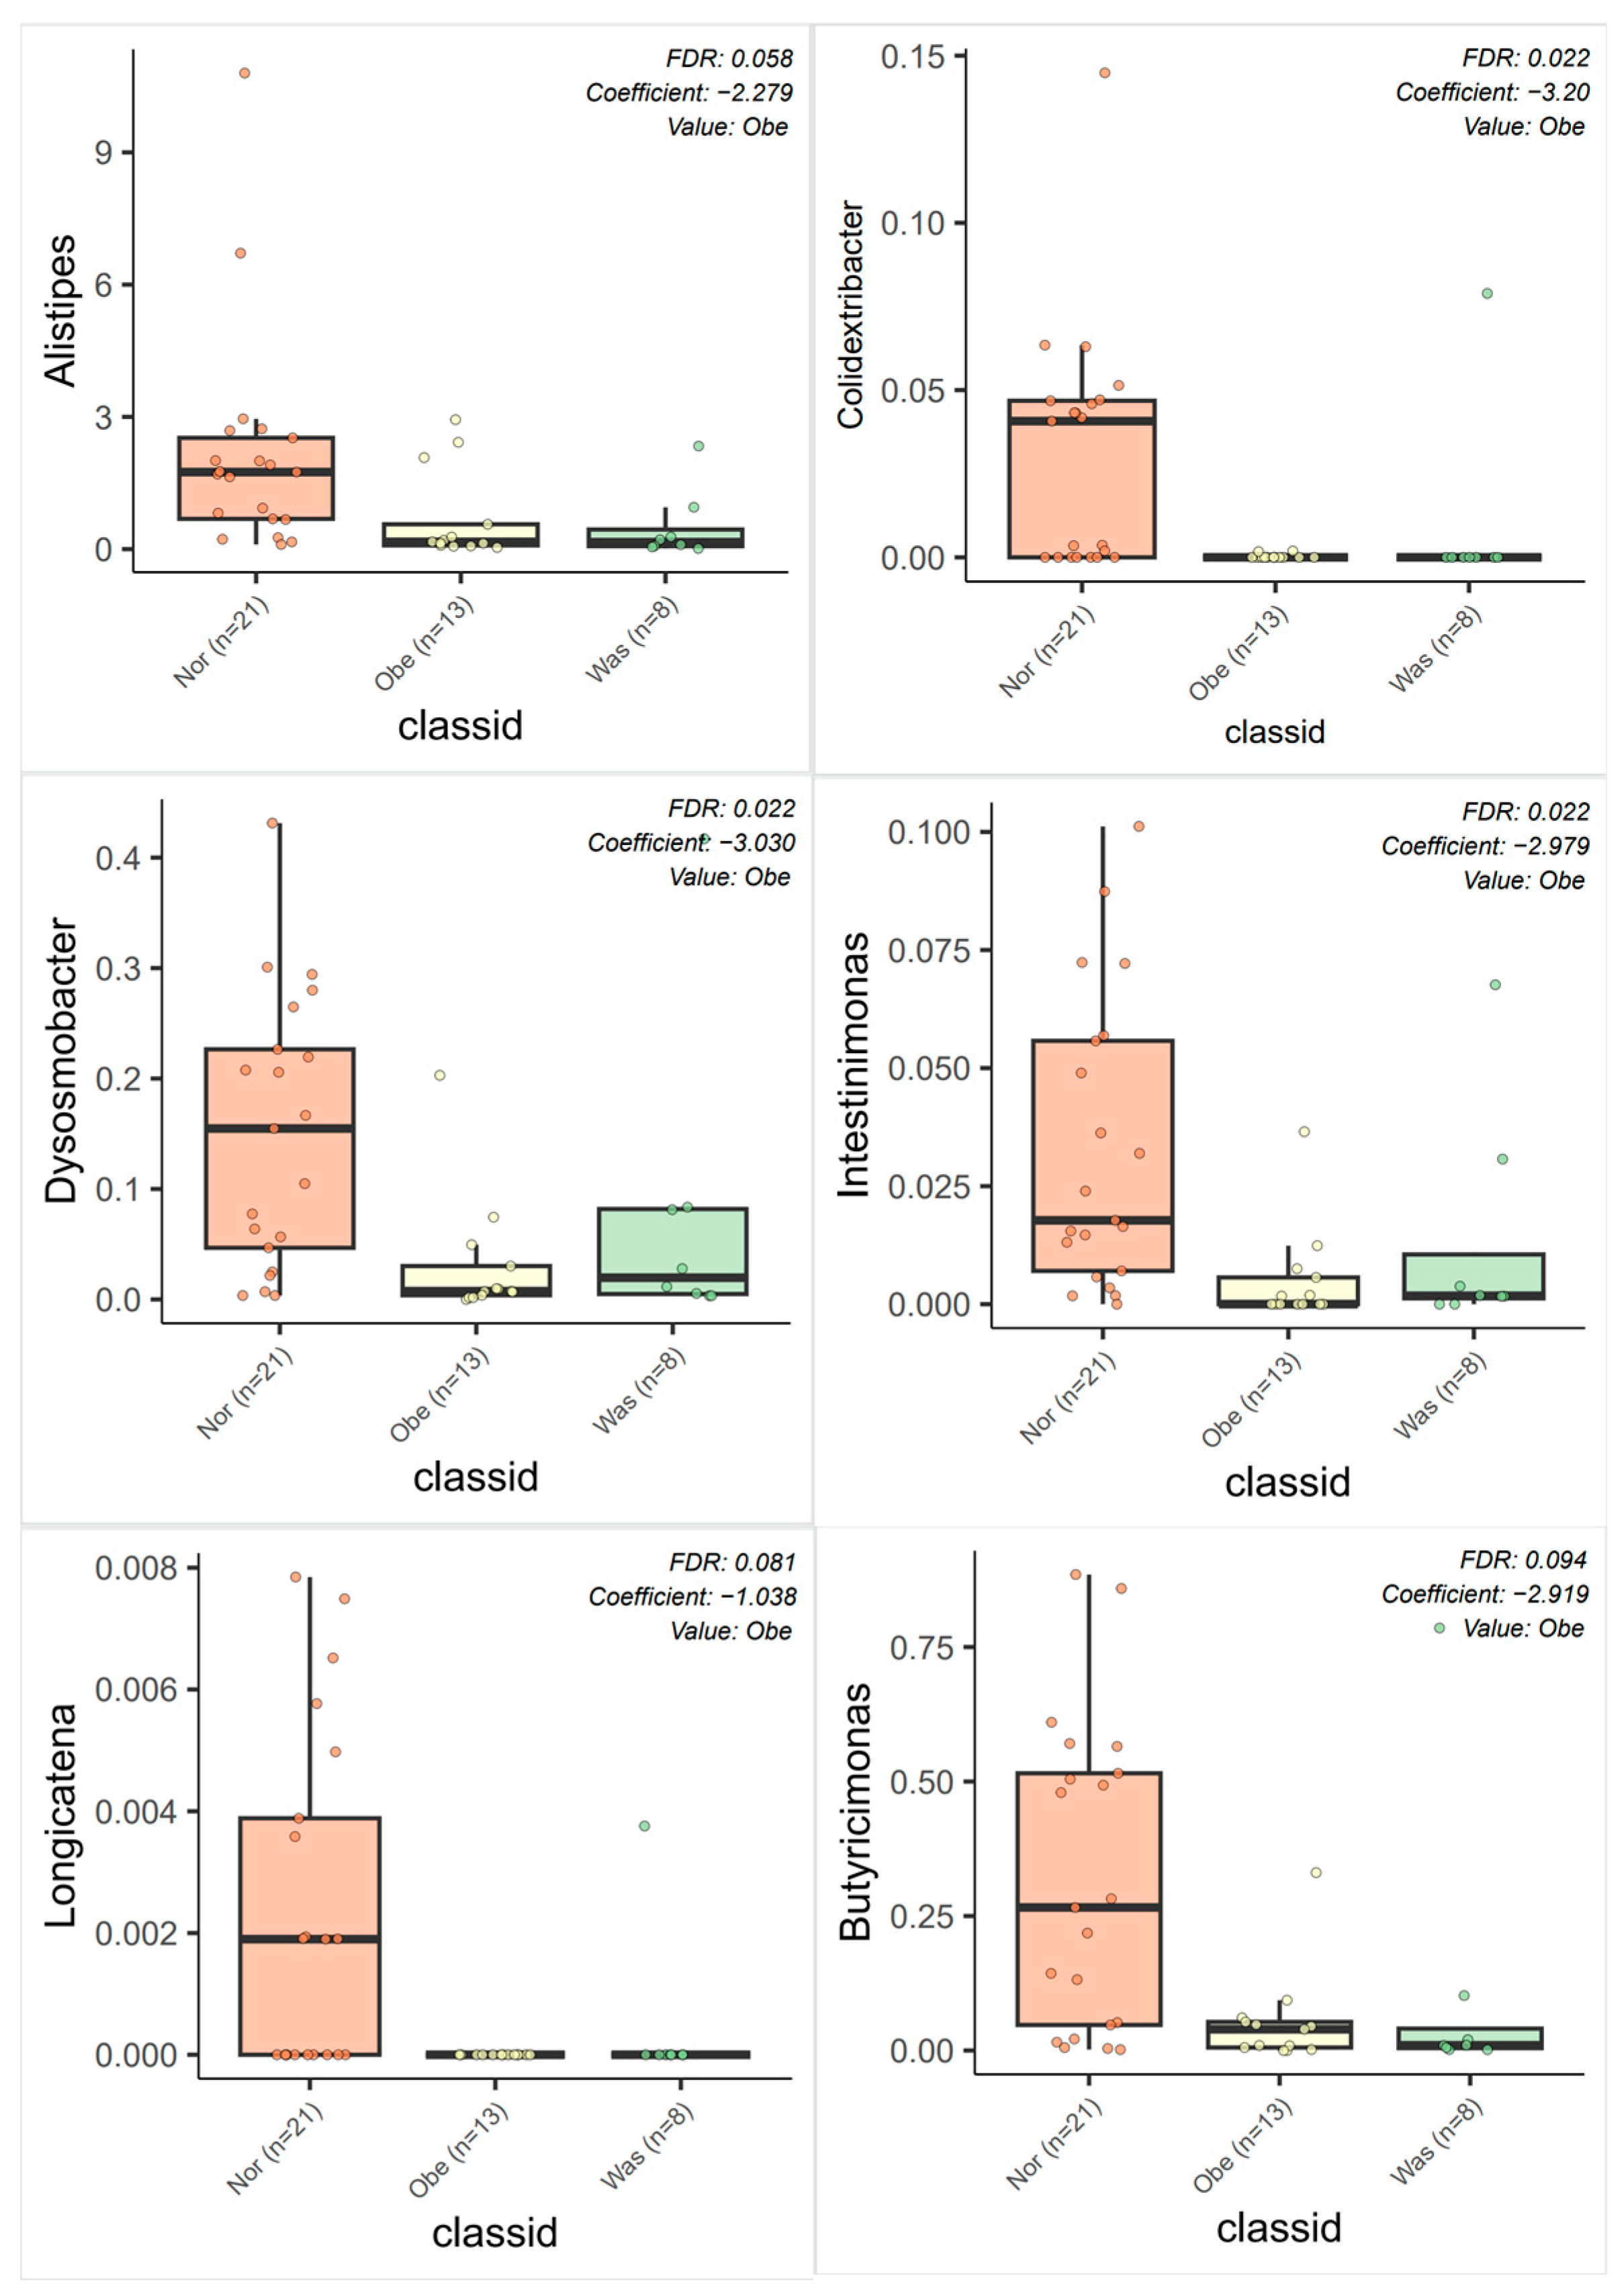
3.3.3. Differential Bacteria Screening
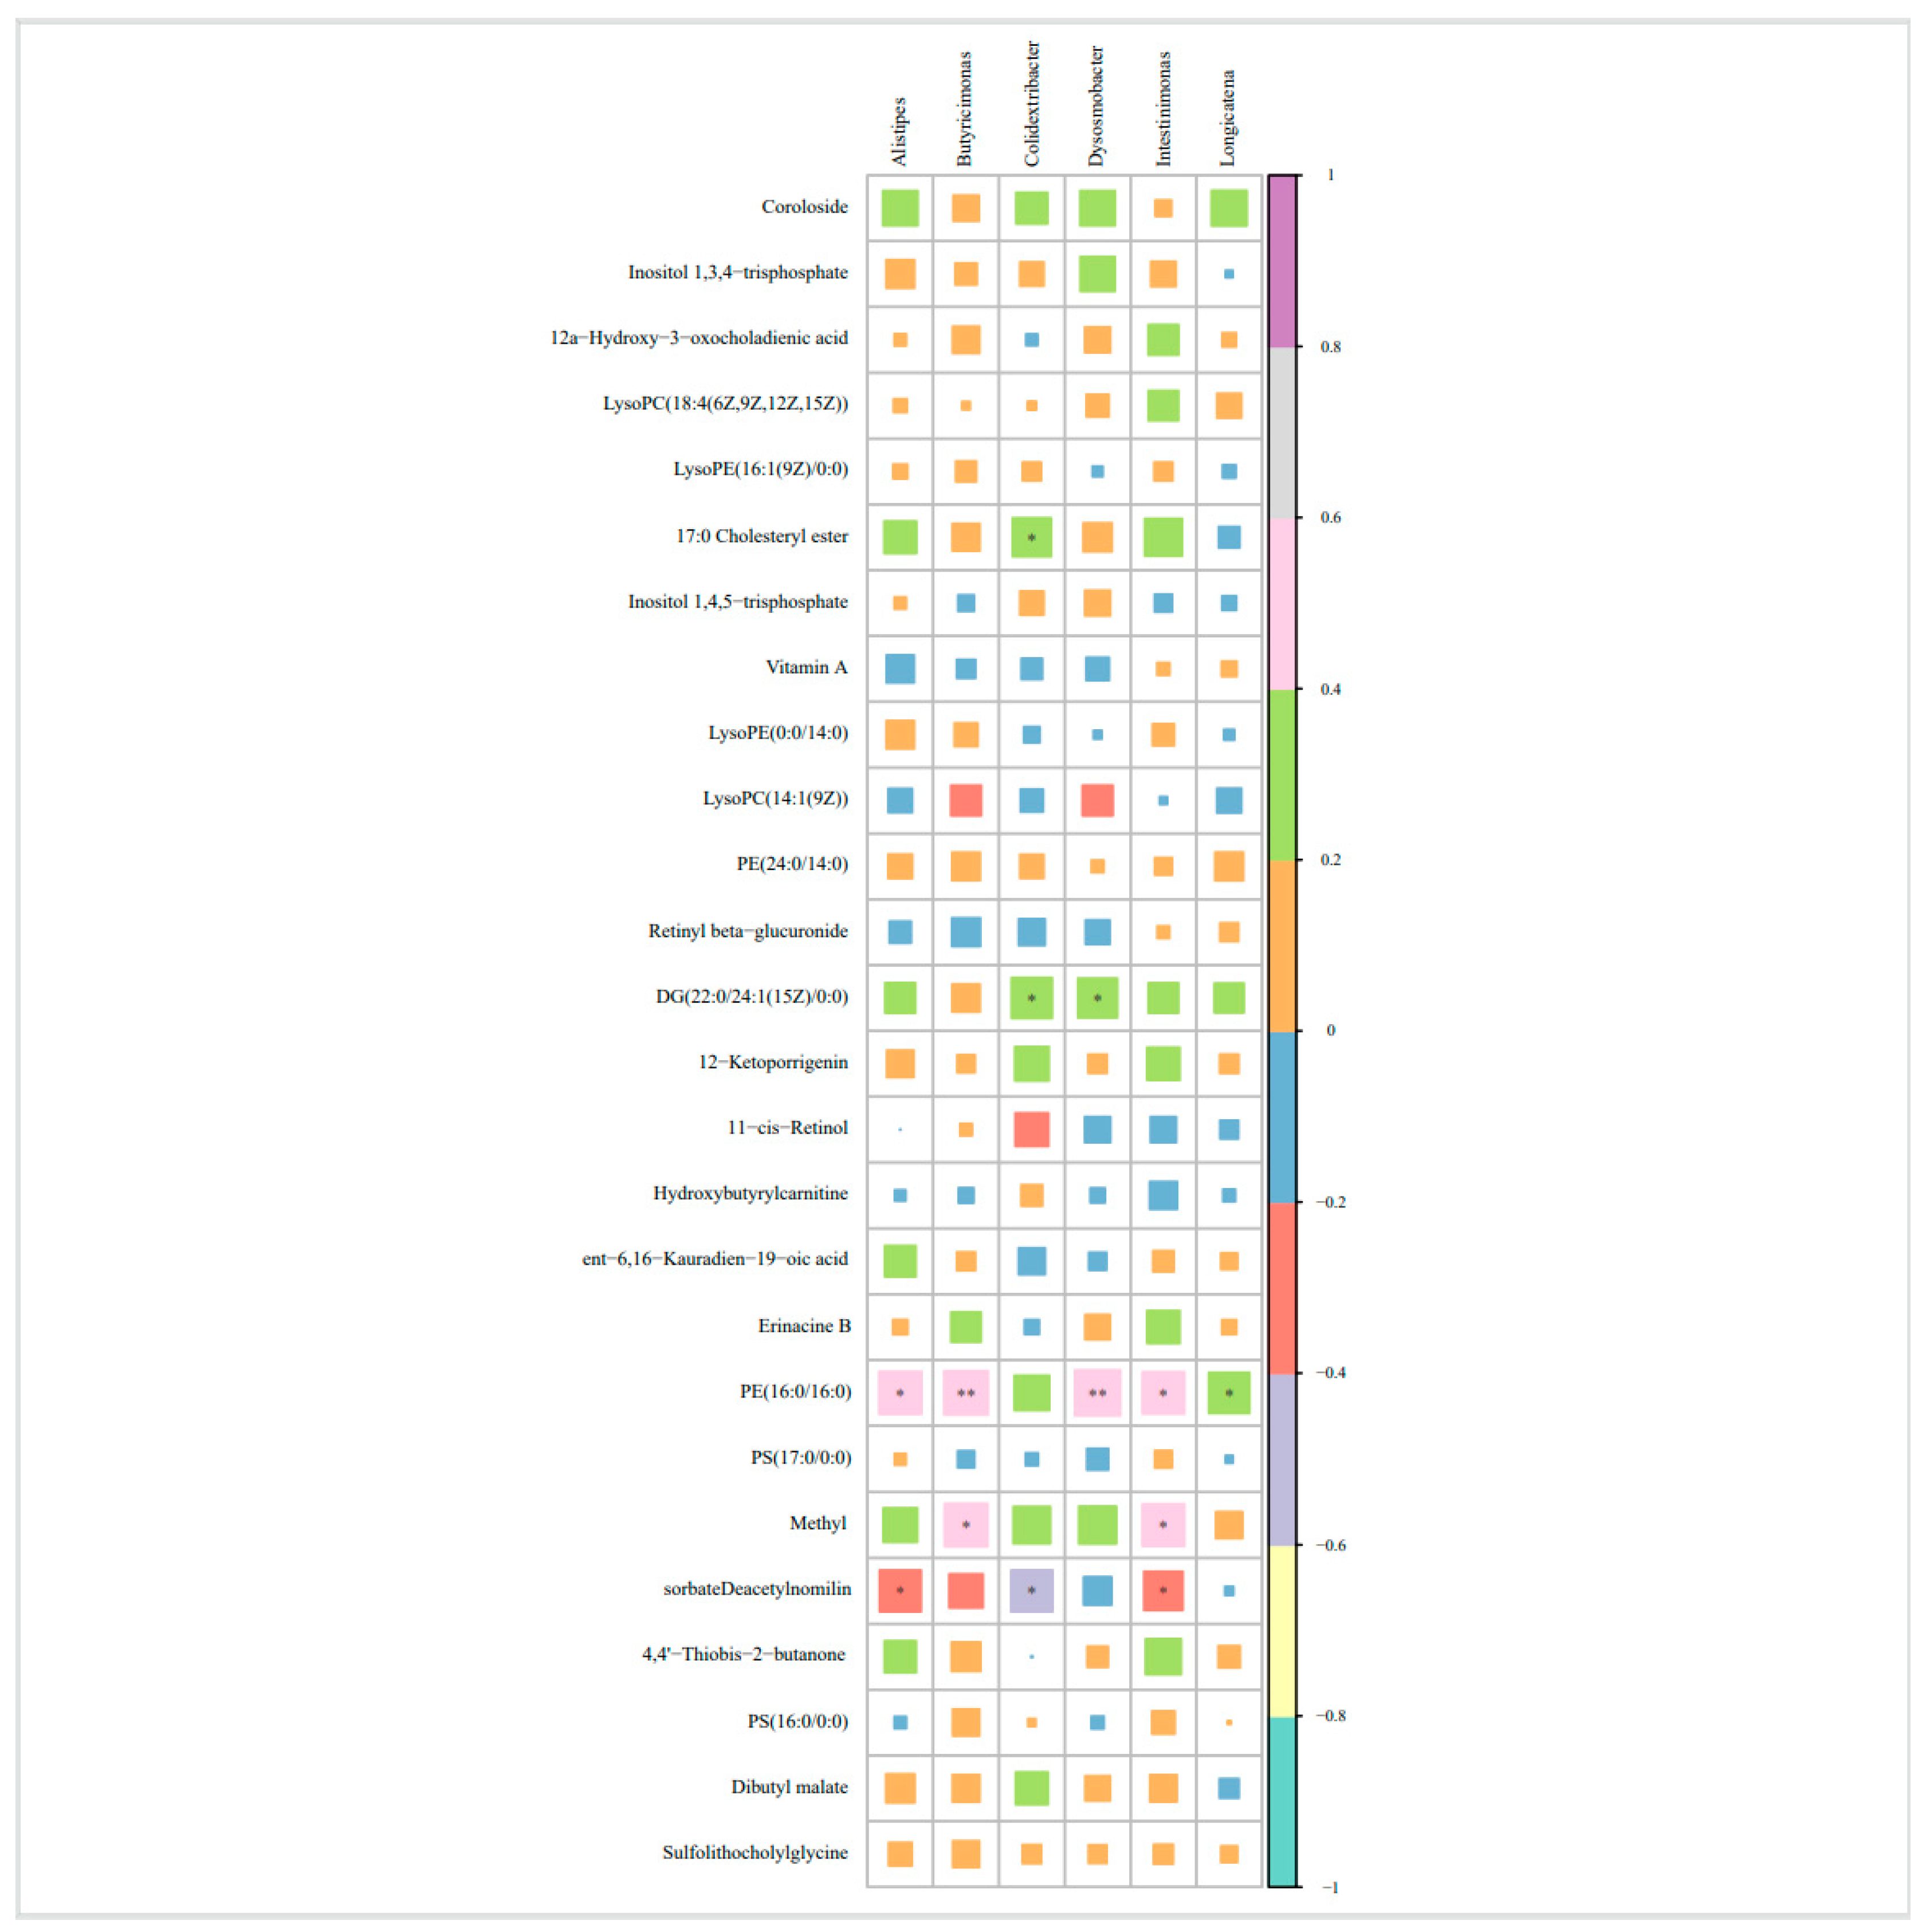
3.4. Correlation Analysis Between Differential Bacteria and Differential Metabolites
4. Discussion
5. Innovations and Limitations
6. Conclusions
Supplementary Materials
Author Contributions
Funding
Institutional Review Board Statement
Informed Consent Statement
Data Availability Statement
Conflicts of Interest
Abbreviations
| AAAs | Aromatic amino acids |
| ADP | Adiponectin |
| ALT | Alanine transaminase |
| AST | Aspartate aminotransferase |
| AUC | Area under the curve |
| BCAAs | Branched chain amino acids |
| BMI | Body mass index |
| BMIZ | Body mass index Z-scores |
| CI | Confidence interval |
| CRP-H | High-sensitivity C-reactive protein |
| DBP | Diastolic blood pressure |
| F/B | Firmicutes/Bacteroidetes |
| FBG | Fasting blood glucose |
| FC | Fold change |
| FDR | False discovery rate |
| GLUT4 | Glucose transporter type 4 |
| HDLC | High-density lipoprotein cholesterol |
| IRS-1 | Insulin receptor substrate 1 |
| LDL-C | Low-density lipoprotein cholesterol |
| LEfSe | Linear discriminant analysis effect size |
| LPC | Lysophosphatidylcholine |
| LysoPE | Lysophosphatidylethanolamine |
| MHO | Metabolically healthy obesity |
| MHWH | Metabolically healthy and normal weight |
| mTORC1 | Mechanistic target of rapamycin complex 1 |
| MUO | Metabolically unhealthy obesity |
| MUWH | Metabolically unhealthy and normal weight |
| NOR | Normal weight |
| OPLS-DA | Orthogonal projections to latent structures-discriminant analysis |
| OVOB | Overweight and obesity |
| PC | Phosphatidylcholine |
| PCA | Principal component analysis |
| PE | Phosphatidylethanolamine |
| PI | Phosphatidylinositol |
| PLS-DA | Partial least squares discriminant analysis |
| PPARγ | Peroxisome proliferator-activated receptor gamma |
| PRS | Polygenic risk score |
| PS | Phosphatidylserine |
| QC | Quality control |
| ROC | Receiver operating characteristic |
| SBP | Systolic blood pressure |
| SCFA | Short-chain fatty acid |
| SCL | Short-chain fatty acid-linked |
| TC | Total cholesterol |
| TG | Triglycerides |
| TLR4 | Toll-like receptor 4 |
| VIP | Variable importance in projection |
| WAS | Wasting |
Appendix A
Appendix A.1. Characteristics of Study Participants in the Metabolomics Analysis

| WAS (n = 55) | NOR (n = 121) | OVOB (n = 109) | All (n = 285) | F/χ2 | p | |
|---|---|---|---|---|---|---|
| Age a, m | 72.6 ± 5.7 | 73.1 ± 4.8 | 72.4 ± 6.5 | 73.2 ± 5.8 | 1.202 | 0.420 |
| Gender b | ||||||
| Boy | 30 (54.5) | 68 (56.2) | 66 (60.6) | 164 (57.5) | 0.70 | 0.706 |
| Girl | 25 (45.5) | 53 (43.8) | 43 (39.4) | 121 (42.5) | ||
| Height a, cm | 114.32 ± 5.02 | 116.75 ± 5.4 | 119.47 ± 5.47 | 117.33 ± 5.67 | 18.082 | <0.001 |
| Weight a, kg | 16.45 ± 1.63 | 20.57 ± 2.45 | 27.76 ± 4.99 | 22.54 ± 5.64 | 217.396 | <0.001 |
| BMIZ a | −2.35 ± 0.39 | −0.23 ± 0.68 | 2.16 ± 1.08 | 0.276 ± 1.86 | 594.642 | <0.001 |
| District b | ||||||
| Henan | 19 (12.8) | 73 (49.0) | 57 (38.3) | 149 (100) | 10.08 | 0.006 |
| Guizhou | 36 (26.5) | 48 (35.3) | 52 (38.2) | 136 (100) | ||
| Nation b | ||||||
| Han Chinese | 33 (15.9) | 97 (59.1) | 77 (47.0) | 207 (100) | 8.09 | 0.018 |
| Ethnic minorities | 22 (28.2) | 24 (19.8) | 32 (26.4) | 78 (100) | ||
| Birth weight a, g | 3077 ± 467 | 3256 ± 415 | 3434 ± 407 | 3285 ± 440 | 11.2 | <0.001 |
| Birth length a, cm | 49.83 ± 1.29 | 50.25 ± 1.32 | 50.44 ± 1.13 | 50.24 ± 1.26 | 3.62 | 0.028 |
| Breast feeding b | ||||||
| Yes | 43 (93.5) | 104 (88.9) | 68 (78.2) | 215 (86.0) | 7.39 | 0.025 |
| No | 3 (6.5) | 13 (11.1) | 19 (21.8) | 35 (14.0) | ||
| Duration of breastfeeding b, m | ||||||
| ≤6 | 7 (15.2) | 22 (18.8) | 25 (28.7) | 54 (21.6) | 19.17 | 0.001 |
| 6–12 | 9 (19.6) | 16 (13.7) | 28 (32.2) | 53 (21.2) | ||
| ≥12 | 30 (65.2) | 79 (67.5) | 34 (39.1) | 143 (57.2) | ||
| Premature delivery b | ||||||
| Yes | 2 (4.3) | 3 (2.6) | 2 (2.3) | 7 (2.8) | 0.509 | 0.776 |
| No | 44 (95.7) | 114 (97.4) | 85 (97.7) | 243 (97.2) | ||
| Delivery methods b | ||||||
| Vaginal delivery | 31 (67.4) | 69 (59) | 43 (49.4) | 143 (57.2) | 4.25 | 0.119 |
| Cesarean section | 15 (32.6) | 48 (41) | 44 (50.6) | 107 (42.8) | ||
| Only child b | ||||||
| Yes | 3 (6.5) | 22 (18.8) | 15 (17.2) | 40 (16.0) | 4.60 | 0.331 |
| No | 41 (89.1) | 93 (79.5) | 70 (80.5) | 204 (81.6) | ||
| Primary caregiving b | ||||||
| Parental care | 33 (71.7) | 87 (74.4) | 61 (70.1) | 181 (72.4) | 0.462 | 0.794 |
| Non-parental care | 13 (28.3) | 30 (25.6) | 26 (29.9) | 69 (27.6) | ||
| Educational level of caregivers b | ||||||
| Primary and below | 15 (32.6) | 38 (32.5) | 24 (27.6) | 77 (30.8) | 3.90 | 0.420 |
| Junior and senior high school | 26 (56.5) | 53 (45.3) | 47 (54) | 126 (50.4) | ||
| Above university level | 5 (10.9) | 26 (22.2) | 16 (18.4) | 47 (18.8) | ||
| Occupation of caregivers b | ||||||
| Housework | 25 (54.3) | 71 (60.7) | 51(58.6) | 147(58.8) | 0.549 | 0.760 |
| Agriculture related | 21 (45.7) | 46 (39.3) | 36(41.4) | 103(41.2) | ||
| Annual household economic income b (RMB/year) | ||||||
| <6 | 13 (46.43) | 63 (64.29) | 30 (57.7%) | 106 (59.55) | 3.04 | 0.39 |
| ≥6 | 15 (53.57) | 35 (35.71) | 22 (42.3%) | 72 (40.45) | ||
| MHW (n = 54) | MUWH (n = 67) | MHO (n = 36) | MUO (n = 73) | ALL (n = 230) | F | p | |
|---|---|---|---|---|---|---|---|
| TCHO a, mmol/L | 4.24 ± 0.69 | 4.22 ± 0.8 | 4.44 ± 0.48 | 4.27 ± 0.98 | 4.27 ± 0.8 | 0.664 | 0.575 |
| TG a, mmol/L | 0.99 ± 0.31 | 1.09 ± 0.47 | 1.06 ± 0.33 | 1.67 ± 1.12 | 1.25 ± 0.76 | 13.097 | <0.001 |
| HDL-C a, mmol/L | 1.63 ± 0.28 | 1.52 ± 0.57 | 1.62 ± 0.27 | 1.46 ± 0.48 | 1.54 ± 0.45 | 1.878 | 0.134 |
| LDL-C a, mmol/L | 1.65 ± 0.39 | 1.5 ± 0.53 | 1.8 ± 0.37 | 1.64 ± 0.54 | 1.63 ± 0.49 | 3.037 | 0.030 |
| GLU a, mmol/L | 5.06 ± 0.8 | 5.58 ± 1.71 | 5.02 ± 0.93 | 5.61 ± 1.48 | 5.38 ± 1.37 | 3.033 | 0.030 |
| ADP a, μg/mL | 15.88 ± 5.31 | 14.1 ± 5.83 | 12.31 ± 5.31 | 13.56 ± 6.53 | 14.07 ± 5.95 | 2.973 | 0.033 |
| ALT a, U/L | 10.43 ± 4.32 | 10.21 ± 3.56 | 12.3 ± 4.64 | 14.03 ± 10.91 | 11.81 ± 7.19 | 4.31 | 0.006 |
| AST a, U/L | 27.87 ± 5.95 | 26.76 ± 4.82 | 26.77 ± 5.18 | 28.74 ± 13.07 | 27.66 ± 8.59 | 0.76 | 0.518 |
| CRP-H a, mg/L | 0.73 ± 1.24 | 0.9 ± 1.84 | 2.96 ± 6.78 | 1.64 ± 2.72 | 1.42 ± 3.36 | 4.064 | 0.008 |
| Hb a, g/dL | 136.09 ± 9.55 | 137.12 ± 9.63 | 138.78 ± 8.96 | 140.71 ± 7.16 | 138.29 ± 8.92 | 3.388 | 0.019 |
| SBP, mmHg | 109.2 ± 6.8 | 118.15 ± 8.47 | 107.47 ± 5.12 | 116.83 ± 9.87 | 113.91 ± 9.25 | 22.362 | <0.001 |
| DBP, mmHg | 69.2 ± 6.8 | 78.68 ± 7.76 | 67.47 ± 5.12 | 77.83 ± 8.21 | 74.38 ± 8.73 | 32.357 | <0.001 |
Appendix A.2. Multivariate Logistic Regression Analysis of Differential Metabolites
| Variables | β | S.E. | Wald | p | OR (95% CI) |
|---|---|---|---|---|---|
| Nation | 1.234 | 0.475 | 6.756 | 0.009 | 3.434 (1.355–8.708) |
| Birth weight | 0.002 | 0.001 | 17.534 | <0.001 | 1.002 (1.001–1.003) |
| Vitamin A | 0.004 | 0.002 | 8.019 | 0.005 | 1.004 (1.001–1.007) |
| CRP-H | 0.260 | 0.088 | 8.803 | 0.003 | 1.297 (1.092–1.540) |
| Coroloside | −0.008 | 0.003 | 6.161 | 0.013 | 0.992 (0.986–0.998) |
| 17:0 Cholesteryl ester | −0.001 | 0.000 | 14.201 | <0.001 | 0.999 (0.998–0.999) |
| LysoPC(14:1) | 0.000 | 0.000 | 5.115 | 0.024 | 1.000 (1.000–1.001) |
| Retinyl beta-glucuronide | 0.004 | 0.002 | 5.169 | 0.023 | 1.004 (1.001–1.007) |
| Sulfolithocholyl glycine | −0.003 | 0.001 | 6.320 | 0.012 | 0.997 (0.995–0.999) |
| Cyclocalopin E | −0.001 | 0.000 | 13.516 | <0.001 | 0.999 (0.998–0.999) |
| Cortisone acetate | 0.002 | 0.001 | 8.141 | 0.004 | 1.002 (1.000–1.003) |
| Variables | β | S.E. | Wald | p | OR (95% CI) |
|---|---|---|---|---|---|
| ALT | 0.123 | 0.059 | 4.384 | 0.036 | 1.131 (1.008–1.269) |
| CRP-H | −0.219 | 0.080 | 7.396 | 0.007 | 0.804 (0.686–0.941) |
| Hexaethylene glycol | −0.002 | 0.001 | 7.344 | 0.007 | 0.998 (0.997–1.000) |
| Elenaic acid | 0.004 | 0.002 | 6.782 | 0.009 | 1.004 (1.001–1.007) |
| Treosulfan | 0.001 | 0.000 | 13.968 | <0.001 | 1.001 (1.001–1.002) |
| LysoPE (16:0/0:0) | 0.000 | 0.000 | 11.078 | 0.001 | 1.000 (1.000–1.000) |
| N′-Formylkynurenine | 0.009 | 0.003 | 8.768 | 0.003 | 1.009 (1.003–1.015) |
| PS (P-20:0/0:0) | 0.007 | 0.002 | 12.149 | <0.001 | 1.007 (1.003–1.011) |
| PI (16:0/14:1) | −0.005 | 0.001 | 13.201 | <0.001 | 0.995 (0.993–0.998) |
Appendix A.3. Metabolomics Quality Control Results
Appendix A.4. Characteristics of Study Participants in the Gut Microbiota
| ALL (n = 42) | NOR (n = 21) | OVOB (n = 13) | WAS (n = 8) | χ2 | p | |
|---|---|---|---|---|---|---|
| Age a, m | 76.6 ± 5.21 | 77.04 ± 4.66 | 76 ± 6.02 | 76.4 ± 5.8 | 0.159 | 0.853 |
| Gender b | ||||||
| Boy | 24 (57.1) | 11 (52.4) | 8 (61.5) | 5 (62.5) | 0.10 | 0.950 |
| Girl | 18 (42.9) | 10 (47.6) | 5 (38.5) | 3 (37.5) | ||
| Birth weight a, g | 3.33 ± 0.42 | 3.30.43 ± 0.31 | 3.53 ± 0.57 | 3.09 ± 0.24 | 3.146 | 0.054 |
| Delivery methods b | ||||||
| Vaginal delivery | 20 (58.2) | 8 (50.0) | 7 (63.6) | 5 (71.4) | 1.08 | 0.580 |
| Cesarean section | 14 (41.2) | 8 (50.0) | 4 (36.4) | 2 (28.6) | ||
| Breast feeding b | ||||||
| Yes | 31 (73.8) | 16 (76.2) | 9 (69.2) | 6 (75.0) | 0.21 | 0.90 |
| No | 11 (26.2) | 5 (23.8) | 4 (30.8) | 2 (25.0) | ||
| Duration of breastfeeding b, m | 12 (10–15) | 12 (10–15) | 11.5 (10–18) | 13 (12–15) | 0.23 | 0.89 |
| Grains and tubers ac, g | 195.9 (109.4, 267.6) | 200.4 (127.6, 273.4) | 168.4 (67.9, 255.6) | 172.8 (74.6, 254.9) | 1.382 | 0.501 |
| Vegetables ac, g | 53.6 (17.9, 166.2) | 64.3 (15.3, 169.1) | 57.1 (26.3, 193.8) | 26.8 (9.4, 129.7) | 1.520 | 0.468 |
| Fruits ac, g | 72 (32, 193.9) | 107.1 (37, 226.2) | 71.4 (38.8, 150.4) | 36.6 (19.3, 140.5) | 1.941 | 0.379 |
| Meat ac, g | 40.8 (20.7, 100.8) | 34.7 (15.5, 113.5) | 67.3 (23.8, 112.7) | 38.1 (14.7, 100) | 0.463 | 0.793 |
| Red meat ac, g | 24.6 (9.2, 67.9) | 22.3 (7.7, 87.1) | 35.7 (8.7, 93.8) | 21.7 (11.6, 56.7) | 0.094 | 0.954 |
| Milk and dairy products ac, g | 71.4 (0, 184.4) | 66.7 (0, 197.3) | 89.3 (23.8, 281.8) | 83.3 (24.6, 141.1) | 0.742 | 0.690 |
| Eggs ac, g | 26.8 (10, 38.6) | 26.8 (11.1, 41.9) | 26.8 (9.5, 38.8) | 29 (10.1, 37.7) | 0.190 | 0.909 |
| Fish ac, g | 0 (0, 0) | 0 (0, 0) | 0 (0, 4.5) | 0 (0, 12.1) | 1.893 | 0.388 |
| Snacks high in sugar and fat ac, g | 35.7 (9.6, 56.7) | 50 (10.7, 62.1) | 17.1 (4.3, 39.6) | 46.4 (21.1, 59.5) | 4.029 | 0.133 |
| Sugary drinks ac, mL | 78.6 (0, 121.4) | 42.9 (0, 201.8) | 28.6 (0, 91.1) | 107.1 (32.1, 237.5) | 3.391 | 0.183 |
| Energy intake ac, Kcal | 1320.4 (976.2, 1637.5) | 1320.6 (1137.7, 1743.9) | 1309.6 (558.7, 1493.1) | 1376.9 (684.5, 1609.5) | 1.226 | 0.542 |
References
- Tumas, N.; López, S.R. Double burden of underweight and obesity: Insights from new global evidence. Lancet 2024, 403, 998–999. [Google Scholar] [CrossRef] [PubMed]
- GBD 2021 Adult BMI Collaborators. Global, regional, and national prevalence of adult overweight and obesity, 1990–2021, with forecasts to 2050: A forecasting study for the Global Burden of Disease Study 2021. Lancet 2025, 405, 813–838. [Google Scholar] [CrossRef] [PubMed]
- Wang, Y.; Zhao, L.; Gao, L.; Pan, A.; Xue, H. Health policy and public health implications of obesity in China. Lancet Diabetes Endocrinol. 2021, 9, 446–461. [Google Scholar] [CrossRef] [PubMed]
- Dong, Y.; Lau, P.W.C.; Dong, B.; Zou, Z.; Yang, Y.; Wen, B.; Ma, Y.; Hu, P.; Song, Y.; Ma, J.; et al. Trends in physical fitness, growth, and nutritional status of Chinese children and adolescents: A retrospective analysis of 1·5 million students from six successive national surveys between 1985 and 2014. Lancet Child Adolesc. Health 2019, 3, 871–880. [Google Scholar] [CrossRef]
- Pan, X.F.; Fang, Z.Z. Obesity in China: What we know and what we can do. Lancet Public Health 2024, 9, E1000–E1001. [Google Scholar] [CrossRef]
- Lister, N.B.; Baur, L.A. Child and adolescent obesity. Nat. Rev. Dis. Primers 2023, 9, 24. [Google Scholar] [CrossRef]
- Schulze, M.B.; Stefan, N. Metabolically healthy obesity: From epidemiology and mechanisms to clinical implications. Nat. Rev. Endocrinol. 2024, 20, 633–646. [Google Scholar] [CrossRef]
- Gaikwad, S.; Bhavnagarwala, A. American Academy of Pediatrics, 2023: Guideline for the Evaluation and Treatment of Children and Adolescents With Obesity. Indian Pediatr 2023, 60, 759–761. [Google Scholar] [CrossRef]
- Woldemariam, S.; Dorner, T.E.; Wiesinger, T.; Stein, K.V. Multi-omics approaches for precision obesity management: Potentials and limitations of omics in precision prevention, treatment and risk reduction of obesity. Wien Klin Wochenschr 2023, 135, 113–124. [Google Scholar] [CrossRef]
- Voruganti, V.S. Precision Nutrition: Recent Advances in Obesity. Physiology 2023, 38, 0. [Google Scholar] [CrossRef]
- Abiri, B.; Valizadeh, M.; Amini, S.; Kelishadi, R.; Hosseinpanah, F. Risk factors, cutoff points, and definition of metabolically healthy/unhealthy obesity in children and adolescents: A scoping review of the literature. Obes. Rev. 2023, 24, e13548. [Google Scholar] [CrossRef] [PubMed]
- Ramos-Lopez, O.; Riezu-Boj, J.I.; Milagro, F.I. Genetic and epigenetic nutritional interactions influencing obesity risk and adiposity outcomes. Curr. Opin. Clin. Nutr. Metab. Care 2022, 25, 235–240. [Google Scholar] [CrossRef] [PubMed]
- Liang, Y.; Pan, C.; Yin, T.; Wang, L.; Gao, X.; Wang, E.; Quang, H.; Huang, D.; Tan, L.; Xiang, K.; et al. Branched-Chain Amino Acid Accumulation Fuels the Senescence-Associated Secretory Phenotype. Adv. Sci. 2024, 11, e2303489. [Google Scholar] [CrossRef] [PubMed]
- Siddik, M.A.B.; Shin, A.C. Recent Progress on Branched-Chain Amino Acids in Obesity, Diabetes, and Beyond. Endocrinol. Metab. 2019, 34, 234–246. [Google Scholar] [CrossRef]
- Sumińska, M.; Podgórski, R. The Impact of Obesity on the Excretion of Steroid Metabolites in Boys and Girls: A Comparison with Normal-Weight Children. Nutrients 2023, 15, 1734. [Google Scholar] [CrossRef]
- Huang, Y.; Sulek, K.; Stinson, S.E. Lipid profiling identifies modifiable signatures of cardiometabolic risk in children and adolescents with obesity. Nat. Med. 2025, 31, 294–305. [Google Scholar] [CrossRef]
- Robinson, T.N.; Armstrong, S.C. Treatment Interventions for Child and Adolescent Obesity: From Evidence to Recommendations to Action. JAMA 2024, 332, 201–203. [Google Scholar] [CrossRef]
- Borrego-Ruiz, A.; Borrego, J.J. Human gut microbiome, diet, and mental disorders. Int. Microbiol. 2025, 28, 1–15. [Google Scholar] [CrossRef]
- Wang, J.; Zhuang, P.; Lin, B.; Li, H.; Zheng, J.; Tang, W.; Ye, W.; Chen, X.; Zheng, M. Gut microbiota profiling in obese children from Southeastern China. BMC Pediatr. 2024, 24, 193. [Google Scholar] [CrossRef]
- Ma, T.; Wu, Z.; Lin, J.; Shan, C.; Abasijiang, A.; Zhao, J. Characterization of the oral and gut microbiome in children with obesity aged 3 to 5 years. Front. Cell. Infect. Microbiol. 2023, 13, 1102650. [Google Scholar] [CrossRef]
- Chen, X.; Sun, H.; Jiang, F.; Shen, Y.; Li, X.; Hu, X.; Shen, X.; Wei, P. Alteration of the gut microbiota associated with childhood obesity by 16S rRNA gene sequencing. PeerJ 2020, 8, e8317. [Google Scholar] [CrossRef] [PubMed]
- Niu, H.; Zhou, M.; Zogona, D.; Xing, Z.; Wu, T.; Chen, R.; Cui, D.; Liang, F.; Xu, X. Akkermansia muciniphila: A potential candidate for ameliorating metabolic diseases. Front. Immunol. 2024, 15, 1370658. [Google Scholar] [CrossRef]
- Yang, Y.; Chen, J.; Gao, H.; Cui, M.; Zhu, M.; Xiang, X.; Wang, Q. Characterization of the gut microbiota and fecal and blood metabolomes under various factors in urban children from Northwest China. Front. Cell. Infect. Microbiol. 2024, 14, 1374544. [Google Scholar] [CrossRef]
- Sankararaman, S.; Noriega, K.; Velayuthan, S.; Sferra, T.; Martindale, R. Gut Microbiome and Its Impact on Obesity and Obesity-Related Disorders. Curr. Gastroenterol. Rep. 2023, 25, 31–44. [Google Scholar] [CrossRef]
- Murga-Garrido, S.M.; Ulloa-Pérez, E.J. Virulence Factors of the Gut Microbiome Are Associated with BMI and Metabolic Blood Parameters in Children with Obesity. Microbiol. Spectr. 2023, 11, e0338222. [Google Scholar] [CrossRef] [PubMed]
- Tang, M.; Marroquin, E. The role of the gut microbiome in the intergenerational transmission of the obesity phenotype: A narrative review. Front. Med. 2022, 9, 1057424. [Google Scholar] [CrossRef]
- Mann, E.R.; Lam, Y.K. Short-chain fatty acids: Linking diet, the microbiome and immunity. Nat. Rev. Immunol. 2024, 24, 577–595. [Google Scholar] [CrossRef] [PubMed]
- Wu, X.; Xia, Y.; He, F.; Zhu, C.; Ren, W. Intestinal mycobiota in health and diseases: From a disrupted equilibrium to clinical opportunities. Microbiome 2021, 9, 60. [Google Scholar] [CrossRef]
- Damanhoury, S.; Newton, A.S.; Rashid, M.; Hartling, L.; Byrne, J.L.S.; Ball, G.D.C. Defining metabolically healthy obesity in children: A scoping review. Obes. Rev. 2018, 19, 1476–1491. [Google Scholar] [CrossRef]
- WS/T 424-2013; Anthropometric measurements method in health surveillance. National Health Commission: Beijing, China, 2013.
- Flynn, J.T.; Kaelber, D.C.; Baker-Smith, C.M.; Blowey, D.; Carroll, A.E.; Daniels, S.R.; de Ferranti, S.D.; Dionne, J.M.; Falkner, B.; Flinn, S.K.; et al. Clinical Practice Guideline for Screening and Management of High Blood Pressure in Children and Adolescents. Pediatrics 2017, 140, e20171904. [Google Scholar] [CrossRef]
- WS/T 553-2017; Method for Vitamin A Deficiency Screening. National Health Commission: Beijing, China, 2017.
- WS/T 677-2020; Method for Vitamin D Deficiency Screening. National Health Commission: Beijing, China, 2020.
- He, Y.; Wu, W.; Zheng, H.M.; Li, P.; McDonald, D.; Sheng, H.F.; Chen, M.X.; Chen, Z.H.; Ji, G.Y.; Zheng, Z.D.; et al. Regional variation limits applications of healthy gut microbiome reference ranges and disease models. Nat. Med. 2018, 24, 1532–1535. [Google Scholar] [CrossRef] [PubMed]
- Fallani, M.; Young, D.; Scott, J.; Norin, E.; Amarri, S.; Adam, R.; Aguilera, M.; Khanna, S.; Gil, A.; Edwards, C.A.; et al. Intestinal microbiota of 6-week-old infants across Europe: Geographic influence beyond delivery mode, breast-feeding, and antibiotics. J. Pediatr. Gastroenterol. Nutr. 2010, 51, 77–84. [Google Scholar] [CrossRef] [PubMed]
- Bliesner, A.; Eccles-Smith, J.; Bates, C.; Hayes, O.; Ho, J.Y.; Martins, C.; Truby, H.; Nitert, M.D. Impact of Food-Based Weight Loss Interventions on Gut Microbiome in Individuals with Obesity: A Systematic Review. Nutrients 2022, 14, 1953. [Google Scholar] [CrossRef]
- Dewey, K.G.; Güngör, D. Breastfeeding and risk of overweight in childhood and beyond: A systematic review with emphasis on sibling-pair and intervention studies. Am. J. Clin. Nutr. 2021, 114, 1774–1790. [Google Scholar] [CrossRef]
- Sumińska, M.; Podgórski, R.; Fichna, P.; Fichna, M. Steroid Metabolism in Children and Adolescents With Obesity and Insulin Resistance: Altered SRD5A and 20α/20βHSD Activity. Front. Endocrinol. 2021, 12, 759971. [Google Scholar] [CrossRef]
- Gaich, G.; Chien, J.Y.; Fu, H.; Glass, L.C.; Deeg, M.A.; Holland, W.L.; Kharitonenkov, A.; Bumol, T.; Schilske, H.K.; Moller, D.E. The effects of LY2405319, an FGF21 analog, in obese human subjects with type 2 diabetes. Cell Metab. 2013, 18, 333–340. [Google Scholar] [CrossRef] [PubMed]
- Xie, P.; Xie, J.B.; Xiao, M.Y.; Guo, M.; Qi, Y.S.; Li, F.F.; Piao, X.L. Liver lipidomics analysis reveals the anti-obesity and lipid-lowering effects of gypnosides from heat-processed Gynostemma pentaphyllum in high-fat diet fed mice. Phytomedicine 2023, 115, 154834. [Google Scholar] [CrossRef]
- Barker, C.J.; Tessaro, F.H.G.; Ferreira, S.S.; Simas, R.; Ayala, T.S.; Köhler, M.; Rajasekaran, S.S.; Martins, J.O.; Darè, E.; Berggren, P.O. XPR1 Mediates the Pancreatic β-Cell Phosphate Flush. Diabetes 2021, 70, 111–118. [Google Scholar] [CrossRef]
- Telle-Hansen, V.H.; Christensen, J.J.; Formo, G.A.; Holven, K.B.; Ulven, S.M. A comprehensive metabolic profiling of the metabolically healthy obesity phenotype. Lipids Health Dis. 2020, 19, 90. [Google Scholar] [CrossRef]
- Inthanon, K.; Wong, A.N.N.; Dheeranupattana, S.; Guerra, A.G.; Davies, N.M.; Kesornpun, C.; Sangher, S.; Kittakoop, P. Regulation of adipocyte differentiation and lipid metabolism by novel synthetic chromenes exploring anti-obesity and broader therapeutic potential. Sci. Rep. 2025, 15, 4051. [Google Scholar] [CrossRef]
- You, H.; Tan, Y.; Yu, D.; Qiu, S.; Bai, Y.; He, J.; Cao, H.; Che, Q.; Guo, J.; Su, Z. The Therapeutic Effect of SCFA-Mediated Regulation of the Intestinal Environment on Obesity. Front. Nutr. 2022, 9, 886902. [Google Scholar] [CrossRef] [PubMed]
- Vance, J.E.; Tasseva, G. Formation and function of phosphatidylserine and phosphatidylethanolamine in mammalian cells. Biochim. Biophys. Acta 2013, 1831, 543–554. [Google Scholar] [CrossRef] [PubMed]
- Prabutzki, P.; Schiller, J.; Engel, K.M. Phospholipid-derived lysophospholipids in (patho)physiology. Atherosclerosis 2024, 398, 118569. [Google Scholar] [CrossRef] [PubMed]
- Lin, J.; Liu, H.; Sun, Y.; Zou, J.; Nie, Q.; Nie, S. Arabinoxylan Alleviates Obesity by Regulating Gut Microbiota and Bile Acid Metabolism. J. Agric. Food Chem. 2024, 72, 23295–23305. [Google Scholar] [CrossRef]


| All (n = 285) | WAS (n = 55) | NOR | OVOB | F/χ2 | p | |||||
|---|---|---|---|---|---|---|---|---|---|---|
| MHWH (n = 54) | MUWH (n = 67) | All (n = 121) | MHO (n = 36) | MUO (n = 73) | All (n = 109) | |||||
| Age a, m | 73.2 ± 5.8 | 72.6 ± 5.7 | 72.9 ± 4.7 | 73.2 ± 4.8 | 73.1 ± 4.8 | 73.9 ± 6.2 | 71.7 ± 6.6 | 72.4 ± 6.5 | 1.772 | 0.149 |
| Gender b | ||||||||||
| Boy | 164 (57.5) | 30 (54.5) | 30 (18.3) | 38 (23.2) | 68 (56.2) | 20 (12.2) | 46 (28) | 66 (60.6) | 1.261 | 0.868 |
| Girl | 121 (42.5) | 25 (45.5) | 24 (19.8) | 29 (24) | 53 (43.8) | 16 (13.2) | 27 (22.3) | 43 (39.4) | ||
| BMIZ a,c | 0.276 ± 1.86 | −2.35 ± 0.39 | −0.37 ± 0.65 | −0.12 ± 0.68 | −0.23 ± 0.68 | 2.1 ± 1.11 | 2.18 ± 1.06 | 2.16 ± 1.08 | 298.987 | <0.001 |
| District b | ||||||||||
| Henan | 149 (100.0) | 19 (12.8) | 36 (24.2) | 37 (24.8) | 73 (49.0) | 24 (16.1) | 3 3(22.1) | 57 (38.3) | 16.098 | 0.003 |
| Guizhou | 136 (100.0) | 36 (26.5) | 18 (13.2) | 30 (22.1) | 48 (35.3) | 12 (8.8) | 40 (29.4) | 52 (38.2) | ||
| Nation b | ||||||||||
| Han Chinese | 207 (100) | 33 (15.9) | 44 (21.3) | 53 (25.6) | 97 (59.1) | 27 (13) | 50 (24.2) | 77 47.0) | 8.685 | 0.069 |
| Ethnic minorities | 78 (100) | 22 (28.2) | 10 (12.8) | 14 (17.9) | 24 (19.8) | 9 (11.5) | 23 (29.5) | 32 (26.4) | ||
| Birth weight a, kg | 3.29 ± 0.44 | 3.08 ± 0.47 | 3.25 ± 0.40 | 3.26 ± 0.43 | 3.26 ± 0.42 | 3.47 ± 0.36 | 3.41 ± 0.43 | 3.43 ± 0.41 | 3.225 | 0.024 |
| Birth height a, cm | 50.24 ± 1.26 | 49.83 ± 1.29 | 50.09 ± 1.21 | 50.38 ± 1.39 | 50.25 ± 1.32 | 50.48 ± 1.26 | 50.41 ± 1.06 | 50.44 ± 1.13 | 0.918 | 0.433 |
| Breast feeding b | ||||||||||
| Yes | 215 (86.0) | 43 (93.5) | 46 (90.2) | 58 (87.9) | 104 (88.9) | 29 (93.5) | 39 (69.6) | 68 (78.2) | 13.08 | 0.004 |
| No | 35 (14.0) | 3 (6.5) | 5 (9.8) | 8 (12.1) | 13 (11.1) | 2 (6.5) | 17 (30.4) | 19 (21.8) | ||
| Duration of breastfeeding b, m | ||||||||||
| ≤6 | 54 (21.6) | 7 (15.2) | 11 (21.6) | 11 (16.7) | 22 (18.8) | 6 (19.4) | 19 (33.9) | 25 (28.7) | 35.06 | <0.001 |
| 6–12 | 53 (21.2) | 9 (19.6) | 7 (13.7) | 9 (13.6) | 16 (13.7) | 4 (12.9) | 24 (42.9) | 28 (32.2) | ||
| ≥12 | 143 (57.2) | 30 (65.2) | 33 (64.7) | 46 (69.7) | 79 (67.5) | 21 (67.7) | 13 (23.2) | 34 (39.1) | ||
Disclaimer/Publisher’s Note: The statements, opinions and data contained in all publications are solely those of the individual author(s) and contributor(s) and not of MDPI and/or the editor(s). MDPI and/or the editor(s) disclaim responsibility for any injury to people or property resulting from any ideas, methods, instructions or products referred to in the content. |
© 2025 by the authors. Licensee MDPI, Basel, Switzerland. This article is an open access article distributed under the terms and conditions of the Creative Commons Attribution (CC BY) license (https://creativecommons.org/licenses/by/4.0/).
Share and Cite
Xia, Z.; Li, Y.; Yin, J.; Gong, Z.; Sun, J.; Shen, S.; Yang, Y.; Liu, T.; Wang, L.; Huo, J. Integrating Metabolomics and Gut Microbiota to Identify Key Biomarkers and Regulatory Pathways Underlying Metabolic Heterogeneity in Childhood Obesity. Nutrients 2025, 17, 1876. https://doi.org/10.3390/nu17111876
Xia Z, Li Y, Yin J, Gong Z, Sun J, Shen S, Yang Y, Liu T, Wang L, Huo J. Integrating Metabolomics and Gut Microbiota to Identify Key Biomarkers and Regulatory Pathways Underlying Metabolic Heterogeneity in Childhood Obesity. Nutrients. 2025; 17(11):1876. https://doi.org/10.3390/nu17111876
Chicago/Turabian StyleXia, Zhiwei, Yan Li, Jiyong Yin, Zhaolong Gong, Jing Sun, Shi Shen, Yi Yang, Tingting Liu, Liyuan Wang, and Junsheng Huo. 2025. "Integrating Metabolomics and Gut Microbiota to Identify Key Biomarkers and Regulatory Pathways Underlying Metabolic Heterogeneity in Childhood Obesity" Nutrients 17, no. 11: 1876. https://doi.org/10.3390/nu17111876
APA StyleXia, Z., Li, Y., Yin, J., Gong, Z., Sun, J., Shen, S., Yang, Y., Liu, T., Wang, L., & Huo, J. (2025). Integrating Metabolomics and Gut Microbiota to Identify Key Biomarkers and Regulatory Pathways Underlying Metabolic Heterogeneity in Childhood Obesity. Nutrients, 17(11), 1876. https://doi.org/10.3390/nu17111876