
Development and Validation of the China Dietary Inflammatory Index (CHINA-DII)


 and
and 
Abstract
1. Introduction
2. Methods
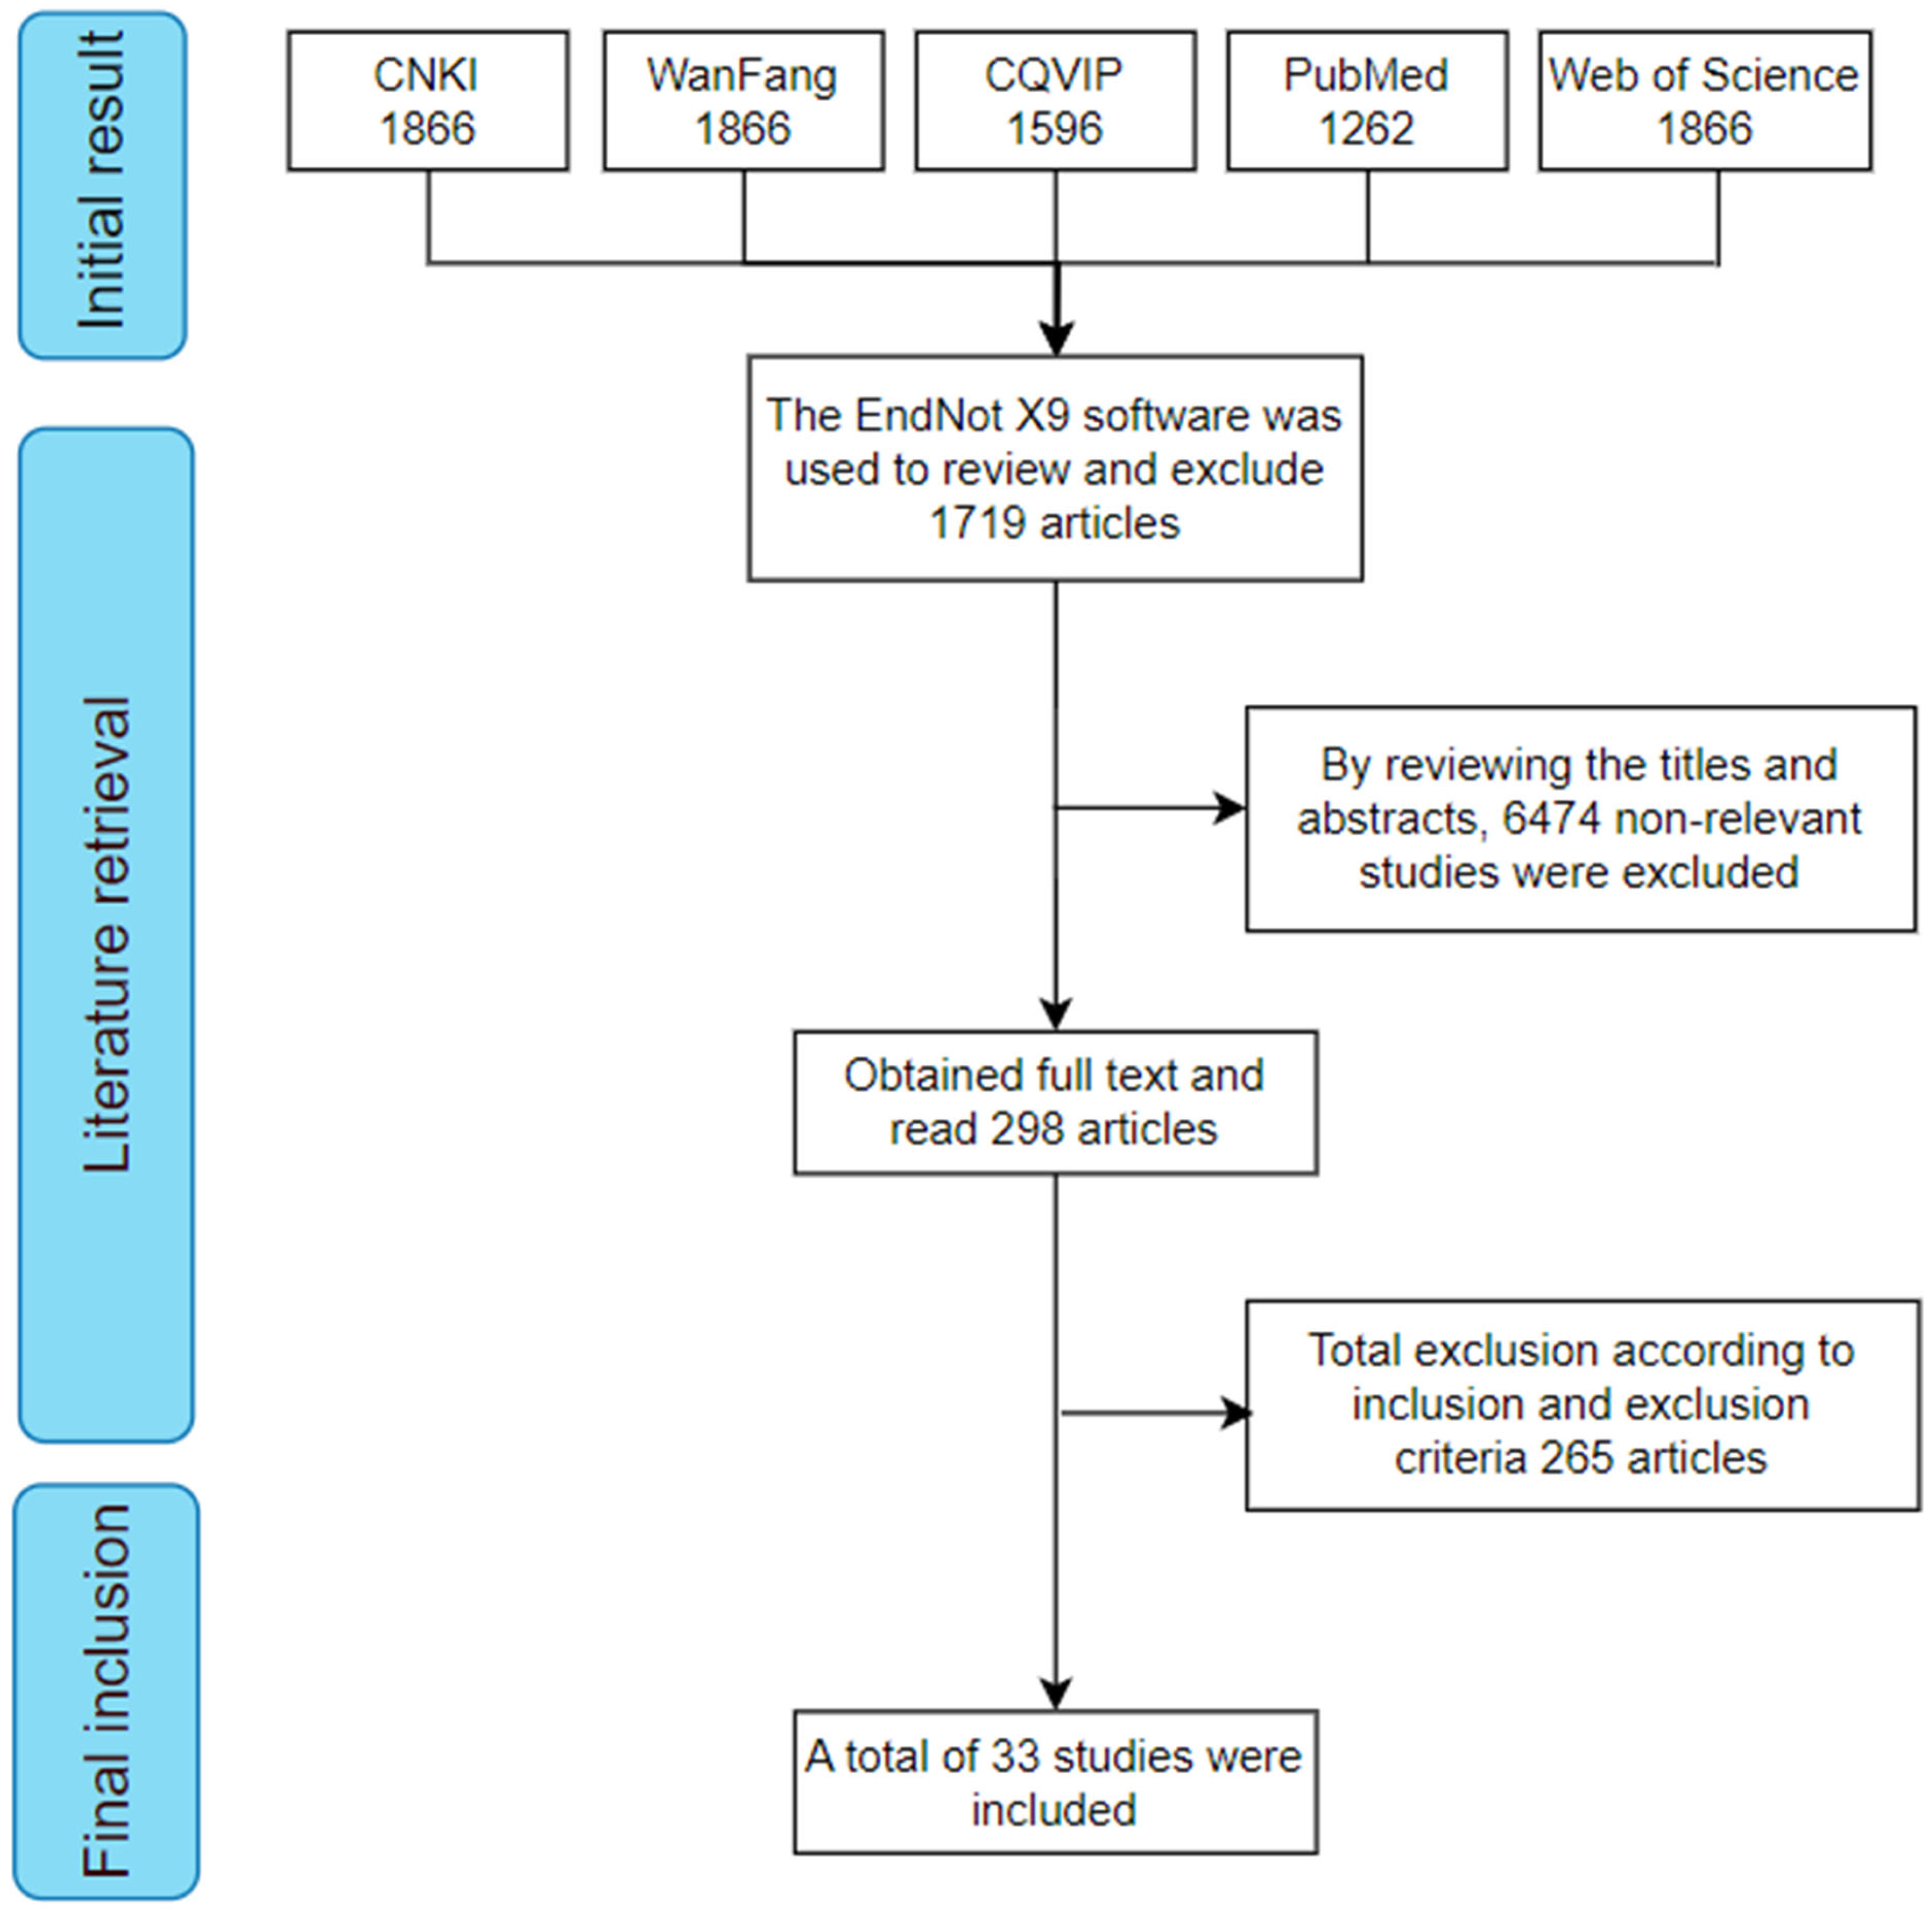
2.1. Literature Search
2.2. Literature Screening and Quality Assessment
2.3. Data Extraction and Database Construction
2.4. Calculation of the China Dietary Inflammatory Index (CHINA-DII) Score
2.5. Study Design and Participants of Validation Study
2.6. Survey and Data Collection
2.7. Statistical Analysis
2.8. Ethical Considerations
3. Results
3.1. Literature Screening and Inclusion Results
3.2. Quality Assessment of Included Studies
3.3. Characteristics of Included Studies
3.4. CHINA-DII Dietary Intake Database for Chinese Adults
3.5. Sociodemographic and Clinical Characteristics of the Study Participants for Validation
3.6. Dietary Nutrient Intake
3.7. Association Between CHINA-DII and hs-CRP
4. Discussion
4.1. CHINA-DII Database Source
4.2. Comparison of CHINA-DII and DII Nutrient Components
4.3. Relationship Between CHINA-DII Scores and Inflammatory Markers
4.4. Comparison of CHINA-DII and Other Dietary Quality Assessment Methods
4.5. Limitations
5. Conclusions
Supplementary Materials
Author Contributions
Funding
Institutional Review Board Statement
Informed Consent Statement
Data Availability Statement
Acknowledgments
Conflicts of Interest
Abbreviations
| CHINA-DII | China Dietary Inflammatory Index |
| DII | Dietary Inflammatory Index |
| PLS | Partial Least Squares |
| FFQ | Food frequency questionnaire |
| hs-CRP | High-sensitivity C-reactive protein |
| OR | Odds ratio |
| 95%CI | 95% confidence interval |
| DQI | Diet Quality Index |
| HEI | Healthy Eating Index |
| DBI | Diet Balance Index |
| CNKI | China National Knowledge Infrastructure |
| WM | Weighted mean |
| I2 | Inconsistency index |
| BMI | Body mass index |
| CDC | Centers for Disease Control and Prevention |
| AHA | American Heart Association |
| SD | Standard deviation |
| M | Median |
| ANOVA | Analysis of variance |
References
- Singh, N.; Baby, D.; Rajguru, J.P.; Patil, P.B.; Thakkannavar, S.S.; Pujari, V.B. Inflammation and cancer. Ann. Afr. Med. 2019, 18, 121–126. [Google Scholar] [CrossRef] [PubMed]
- Pestka, S.; Krause, C.D.; Sarkar, D.; Walter, M.R.; Shi, Y.; Fisher, P.B. Interleukin-10 and related cytokines and receptors. Annu. Rev. Immunol. 2004, 22, 929–979. [Google Scholar] [CrossRef]
- Galland, L. Diet and inflammation. Nutr. Clin. Pract. 2010, 25, 634–640. [Google Scholar] [CrossRef] [PubMed]
- Xia, B.; Li, Y.; Hu, L.; Xie, P.; Mi, N.; Lv, L.; Liang, Z.; Sun, Y.; Li, Y.; Jiang, X.; et al. Healthy eating patterns associated with reduced risk of inflammatory bowel disease by lowering low-grade inflammation: Evidence from a large prospective cohort study. BMC Med. 2024, 22, 589. [Google Scholar] [CrossRef] [PubMed]
- Norde, M.M.; Collese, T.S.; Giovannucci, E.; Rogero, M.M. A posteriori dietary patterns and their association with systemic low-grade inflammation in adults: A systematic review and meta-analysis. Nutr. Rev. 2021, 79, 331–350. [Google Scholar] [CrossRef]
- Barber, T.M.; Kabisch, S.; Pfeiffer, A.F.H.; Weickert, M.O. The health benefits of dietary fibre. Nutrients 2020, 12, 3209. [Google Scholar] [CrossRef]
- Ang, A.; Pullar, J.M.; Currie, M.J.; Vissers, M.C.M. Vitamin C and immune cell function in inflammation and cancer. Biochem. Soc. Trans. 2018, 46, 1147–1159. [Google Scholar] [CrossRef]
- Djuricic, I.; Calder, P.C. Beneficial outcomes of omega-6 and omega-3 polyunsaturated fatty acids on human health: An update for 2021. Nutrients 2021, 13, 2421. [Google Scholar] [CrossRef]
- Liao, Z.Y.; Zhang, Z.F. Research progress on the a priori dietary pattern score scale. Health Res. 2019, 48, 334–339. (In Chinese) [Google Scholar]
- Kant, A.K. Dietary patterns and health outcomes. J. Am. Diet. Assoc. 2004, 104, 615–635. [Google Scholar] [CrossRef]
- Cavicchia, P.P.; Steck, S.E.; Hurley, T.G.; Hussey, J.R.; Ma, Y.; Ockene, I.S.; Hébert, J.R. A new dietary inflammatory index predicts interval changes in serum high-sensitivity C-reactive protein. J. Nutr. 2009, 139, 2365–2372. [Google Scholar] [CrossRef]
- Shivappa, N.; Steck, S.E.; Hurley, T.G.; Hussey, J.R.; Hébert, J.R. Designing and developing a literature-derived, population-based dietary inflammatory index. Public Health Nutr. 2014, 17, 1689–1696. [Google Scholar] [CrossRef] [PubMed]
- Hariharan, R.; Odjidja, E.N.; Scott, D.; Shivappa, N.; Hébert, J.R.; Hodge, A.; de Courten, B. The dietary inflammatory index, obesity, type 2 diabetes, and cardiovascular risk factors and diseases. Obes. Rev. 2022, 23, e13349. [Google Scholar] [CrossRef] [PubMed]
- Syed Soffian, S.S.; Mohammed Nawi, A.; Hod, R.; Ja’afar, M.H.; Isa, Z.M.; Chan, H.K.; Hassan, M.R.A. Meta-Analysis of the Association between Dietary Inflammatory Index (DII) and Colorectal Cancer. Nutrients 2022, 14, 1555. [Google Scholar] [CrossRef] [PubMed]
- Shoaei, N.; Shokri-Mashhadi, N.; Feizi, A.; Ghiasvand, R. The association between dietary inflammatory index (DII) and risk of hypertension: A case-control study. High Blood Press. Cardiovasc. Prev. 2022, 29, 611–618. [Google Scholar] [CrossRef]
- Shu, Y.; Wu, X.; Wang, J.; Ma, X.; Li, H.; Xiang, Y. Associations of Dietary Inflammatory Index with Prediabetes and Insulin Resistance. Front. Endocrinol. 2022, 13, 820932. [Google Scholar] [CrossRef]
- Zhang, J.; Jia, J.; Lai, R.; Wang, X.; Chen, X.; Tian, W.; Liu, Q.; Li, J.; Ju, J.; Xu, H. Association between dietary inflammatory index and atherosclerosis cardiovascular disease in U.S. adults. Front. Nutr. 2023, 9, 1044329. [Google Scholar] [CrossRef]
- Kotemori, A.; Sawada, N.; Iwasaki, M.; Yamaji, T.; Shivappa, N.; Hebert, J.R.; Ishihara, J.; Inoue, M.; Tsugane, S. Dietary inflammatory index is associated with inflammation in Japanese men. Front. Nutr. 2021, 8, 604296. [Google Scholar] [CrossRef]
- Ma, R.Z.; Yiminniazhi, B.; Gu, Y.S.; Zhao, H.; Gao, S.X.; Yu, W.H.; Dai, J.H. Meta-analysis on the correlation between dietary inflammatory index and serum C-reactive protein. Chin. J. Dis. Control. 2024, 28, 1104–1111. [Google Scholar]
- Shin, D.; Lee, K.W.; Brann, L.; Shivappa, N.; Hébert, J.R. Dietary inflammatory index is positively associated with serum high-sensitivity C-reactive protein in a Korean adult population. Nutrition 2019, 63, 155–161. [Google Scholar] [CrossRef]
- Suzuki, K.; Shivappa, N.; Kawado, M.; Yamada, H.; Hashimoto, S.; Wakai, K.; Iso, H.; Okada, E.; Fujii, R.; Hébert, J.R.; et al. Association between dietary inflammatory index and serum C-reactive protein concentrations in the Japan Collaborative Cohort Study. Nagoya J. Med. Sci. 2020, 82, 237–249. [Google Scholar] [PubMed]
- Serra-Majem, L.; Frost Andersen, L.; Henríque-Sánchez, P.; Doreste-Alonso, J.; Sánchez-Villegas, A.; Ortiz-Andrelluchi, A.; Negri, E.; La Vecchia, C. Evaluating the quality of dietary intake validation studies. Br. J. Nutr. 2009, 102, S3–S9. [Google Scholar] [CrossRef] [PubMed]
- Blumfield, M.L.; Hure, A.J.; Macdonald-Wicks, L.; Smith, R.; Collins, C.E. Systematic review and meta-analysis of energy and macronutrient intakes during pregnancy in developed countries. Nutr. Rev. 2012, 70, 322–336. [Google Scholar] [CrossRef]
- Long, Q.; Kingdon, C.; Yang, F.; Renecle, M.D.; Jahanfar, S.; Bohren, M.A.; Betran, A.P. Prevalence of and reasons for women’s, family members’, and health professionals’ preferences for cesarean section in China: A mixed-methods systematic review. PLoS Med. 2018, 15, e1002672. [Google Scholar] [CrossRef]
- The Newcastle-Ottawa Scale (NOS) for Assessing the Quality of Nonrandomised Studies in Meta-Analyses [EB/OL]. Available online: https://www.ohri.ca/programs/clinical_epidemiology/oxford.asp (accessed on 3 May 2021).
- Hozo, S.P.; Djulbegovic, B.; Hozo, I. Estimating the mean and variance from the median, range, and the size of a sample. BMC Med. Res. Methodol. 2005, 5, 13. [Google Scholar] [CrossRef] [PubMed]
- Wan, X.; Wang, W.; Liu, J.; Tong, T. Estimating the sample mean and standard deviation from the sample size, median, range and/or interquartile range. BMC Med. Res. Methodol. 2014, 14, 135. [Google Scholar] [CrossRef]
- Liu, H.N.; Wu, H.; Yao, C.; Chen, Y.Y.; Liu, T.T. Deep extraction methods for continuous data in meta-analysis. Chin. J. Evid. Based Med. 2017, 17, 117–121. (In Chinese) [Google Scholar]
- Pearson, T.A.; Mensah, G.A.; Alexander, R.W.; Anderson, J.L.; Cannon, R.O., 3rd; Criqui, M.; Fadl, Y.Y.; Fortmann, S.P.; Hong, Y.; Myers, G.L.; et al. Markers of inflammation and cardiovascular disease: Application to clinical and public health practice: A statement for healthcare professionals from the Centers for Disease Control and Prevention and the American Heart Association. Circulation 2003, 107, 499–511. (In Chinese) [Google Scholar] [CrossRef]
- Qin, A.L.; Zhou, W.W.; Li, X.P.; Chen, Y.Z.; Lu, W.T. Study on the relationship between dietary patterns and metabolic syndrome in adults in Guangxi. Appl. Prev. Med. 2024, 30, 226–230. (In Chinese) [Google Scholar]
- Li, L.; Wang, H.J.; He, Y.N.; Huang, Q.H.; Guan, F.X.; Su, C.; Zhang, J.G.; Du, W.; Jia, X.F.; Ouyang, Y.W. Current status and food sources of dietary iron, zinc, selenium, and copper intake among adults in ten provinces (autonomous regions) of China in 2022–2023. Health Res. 2024, 53, 898–903. (In Chinese) [Google Scholar]
- Jia, X.F.; Su, C.; He, Y.N.; Du, W.; Zhang, J.G.; Huang, Q.H.; Zhang, X.F.; Guan, F.X.; Bai, J.; Wei, Y.L. Status and food sources of macronutrient intake among adults in ten provinces (autonomous regions) of China in 2022–2023. Health Res. 2024, 53, 862–869+879. (In Chinese) [Google Scholar]
- Ling, H.Q.; Li, C.L.; Zhao, Y.; Huang, Y.X.; Wang, Z. Investigation on nutrient intake among residents aged 18–60 in Shanxi Province. Prev. Med. Forum 2023, 29, 161–166. (In Chinese) [Google Scholar]
- Han, X.L.; Ren, L.P.; Du, X.L. Correlation between muscle mass loss syndrome and dietary nutrient intake levels in elderly populations in Urumqi. Chin. J. Geriatr. 2023, 43, 976–980. (In Chinese) [Google Scholar]
- Chen, B.B.; Huang, J.R.; Peng, H.W.; Xu, S.H. Case-control study of trans fatty acid intake and risk of non-alcoholic fatty liver disease. Fujian Med. J. 2023, 45, 11–16. (In Chinese) [Google Scholar]
- Zhao, F.L.; Fang, H.Y.; Zhao, L.Y.; Mu, D.; Guo, Q.Y.; Ju, L.H.; He, L. Status of dietary energy and macronutrient intake among adults aged 65 and above in China in 2015. Health Res. 2021, 50, 37–45. (In Chinese) [Google Scholar]
- Liu, R.R.; Yan, H.; Zhao, Y.L.; Li, Q.; Wang, X.; Fu, H.; Wang, F.; Chen, C.; Li, W.H.; Dang, S.F. Relationship between dietary fatty acid intake and hypertension in rural residents of Hanzhong, Shaanxi. J. Xi’an Jiaotong Univ. (Med. Ed.) 2021, 42, 617–622. (In Chinese) [Google Scholar]
- Pan, X.; Gao, T.; Liu, C.X.; Sun, C.X.; Jia, M.Y.; Lin, S.; Ma, A.G. Analysis of food and nutrient intake levels and the risk of Helicobacter pylori infection. Acta Nutr. Sin. 2020, 42, 140–148. (In Chinese) [Google Scholar]
- Tang, H.M.; He, D.D.; Wen, X.S.; Zang, J.J.; Ding, K.Y. Dietary structure and nutritional status of residents in Minhang District, Shanghai in 2012–2013. J. Environ. Occup. Med. 2019, 36, 465–469. (In Chinese) [Google Scholar]
- Song, P.K.; Man, Q.Q.; Li, Y.Q.; Jia, X.; Fang, Y.H.; He, L.; Zhang, J. Energy and macronutrient intake status of older adults in China from 2010–2012. Health Res. 2019, 48, 876–883+912. (In Chinese) [Google Scholar]
- Huang, A.Q.; Wang, L.S.; Zhang, B.; Wang, Z.H. Trends in dietary micronutrient intake and population characteristics in nine provinces (autonomous regions) of China from 1991–2015. J. Environ. Occup. Med. 2019, 36, 410–417. (In Chinese) [Google Scholar]
- Zhang, J.W.; Zhao, S.L.; Cai, J.; Sun, Y.X.; Zhang, C.; Ma, A.G. Dietary and Nutritional Status Analysis of Elderly Pulmonary Tuberculosis Patients in Linyi City, Shandong Province. Acta Nutr. Sin. 2019, 41, 135–138. (In Chinese) [Google Scholar]
- Chen, B.B.; Yan, J.H.; Pan, X.T.; Li, Y.F.; Liu, W.J.; Peng, X.E. Case-Control Study on Dietary Fatty Acid Intake and Risk of Non-Alcoholic Fatty Liver Disease in Health Examination Population in Nanping City from 2015 to 2017. Health Res. 2019, 48, 552–559. (In Chinese) [Google Scholar]
- Zhang, Y.; Yuan, J. Investigation on Nutrition and Health Status of Adult Permanent Residents in Shizhong District, Leshan City. Mod. Med. Health 2017, 33, 3100–3103. (In Chinese) [Google Scholar]
- Jin, W.; Guo, H.W.; Lin, X.Y. Comparative Study of Dietary Nutrition Status of Elderly in Huangpu District, Shanghai and Jinan City. J. Environ. Occup. Med. 2017, 34, 891–895. (In Chinese) [Google Scholar]
- Hou, L.Y.; Zhang, H.; Gong, G.Q.; Guan, X.L.; Tian, J.Y.; Li, S.N.; Zhang, H.Y.; Wang, X.P.; Hou, L.C.; Bi, S. Correlation Study on Dietary Nutrient Intake and Ischemic Stroke in Jiamusi Area. Trace Elem. Health Res. 2017, 34, 39–41. (In Chinese) [Google Scholar]
- Ma, L.P.; Xu, Y.; Zhang, B.; Su, Y.X. Relationship Between Dietary Factors and Plasma High-Sensitivity C-Reactive Protein Levels in Residents Aged 40–65 in Guangzhou. Acta Nutr. Sin. 2015, 37, 335–340. (In Chinese) [Google Scholar]
- Chen, C.G.; Hong, J.; Lin, X.H.; Liu, H.J.; He, F.Y.; Yuan, Z.M. Relationship Between Macronutrient Intake and Blood Lipid Levels in Elderly Residents in Old Urban Communities of Guangzhou. J. Sun Yat-Sen Univ. (Med. Sci.) 2015, 36, 780–785. (In Chinese) [Google Scholar]
- He, D.H.; Zhang, R.H.; Zhou, B.; Huang, L.C.; Zhu, D.X.; Ding, G.Q. Study on Dietary Nutrients and Risk of Metabolic Syndrome in Adults in Zhejiang Province. Acta Nutr. Sin. 2015, 37, 137–142. (In Chinese) [Google Scholar]
- Zheng, X.; Li, X.; Song, Y.P. Analysis of Nutrient Intake Levels in Residents Aged ≥50 in Liaoning Province. Chin. Public Health 2012, 28, 523–524. (In Chinese) [Google Scholar]
- Mo, B.Q.; Hu, C.Y.; Xiong, L.; Zhou, M.; Teshima, K.; Yuzaki, T. Comparative Study of Food and Nutrient Intake Status in Residents from Different Esophageal Cancer-Prevalent Areas. Mod. Prev. Med. 2011, 38, 2949–2951. (In Chinese) [Google Scholar]
- Mo, B.Q.; Li, X.; Zhu, H.J.; Yang, X.; Teshima, K. Comparative Study of Food and Nutrient Intake Status in Residents from Different Lung Cancer-Prevalent Areas. Jiangsu J. Prev. Med. 2011, 22, 14–17. (In Chinese) [Google Scholar]
- Liu, Z.M.; Huang, Q.; Long, H.H.; Li, S.Y.; Wu, Y.; Zhang, S.J.; Tang, X.Y.; Chen, Y.M. Increased dietary intakes of total protein, animal protein and white meat protein were associated with reduced bone loss: A prospective analysis based on Guangzhou health and nutrition cohort, south China. Nutrients 2023, 15, 1432. [Google Scholar] [CrossRef]
- Li, L.; Liu, X.; Tao, N.; Chen, Q.; Sun, Z.; Yang, Q.; Zhao, X.; Liu, J. Dietary carotenoid intake and dental fluorosis in relation to SOD2 (rs 11968525) polymorphisms in Guizhou, China. Asia Pac. J. Clin. Nutr. 2022, 31, 320–330. [Google Scholar]
- Zhao, R.; Zhao, L.; Yang, F.; Ju, L.; Li, S.; Cheng, X.; Xu, X.; Guo, Q.; Cai, S.; Fang, H.; et al. Dietary fat intake among Chinese adults and their relationships with blood lipids: Findings from China nutrition and health surveillance and comparison with the PURE study. Nutrients 2022, 14, 5262. [Google Scholar] [CrossRef] [PubMed]
- Wang, Z.; Chen, Y.; Tang, S.; Chen, S.; Gong, S.; Jiang, X.; Wang, L.; Zhang, Y. Dietary diversity and nutrient intake of Han and Dongxiang smallholder farmers in poverty areas of Northwest China. Nutrients 2021, 13, 3908. [Google Scholar] [CrossRef] [PubMed]
- Huang, C.Y.; Abulimiti, A.; Zhang, X.; Feng, X.L.; Luo, H.; Chen, Y.M.; Fang, Y.J.; Zhang, C.X. Dietary B vitamin and methionine intakes and risk for colorectal cancer: A case-control study in China. Br. J. Nutr. 2020, 123, 1277–1289. [Google Scholar] [CrossRef]
- Zhang, X.; Fang, Y.J.; Feng, X.L.; Abulimiti, A.; Huang, C.Y.; Luo, H.; Zhang, N.Q.; Chen, Y.M.; Zhang, C.X. Higher intakes of dietary vitamin D, calcium and dairy products are inversely associated with the risk of colorectal cancer: A case-control study in China. Br. J. Nutr. 2020, 123, 699–711. [Google Scholar] [CrossRef]
- Liu, Z.; Zhao, L.; Man, Q.; Wang, J.; Zhao, W.; Zhang, J. Dietary micronutrients intake status among Chinese elderly people living at home: Data from CNNHS 2010-2012. Nutrients 2019, 11, 1787. [Google Scholar] [CrossRef]
- Luo, H.; Zhang, N.Q.; Huang, J.; Zhang, X.; Feng, X.L.; Pan, Z.Z.; Chen, Y.M.; Fang, Y.J.; Zhang, C.X.; Zhang, C.X. Different forms and sources of iron in relation to colorectal cancer risk: A case-control study in China. Br. J. Nutr. 2019, 121, 735–747. [Google Scholar] [CrossRef]
- Qu, R.; Jia, Y.; Liu, J.; Jin, S.; Han, T.; Na, L. Dietary flavonoids, copper intake, and risk of metabolic syndrome in Chinese adults. Nutrients 2018, 10, 991. [Google Scholar] [CrossRef]
- Shi, W.Q.; Liu, J.; Cao, Y.; Zhu, Y.Y.; Guan, K.; Chen, Y.M. Association of dietary and serum vitamin E with bone mineral density in middle-aged and elderly Chinese adults: A cross-sectional study. Br. J. Nutr. 2016, 115, 113–120. [Google Scholar] [CrossRef] [PubMed]
- Phillips, C.M.; Shivappa, N.; Hébert, J.R.; Perry, I.J. Dietary inflammatory index and biomarkers of lipoprotein metabolism, inflammation and glucose homeostasis in adults. Nutrients 2018, 10, 1033. [Google Scholar] [CrossRef] [PubMed]
- Peres, L.C.; Bandera, E.V.; Qin, B.; Guertin, K.A.; Shivappa, N.; Hebert, J.R.; Abbott, S.E.; Alberg, A.J.; Barnholtz-Sloan, J.; Bondy, M.; et al. Dietary inflammatory index and risk of epithelial ovarian cancer in African American women. Int. J. Cancer 2017, 140, 535–543. [Google Scholar] [CrossRef]
- Innes, J.K.; Calder, P.C. Omega-6 fatty acids and inflammation. Prostaglandins Leukot. Essent. Fat. Acids 2018, 132, 41–48. [Google Scholar] [CrossRef]
- Hart, M.J.; Torres, S.J.; McNaughton, S.A.; Milte, C.M. Dietary patterns and associations with biomarkers of inflammation in adults: A systematic review of observational studies. Nutr. J. 2021, 20, 24. [Google Scholar] [CrossRef] [PubMed]
- Barbaresko, J.; Koch, M.; Schulze, M.B.; Nöthlings, U. Dietary pattern analysis and biomarkers of low-grade inflammation: A systematic literature review. Nutr. Rev. 2013, 71, 511–527. [Google Scholar] [CrossRef]
- Koelman, L.; Herpich, C.; Norman, K.; Jannasch, F.; Börnhorst, C.; Schulze, M.B.; Aleksandrova, K. Adherence to healthy and sustainable dietary patterns and long-term chronic inflammation: Data from the EPIC-Potsdam Cohort. J. Nutr. Health Aging 2023, 27, 1109–1117. [Google Scholar] [CrossRef]

| Study | Evaluation Item | Quality | ||||||||
|---|---|---|---|---|---|---|---|---|---|---|
| 1 | 2 | 3 | 4 | 5 | 6 | 7 | 8 | 9 | ||
| Qin Qiulan [30] | 1 | 1 | 1 | 1 | 1 | 1 | 1 | 1 | 0 | High |
| Li Li [31] | 1 | 1 | 1 | 1 | 1 | 1 | 1 | 1 | 1 | High |
| Jia Xiaofang [32] | 1 | 1 | 1 | 1 | 1 | 1 | 1 | 1 | 1 | High |
| Linghu Liqin [33] | 1 | 1 | 1 | 1 | 1 | 1 | 0.5 | 1 | 0 | High |
| Han Xiaoli [34] | 1 | 1 | 1 | 1 | 0 | 1 | 0.5 | 1 | 1 | High |
| Chen Bingbing [35] | 1 | 1 | 1 | 1 | 1 | 1 | 1 | 1 | 0 | High |
| Zhao Fanglei [36] | 1 | 1 | 1 | 1 | 0 | 1 | 1 | 1 | 1 | High |
| Liu Ruru [37] | 1 | 1 | 1 | 1 | 1 | 1 | 1 | 1 | 0 | High |
| Pan Xin [38] | 1 | 1 | 1 | 1 | 1 | 1 | 0 | 1 | 0 | High |
| Tang Hongmei [39] | 1 | 1 | 1 | 1 | 1 | 1 | 1 | 1 | 0 | High |
| Song Pengkun [40] | 1 | 1 | 1 | 1 | 0 | 1 | 1 | 1 | 1 | High |
| Huang Qiumin [41] | 1 | 1 | 1 | 1 | 1 | 1 | 1 | 1 | 1 | High |
| Zhang Jianwen [42] | 1 | 1 | 1 | 1 | 0 | 1 | 0.5 | 1 | 1 | High |
| Chen Bingbing [43] | 1 | 1 | 1 | 1 | 1 | 1 | 1 | 1 | 0 | High |
| Zhang Yi [44] | 1 | 1 | 1 | 1 | 1 | 1 | 0 | 1 | 1 | High |
| Jin Wei [45] | 0 | 1 | 0.5 | 1 | 0 | 1 | 0 | 1 | 1 | Medium |
| Hou Liyuan [46] | 0 | 1 | 1 | 1 | 0.5 | 1 | 0 | 1 | 1 | Medium |
| Ma Liping [47] | 1 | 1 | 1 | 1 | 0.5 | 1 | 0.5 | 1 | 1 | High |
| Chen Chaogang [48] | 1 | 1 | 1 | 1 | 0.5 | 1 | 0 | 1 | 1 | High |
| He Denghua [49] | 1 | 1 | 1 | 1 | 1 | 1 | 1 | 1 | 1 | High |
| Zheng Xin [50] | 0 | 1 | 1 | 1 | 0.5 | 1 | 0 | 1 | 0 | Medium |
| Mo Baoqing [51] | 0 | 1 | 1 | 1 | 1 | 1 | 0 | 1 | 1 | High |
| Mo Baoqing [52] | 0 | 1 | 1 | 1 | 1 | 1 | 0 | 1 | 1 | High |
| Zhao-Min Liu [53] | 1 | 1 | 1 | 1 | 0.5 | 1 | 1 | 1 | 1 | High |
| Lianhong Li [54] | 1 | 1 | 1 | 1 | 1 | 1 | 1 | 1 | 1 | High |
| Rongping Zhao [55] | 1 | 1 | 1 | 1 | 1 | 1 | 1 | 1 | 0 | High |
| Zhuo Wang [56] | 1 | 1 | 1 | 1 | 1 | 1 | 1 | 1 | 0 | High |
| Chu-Yi Huang [57] | 1 | 1 | 1 | 1 | 1 | 1 | 1 | 1 | 1 | High |
| Xin Zhang [58] | 1 | 1 | 1 | 1 | 1 | 1 | 1 | 1 | 1 | High |
| Zhen Liu [59] | 1 | 1 | 1 | 1 | 0 | 1 | 1 | 1 | 1 | High |
| Hong Luo [60] | 1 | 1 | 1 | 1 | 1 | 1 | 1 | 1 | 0 | High |
| Rongge Qu [61] | 1 | 1 | 1 | 1 | 1 | 1 | 1 | 1 | 1 | High |
| Wen-qi Shi [62] | 1 | 1 | 1 | 1 | 1 | 1 | 1 | 1 | 0 | High |
| Feature | Number of Studies (n) | Percentage (%) |
|---|---|---|
| Total | 33 | 100 |
| Inclusion/Exclusion criteria | ||
| Clear | 28 | 84.9 |
| Unclear/Not clear | 5 | 15.1 |
| Loss to follow-up/Non-response | ||
| Response rate ≥ 70% | 33 | 100 |
| Response rate < 70% | 0 | 0 |
| Not described/Not clear | 0 | 0 |
| Data collection | ||
| Clearly defined and validated | 32 | 97 |
| Clearly defined but not validated | 1 | 3 |
| Outcome definition | ||
| Clear | 33 | 100 |
| Unclear | 0 | 0 |
| Representativeness of study population | ||
| Truly representative | 22 | 66.7 |
| Somewhat representative/Not clear | 5 | 15.1 |
| Specific population | 6 | 18.2 |
| Study purpose | ||
| Clear | 34 | 100 |
| Not elaborated | 0 | 0 |
| Ethical approval and informed consent | ||
| Both | 21 | 63.7 |
| One of the two | 4 | 12.1 |
| Not described | 8 | 24.2 |
| Consistency of study content and results | ||
| Consistent | 33 | 100 |
| Not clear | 0 | 0 |
| Presentation of results | ||
| Clear | 20 | 60.6 |
| Not clear | 13 | 39.4 |
| Quality evaluation grade | ||
| High | 30 | 90.9 |
| Medium | 3 | 9.1 |
| Low | 0 | 0 |
| First Author/Survey Time | Publication Year | Study Type | Study Area | Sample Size | Dietary Assessment Method | Age (Years) | Types of Nutrients |
|---|---|---|---|---|---|---|---|
| Qin Qiulan [30] 2015–2017 | 2024 | Cross-sectional | Guangxi province, China | 2017 | 3 d 24 h weighing | 18.4–98.1 | 13 |
| Li Li [31] 2022–2023 | 2024 | Cross-sectional | 10 provinces in China | 9981 | 3 d 24 h weighing | ≥18 | 3 |
| Jia Xiaofang [32] 2022–2023 | 2024 | Cross-sectional | 10 provinces in China | 9364 | 3 d 24 h weighing | ≥18 | 4 |
| Linghu Liqin [33] 2020 | 2023 | Cross-sectional | Shanxi province, China | 391 | 7 d 24 h weighing | 18–60 | 18 |
| Han Xiaoli [34] 2017–2018 | 2023 | Case–control | Urumqi city, China | 450 | 3 d 24 h weighing | ≥60 | 20 |
| Chen Bingbing [35] 2015–2017 | 2023 | Case–control | Nanping city, China | 541 | FFQ | 18–70 | 2 |
| Zhao Fanglei [36] 2015 | 2021 | Cross-sectional | 31 provinces in China | 18,161 | 3 d 24 h weighing | ≥65 | 4 |
| Liu Ruru [37] 2010 | 2021 | Cross-sectional | Shaanxi province, China | 2241 | FFQ | 18–80 | 3 |
| Pan Xin [38] 2017–2018 | 2020 | Case–control | Binzhou city, China | 441 | FFQ | 18–65 | 15 |
| Tang Hongmei [39] 2012–2013 | 2019 | Cross-sectional | Shanghai city, China | 307 | 3 d 24 h weighing | ≥18 | 11 |
| Song Pengkun [40] 2010–2012 | 2019 | Cross-sectional | National | 16,621 | 3 d 24 h | ≥60 | 4 |
| Huang Qiumin [41] 2009, 2011, 2015 | 2019 | Cross-sectional | 9 provinces in China | 19,076 | 3 d 24 h weighing | 18–59 | 9 |
| Zhang Jianwen [42] 2013–2017 | 2019 | Cross-sectional | Linyi city, China | 1795 | 3 d 24 h | ≥60 | 12 |
| Chen Bingbing [43] 2015–2017 | 2019 | Case–control | Nanping city, China | 546 | FFQ | 18–70 | 4 |
| Zhang Yi [44] 2012–2013 | 2017 | Cross-sectional | Leshan city, China | 912 | 3 d 24 h | ≥18 | 13 |
| Jin Wei [45] | 2017 | Cross-sectional | Shanghai city, Jinan city, China | 950 | FFQ | ≥60 | 13 |
| Hou Liyuan [46] | 2017 | Case–control | Jiamusi city, China | 214 | SQFFQ | 45–85 | 22 |
| Ma Liping [47] | 2015 | Cross-sectional | Guangzhou city, China | 553 | FFQ | 40–65 | 9 |
| Chen Chaogang [48] 2011 | 2015 | Cross-sectional | Guangzhou city, China | 1382 | FFQ | ≥40 | 6 |
| He Denghua [49] 2010–2012 | 2015 | Cross-sectional | Hangzhou, Ningbo, Jinhua, Jiaxing, Huzhou, Lishui of China | 1579 | 3 d 24 h weighing | ≥18 | 16 |
| Zheng Xin [50] 2009 | 2012 | Cross-sectional | Liaoning province, China | 536 | 3 d 24 h weighing | ≥50 | 18 |
| Mo Baoqing [51] | 2011 | Cross-sectional | Nangjing city, China | 405 | 3 d 24 h weighing | 35–55 | 20 |
| Mo Baoqing [52] | 2011 | Cross-sectional | Benxi city, China | 200 | 7 d 24 h weighing | 35–55 | 21 |
| Zhao-Min Liu [53] 2011–2017 | 2023 | Cross-sectional | Guangzhou city, China | 1987 | FFQ | 40–75 | 2 |
| Lianhong Li [54] 2015–2015 | 2022 | Cross-sectional | Guizhou province, China | 899 | FFQ | 18–75 | 1 |
| Rongping Zhao [55] 2015–2017 | 2022 | Cross-sectional | 31 provinces in China | 48,315 | 3 d 24 h weighing | 30–70 | 5 |
| Zhuo Wang [56] 2020–2020 | 2021 | Cross-sectional | Dingxi city, China | 599 | 3 d 24 h weighing | ≥18 | 14 |
| Chu-Yi Huang [57] 2010–2019 | 2020 | Case–control | Guangzhou city, China | 2538 | FFQ | 30–75 | 5 |
| Xin Zhang [58] 2010–2018 | 2020 | Case–control | Guangzhou city, China | 2389 | FFQ | 30–75 | 4 |
| Zhen Liu [59] 2010–2012 | 2019 | Cross-sectional | China national | 16,621 | 3 d 24 h weighing | ≥60 | 12 |
| Hong Luo [60] 2010–2017 | 2019 | Case–control | Guangzhou city, China | 2144 | FFQ | 30–75 | 2 |
| Rongge Qu [61] 2010 | 2018 | Cross-sectional | Harbin city, China | 6473 | FFQ | 20–75 | 6 |
| Wen-qi Shi [62] 2011–2013 | 2015 | Cross-sectional | Guangzhou city, China | 3203 | FFQ | 40–75 | 3 |
| CHINA-DII Component | References (n) | Participants (n) | Reference Sources | I2 | WM (95% CI) | SD |
|---|---|---|---|---|---|---|
| Energy (kcal) | 26 | 123,978 | References [30,32,33,34,35,36,38,39,40,44,45,46,47,48,49,51,52,53,55,56,57,58,60,61,62] | 99.88 | 1869.00 (1764.12,1973.88) | 532.64 |
| Protein (g) | 20 | 66,004 | References [30,32,33,34,36,38,39,40,42,44,45,46,47,48,49,51,52,56,61,62] | 99.93 | 65.66 (61.20,70.11) | 21.09 |
| Carbohydrates (g) | 18 | 62,494 | References [30,32,33,34,36,38,40,42,44,45,46,47,48,49,51,52,56,61] | 99.89 | 271.00 (248.01,293.98) | 91.51 |
| Fat (g) | 20 | 113,258 | References [30,32,33,34,36,38,40,42,44,45,46,47,48,49,51,52,55,56,58,61] | 99.95 | 64.14 (54.87,73.41) | 24.94 |
| Cholesterol (mg) | 7 | 5520 | References [34,45,46,47,48,49,51] | 97.31 | 328.19 (282.82,373.55) | 194.62 |
| Saturated fatty acids (g) | 4 | 51,715 | References [37,43,47,55] | 99.41 | 18.42 (11.94,24.91) | 8.60 |
| Monounsaturated fatty acids (g) | 4 | 51,715 | References [37,43,47,55] | 99.87 | 30.74 (21.93,39.55) | 12.01 |
| Polyunsaturated fatty acids (g) | 4 | 51,715 | References [37,43,47,55] | 99.85 | 19.04 (14.39,23.69) | 6.00 |
| Dietary fiber (g) | 13 | 17,952 | References [30,34,38,44,45,46,47,48,49,51,52,58,61] | 99.86 | 12.42 (9.50,15.35) | 5.88 |
| Folate (μg) | 4 | 20,000 | References [33,34,57,59] | 99.98 | 139.20 (35.60,242.81) | 58.22 |
| Vitamin A (μgRE) | 13 | 26,605 | References [30,33,34,38,39,42,44,45,46,49,50,51,59] | 98.84 | 376.13 (314.91,437.35) | 294.38 |
| Vitamin B1 (mg) | 15 | 46,071 | References [30,33,34,38,39,41,42,44,45,46,49,50,52,56,59] | 100 | 0.92 (0.86,0.98) | 0.31 |
| Vitamin B2 (mg) | 15 | 46,814 | References [30,33,34,38,39,41,44,45,46,49,50,52,56,57,59] | 99.99 | 0.81 (0.72,0.89) | 0.31 |
| Vitamin B3 (mg) | 10 | 25,503 | References [30,33,34,38,41,46,49,50,52,56] | 99.99 | 13.31 (12.15,14.48) | 3.56 |
| Vitamin B6 (mg) | 4 | 20,208 | References [34,56,57,59] | 99.96 | 0.51 (0.09,0.94) | 0.27 |
| Vitamin B12 (μg) | 4 | 19,823 | References [33,46,57,59] | 99.96 | 0.98 (−0.41,2.37) | 0.84 |
| Vitamin C (mg) | 16 | 46,480 | References [30,33,34,38,39,41,42,44,45,46,49,50,51,52,56,59] | 100 | 80.35 (72.24,88.47) | 35.90 |
| Vitamin D (μg) | 3 | 4826 | References [34,53,58] | 99.87 | 3.74 (−2.87,10.35) | 2.93 |
| Vitamin E (mg) | 16 | 48,771 | References [30,33,34,38,39,41,42,45,46,49,50,51,52,56,59,62] | 100 | 26.31 (20.89,31.73) | 11.26 |
| Zn (mg) | 16 | 55,925 | References [30,31,33,34,38,39,41,42,44,45,46,49,51,52,56,59] | 100 | 9.67 (8.95,10.39) | 2.96 |
| Mg (mg) | 13 | 42,994 | References [33,34,38,39,41,42,44,46,49,51,52,56,59] | 100 | 280.13 (264.72,295.53) | 72.59 |
| Fe (mg) | 17 | 58,069 | References [30,31,33,34,38,39,41,42,44,45,46,49,51,52,56,59,60] | 99.99 | 19.01 (17.68,20.34) | 6.34 |
| Se (μg) | 14 | 52,975 | References [31,33,34,38,39,41,42,44,46,49,51,52,56,59] | 99.98 | 42.91 (40.08,45.74) | 16.03 |
| Variable | Total (n = 256) | Low CHINA-DII (n = 128) | High CHINA-DII (n = 128) | p-Value |
|---|---|---|---|---|
| Age (years) | 59.48 ± 10.91 | 59.63 ± 10.99 | 59.34 ± 10.86 | 0.833 |
| Age group (years) | ||||
| ≤60 | 122 (47.7) | 64 (50.0) | 58 (45.3) | 0.453 |
| >60 | 134 (52.3) | 64 (50.0) | 70 (54.7) | |
| Sex | 0.019 | |||
| Male | 164 (64.1) | 73 (57.0) | 91 (71.1) | |
| Female | 92 (35.9) | 55 (43.0) | 37 (28.9) | |
| Marital status | 0.281 | |||
| Married | 248 (96.9) | 126 (98.4) | 12 2(95.3) | |
| Unmarried/Separated/Divorced/Widowed | 8 (3.1) | 2 (1.6) | 6 (4.7) | |
| Education level | 0.598 | |||
| Primary school or below | 111 (43.4) | 54 (42.2) | 57 (44.5) | |
| Secondary school | 69 (27.0) | 34 (26.6) | 35 (27.3) | |
| High school/Vocational high school | 38 (14.8) | 22 (17.2) | 16 (12.5) | |
| College | 17 (6.6) | 10 (7.8) | 7 (5.5) | |
| University | 21 (8.2) | 8 (6.2) | 13 (10.2) | |
| Occupation | 0.614 | |||
| Farmers/Workers/Manual laborers | 72 (28.1) | 38 (29.7) | 34 (26.6) | |
| Housewives/Retired/Unemployed | 111 (43.4) | 57 (44.5) | 54 (42.2) | |
| Other occupations | 73 (28.5) | 33 (25.8) | 40 (31.2) | |
| Family month income (RMB) | 0.349 | |||
| <3000 | 21 (8.2) | 9 (7.0) | 12 (9.4) | |
| 3000–6000 | 101 (39.5) | 56 (43.8) | 45 (35.2) | |
| >6000 | 134 (52.3) | 63 (49.2) | 71 (55.4) | |
| Smoking | 0.372 | |||
| Yes | 103 (40.2) | 48 (37.5) | 55 (43.0) | |
| No | 153 (59.8) | 80 (62.5) | 73 (57.0) | |
| Alcohol drinking | 0.500 | |||
| Yes | 42 (16.4) | 19 (14.8) | 23 (18.0) | |
| No | 214 (83.6) | 109 (85.2) | 105 (82.0) | |
| Daily life stress | 0.333 | |||
| High/Medium | 73 (28.5) | 40 (31.3) | 33 (25.8) | |
| Low/None | 183 (71.5) | 88 (68.7) | 95 (74.2) | |
| BMI (kg/m2) | 0.699 | |||
| <24 | 159 (62.1) | 78 (60.9) | 81 (63.3) | |
| ≥24 | 97 (37.9) | 50 (39.1) | 47 (36.7) | |
| TNM | 0.373 | |||
| I | 86 (33.6) | 42 (32.8) | 44 (34.4) | |
| II | 42 (16.4) | 26 (20.3) | 16 (12.5) | |
| III | 71 (27.7) | 33 (25.8) | 38 (29.7) | |
| IV | 4 (1.6) | 3 (2.3) | 1 (0.8) | |
| Missing | 53 (20.7) | 24 (18.8) | 29 (22.7) | |
| hs-CRP (mg/L) | 3.68 ± 2.35 | 3.38 ± 2.25 | 3.98 ± 2.42 | 0.041 |
| CHINA-DII | −1.91 ± 0.35 | −2.40 ± 0.41 | −1.42 ± 0.39 | <0.001 |
| Nutrients | Total (n = 256) | Low CHINA-DII (n = 128) | High CHINA-DII (n = 128) | p-Value |
|---|---|---|---|---|
| Energy (kcal) | 1609.7 ± 551.74 | 1883.02 ± 554.25 | 1336.56 ± 391.87 | <0.001 |
| Protein (g) | 83.23 ± 36.24 | 101.44 ± 38.05 | 65.02 ± 22.82 | <0.001 |
| Carbohydrates (g) | 209.35 ± 72.51 | 241.06 ± 73.55 | 177.64 ± 55.86 | <0.001 |
| Fat (g) | 52.70 ± 25.52 | 62.42 ± 27.33 | 42.97 ± 19.24 | <0.001 |
| Cholesterol (mg) | 548.90 ± 306.32 | 673.72 ± 333.69 | 424.08 ± 213.64 | <0.001 |
| Dietary fiber (g) | 11.48 ± 73.57 | 14.86 ± 6.26 | 8.09 ± 2.84 | <0.001 |
| Folate (μg) | 157.98 ± 73.57 | 196.85 ± 72.06 | 119.11 ± 51.27 | <0.001 |
| Vitamin A (μgRE) | 574.17 ± 259.90 | 722.70 ± 261.46 | 425.64 ± 150.98 | <0.001 |
| Vitamin B1 (mg) | 0.74 ± 0.31 | 0.90 ± 0.32 | 0.57 ± 0.19 | <0.001 |
| Vitamin B2 (mg) | 1.05 ± 0.41 | 1.28 ± 0.43 | 0.82 ± 0.24 | <0.001 |
| Vitamin B3 (mg) | 20.41 ± 7.49 | 23.82 ± 7.59 | 17.01 ± 5.62 | <0.001 |
| Vitamin B6 (mg) | 0.32 ± 0.22 | 0.43 ± 0.24 | 0.21 ± 0.12 | <0.001 |
| Vitamin C (mg) | 117.21 ± 86.24 | 147.38 ± 94.23 | 87.04 ± 64.96 | <0.001 |
| Vitamin D (μg) | 2.26 ± 1.40 | 2.80 ± 1.55 | 1.73 ± 0.97 | <0.001 |
| Vitamin E (mg) | 11.27 ± 6.14 | 14.44 ± 6.49 | 8.11 ± 3.68 | <0.001 |
| Zn (mg) | 15.89 ± 5.10 | 18.69 ± 5.13 | 13.10 ± 3.17 | <0.001 |
| Mg (mg) | 74.62 ± 41.85 | 94.89 ± 45.76 | 54.34 ± 24.36 | <0.001 |
| Fe (mg) | 21.67 ± 7.41 | 26.02 ± 7.33 | 17.32 ± 4.28 | <0.001 |
| Se (μg) | 330.96 ± 117.44 | 406.61 ± 112.60 | 255.31 ± 58.96 | <0.001 |
| Model | Low CHINA-DII | High CHINA-DII | p-Value | per SD Increase | p-Value |
|---|---|---|---|---|---|
| hs-CRP | |||||
| Model 1 | 1.00 | 1.71 (1.04–2.80) | 0.034 | 1.40 (1.08–1.80) | 0.010 |
| Model 2 | 1.00 | 1.69 (1.02–2.81) | 0.044 | 1.40 (1.08–1.82) | 0.011 |
| Model 3 | 1.00 | 1.90 (1.01–3.55) | 0.046 | 1.50 (1.10–2.06) | 0.011 |
Disclaimer/Publisher’s Note: The statements, opinions and data contained in all publications are solely those of the individual author(s) and contributor(s) and not of MDPI and/or the editor(s). MDPI and/or the editor(s) disclaim responsibility for any injury to people or property resulting from any ideas, methods, instructions or products referred to in the content. |
© 2025 by the authors. Licensee MDPI, Basel, Switzerland. This article is an open access article distributed under the terms and conditions of the Creative Commons Attribution (CC BY) license (https://creativecommons.org/licenses/by/4.0/).
Share and Cite
Chen, Y.; Luo, Z.; Cheng, L.; Wang, Q.; Zou, F.; Warsi, M.A.; Lin, Y. Development and Validation of the China Dietary Inflammatory Index (CHINA-DII). Nutrients 2025, 17, 1687. https://doi.org/10.3390/nu17101687
Chen Y, Luo Z, Cheng L, Wang Q, Zou F, Warsi MA, Lin Y. Development and Validation of the China Dietary Inflammatory Index (CHINA-DII). Nutrients. 2025; 17(10):1687. https://doi.org/10.3390/nu17101687
Chicago/Turabian StyleChen, Yuhang, Zhijie Luo, Lu Cheng, Qingying Wang, Fengqin Zou, Mohammad Abidullah Warsi, and Yulan Lin. 2025. "Development and Validation of the China Dietary Inflammatory Index (CHINA-DII)" Nutrients 17, no. 10: 1687. https://doi.org/10.3390/nu17101687
APA StyleChen, Y., Luo, Z., Cheng, L., Wang, Q., Zou, F., Warsi, M. A., & Lin, Y. (2025). Development and Validation of the China Dietary Inflammatory Index (CHINA-DII). Nutrients, 17(10), 1687. https://doi.org/10.3390/nu17101687