Abstract
Fetal malnutrition, characterized by inadequate fat and muscle accretion during intrauterine development, has been linked to adverse outcomes, ranging from neonatal complications to long-term developmental and metabolic disorders. Traditionally, growth curves and birth weight have guided the assessment of newborns’ nutritional status; however, these measures often do not accurately reflect changes in body composition. This review compares several evaluation methods—CAN score (Metcoff methodology), body mass index (BMI), Ponderal Index (PI), McLaren Index, mid–upper arm circumference (MUAC), and plicometry—to provide suggestions on selecting the most appropriate approach, depending on the healthcare setting and population needs. Findings from multiple international studies indicate that the CAN score and BMI are among the most accurate tools, offering better sensitivity and specificity than traditional anthropometric indicators. The CAN score, based on a clinical observation of fat deposits, skin texture, and muscle tone, has been widely used in Latin America and remains a practical and cost-effective option. Nonetheless, recent research suggests that BMI, mainly when used alongside the PI, may outperform the CAN score in certain contexts. Considering the complexity of fetal nutritional assessments, integrating multiple methods enhances the diagnostic accuracy. Early identification of malnourished newborns is essential for timely intervention and improved long-term outcomes. Standardizing these diagnostic tools globally could advance efforts to reduce neonatal morbidity and mortality by 2030.
1. Introduction
Fetal and neonatal malnutrition remains a major public health concern globally, especially affecting low- and middle-income countries. Fetal malnutrition has been associated with higher risks of miscarriage, intrauterine growth restriction, anemia, and low birth weight [1,2]. In Latin America, inequalities in access to healthcare systems further exacerbate these situations, complicating the accurate assessment of newborns’ nutritional status. Neonates are particularly vulnerable to malnutrition, which can negatively impact both physical and neurocognitive development, increasing the risk of neurodevelopmental disorders, learning difficulties, and delayed motor milestones [3].
Clinical signs of neonatal malnutrition include fragile and sparse hair, a triangular facial appearance, loose and wrinkled skin around the neck, thin arms with accordion-like wrinkles, a lax-skinned abdomen, thin legs with accordion-like wrinkles, and fat loss over the back and flaccidity in the buttocks. These signs often coexist with wasting and growth retardation, conditions associated with higher rates of infant morbidity and mortality [4,5]. Over time, fetal malnutrition may also contribute to the onset of chronic diseases such as hypertension, type 2 diabetes, and cardiovascular diseases—a phenomenon known as “fetal programming” [6,7].
The primary causes of fetal malnutrition are inadequate maternal nutrition and placental insufficiency. These factors hinder the deposition of subcutaneous fat and muscle mass deposits during gestation [8,9], often resulting in excess skin on the neck, limbs, and buttocks and, in severe cases, an aged face of an emaciated infant [10].
Fetal malnutrition is estimated to affect 2% to 10% of all live births worldwide [11,12]. In 2022, approximately 149 million children under the age of five were affected by stunting, while approximately 45 million experienced wasting, reflecting the inadequate nutritional status in this age group [13,14]. Additionally, 19.1% of women of childbearing age were found to be anemic—a condition that can affect fetal growth and development [14]. In Latin America, around seven million children suffer from malnutrition. Countries such as Guatemala, Guyana, and Haiti report the highest prevalence, with over 10% of children affected. In contrast, Argentina, Brazil, Chile, and Jamaica have reported rates below 2.5% [13].
According to the Economic Commission for Latin America (CEPAL, by its Spanish acronym), the incidence of neonatal malnutrition has decreased; however, over 10% of newborns are still born with a low birth weight, and 5% experience intrauterine growth restriction [15]. The data on the incidence of neonatal malnutrition are limited, but estimates indicate that 14.6% of infants are born with a low birth weight [16]. These data highlight the need to implement more precise nutritional assessment methodologies tailored to the specific characteristics of neonates.
Among the available tools, neonatal anthropometry, growth curves, plicometry, and the Clinical Assessment of Nutritional Status (CAN score) methodology are the most used [15,17,18]. However, concerns about their sensitivity and specificity remain—especially in low- and middle-income countries—where disparities in healthcare access and variations in clinical practices may impact the early identification and effective intervention of malnutrition cases [19,20]. This highlights the importance of validating these methodologies to ensure their applicability in populations at high risk of malnutrition.
This article describes and addresses the gap in the comparative analysis among existing tools used for assessing the neonatal nutritional status. Furthermore, despite the importance of this assessment, the existing literature remains limited and often does not include crucial context-specific evaluations. The purpose of the present review is to perform a comprehensive review of the current neonatal nutrition assessment methodologies by analyzing the strengths and limitations of each approach and provide suggestions on selecting the most appropriate approach, depending on the healthcare setting and population needs.
2. Methodology
A comprehensive literature review was conducted using databases such as PubMed, SciELO, Redalyc, and Google Scholar. The search included keywords and MeSH terms such as neonatal malnutrition, neonatal nutritional assessment, Metcoff methodology or CAN score, growth curves, anthropometry, and plicometry.
The evidence reviewed in this article comes mainly from observational studies (prospective, retrospective, cross-sectional, and descriptive designs) and secondary analyses such as meta-analyses and systematic reviews. It is important to clarify that no clinical trials were included, as the evaluation of diagnostic tools for fetal malnutrition is typically conducted through observational research rather than interventional designs.
3. Description of Methodologies for the Evaluation of the Neonatal Nutritional Status
3.1. Anthropometry
For decades, anthropometry has been the most widely used method for assessing the neonatal nutritional status due to its accessibility and clinical applicability. This approach is based on measuring various body dimensions and comparing them to national and international standards, allowing for the identification of potential deviations in the growth of newborns. The most used measurements at birth include weight, length, and head, arm, thigh, and chest circumferences. These parameters have been used to construct growth curves for different gestational ages, facilitating fetal and neonatal growth monitoring [21]. In this context, birth weight determination has enabled the establishment of widely used classifications in clinical practice, differentiating neonates into categories such as low birth weight, very low birth weight, extremely low birth weight, adequate weight, and high birth weight [22].
The relationship between weight and gestational age has been a fundamental criterion for neonatal nutritional assessment. Based on this parameter, newborns can be classified as appropriate for gestational age (AGA), between the 10th and 90th percentiles; large for gestational age (LGA), above the 90th percentile; and small for gestational age (SGA), below the 10th percentile [23]. Nevertheless, although birth weight is a key indicator of nutritional status, its isolated use does not accurately determine the neonate’s body composition [10]. In recent years, the addition of complementary methods to assess neonatal nutrition has been encouraged, as relying on a single anthropometric measurement is inadequate for accurately determining a newborn’s nutritional status [24].
3.1.1. Mid–Upper Arm Circumference (MUAC)
The mid–upper arm circumference is a useful anthropometric indicator that provides both the muscle mass composition and fat reserves in the arm, offering a practical measure for overall body adiposity. Its sensitivity to rapid shifts in protein and fat stores makes it particularly valuable for monitoring the nutritional status of neonates. The upper limb is the preferred site for measurement due to its lower susceptibility to changes in body fluids compared to other body regions. This is particularly relevant in neonates with edema, where fluid fluctuations can affect the accuracy of other anthropometric measurements. Notably, specific growth standards like Rolland-Cachera and Sasanow curves have been developed to contrast the values with the corresponding gestational ages [25,26,27].
3.1.2. Thigh Circumference (TC)
TC is not a commonly assessed metric in preterm newborns [28]. Ashton et al. established significant positive correlations between the TC, MUAC, weight, length, and head circumference (HC) [29]. The utility of MUAC and TC in preterm newborns warrants further investigation because it is not clear how these measures are related to body composition. Term and preterm infant reference curves for MUAC and TC are available, including Merlob and Rached-Sosa curves [27,28,30,31].
Kanawati–McLaren Index or Mid–Upper Arm Circumference/Head Circumference (MUAC/HC) Ratio
This ratio is an anthropometric tool to assess children’s nutritional status. It is calculated by dividing the MUAC measurement, expressed in centimeters with millimeter precision, by the HC measurement with the same level of precision [32]. This ratio helps estimate the body correlation, combining a variable highly influenced by nutritional intake, the MUAC, with another one that remains more stable despite variations, the HC [25]. This balance between sensitivity and stability makes the MUAC/HC index particularly useful in identifying varying degrees of malnutrition in children older than 3 months. Standardized growth curves, such as Rached-Sosa curve have been designed for this approach; however, its application is limited due to a reduced sensitivity and particular cases, such as microcephaly [25,31,33].
3.2. CAN Score or Metcoff Methodology
The method was developed by Jack Metcoff in 1994, building upon the earlier observations of McLean, Usher, and Scott, whose findings were published between 1966 and 1970. This methodology has become a crucial tool for assessing the neonatal nutritional status. It is based on identifying nine signs of malnutrition in the neonate’s body, which are classified on a scale ranging from four (no evidence of malnutrition) to one (clear signs of intrauterine malnutrition). According to Metcoff’s guidelines, a score of 24 or higher indicates a preserved nutritional status, while a score below 24 indicates the presence of malnutrition (Figure 1) [34].
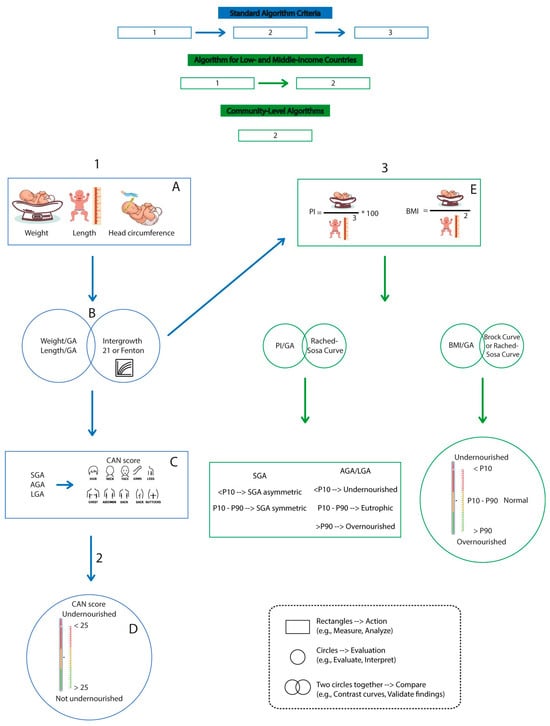
Figure 1.
Algorithms for assessing the nutritional status using various approaches. The chart presents algorithms for assessing the neonatal nutritional status across various settings, from high-income countries to community-level contexts, using direct measurements, clinical scores (such as the CAN score), and anthropometric indices, all supported by specific reference curves.
This method has demonstrated effectiveness in assessing body composition, allowing a more accurate diagnosis of neonatal malnutrition [34]. It has been widely used in several countries, particularly to differentiate between SGA newborns without malnutrition and those with malnutrition [35]. Although this approach is mainly used for term neonates, some studies have demonstrated its usefulness in preterm infants, albeit with slightly reduced sensitivity [36]. In fact, in several studies, this method has been considered the gold standard for evaluating neonatal malnutrition, enabling comparisons of the predictive value of other instruments [10].
In neonates with adequate or high weight for gestational age, the application of this method has demonstrated the ability to detect fetal malnutrition in 15.5% to 12.3% of neonates with AGA [10,37] and in 0.28% to 2.2% of neonates with high weight for gestational age [38,39].
The CAN score presents several advantages that support its utility in the nutritional assessment of neonates. Notably, it is simple to apply, requires no specialized equipment, and serves as a cost-effective and accessible tool for use in a wide range of clinical settings. Additionally, its simplicity and speed allow for continuous monitoring of nutritional changes without the need for complex calculations. The CAN score can also be applied regardless of weight for gestational age, expanding its usefulness in assessing neonates with different growth characteristics [10,35].
However, a key limitation of the CAN score is its dependency on the operator, as its accuracy is related to the experience and training of the professional. Studies have shown that there can be variability in the scores assigned by different evaluators, which may affect the score’s reproducibility and consistency [40].
3.3. Plicometry
Plicometry is a methodology for assessing the nutritional status and body, offering valuable insights into evaluating individual growth [41]. This method relies on measuring the thickness of skinfolds at various body sites, allowing for an estimation of the body composition, particularly the body fat percentage [41]. Its non-invasive nature, safety, and ease of access and interpretation make it a useful clinical tool for determining the neonatal nutritional status [42,43]. In the case where the subcutaneous fat tissue is reduced, it is associated with a delay in intrauterine growth, whereas fat tissue of the abdominal wall is not correlated, indicating that various factors determine the place for fat accumulation during intrauterine growth. In neonates, plicometry typically includes measurements of four or five skinfolds, with the most assessed being the subscapular, triceps, biceps, and suprailiac folds, while the least assessed is the quadriceps. The suprailiac fold is particularly useful to monitor fat mass in full-term and premature newborns. However, these measurements may not be appropriate for extremely premature neonates [44]. Despite its advantages, plicometry also has limitations, including being time-consuming, in comparison with the CAN score, a factor that should be considered in areas with limited healthcare personnel. Additionally, its accuracy depends on the evaluator’s skill, highlighting the need for trained personnel to ensure greater reliability in the measurements [40].
Standards like the Rodríguez curve have been established to compare the values obtained from the sum of folds, leading to the establishment of cut-off values for the 10th and 90th percentiles: 5.6 mm to 11.2 mm for girls and 6.7 mm to 11.9 mm for boys from 33 to 41 weeks of gestational age [45]. Moreover, plicometry allows the assessment of the ratio of central subcutaneous tissue to total folds (subscapular + suprailiac/total subcutaneous tissue (sum of folds) × 100) for each sex and for neonates from 33 to 41 weeks. Although these tables establish cut-off points, the study has limitations due to the small number of patients younger than 35 weeks who were included [45].
A cross-sectional anthropometric study conducted on 10,226 Chinese neonates from 28 to 42 weeks gestational age correlated sex anthropometric variables (PI, BMI, TC/HC, weight/HC, weight/height, and Kanawaki–McLaren index) and established that the weight/height ratio had the highest correlation with the fold sum value [46].
Furthermore, a strong correlation between body fat determined by skinfold thickness (SFT) and dual energy x-ray absorptiometry (DXA) has been reported in infants at birth [47]. For instance, Daly-Wolfe et al. observed a high correlation between suprailiac skinfold and body fat measurements determined by air displacement plethysmography (ADP) [48]. Nevertheless, these tools are rarely available for the routine evaluation of infants [49].
3.4. Ponderal Index (PI)
The PI, proposed by Rohrer in 1960, is a tool used to indirectly estimate neonatal adiposity and differentiate between symmetrical and asymmetrical SGA neonates [50]. It is calculated using the following formula:
Growth curves for IP/gestational age, such as Rached-Sosa, allow an increased precision in SGA newborns’ diagnosis and determine whether they are symmetrical (low weight and length) or asymmetrical (normal weight and length) [31,51].
The generally accepted cut-off point for defining fetal malnutrition is a PI of less than 2.2 g/cm3. In the classification of fetal growth disorders, newborns with a PI between 2.32 and 2.85 are considered symmetrical, while those with a PI above the 90th percentile are classified as overweight. Neonates below the 10th percentile with a PI between 2.15 and 2.31 are classified as wasted. Additionally, a PI below the third percentile for gestational age and sex is indicative of the SGA status [52]. Studies have reported a diagnostic sensitivity of 65% and a specificity of 93% for detecting malnutrition [53].
3.5. Body Mass Index (BMI)
Neonatal BMI relates weight to height, allowing for a more accurate assessment of the nutritional status at any age. Its application in the neonatal population has been the subject of multiple studies, including research by Brock et al. (2008), who established specific reference values for neonates and expressed them in sex-differentiated percentile curves [24]. Notably, a growth curve has been developed to assess Native American populations [31].
Table 1 represents a comparison between tools and indices used to diagnose the nutritional status of newborns.

Table 1.
Comparative Table of Indices Used to Diagnose the Nutritional Status of Newborns.
3.6. Growth Curves
Monitoring neonatal growth is essential for assessing the nutritional status. Growth curves serve as fundamental tools in the clinical follow-up of neonates, particularly in neonatal intensive care units [54]. However, there is no international consensus on the optimal methodology for evaluating neonatal growth, leading to the implementation of different approaches [55,56].
Among the existing methodologies, several internationally recognized growth curves have been developed and implemented in clinical practice. One of the most widely used methods is INTERGROWTH-21st, a reference standard derived from a multinational study conducted between 2009 and 2014 in Brazil, China, India, Italy, Kenya, Oman, the United Kingdom, and the United States. These growth curves provide international standards for weight, length, and HC according to gestational age, enabling assessments of fetal growth and neonatal anthropometric measurements from the 14th week of gestation up to two years of age [57,58]. These curves have demonstrated strong utility in distinguishing the relationship between the SGA status and increased risk of hospital mortality [59].
Another widely used model is the FENTON growth chart, based on a multicenter study conducted in six high-income countries with a predominantly Caucasian population. This method determines the birth weight of preterm infants by comparing it with the weight of term newborns while adjusting for gestational age. The FENTON chart facilitates the monitoring of a child’s growth alongside the WHO growth curves [60].
The OLSEN methodology was developed from a multicenter and multiethnic study in the United States, including newborns between 22 and 42 weeks of gestational age. This method considers multiple variables, such as birth weight, length, and HC, along with estimated gestational age, sex, and ethnicity [59].
In the Latin American context, the Centro Latinoamericano de Perinatología (CLAP by its acronym in Spanish) curves serve as a standardized method for tracking the growth of newborns between 24 and 44 weeks of gestational age. These curves were developed using data from various Latin American countries, making them a region-specific reference [61,62].
Finally, the LUBCHENCO curves were the first to be developed; they were created in 1963 based on a study conducted in the United States. This method describes fetal growth between 24 and 44 weeks of gestational age [63].
Table 2 presents a comparative analysis of the aforementioned growth curves, analyzing various parameters.
Table 2.
Comparison of growth curves [57,59,60,61,63,64,65].
4. Discussion
Fetal malnutrition results from a deficiency in muscle and fat accumulation during intrauterine life. It is clinically diagnosed by the presence of subcutaneous fat loss and reduced muscle mass in the newborn [34], regardless of birth weight or the weight-for-gestational age ratio. Intrauterine malnutrition triggers alterations in genetic programming, metabolism, and body composition, resulting in both short- and long-term complications. Immediate consequences include hypoglycemia, hypocalcemia, hypothermia, and polycythemia [12], while long-term issues may involve neurological disorders, learning difficulties, intellectual disability, metabolic syndrome, hypertension, obesity, and diabetes [23,24,25].
Over the years, various tools and methodologies have been used to comprehensively assess the newborn’s nutritional condition. The most commonly used include the weight-for-gestational age ratio (weight/GA) [66], length-for-gestational age ratio (length/GA), head circumference-for-gestational age PI [67], CAN score [34], BMI, MUAC, McLaren index (MUAC/HC) [32,67], and plicometry [37]. These tools offer complementary approaches that enhance the identification of fetal malnutrition and enable a more accurate classification of the neonatal nutritional status, supporting clinical decision-making.
The prevalence of fetal malnutrition varies depending on the region, country, diagnostic methodology used, and the time frame of studies. In some regions, a slight decline in prevalence has been reported since 2020 [12]. Traditionally, birth weight has been the primary diagnostic criterion for fetal malnutrition; however, this approach has limitations, as it does not assess the newborn’s body composition. Studies in Latin America estimate a fetal malnutrition prevalence of 14% to 16% when birth weight alone is used as the diagnostic criterion, whereas in developed countries, the prevalence is below 6%. These differences underscore the importance of implementing comprehensive assessment criteria for the accurate diagnosis of fetal malnutrition [68].
Additionally, a study conducted in Ethiopia by Sume reported a 12.3% prevalence of fetal malnutrition. This study identified that fetal malnutrition was associated with factors such as a lack of prenatal nutritional counseling, lower maternal MUAC, low maternal BMI, placental weight below 519 g, prematurity, and low birth weight [69]. Similarly, a meta-analysis incorporating data from Egypt, Nigeria, and Ethiopia found that Egypt had the highest prevalence of fetal malnutrition at 30%. In this analysis, Mussa et al. (2024) [12] reported that factors such as SGA, prematurity, and neonatal sepsis significantly contributed to this condition. Furthermore, differences in governmental nutritional intervention policies played a substantial role in the burden of fetal malnutrition across the studied countries [12]. These results highlight the geographical variability and the influence of socioeconomic determinants on the incidence of fetal malnutrition.
In 1966, the American Academy of Pediatrics coined the term “Small for Gestational Age” (SGA), marking a significant advancement in differentiating between low birth weight, prematurity, and low weight for gestational age [70,71]. Since its introduction, the diagnosis of SGA has been widely used in neonatal nutritional evaluations and assessments of its relationship with fetal or neonatal malnutrition. However, the CAN score was developed as a more objective and practical method for identifying fetal malnutrition [21].
Although, in previous decades, low birth weight was considered a key predictor of neonatal mortality, recent research has challenged this perspective. It is now known that birth weight alone is not a determining risk factor; rather, prematurity due to organ immaturity and fetal malnutrition due to metabolic alterations are the main risk factors for perinatal diseases and complications [72]. In this context, the diagnosis of fetal malnutrition has advanced beyond birth weight or even growth curves, as these criteria may be insufficient for detecting alterations in the neonatal body composition. Thus, the inclusion of the CAN score or BMI has been fundamental in improving the diagnostic accuracy for fetal malnutrition, providing a more precise assessment of the newborn’s nutritional status [35].
The CAN score has been employed in various observational studies and clinical settings to enhance the accuracy of newborn nutritional assessments [12,69,73]. In a retrospective study conducted on 77 term neonates, the CAN score was used to identify 50.3% of SGA newborns, 4.6% of AGA newborns, and 0.28% of LGA newborns who presented malnutrition, demonstrating the need to expand nutritional appraisal using this tool [39]. In the study by Mosan Raza et al., the CAN score identified malnutrition in 19.1% of neonates. A strong correlation was found between the CAN score and weight classifications (SGA, AGA, and LGA) (p < 0.001). Additionally, a bivariate analysis using Pearson’s test showed a significant and positive relationship between anthropometric indices (MAC/HC, BMI, and PI) and the CAN score (p < 0.05) [10].
In Latin America, several studies support the CAN score as the most appropriate tool for the neonatal nutritional assessment. For instance, a study conducted in Peru with a sample of 294 term newborns found that the CAN score had the best prognostic value for predicting neonatal morbidity. It was observed that newborns exposed to fetal malnutrition had a significantly higher risk of developing morbidity compared to those without fetal malnutrition (p < 0.05) [38].
Similarly, in Ecuador, a 2018 study involving 104 term neonates reported a malnutrition prevalence of 38%. This study used indicators such as weight-for-gestational age, length-for-gestational age, the McLaren index, and the CAN score. The results indicated that the CAN score was the most effective tool for determining the nutritional status of the newborn [74].
Various studies have compared the CAN score with other nutritional evaluation methods, such as growth curves, and have demonstrated better results in detecting neonatal malnutrition. A prospective study conducted by Alberca Garcia et al. (2019) on 93 term newborns with AGA (determined using Intergrowth 21st growth curves) found a malnutrition incidence of 16.1%. These malnourished neonates would not have been identified without the application of the CAN score [75]. This result is comparable to malnutrition prevalence rates ranging from 12% to 19%, as reported in studies from various regions worldwide [10,12,68], which used not only birth weight and growth curves but also additional nutritional assessment tools, such as the CAN score, BMI, PI, and plicometry.
Although the CAN score has proven to be an effective tool for assessing the neonatal nutritional status, some studies suggest that BMI may have greater sensitivity in detecting malnutrition. To determine the best method for the neonatal nutritional evaluation, Thomas and collaborators conducted a study on 1000 neonates born in Mangalore, India, comparing the performance of BMI and the CAN score. The results showed that 25.9% of newborns had a BMI below the 10th percentile (malnutrition) and 9.9% had a BMI below the 3rd percentile (severe malnutrition). On the other hand, when the CAN score was used for the assessment, 31.9% of neonates were diagnosed with malnutrition. The difference in test performance was statistically significant (p < 0.001), revealing that BMI was a better indicator of the nutritional status [76].
Similarly, Tiwari A.K., in a study involving 349 term neonates, applied various indices (BMI, PI, McLaren Index, and CAN score) to determine the most effective method for evaluating the neonatal nutritional status. It was found that BMI had the highest sensitivity (75.7%, p < 0.001), and when combined with the PI, the sensitivity increased to 89.1% [77]. In 2008, Brock et al., in a study conducted with 2406 neonates with AGA, used the growth curve developed by Alexander et al. as a reference to establish BMI values for each gestational age [24]. These BMI curves for newborns are now a valuable tool for determining the neonatal nutritional status.
Furthermore, Gupta conducted a study in India, comparing the effectiveness of different methods for neonatal nutritional assessments and using the CAN score as the gold standard for diagnosis. The study evaluated birth weight, weight-for-gestational age, length, HC, MUAC, PI, and the CAN score. The cut-off points for diagnosing malnutrition were: PI <2.2 g/cm3, McLaren Index (MUAC/HC) of 0.27, and BMI of 11.20 kg/m2. The results revealed that 4% of neonates with AGA were malnourished, while the prevalence reached 42.9% in neonates with a low birth weight for gestational age [78].
Furthermore, when evaluating the sensitivity and specificity of different tools for detecting neonatal malnutrition, the results vary across indicators and studies (Table 3). These findings highlight the need for a complementary assessment approach, as no single tool is sufficient. In low-resource settings, simple, low-cost methods like the CAN score are especially useful. Adapting strategies to the local context improves the detection and management of neonatal malnutrition. In terms of the sensitivity and specificity of each indicator, the McLaren Index (MUAC/HC) has a sensitivity of 39.68% and specificity of 75.6%, the CAN score has a sensitivity of 71.88% and specificity of 89.9%, BMI has a sensitivity of 84.48% and specificity of 75.5%, and the PI has a sensitivity of 53.76% and specificity of 84.14% [78]. BMI and the CAN score were the most sensitive tools for detecting neonatal malnutrition, emphasizing the importance of using multiple tools for neonatal nutritional assessments, as each indicator has strengths and limitations [78].
Table 3.
Sensitivity and specificity of each tool.
On the other hand, plicometry has been explored as a complementary tool in determining the nutritional status. Its relationship with other methods, such as the CAN score, has been studied to establish its role in detecting neonatal malnutrition. For example, Kafle and his collaborators conducted a neonatal skinfold study on 370 neonates and compared it with the CAN score and anthropometry. Five measurements were taken (biceps, triceps, upper iliac, quadriceps, and subscapular region), and the average values found were 4.3 ± 1.61 mm and 4.18 ± 0.72 mm in males and females, respectively. All the measured skinfolds correlated with the CAN score, but the sum of the five had the highest correlation. However, this study lacked the necessary sensitivity or specificity to replace the CAN score [40].
Similarly, another study compared plicometry with the CAN score. The CAN score was correlated with each of the five skinfold measurements taken (biceps, triceps, upper iliac, quadriceps, and subscapular region). All measurements were on the right side of the body. The sum of the values for these five skinfolds was 3.34 ± 0.96 mm and 4.21 ± 0.35 mm (p < 0.001) in malnourished and well-nourished neonates, respectively. This study concluded that plicometry is a valuable tool for assessing the neonatal nutritional status, but its sensitivity and specificity are lower than the CAN score [73].
Table 4 summarizes what has been described in the literature according to different parameters.
Table 4.
Summary of the literature review.
These studies demonstrate that neonatal nutritional assessment cannot be performed with just one parameter but rather requires a complementary evaluation using more than one instrument or methodology to increase the accuracy of the diagnosis [35]. The implementation of more sensitive and specific methods, such as the CAN score and the neonatal BMI, allows for the more precise identification of neonates at risk. This strategy not only optimizes resource allocation in maternal–child health programs but also contributes to reducing neonatal morbidity and mortality.
5. Future Directions
Fetal malnutrition remains a public health challenge with a variable prevalence, depending on the socioeconomic context and the methodologies used for diagnosis. In this context, early identification and comprehensive management of fetal malnutrition are crucial to achieve the global goal of reducing mortality by 2030 [79]. Additionally, the inclusion or development of a multiethnic BMI curve applicable to different neonatal populations may provide an accessible and standardized reference to enhance nutritional evaluations across diverse settings.
Future research on neonatal nutritional assessments should focus on designing and validating standardized, multicenter diagnostic protocols that integrate both clinical observations and anthropometric measures. As technology continues to evolve, innovative tools such as portable digital imaging systems, machine learning algorithms, natural language processing, artificial neural networks, and biochemical markers offer promising avenues to improve the accuracy and timeliness of malnutrition detection—particularly in resource-constrained environments. Mobile applications integrated with electronic health records (EHRs) could further improve real-time monitoring and continuity of care.
Recent studies report that machine learning models, like Random Forest, predict an infant’s nutritional status with >98% accuracy [80]. In addition, analyses based on massive EHR data, such as those performed on platforms like IBM Watson Health Explorys, have identified critical associations between malnutrition and developmental abnormalities [81]. However, a systematic review found that over 90% of these AI models are not yet applied in clinical practice [82].
Although much of the research focuses on pediatrics, these findings are highly relevant to fetal undernutrition. The integration of AI with mobile tools, EHRs, and clinical decision support systems (DSS) could transform maternal–fetal nutrition screening.
As an innovative contribution, our team has developed a clinical chatbot (https://poe.com/Nutritional-Status , accessed on 01 May 2025) in the pilot phase that, through targeted questions based on validated tools such as the CAN score, BMI, fetal growth curves, and other key indicators, guides the clinician in identifying and assessing the fetal nutritional risk. Although this chatbot is still in the testing stage, its design aims to facilitate evidence-based decision-making and provide interactive and accessible support for clinical teams.
6. Conclusions
Fetal and neonatal malnutrition remain major global health challenges, especially in low-resource settings. The evidence highlights the limitations of birth weight or growth curves alone, emphasizing the need for complementary tools such as the CAN score, BMI, and PI. These provide greater sensitivity and specificity, identifying malnourished neonates who may appear to have appropriate growth by standard metrics but exhibit signs of an altered body composition.
The CAN score, validated through systematic reviews and meta-analyses, is considered the gold standard for diagnosing undernutrition. Its high accuracy, low cost, and simplicity make it ideal for routine applications. Unlike other indices, it does not need to be contrasted with reference curves, allowing broader use—especially in low- and middle-income countries where prenatal data may be limited—facilitating early detection and closer monitoring.
While PI and BMI used together improve specificity, they depend on gestational age curves, complicating their implementation in rural or low-income areas [83]. Lastly, it is essential to consider not only clinical indicators using normalized data but also national health standards and broader social determinants that may influence neonatal nutrition.
Author Contributions
M.L.F., C.B. and S.N.: conceptualization and writing—review and editing. A.K.Z., P.G.-R., S.C.-U., S.H., M.L.F., C.B. and S.N.: writing—original draft. M.L.F., C.B. and S.N.: investigation. A.K.Z.: supervision. All authors have read and agreed to the published version of the manuscript.
Funding
No funding was received. The publication of this article was funded by Universidad UTE-Ecuador. The funder had no role in the study design, bibliographic analysis, decision to publish, or preparation of the manuscript.
Institutional Review Board Statement
Not applicable.
Informed Consent Statement
Not applicable.
Data Availability Statement
No new data were created or analyzed in this study. Data sharing is not applicable to this article.
Acknowledgments
The authors are grateful to Universidad UTE for their support.
Conflicts of Interest
The authors declare no competing interests.
References
- Yuliarti, Y.; Ermi, N.; Arinda, D.F. The Causes of Malnutrition for Pregnant Mothers Analysis and The Impact on the COVID-19 Pandemic. J. Ilmu Kesehat. Masy. 2022, 13, 210–223. [Google Scholar] [CrossRef]
- Black, R.E.; Victora, C.G.; Walker, S.P.; Bhutta, Z.A.; Christian, P.; De Onis, M.; Ezzati, M.; Grantham-Mcgregor, S.; Katz, J.; Martorell, R.; et al. Maternal and child undernutrition and overweight in low-income and middle-income countries. Lancet 2013, 382, 427–451. [Google Scholar] [CrossRef]
- Grantham-McGregor, S.; Cheung, Y.B.; Cueto, S.; Glewwe, P.; Richter, L.; Strupp, B. Developmental potential in the first 5 years for children in developing countries. Lancet 2007, 369, 60–70. [Google Scholar] [CrossRef] [PubMed]
- Goldberg, D.L.; Becker, P.J.; Brigham, K.; Carlson, S.; Fleck, L.; Gollins, L.; Sandrock, M.; Fullmer, M.; Van Poots, H.A. Identifying Malnutrition in Preterm and Neonatal Populations: Recommended Indicators. J. Acad. Nutr. Diet. 2018, 118, 1571–1582. [Google Scholar] [CrossRef] [PubMed]
- Victora, C.G.; Adair, L.; Fall, C.; Hallal, P.C.; Martorell, R.; Richter, L.; Sachdev, H.S. Maternal and child undernutrition: Consequences for adult health and human capital. Lancet 2008, 371, 340–357. [Google Scholar] [CrossRef]
- Barbosa Aguila, M.; Ornellas, F.; Alberto Mandarim-de-Lacerda, C. Nutritional Research and Fetal Programming: Parental Nutrition Influences the Structure and Function of the Organs Investigación Nutricional y Programación Fetal: La Nutrición Parental Influye en la Estructura y Función de los Órganos. Int. J. Morphol. 2021, 39, 327–334. [Google Scholar] [CrossRef]
- Gluckman, P.D.; Hanson, M.A.; Pinal, C. The developmental origins of adult disease. Matern. Child Nutr. 2005, 1, 130–141. [Google Scholar] [CrossRef]
- Tesfa, D.; Teshome, F.; Ambaw, B. Fetal Malnutrition and Associated Factors among Term Newborn Babies at Birth in South Gondar Zone Hospitals, Northwest Ethiopia. Int. J. Pediatr. 2021, 2021, 5005365. [Google Scholar] [CrossRef]
- Simmons, R. Abnormalities of Fetal Growth. In Avery’s Diseases of the Newborn, 10th ed.; Elsevier: Amsterdam, The Netherlands, 2017; pp. 61–69.e3. [Google Scholar]
- Raza, M.; Imani, B.; Dordipour, M.; Pourbadakhshan, N. Use of CANSCORE for Clinical Assessment of Nutritional Status of Newborn and Its Comparison with Anthropometric Criteria. J. Pediatr. Perspect. 2024, 12, 18712–18720. [Google Scholar]
- Crosby, W.M. Studies in fetal malnutrition. Am. J. Dis. Child. 1991, 145, 871–876. [Google Scholar] [CrossRef]
- Mussa, I.; Debella, A.; Maruta, M.B.; Getachew, T.; Regassa, L.D.; Gamachu, M.; Deressa, A.; Mohammed, F.; Birhanu, A.; Fikradin, H.; et al. Fetal malnutrition among neonates in African countries: A CAN score systematic review and meta-analysis. Nutr. J. 2024, 23, 102. [Google Scholar] [CrossRef]
- Malnutrición. Available online: https://www.who.int/es/news-room/fact-sheets/detail/malnutrition (accessed on 27 October 2024).
- Grajeda, R.; Hassell, T.; Ashby-Mitchell, K.; Uauy, R.; Nilson, E. Meeting Report Regional Overview on the Double Burden of Malnutrition and Examples of Program and Policy Responses: Latin America and the Caribbean. Ann. Nutr. Metab. 2019, 75, 139–143. [Google Scholar] [CrossRef] [PubMed]
- Malnutrition Among Children in Latin America and the Caribbean | Economic Commission for Latin America and the Caribbean. Available online: https://www.cepal.org/en/insights/malnutrition-among-children-latin-america-and-caribbean#_ftnref3 (accessed on 12 February 2025).
- Global Nutrition Report | Country Nutrition Profiles—Global Nutrition Report. Available online: https://globalnutritionreport.org/resources/nutrition-profiles/ (accessed on 12 March 2025).
- Choudhary, T.S.; Kumar, M.; Sinha, B.; Shaikh, S.; Mazumder, S.; Taneja, S.; Bhandari, N. Anthropometric Indicators as Predictors of Mortality in Early Life Among Low Birthweight Indian Infants. Front. Nutr. 2022, 9, 884207. [Google Scholar] [CrossRef]
- Rashidi, A.A.; Norouzy, A.; Imani, B.; Nematy, M.; Heidarzadeh, M.; Taghipour, A. Different methods for assessment of nutritional status in newborn infants based on physical and anthropometric indexes: A short review article. Rev. Clin. Med. 2017, 4, 35–38. [Google Scholar]
- Galicia, L.; López De Romaña, D.; Harding, K.B.; De-Regil, L.M.; Grajeda, R. Tackling malnutrition in Latin America and the Caribbean: Challenges and opportunities. Rev. Panam. Salud Publica 2016, 40, 138–146. [Google Scholar]
- Correia, M.I.T.D.; Perman, M.I.; Waitzberg, D.L. Hospital malnutrition in Latin America: A systematic review. Clin. Nutr. 2017, 36, 958–967. [Google Scholar] [CrossRef]
- Fernández, A.; De Salud, M.; Vizzotti, C.; De Acceso, S.; Salud, L.; Tirado, S.; De, S.; Sanitarias, E.; Castelli, J.M.; Daniel Bellone, M.; et al. Autoridades Nacionales Presidente de la Nación. Available online: https://bit.ly/3wqYA61 (accessed on 12 March 2025).
- Cutland, C.L.; Lackritz, E.M.; Mallett-Moore, T.; Bardají, A.; Chandrasekaran, R.; Lahariya, C.; Nisar, M.I.; Tapia, M.D.; Pathirana, J.; Kochhar, S.; et al. Low birth weight: Case definition & guidelines for data collection, analysis, and presentation of maternal immunization safety data. Vaccine 2017, 35, 6492. [Google Scholar] [PubMed]
- Ministerio de Salud Pública Ecuador. GPC-Recén-Nacido-Prematuro. Available online: https://www.salud.gob.ec/wp-content/uploads/2016/09/GPC-Rec%C3%A9n-nacido-prematuro.pdf (accessed on 21 April 2025).
- Brock, R.S.; Falcão, M.C.; Leone, C.; Cícero Falcão, M. Body mass index values for newborns according to gestational age. Nutr. Hosp. 2008, 23, 487–492. [Google Scholar] [PubMed]
- Galindo-Aguilar, O.U.; Rodríguez, I.; Ochoa, E.; Nieto, A.; Medina, Y.; Morales, I. Triglicéridos de cadena media vía oral en prematuros y su relación con la circunferencia braquial. Rev. Médica (Col. De Médicos Y Cir. De Guatemala) 2023, 162, 24–31. [Google Scholar] [CrossRef]
- Rolland-Cachera, M.; Deheeger, M.; Bellisle, F.; Sempé, M.; Guilloud-Bataille, M.; Patois, E. Adiposity rebound in children: A simple indicator for predicting obesity. Am. J. Clin. Nutr. 1984, 39, 129–135. [Google Scholar] [CrossRef]
- Sasanow, S.R.; Georgieff, M.K.; Pereira, G.R. Mid-arm circumference and mid-arm/head circumference ratios: Standard curves for anthropometric assessment of neonatal nutritional status. J. Pediatr. 1986, 109, 311–315. [Google Scholar] [CrossRef]
- Merlob, P.; Siva, Y. Thigh circumference and thigh-to-head ratio in preterm and term infants. J. Perinatol. 1994, 14, 479–482. [Google Scholar]
- Ashton, J.J.; Johnson, M.J.; Pond, J.; Crowley, P.; Dimitrov, B.D.; Pearson, F.; Beattie, R.M. Assessing the growth of preterm infants using detailed anthropometry. Acta Paediatr. Int. J. Paediatr. 2017, 106, 889–896. [Google Scholar] [CrossRef] [PubMed]
- Ehrenkranz, R.A.; Younes, N.; Lemons, J.A.; Fanaroff, A.A.; Donovan, E.F.; Wright, L.L.; Katsikiotis, V.; Tyson, J.E.; Oh, W.; Shankaran, S.; et al. Longitudinal growth of hospitalized very low birth weight infants. Pediatrics 1999, 104, 280–289. [Google Scholar] [CrossRef] [PubMed]
- Rached-Sosa, I.; Henríquez-Pérez, G. Percentile distribution of anthropometric variables in pregnant women. Arch. Latinoam. Nutr. 2015, 65, 166–172. [Google Scholar] [PubMed]
- Chevalier, P. El indice de Kanawati-McLaren o relacion brazo/cabeza: Una tecnica sencilla de conocer el estado nutricional de un nino. Diagnostic 1993, 32, 27–29. [Google Scholar]
- Centro de Atención Nutricional Infantil, Antímano. Nutrición en Pediatría Tomo I, 2nd ed.; Empresas Polar: Caracas, Venezuela, 2009. [Google Scholar]
- Metcoff, J. Clinical assessment of nutritional status at birth. Fetal malnutrition and SGA are not synonymous. Pediatr. Clin. N. Am. 1994, 41, 875–891. [Google Scholar] [CrossRef]
- Armaza Cespedes, A.; Medina, B.M.; Gareca, E.; Dorado R., C.; Mamani Ortiz, Y.; Romero Marca, D.J. Utilidad del CANS* SCORE para valoración clínica del estado nutricional del recién nacido. Gac. Médica Boliv. 2021, 44, 6–13. [Google Scholar] [CrossRef]
- Ezenwa, B.N.; Ezeaka, V.C. Is canscore a good indicator of fetal malnutrition in preterm newborn. Alex. J. Med. 2018, 54, 57–61. [Google Scholar] [CrossRef]
- Kapoor, A.; Awasthi, S.; Yadav, A.; Tiwari, S. Assessment of Foetal Malnutrition Using CAN Score and its Comparison with Various Anthropometric Parameters and Proportionality Indices. J. Nepal Paediatr. Soc. 2021, 41, 320–326. [Google Scholar] [CrossRef]
- Salazar-Alarcón, J.L.; Núñez-Guevara, J.C.; Sosa- Flores, J.L.; Díaz-Vélez, C.; Zegarra-Hinostroza, C.; Salazar-Zegarra, J. Método metcoff y peso para edad gestacional por capurro como factores pronósticos de morbilidad y mortalidad durante el periodo neonatal precoz en recién nacidos a término parto vaginal. Rev. Cuerpo Méd. Hosp. Nac. Almanzor Aguinaga Asenjo 2018, 11, 241–249. [Google Scholar]
- Martínez-Nadal, S.; Demestre, X.; Raspall, F.; Vila, C.; Álvarez, J.; Sala, P. Valoración clínica del estado nutricional fetal al nacer mediante el Clinical Assessment of Nutritional Status score. An. Pediatr. (Engl. Ed) 2016, 84, 218–223. [Google Scholar] [CrossRef] [PubMed]
- Kafle, R.; Gupta, R.; Kumar Gupta, B. Original Article Skin Fold Thickness in Newborns. J. Nepal Paediatr. Soc. 2020, 40, 241–246. [Google Scholar] [CrossRef]
- Álvarez, M.L.; Borno, S.; Brito, C.; Caraballo, L.; Castro, C.; Colmenares, Y.; Díaz, A.; Dini, E.; Domínguez, C.; Durán, A. Nutrición en Pediatría; Tercera Edición; Empresas Polar: Caracas, Venezuela, 2023. [Google Scholar]
- Díez López, I.; Cernada, M.; Galán, L.; Boix, H.; Ibañez, L.; Couce, M.L. Recién nacido pequeño para la edad gestacional: Concepto, diagnóstico y caracterización neonatal, seguimiento y recomendaciones. An. Pediatr. (Engl. Ed.) 2024, 101, 124–131. [Google Scholar] [CrossRef]
- Olutekunbi, O.A.; Solarin, A.U.; Senbanjo, I.O.; Disu, E.A.; Njokanma, O.F. Skinfold Thickness Measurement in Term Nigerian Neonates: Establishing Reference Values. Int. J. Pediatr. 2018, 2018, 3624548. [Google Scholar] [CrossRef]
- Bala, F.E.; McGrattan, K.E.; Valentine, C.J.; Jadcherla, S.R. A Narrative Review of Strategies to Optimize Nutrition, Feeding, and Growth among Preterm-Born Infants: Implications for Practice. Adv. Nutr. 2024, 15, 100305. [Google Scholar] [CrossRef]
- Rodríguez, G.; Samper, M.P.; Olivares, J.L.; Ventura, P.; Moreno, L.A.; Pérez-González, J.M. Skinfold measurements at birth: Sex and anthropometric influence. Arch. Dis. Child. Fetal Neonatal Ed. 2005, 90, 273–275. [Google Scholar] [CrossRef]
- Fok, T.F.; Hon, K.L.; Ng, P.C.; Wong, E.; So, H.K.; Lau, J.; Chow, C.B.; Lee, W.H.; Chan, A.K.H.; Tsao, Y.C.; et al. Use of anthropometric indices to reveal nutritional status: Normative data from 10,226 Chinese neonates. Neonatology 2009, 95, 23–32. [Google Scholar] [CrossRef]
- Koo, W.W.K.; Walters, J.C.; Hockman, E.M. Body composition in neonates: Relationship between measured and derived anthropometry with dual-energy x-ray absorptiometry measurements. Pediatr. Res. 2004, 56, 694–700. [Google Scholar] [CrossRef]
- Daly-Wolfe, K.M.; Jordan, K.C.; Slater, H.; Beachy, J.C.; Moyer-Mileur, L.J. Mid-arm circumference is a reliable method to estimate adiposity in preterm and term infants. Pediatr. Res. 2015, 78, 336–341. [Google Scholar] [CrossRef]
- Bueno-Hernández, N.; Briones-Garduño, J.C.; Fonseca-Sánchez, M.Á.; Meléndez, G.; Escobedo, G.; Esquivel-Velázquez, M. Bioelectrical impedance vector (BIVA) reference values for healthy term newborns 1–2 days old. Clin. Nutr. ESPEN 2025, 66, 421–428. [Google Scholar] [CrossRef] [PubMed]
- Paisán Grisolía, L.; Sota Busselo, I.; Muga Zurriarían Imaz Murgiondo Hospital Donostia San Sebastián, O.M. El Recién Nacido de Bajo Peso. Available online: www.aeped.es/protocolos/ (accessed on 16 March 2025).
- Henríquez, P.G.; Arenas, O.; Guerrero, B.P. Distribuciones percentilares para peso, talla, circunferencia cefálica, talla vertex isquion, circunferencia media de brazo y longitud de pie en recién nacidos. An. Venez. De Nutrición 1997, 10, 5–13. [Google Scholar]
- Grupo de Trabajo de Estudio del paciente Pequeño para la edad Gestacional (PEG). NIÑO PEQUEÑO PARA LA EDAD GESTACIONAL RECOMENDACIONES PARA EL SEGUIMIENTO CLÍNICO. Available online: https://www.aeped.es/sites/default/files/documentos/guia_peg_final-111028.pdf (accessed on 2 April 2025).
- Chagoyán, O.T.; Franco, L.V.; Thompson Chagoyán, O. Sensibilidad y especificidad del índice ponderal de Rohrer en el diagnóstico de la desnutrición intrauterina. Rev. Mex. De Pediatría 2000, 67, 255–258. [Google Scholar]
- Yazici, A.; Buyuktiryaki, M.; Sari, F.N.; Akin, M.S.; Ertekin, O.; Alyamac Dizdar, E. Comparison of different growth curves in the assessment of extrauterine growth restriction in very low birth weight preterm infants. Arch. De Pédiatrie 2023, 30, 31–35. [Google Scholar] [CrossRef] [PubMed]
- Reddy, K.V.; Sharma, D.; Vardhelli, V.; Bashir, T.; Deshbotla, S.K.; Murki, S. Comparison of Fenton 2013 growth curves and Intergrowth-21 growth standards to assess the incidence of intrauterine growth restriction and extrauterine growth restriction in preterm neonates ≤32 weeks. J. Matern.-Fetal Neonatal Med. 2021, 34, 2634–2641. [Google Scholar] [CrossRef] [PubMed]
- Bhatia, J. Growth Curves: How to Best Measure Growth of the Preterm Infant. J. Pediatr. 2013, 162, S2–S6. [Google Scholar] [CrossRef]
- Papageorghiou, A.T.; Kennedy, S.H.; Salomon, L.J.; Altman, D.G.; Ohuma, E.O.; Stones, W.; Gravett, M.G.; Barros, F.C.; Victora, C.; Purwar, M.; et al. The INTERGROWTH-21st fetal growth standards: Toward the global integration of pregnancy and pediatric care. Am. J. Obstet. Gynecol. 2018, 218, S630–S640. [Google Scholar] [CrossRef]
- Villar, J.; Ismail, L.C.; Victora, C.G.; Ohuma, E.O.; Bertino, E.; Altman, D.G.; Lambert, A.; Papageorghiou, A.T.; Carvalho, M.; Jaffer, Y.A.; et al. International standards for newborn weight, length, and head circumference by gestational age and sex: The Newborn Cross-Sectional Study of the INTERGROWTH-21st Project. Lancet 2014, 384, 857–868. [Google Scholar] [CrossRef]
- Figueras Aloy, J.; Izquierdo Renau, M.; Herranz Barbero, A.; Urquía Martí, L.; García-Muñoz Rodrigo, F.; Iriondo Sanz, M.; García Algar, Ó. Análisis comparativo de las curvas de crecimiento fetal y neonatal. An. Pediatr. (Engl. Ed) 2024, 100, 333–341. [Google Scholar] [CrossRef]
- Fenton, T.R.; Kim, J.H. A systematic review and meta-analysis to revise the Fenton growth chart for preterm infants. BMC Pediatr. 2013, 13, 59. [Google Scholar] [CrossRef]
- Guayasamín, O.; Benedetti, W.L.; Althabe, O.; Nieto, F.; Tenzer, S. Crecimiento Fetal Humano Valorado por Indicadores Antropometricos. Boletín De La Oficina Sanitaria Panamericana 1976, 481–488. Available online: https://iris.paho.org/bitstream/handle/10665.2/17522/v81n6p481.pdf?sequence=1&isAllowed=y (accessed on 2 April 2025).
- Organización Panamericana de la Salud, Organización Mundial de la Salud. Guías Para el Continuo de la Atención de la Mujer y el Recién Nacido. Cuarta Edición. 2019. Available online: https://iris.paho.org/handle/10665.2/51740 (accessed on 13 March 2025).
- Lubchenco, L.O.; Searls, D.T.; Brazie, J.V. Neonatal mortality rate: Relationship to birth weight and gestational age. J. Pediatr. 1972, 81, 814–822. [Google Scholar] [CrossRef] [PubMed]
- Montealegre Pomar, A.D.P. Controversias En La Elección de Curvas de Crecimiento Para Evaluar Los Recién Nacidos Colombianos. Pediatria (Bucur) 2021, 54, 71–77. [Google Scholar] [CrossRef]
- Díaz-Granda, R.C.; Díaz-Granda, L.E. Validation of Intrauterine Growth Anthropometric Curves: Hospital Vicente Corral, Cuenca, Ecuador, 2013. Maskana 2016, 7, 71–82. [Google Scholar] [CrossRef]
- Campos, J.d.O.; Silva, A.M.d.; Santana, M.S.d.; Oliveira, T.L.P.S.d.; Rocha, C.S.d.A.; Silva, A.R.d.; Silva, G.M.d.; Silva, J.S.d.; Pereira, C.S.d.S.P.A.; Carvalho, M.F. Avaliação do estado nutricional de recém-nascidos pré-termo em unidade de terapia intensiva neonatal/Assessment of nutritional status of preterm newborns in the neonatal intensive care unit. Braz. J. Dev. 2020, 6, 80007–80028. [Google Scholar]
- Sethi, A.; Gandhi, D.D.; Patel, S.H.; Presswala, D.K.; Patel, S.B. Canscore-Important Index for Detection of Fetal Malnutrition at Birth. Natl. J. Med. Res. 2016, 6, 226–229. [Google Scholar]
- Sume, B.W.; Afework, M. Comparative Assessment of Fetal Malnutrition Using the Clinical Assessment of Nutritional Score and Anthropometry Among Newborns Delivered at Debre Markos Comprehensive Specialized Hospital, Ethiopia. J. Neonatol. 2024, 39, 222–228. [Google Scholar] [CrossRef]
- Sume, B.W. Fetal malnutrition and associated factors among newborn babies delivered at Debre Markos Comprehensive Specialized Hospital, Ethiopia. Int. J. Afr. Nurs. Sci. 2023, 18, 100543. [Google Scholar] [CrossRef]
- Silverman, W.A.; Lecey, J.F.; Beard, A.; Brown, A.K.; Cornblath, M.; Grossman, M.; Little, J.A.; Lubchenco, L.O.; Metcoff, J.; Schaffer, A.J.; et al. Committee on Fetus and Newborn Nomenclature for Duration of Gestation, Birth Weight and Intra-Uterine Growth. Pediatrics 1967, 39, 935–939. [Google Scholar] [CrossRef]
- Battaglia, F.C.; Lubchenco, L.O. A practical classification of newborn infants by weight and gestational age. J. Pediatr. 1967, 71, 159–163. [Google Scholar] [CrossRef]
- Lucas, M.N. Low birth weight—The less than 2500g cut-off: Is it applicable to Sri Lanka? Sri Lanka J. Perinat. Med. 2023, 4, 6–17. [Google Scholar] [CrossRef]
- Gul, H.; Ullah, I.; Khan, M.Q.; Hayat, A.K.; Khan, A.; Asma, B. Comparison of the CAN (Clinical Assessment of Nutrition) Score with other Anthropometric Parameters to Determine the Importance of The Skin Fold Thickness for Foetal Nutrition Assessment. Pak. J. Health Sci. 2023, 4, 87–91. [Google Scholar] [CrossRef]
- Guerra Salvatierra, G.D.; Villalta Troya, A.D. Estudio Comparativo Entre el CANS Score y Valoración Antropométrica Convencional en el Recién Nacido en el Área de Materno Infantil del Hospital Dr. Teodoro Maldonado Carbo. Guayaquil, Ecuador 2018. Available online: https://www.semanticscholar.org/paper/Estudio-comparativo-entre-el-CANS-score-y-en-el-en-Salvatierra-Troya/b624b58629a0a896f1f6facaa14496047de05174 (accessed on 16 March 2025).
- Isenia García Alberca, M.; Humberto Leiva Herrada, C.; José Leiva Parra, E. Valoración del estado nutricional de recién nacidos por el método de Metcoff Assessing nutritional status of newborns by Metcoff’s method. Ágora Rev. Cient. 2019, 6, e6. [Google Scholar] [CrossRef]
- Thomas, T.K.; Kamath, M.K.; Raj, K.H.; Thomas, T.; Shetty, H.R. Clinical assessment of nutrition status score and body mass index in newborns. Int. J. Health Sci. 2022, 6, 10624–10635. [Google Scholar] [CrossRef]
- Tiwari, A.K.; Bandyopadhyay, D.; Saha, B. Anthropometric indices and clinical assessment of nutrition score (CAN Score) in detection of fetal malnutrition at birth. Pediatr. Rev. Int. J. Pediatr. Res. 2018, 5, 175–179. [Google Scholar] [CrossRef]
- Gupta, M.; Gupta, M.; Garg, P.; Chadha, V. Assessment of neonatal malnutrition in AGA, SGA and IUGR babies, comparing CAN (Clinical Assessment of Nutrition) score with other traditional methods. Int. J. Acad. Med. Pharm. 2023, 5, 1152–1155. [Google Scholar]
- Unidas, N. La Agenda 2030 y los Objetivos de Desarrollo Sostenible: Una oportunidad para América Latina y el Caribe. Available online: https://www.cepal.org/es/publicaciones/40155-la-agenda-2030-objetivos-desarrollo-sostenible-oportunidad-america-latina-caribe (accessed on 16 March 2025).
- Selemani, B.; Machuve, D.; Mduma, N. Machine learning model for predicting fetal nutritional status. Comput. Ecol. Softw. 2024, 14, 68–76. [Google Scholar]
- Gurkas, P.; Karakurt, G. Electronic Health Record Analysis for Personalized Medicine: Predicting Malnutrition-Related Health Outcomes and Secondary Neuropsychiatric Health Concerns. Pac. Symp. Biocomput. 2025, 30, 599. [Google Scholar]
- Janssen, S.M.; Bouzembrak, Y.; Tekinerdogan, B. Artificial Intelligence in Malnutrition: A Systematic Literature Review. Adv. Nutr. 2024, 15, 100264. [Google Scholar] [CrossRef]
- Soundarya, M.; Basavaprabhu, A.; Raghuveera, K.; Baliga, B.; Shivanagaraja, B. Comparative Assessment of Fetal Malnutrition by Anthropometry and CAN Score—PubMed. Iran. J. Pediatr. 2012, 22, 70–76. [Google Scholar]
Disclaimer/Publisher’s Note: The statements, opinions and data contained in all publications are solely those of the individual author(s) and contributor(s) and not of MDPI and/or the editor(s). MDPI and/or the editor(s) disclaim responsibility for any injury to people or property resulting from any ideas, methods, instructions or products referred to in the content. |
© 2025 by the authors. Licensee MDPI, Basel, Switzerland. This article is an open access article distributed under the terms and conditions of the Creative Commons Attribution (CC BY) license (https://creativecommons.org/licenses/by/4.0/).