
Association Between Dietary Patterns and Cognitive Function in Midlife Adults: The Bogalusa Heart Study

 , , , ,
Abstract
1. Introduction
2. Methods
2.1. Participant Methods and Criteria
2.2. Dietary Quality Scores
2.3. Cognitive Outcomes
2.4. Covariates
2.5. Procedures
2.6. Statistical Analysis
3. Results
3.1. Participant Characteristics
3.2. Association Between Diet Quality and Global Cognitive Score
3.3. Comparing Low, Average, and Optimal Neuropsychological Profiles According to Diet Quality
3.4. Comparing Low and Other Neuropsychological Profiles According to Diet Quality
3.5. Interaction Testing
3.6. Joint Analysis
4. Discussion
5. Conclusions
Supplementary Materials
Author Contributions
Funding
Institutional Review Board Statement
Informed Consent Statement
Data Availability Statement
Conflicts of Interest
Abbreviations
| AHEI | Alternate Healthy Eating Index 2010 |
| aMed | Alternate Mediterranean Diet |
| BHS | Bogalusa Heart Study |
| Delta NIRI | Lower Mississippi Nutrition Intervention Research Initiative |
| GCS | global cognitive score |
| GED | general educational development |
| GI | gastrointestinal |
| HEI | Healthy Eating Index 2015 |
| HS | high school |
| IPAQ | International Physical Activity Questionnaire |
| MET | metabolic equivalent of task |
| MIND | Mediterranean-DASH Intervention for Neurodegenerative Delay |
| SES | socioeconomic status |
| WAIS-IV | Wechsler Adult Intelligence Scale 4th edition |
| WRAT | Wide Range Achievement Test 4th edition |
References
- FastStats. 2024. Available online: https://www.cdc.gov/nchs/fastats/leading-causes-of-death.htm (accessed on 20 October 2024).
- Alzheimer’s Disease and Dementia. Alzheimer’s Disease Facts and Figures. Available online: https://www.alz.org/alzheimers-dementia/facts-figures (accessed on 20 October 2024).
- Peters, R. Ageing and the brain. Postgrad. Med. J. 2006, 82, 84–88. [Google Scholar] [CrossRef] [PubMed]
- Nooyens, A.C.J.; Yildiz, B.; Hendriks, L.G.; Bas, S.; van Boxtel, M.P.J.; Picavet, H.S.J.; Boer, J.M.; Verschuren, W.M.M. Adherence to dietary guidelines and cognitive decline from middle age: The Doetinchem Cohort Study. Am. J. Clin. Nutr. 2021, 114, 871–881. [Google Scholar] [CrossRef]
- Wu, J.; Song, X.; Chen, G.-C.; Neelakantan, N.; van Dam, R.M.; Feng, L.; Yuan, J.-M.; Pan, A.; Koh, W.-P. Dietary pattern in midlife and cognitive impairment in late life: A prospective study in Chinese adults. Am. J. Clin. Nutr. 2019, 110, 912–920. [Google Scholar] [CrossRef]
- Fortune, N.C.; Harville, E.W.; Guralnik, J.M.; Gustat, J.; Chen, W.; Qi, L.; Bazzano, L.A. Dietary intake and cognitive function: Evidence from the Bogalusa Heart Study. Am. J. Clin. Nutr. 2019, 109, 1656–1663. [Google Scholar] [CrossRef]
- McEvoy, C.T.; Hoang, T.; Sidney, S.; Steffen, L.M.; Jacobs, D.R., Jr.; Shikany, J.M.; Wilkins, J.T.; Yaffe, K. Dietary patterns during adulthood and cognitive performance in midlife. Neurology 2019, 92, e1589–e1599. [Google Scholar] [CrossRef]
- Dearborn-Tomazos, J.L.; Wu, A.; Steffen, L.M.; Anderson, C.A.M.; Hu, E.A.; Knopman, D.; Mosley, T.H.; Gottesman, R.F. Association of Dietary Patterns in Midlife and Cognitive Function in Later Life in US Adults Without Dementia. JAMA Netw. Open 2019, 2, e1916641. [Google Scholar] [CrossRef]
- Takeuchi, H.; Kawashima, R. Diet and Dementia: A Prospective Study. Nutrients 2021, 13, 4500. [Google Scholar] [CrossRef] [PubMed]
- Yuan, C.; Cao, Y.; Ascherio, A.; Okereke, O.I.; Zong, G.; Grodstein, F.; Hofman, A.; Willett, W.C. Long-term diet quality and its change in relation to late-life subjective cognitive decline. Am. J. Clin. Nutr. 2021, 115, 232–243. [Google Scholar] [CrossRef]
- Akbaraly, T.N.; Singh-Manoux, A.; Dugravot, A.; Brunner, E.J.; Kivimäki, M.; Sabia, S. Association of Midlife Diet with Subsequent Risk for Dementia. JAMA 2019, 321, 957–968. [Google Scholar] [CrossRef] [PubMed]
- Glans, I.; Sonestedt, E.; Nägga, K.; Gustavsson, A.-M.; González-Padilla, E.; Borne, Y.; Stomrud, E.; Melander, O.; Nilsson, P.M.; Palmqvist, S.; et al. Association Between Dietary Habits in Midlife with Dementia Incidence Over a 20-Year Period. Neurology 2023, 100, e28. [Google Scholar]
- Barnes, L.L.; Dhana, K.; Liu, X.; Carey, V.J.; Ventrelle, J.; Johnson, K.; Hollings, C.S.; Bishop, L.; Laranjo, N.; Stubbs, B.J.; et al. Trial of the MIND Diet for Prevention of Cognitive Decline in Older Persons. N. Engl. J. Med. 2023, 389, 602–611. [Google Scholar] [CrossRef] [PubMed]
- Puri, S.; Shaheen, M.; Grover, B. Nutrition and cognitive health: A life course approach. Front. Public Health 2023, 11, 1023907. [Google Scholar] [CrossRef]
- Wooten, K.G. Racial and Ethnic Differences in Subjective Cognitive Decline—United States, 2015–2020. Morb. Mortal. Wkly. Rep. 2023, 72, 249–255. Available online: https://www.cdc.gov/mmwr/volumes/72/wr/mm7210a1.htm (accessed on 26 November 2024). [CrossRef]
- Bazzano, L.A. The Bogalusa Heart Study. clinicaltrials.gov; 2023 June. Report No.: NCT00005129. Available online: https://clinicaltrials.gov/study/NCT00005129 (accessed on 31 December 2023).
- Carithers, T.C.; Talegawkar, S.A.; Rowser, M.L.; Henry, O.R.; Dubbert, P.M.; Bogle, M.L.; Taylor, H.A.; Tucker, K.L. Validity and Calibration of Food Frequency Questionnaires used with African American Adults in the Jackson Heart Study. J. Am. Diet. Assoc. 2009, 109, 1184–1193. [Google Scholar] [CrossRef]
- Potts, K.S.; Wallace, M.E.; Gustat, J.; Ley, S.H.; Qi, L.; Bazzano, L.A. Diet Quality and Sleep Characteristics in Midlife: The Bogalusa Heart Study. Nutrients 2023, 15, 2078. [Google Scholar] [CrossRef] [PubMed]
- Purpose of the Dietary Guidelines: Dietary Guidelines for Americans. Available online: https://www.dietaryguidelines.gov/about-dietary-guidelines/purpose-dietary-guidelines (accessed on 8 January 2024).
- Guenther, P.M.; Kirkpatrick, S.I.; Reedy, J.; Krebs-Smith, S.M.; Buckman, D.W.; Dodd, K.W.; Casavale, K.O.; Carroll, R.J. The Healthy Eating Index-2010 Is a Valid and Reliable Measure of Diet Quality According to the 2010 Dietary Guidelines for Americans123. J. Nutr. 2014, 144, 399–407. [Google Scholar] [CrossRef]
- Healthy Eating Index (HEI): Food and Nutrition Service. Available online: https://www.fns.usda.gov/cnpp/healthy-eating-index-hei (accessed on 8 January 2024).
- Al-Ibrahim, A.A.; Jackson, R.T. Healthy eating index versus alternate healthy index in relation to diabetes status and health markers in U.S. adults: NHANES 2007–2010. Nutr. J. 2019, 18, 26. [Google Scholar] [CrossRef]
- Jacobs, S.; Harmon, B.E.; Ollberding, N.J.; Wilkens, L.R.; Monroe, K.R.; Kolonel, L.N.; Le Marchand, L.; Boushey, C.J.; Maskarinec, G. Among 4 Diet Quality Indexes, Only the Alternate Mediterranean Diet Score Is Associated with Better Colorectal Cancer Survival and Only in African American Women in the Multiethnic Cohort123. J. Nutr. 2016, 146, 1746–1755. [Google Scholar] [CrossRef]
- Shvetsov, Y.B.; Harmon, B.E.; Ettienne, R.; Wilkens, L.R.; Le Marchand, L.; Kolonel, L.N.; Boushey, C.J. The influence of energy standardization on the Alternate Mediterranean diet score and its association with mortality in the Multiethnic Cohort. Br. J. Nutr. 2016, 116, 1592–1601. [Google Scholar] [CrossRef]
- De Anda-Duran, I.; Alonso, C.F.; Libon, D.J.; Carmichael, O.T.; Kolachalama, V.B.; Suglia, S.F.; Au, R.; Bazzano, L.A. Carotid Intima-Media Thickness and Midlife Cognitive Function. Neurology 2022, 98, e1828–e1836. [Google Scholar] [CrossRef] [PubMed]
- De Anda-Duran, I.; Kolachalama, V.B.; Carmichael, O.T.; Hwang, P.H.; Fernandez, C.; Au, R.; Bazzano, L.A.; Libon, D.J. Midlife Neuropsychological Profiles and Associated Vascular Risk: The Bogalusa Heart Study. J. Alzheimer’s Dis. 2023, 94, 101–113. [Google Scholar] [CrossRef] [PubMed]
- Craig, C.L.; Marshall, A.L.; Sjöström, M.; Bauman, A.E.; Booth, M.L.; Ainsworth, B.E.; Pratt, M.; Ekelund, U.L.; Yngve, A.; Sallis, J.F.; et al. International physical activity questionnaire: 12-country reliability and validity. Med. Sci. Sports Exerc. 2003, 35, 1381–1395. [Google Scholar] [CrossRef]
- Weir, C.B.; Jan, A. BMI Classification Percentile And Cut Off Points. In StatPearls; StatPearls Publishing: Treasure Island, FL, USA, 2024. Available online: http://www.ncbi.nlm.nih.gov/books/NBK541070/ (accessed on 20 April 2024).
- Indicator Metadata Registry Details. Available online: https://www.who.int/data/gho/indicator-metadata-registry/imr-details/2380 (accessed on 16 September 2024).
- Kandil, H.; Soliman, A.; Alghamdi, N.S.; Jennings, J.R.; El-Baz, A. Using Mean Arterial Pressure in Hypertension Diagnosis versus Using Either Systolic or Diastolic Blood Pressure Measurements. Biomedicines 2023, 11, 849. [Google Scholar] [CrossRef] [PubMed]
- Samieri, C.; Sun, Q.; Townsend, M.K.; Chiuve, S.E.; Okereke, O.I.; Willett, W.C.; Stampfer, M.; Grodstein, F. The relation of midlife diet to healthy aging: A cohort study. Ann Intern Med. 2013, 159, 584–591. [Google Scholar] [CrossRef] [PubMed]
- Mediterranean Diet, Healthy Eating Index 2005, and Cognitive Function in Middle-Aged and Older Puerto Rican Adults—ClinicalKey. Available online: https://www.clinicalkey.com/#!/content/playContent/1-s2.0-S221226721201800X (accessed on 29 August 2024).
- Zong, G.; Harris, W.S.; Rosner, B.; Albert, C.M.; Moorthy, M.V.; Willett, W.C.; Manson, J.E.; Hu, F.B.; Sesso, H.D. Effects of Omega-3 Fatty Acid Supplementation on Cognitive Decline: A Randomized Clinical Trial. Alzheimer’s Dement. 2022, 18, 1128–1138. [Google Scholar] [CrossRef]
- Satizabal, C.L.; Himali, J.J.; Beiser, A.S.; Ramachandran, V.; van Lent, D.M.; Himali, D.; Aparicio, H.J.; Maillard, P.; DeCarli, C.S.; Harris, W.S.; et al. Association of Red Blood Cell Omega-3 Fatty Acids with MRI markers and Cognitive Function in Midlife—The Framingham Heart Study. Neurology 2022, 99, e2572–e2582. [Google Scholar] [CrossRef]
- Liu, X.; Beck, T.; Dhana, K.; Desai, P.; Krueger, K.R.; Tangney, C.C.; Holland, T.M.; Agarwal, P.; Evans, D.A.; Rajan, K.B. Association of Whole Grain Consumption and Cognitive Decline: An Investigation from a Community-Based Biracial Cohort of Older Adults. Neurology 2023, 101, e2277–e2287. [Google Scholar] [CrossRef]
- Wen, L.; Duffy, A. Factors Influencing the Gut Microbiota, Inflammation, and Type 2 Diabetes. J. Nutr. 2017, 147, 1468S–1475S. [Google Scholar] [CrossRef]
- Melzer, T.M.; Manosso, L.M.; Yau, S.Y.; Gil-Mohapel, J.; Brocardo, P.S. In Pursuit of Healthy Aging: Effects of Nutrition on Brain Function. Int. J. Mol. Sci. 2021, 22, 5026. [Google Scholar] [CrossRef]
- Muth, A.K.; Park, S.Q. The impact of dietary macronutrient intake on cognitive function and the brain. Clin. Nutr. 2021, 40, 3999–4010. [Google Scholar] [CrossRef]
- Simpson, F.M.; Wade, A.; Stanford, T.; Mellow, M.L.; Collins, C.E.; Murphy, K.J.; Keage, H.A.; Hunter, M.; Ware, N.; Barker, D.; et al. The Relationship Between Dietary Patterns, Cognition, and Cardiometabolic Health in Healthy, Older Adults. Nutrients 2024, 16, 3890. [Google Scholar] [CrossRef] [PubMed]
- Pasqualetti, G.; Thayanandan, T.; Edison, P. Influence of genetic and cardiometabolic risk factors in Alzheimer’s disease. Ageing Res. Rev. 2022, 81, 101723. [Google Scholar] [CrossRef] [PubMed]
- Black, M.M. Micronutrient Deficiencies and Cognitive Functioning. J. Nutr. 2003, 133, 3927S–3931S. [Google Scholar] [CrossRef] [PubMed]


| Characteristic | Q1 | Q2 | Q3 | Q4 | p-Value 1 |
|---|---|---|---|---|---|
| Alternate Healthy Eating Index 2010 | |||||
| n = 263 | n = 263 | n = 264 | n = 263 | ||
| Median Score (95% CI) | 33.82 (25.49–37.49) | 41.39 (38.36–44.04) | 48.59 (44.61–51.51) | 56.65 (52.27–69.55) | |
| Age (years)2 | 47.25 ± 5.26 | 47.62 ± 5.29 | 48.60 ± 5.18 | 49.24 ± 4.94 | <0.0001 |
| Sex3 | 0.4181 | ||||
| Male | 107 (40.68) | 107 (40.68) | 105 (39.77) | 91 (34.60) | |
| Female | 156 (59.32) | 156 (59.32) | 159 (60.23) | 172 (65.40) | |
| Race3 | 0.0174 | ||||
| White | 200 (76.05) | 182 (69.47) | 170 (64.64) | 171 (65.27) | |
| Black | 63 (23.95) | 80 (30.53) | 93 (35.36) | 91 (34.73) | |
| Highest Education3 | 0.0008 | ||||
| ≤High School/GED 4 | 199 (75.95) | 178 (67.94) | 191 (72.35) | 159 (60.46) | |
| >High School/GED | 63 (24.05) | 84 (32.06) | 73 (27.65) | 104 (39.54) | |
| Employed3 | 171 (65.52) | 166 (63.36) | 173 (65.53) | 185 (70.61) | 0.3433 |
| MET-minutes/week 2,5 | 3787.44 ± 6310.50 | 3418.79 ± 5719.28 | 3346.42 ± 5702.61 | 2881.33 ± 5359.35 | 0.9194 |
| Total Energy Intake (kcal/d)2 | 2846.58 ± 531.35 | 2809.04 ± 539.79 | 2818.50 ± 566.17 | 2697.13 ± 479.54 | 0.1515 |
| BMI (kg/m2)2,6 | 30.93 ± 7.24 | 31.75 ± 7.90 | 31.98 ± 7.65 | 30.95 ± 7.77 | 0.2618 |
| Diabetes3 | 42 (15.97) | 40 (15.21) | 50 (18.94) | 41 (15.59) | 0.6431 |
| Hypertension3 | 129 (49.05) | 127 (48.29) | 108 (40.91) | 117 (44.49) | 0.2125 |
| Smoking Status3 | <0.0001 | ||||
| Active Smoker | 67 (25.48) | 53 (20.15) | 35 (13.26) | 22 (8.37) | |
| Not Active Smoker | 196 (74.52) | 210 (79.85) | 229 (86.74) | 241 (91.63) | |
| Healthy Eating Index 2015 | |||||
| n = 263 | n = 263 | n = 264 | n = 263 | ||
| Median Score (95% CI) | 48.57 (40.09–52.66) | 56.17 (53.38–58.77) | 62.22 (59.25–64.98) | 70.11 (65.95–80.09) | |
| Age (years)2 | 47.26 ± 5.36 | 47.45 ± 5.26 | 48.85 ± 5.22 | 49.15 ± 4.80 | <0.0001 |
| Sex3 | 0.0010 | ||||
| Male | 126 (47.91) | 100 (38.02) | 103 (39.02) | 81 (30.80) | |
| Female | 137 (52.09) | 163 (61.98) | 161 (60.98) | 182 (69.20) | |
| Race3 | 0.0940 | ||||
| White | 191 (72.62) | 190 (72.24) | 170 (64.64) | 172 (65.90) | |
| Black | 72 (27.38) | 73 (27.76) | 93 (35.36) | 89 (34.10) | |
| Highest Education3 | 0.0007 | ||||
| ≤High School/GED 4 | 202 (76.81) | 186 (70.72) | 182 (68.94) | 159 (60.46) | |
| >High School/GED | 61 (23.37) | 77 (29.28) | 82 (31.06) | 104 (39.54) | |
| Employed3 | 169 (64.26) | 173 (66.28) | 174 (66.16) | 179 (68.32) | 0.8085 |
| MET-minutes/week 2,5 | 3653.19 ± 6265.86 | 2885.96 ± 5339.81 | 2298.98 ± 5589.17 | 3495.64 ± 5903.53 | 0.3043 |
| Total Energy Intake (kcal/d)2 | 2851.60 ± 531.35 | 2856.43 ± 561.13 | 2751.06 ± 519.01 | 2722.00 ± 505.84 | 0.0974 |
| BMI (kg/m2)2,6 | 30.95 ± 7.59 | 31.77 ± 7.82 | 31.95 ± 7.67 | 30.94 ± 7.47 | 0.2733 |
| Diabetes3 | 42 (15.97) | 40 (15.21) | 55 (16.67) | 47 (17.87) | 0.8651 |
| Hypertension3 | 130 (49.43) | 114 (43.35) | 129 (48.86) | 108 (41.06) | 0.1445 |
| Smoking Status3 | <0.0001 | ||||
| Active Smoker | 67 (25.48) | 51 (19.39) | 38 (14.39) | 21 (7.98) | |
| Not Active Smoker | 196 (74.52) | 212 (80.61) | 226 (85.61) | 242 (92.02) | |
| Alternate Mediterranean Diet | |||||
| n = 264 | n = 202 | n = 375 | n = 212 | ||
| Median Score (95% CI) | 2.00 (1.00–2.00) | 3.00 (3.00–3.00) | 4.00 (4.00–5.00) | 6.00 (6.00–8.00) | |
| Age (years)2 | 47.48 ± 5.25 | 48.08 ± 5.27 | 48.21 ± 5.22 | 49.09 ± 5.04 | 0.0101 |
| Sex3 | 0.3184 | ||||
| Male | 114 (43.18) | 77 (38.12) | 145 (38.67) | 74 (34.91) | |
| Female | 150 (56.82) | 125 (61.88) | 230 (61.33) | 138 (65.09) | |
| Race3 | 0.0064 | ||||
| White | 201 (76.14) | 142 (70.30) | 249 (66.94) | 131 (61.79) | |
| Black | 63 (23.86) | 60 (29.70) | 123 (33.06) | 81 (38.21) | |
| Highest Education3 | 0.0831 | ||||
| ≤High School/GED 4 | 195 (74.43) | 143 (70.79) | 252 (67.20) | 137 (64.62) | |
| >High School/GED | 67 (25.57) | 59 (29.21) | 123 (32.80) | 75 (35.38) | |
| Employed3 | 162 (61.83) | 133 (66.17) | 262 (70.05) | 138 (65.09) | 0.1843 |
| MET-minutes/week 2,5 | 3147.74 ± 5855.73 | 3738.57 ± 6087.07 | 3340.59 ± 5853.87 | 3290.42 ± 5273.09 | 0.1346 |
| Total Energy Intake (kcal/d)2 | 2703.92 ± 479.01 | 2768.88 ± 541.24 | 2784.71 ± 537.17 | 2909.24 ± 542.61 | 0.0293 |
| BMI (kg/m2)2,6 | 30.48 ± 7.13 | 31.90 ± 7.66 | 31.91 ± 8.19 | 31.19 ± 7.18 | 0.0893 |
| Diabetes3 | 37 (14.02) | 35 (17.33) | 64 (17.07) | 37 (17.45) | 0.6795 |
| Hypertension3 | 107 (40.53) | 106 (52.48) | 175 (46.67) | 93 (43.87) | 0.0716 |
| Smoking Status3 | 0.0006 | ||||
| Active Smoker | 66 (25.00) | 31 (15.35) | 60 (16.00) | 20 (9.43) | |
| Not Active Smoker | 198 (75.00) | 171 (84.65) | 315 (84.00) | 192 (90.57) | |
| Cognitive Outcome | Q1 1 | Q2 1 | Q3 1 | Q4 1 | Ptrend2 |
|---|---|---|---|---|---|
| Alternate Healthy Eating Index 2010 | |||||
| n = 263 | n = 263 | n = 264 | n = 263 | ||
| Global Cognitive Score | |||||
| Model 1 | 0.214 (−0.358, 0.786) | 0.865 (0.293, 1.437) *** | −0.132 (−0.703, 0.439) | 1.491 (0.919, 2.063) *** | 0.0258 |
| Model 2 | −0.943 (−1.496, −0.389) *** | −0.024 (−0.567, 0.519) | −0.809 (−1.346, −0.273) *** | 0.800 (0.256, 1.343) *** | 0.0002 |
| Model 3 | −0.270 (−1.107, 0.566) | 0.715 (−0.156, 1.587) | −0.116 (−1.077, 0.845) | 1.589 (0.580, 2.598) *** | 0.0182 |
| Model 4 | −0.174 (−1.081, 0.733) | 0.830 (−0.128, 1.788) | −0.016 (−1.051, 1.020) | 1.758 (0.069, 2.847) *** | 0.0144 |
| Attention and Processing | |||||
| Model 1 | 0.054 (−0.128, 0.236) | 0.172 (−0.010, 0.354) | −0.113 (−0.295, 0.068) | 0.275 (0.093, 0.457) *** | 0.3363 |
| Model 2 | −0.022 (−0.213, 0.168) | 0.108 (−0.079, 0.295) | −0.156 (−0.341, 0.028) | 0.243 (0.056, 0.430) * | 0.1838 |
| Model 3 | −0.0003 (−0.284, 0.284) | 0.316 (0.020, 0.612) * | 0.008 (−0.318, 0.334) | 0.390 (0.048, 0.733) * | 0.1943 |
| Model 4 | −0.050 (−0.357, 0.257) | 0.255 (−0.070, 0.579) | −0.022 (−0.373, 0.329) | 0.339 (−0.030, 0.708) | 0.1785 |
| Episodic Memory | |||||
| Model 1 | −0.053 (−0.260, 0.155) | 0.215 (0.008, 0.423) * | 0.073 (−0.134, 0.280) | 0.411 (0.203, 0.618) *** | 0.0078 |
| Model 2 | −0.381 (−0.590, −0.173) *** | −0.032 (−0.236, 0.173) | −0.104 (−0.306, 0.099) | 0.235 (0.030, 0.440) * | 0.0001 |
| Model 3 | −0.245 (−0.600, 0.111) | −0.011 (−0.381, 0.359) | 0.031 (−0.378, 0.439) | 0.316 (−0.113, 0.744) | 0.0349 |
| Model 4 | −0.176 (−0.561, 0.209) | 0.067 (−0.339, 0.474) | 0.118 (−0.321, 0.557) | 0.433 (−0.029, 0.895) | 0.0224 |
| Executive Function | |||||
| Model 1 | −0.044 (−0.234, 0.145) | 0.177 (−0.013, 0.366) | −0.009 (−0.198, 0.180) | 0.369 (0.180, 0.559) *** | 0.0131 |
| Model 2 | −0.277 (−0.469, −0.084) *** | −0.014 (−0.204, 0.175) | −0.147 (−0.334, 0.040) | 0.220 (0.030, 0.409) * | 0.0013 |
| Model 3 | −0.164 (−0.450, 0.123) | 0.254 (−0.045, 0.552) | −0.047 (−0.376, 0.282) | 0.185 (−0.160, 0.531) | 0.2253 |
| Model 4 | −0.149 (−0.458, 0.160) | 0.263 (−0.064, 0.590) | 0.004 (−0.350, 0.357) | 0.210 (−0.162, 0.581) | 0.1802 |
| Healthy Eating Index 2015 | |||||
| n = 263 | n = 263 | n = 264 | n = 263 | ||
| Global Cognitive Score | |||||
| Model 1 | 0.017 (−0.559, 0.592) | 0.669 (0.094, 1.245) * | 0.761 (0.187, 1.336) ** | 0.987 (0.412, 1.563) *** | 0.0215 |
| Model 2 | −0.937 (−1.487, −0.388) *** | −0.344 (−0.896, 0.208) | 0.096 (−0.445, 0.637) | 0.233 (−0.320, 0.786) | 0.0016 |
| Model 3 | −0.143 (−1.008, 0.721) | 0.297 (−0.579, 1.173) | 0.607 (−0.356, 1.569) | 1.195 (0.201, 2.189) * | 0.0256 |
| Model 4 | −0.081 (−1.030, 0.868) | 0.337 (−0.645, 1.320) | 0.654 (−0.376, 1.684) | 1.289 (0.238, 2.340) * | 0.0238 |
| Attention and Processing | |||||
| Model 1 | −0.025 (−0.208, 0.157) | 0.080 (−0.103, 0.262) | 0.181 (−0.001, 0.363) | 0.151 (−0.031, 0.334) | 0.1360 |
| Model 2 | −0.099 (−0.287, 0.090) | 0.014 (−0.175, 0.203) | 0.140 (−0.046, 0.325) | 0.111 (−0.078, 0.301) | 0.0801 |
| Model 3 | 0.022 (−0.269, 0.313) | 0.033 (−0.262, 0.328) | 0.414 (0.090, 0.738) * | 0.303 (−0.032, 0.638) | 0.0721 |
| Model 4 | −0.063 (−0.381, 0.255) | −0.032 (−0.362, 0.298) | 0.353 (0.008, 0.698) * | 0.252 (−0.102, 0.604) | 0.0502 |
| Episodic Memory | |||||
| Model 1 | −0.040 (−0.248, 0.168) | 0.177 (−0.031, 0.385) | 0.249 (0.041, 0.457) * | 0.260 (0.052, 0.468) * | 0.0409 |
| Model 2 | −0.304 (−0.511, −0.098) *** | −0.110 (−0.317, 0.098) | 0.081 (−0.122, 0.285) | 0.069 (−0.140, 0.276) | 0.0056 |
| Model 3 | −0.260 (−0.623, 0.104) | −0.103 (−0.472, 0.266) | 0.227 (−0.178, 0.632) | 0.229 (−0.189, 0.647) | 0.0294 |
| Model 4 | −0.201 (−0.599, 0.198) | −0.042 (−0.455, 0.371) | 0.284 (−0.149, 0.716) | 0.312 (−0.130, 0.754) | 0.0247 |
| Executive Function | |||||
| Model 1 | −0.042 (−0.232, 0.148) | 0.060 (−0.129, 0.250) | 0.121 (−0.068, 0.310) | 0.352 (0.163, 0.542) *** | 0.0038 |
| Model 2 | −0.214 (−0.405, 0.023) * | −0.154 (−0.346, 0.037) | −0.012 (−0.199, 0.176) | 0.173 (−0.019, 0.365) | 0.0025 |
| Model 3 | −0.084 (−0.379, 0.211) | −0.011 (−0.310, 0.288) | 0.197 (−0.132, 0.526) | 0.152 (−0.188, 0.491) | 0.1724 |
| Model 4 | −0.099 (−0.421, 0.223) | 0.016 (−0.318, 0.349) | 0.210 (−0.139, 0.560) | 0.167 (−0.190, 0.523) | 0.1342 |
| Alternate Mediterranean Diet | |||||
| n = 264 | n = 202 | n = 375 | n = 212 | ||
| Global Cognitive Score | |||||
| Model 1 | −0.072 (−0.646, 0.502) | 0.844 (0.188, 1.500) * | 0.832 (0.402, 1.365) *** | 0.746 (0.106, 1.387) * | 0.0842 |
| Model 2 | −1.210 (−1.763, −0.658) *** | −0.083 (−0.701, 0.536) | 0.091 (−0.369, 0.551) | 0.170 (−0.431, 0.770) | 0.0012 |
| Model 3 | −0.360 (−1.414, 0.694) | 0.415 (−0.672, 1.502) | 0.416 (−0.341, 1.174) | 1.087 (0.126, 2.048) * | 0.0436 |
| Model 4 | −0.319 (−1.477, 0.840) | 0.493 (−0.691, 1.677) | 0.430 (−0.408, 1.268) | 1.156 (0.141, 2.171) * | 0.0428 |
| Attention and Processing | |||||
| Model 1 | −0.024 (−0.206, 0.158) | 0.152 (−0.056, 0.361) | 0.124 (−0.029, 0.277) | 0.146 (−0.057, 0.349) | 0.2807 |
| Model 2 | −0.105 (−0.295, 0.085) | 0.093 (−0.119, 0.306) | 0.070 (−0.088, 0.228) | 0.118 (−0.089, 0.324) | 0.1502 |
| Model 3 | −0.137 (−0.492, 0.218) | 0.185 (−0.182, 0.551) | 0.210 (−0.045, 0.466) | 0.351 (0.027, 0.675) * | 0.0545 |
| Model 4 | −0.220 (−0.609, 0.168) | 0.062 (−0.335, 0.460) | 0.156 (−0.126, 0.437) | 0.276 (−0.065, 0.617) | 0.0432 |
| Episodic Memory | |||||
| Model 1 | −0.059 (−0.266, 0.149) | 0.112 (−0.125, 0.349) | 0.286 (0.112, 0.460) *** | 0.262 (0.031, 0.494) * | 0.0290 |
| Model 2 | −0.372 (−0.580, −0.164) *** | −0.141 (−0.374, 0.092) | 0.073 (−0.100, 0.246) | 0.116 (−0.109, 0.342) | 0.0008 |
| Model 3 | −0.422 (−0.864, 0.021) | −0.088 (−0.545, 0.369) | 0.047 (−0.272, 0.365) | 0.301 (−0.103, 0.704) | 0.0135 |
| Model 4 | −0.361 (−0.845, 0.125) | −0.033 (−0.530, 0.464) | 0.084 (−0.268, 0.436) | 0.358 (−0.068, 0.784) | 0.0145 |
| Executive Function | |||||
| Model 1 | −0.029 (−0.219, 0.161) | 0.111 (−0.106, 0.328) | 0.208 (0.049, 0.367) * | 0.173 (−0.038, 0.385) | 0.1415 |
| Model 2 | −0.241 (−0.434, −0.049) * | −0.078 (−0.294, 0.138) | 0.033 (−0.127, 0.193) | 0.043 (−0.166, 0.252) | 0.0380 |
| Model 3 | −0.174 (−0.533, 0.186) | 0.021 (−0.350, 0.392) | 0.064 (−0.194, 0.323) | 0.223 (−0.105, 0.551) | 0.0981 |
| Model 4 | −0.161 (−0.553, 0.232) | −0.030 (−0.432, 0.372) | 0.084 (−0.201, 0.368) | 0.206 (−0.139, 0.550) | 0.1086 |
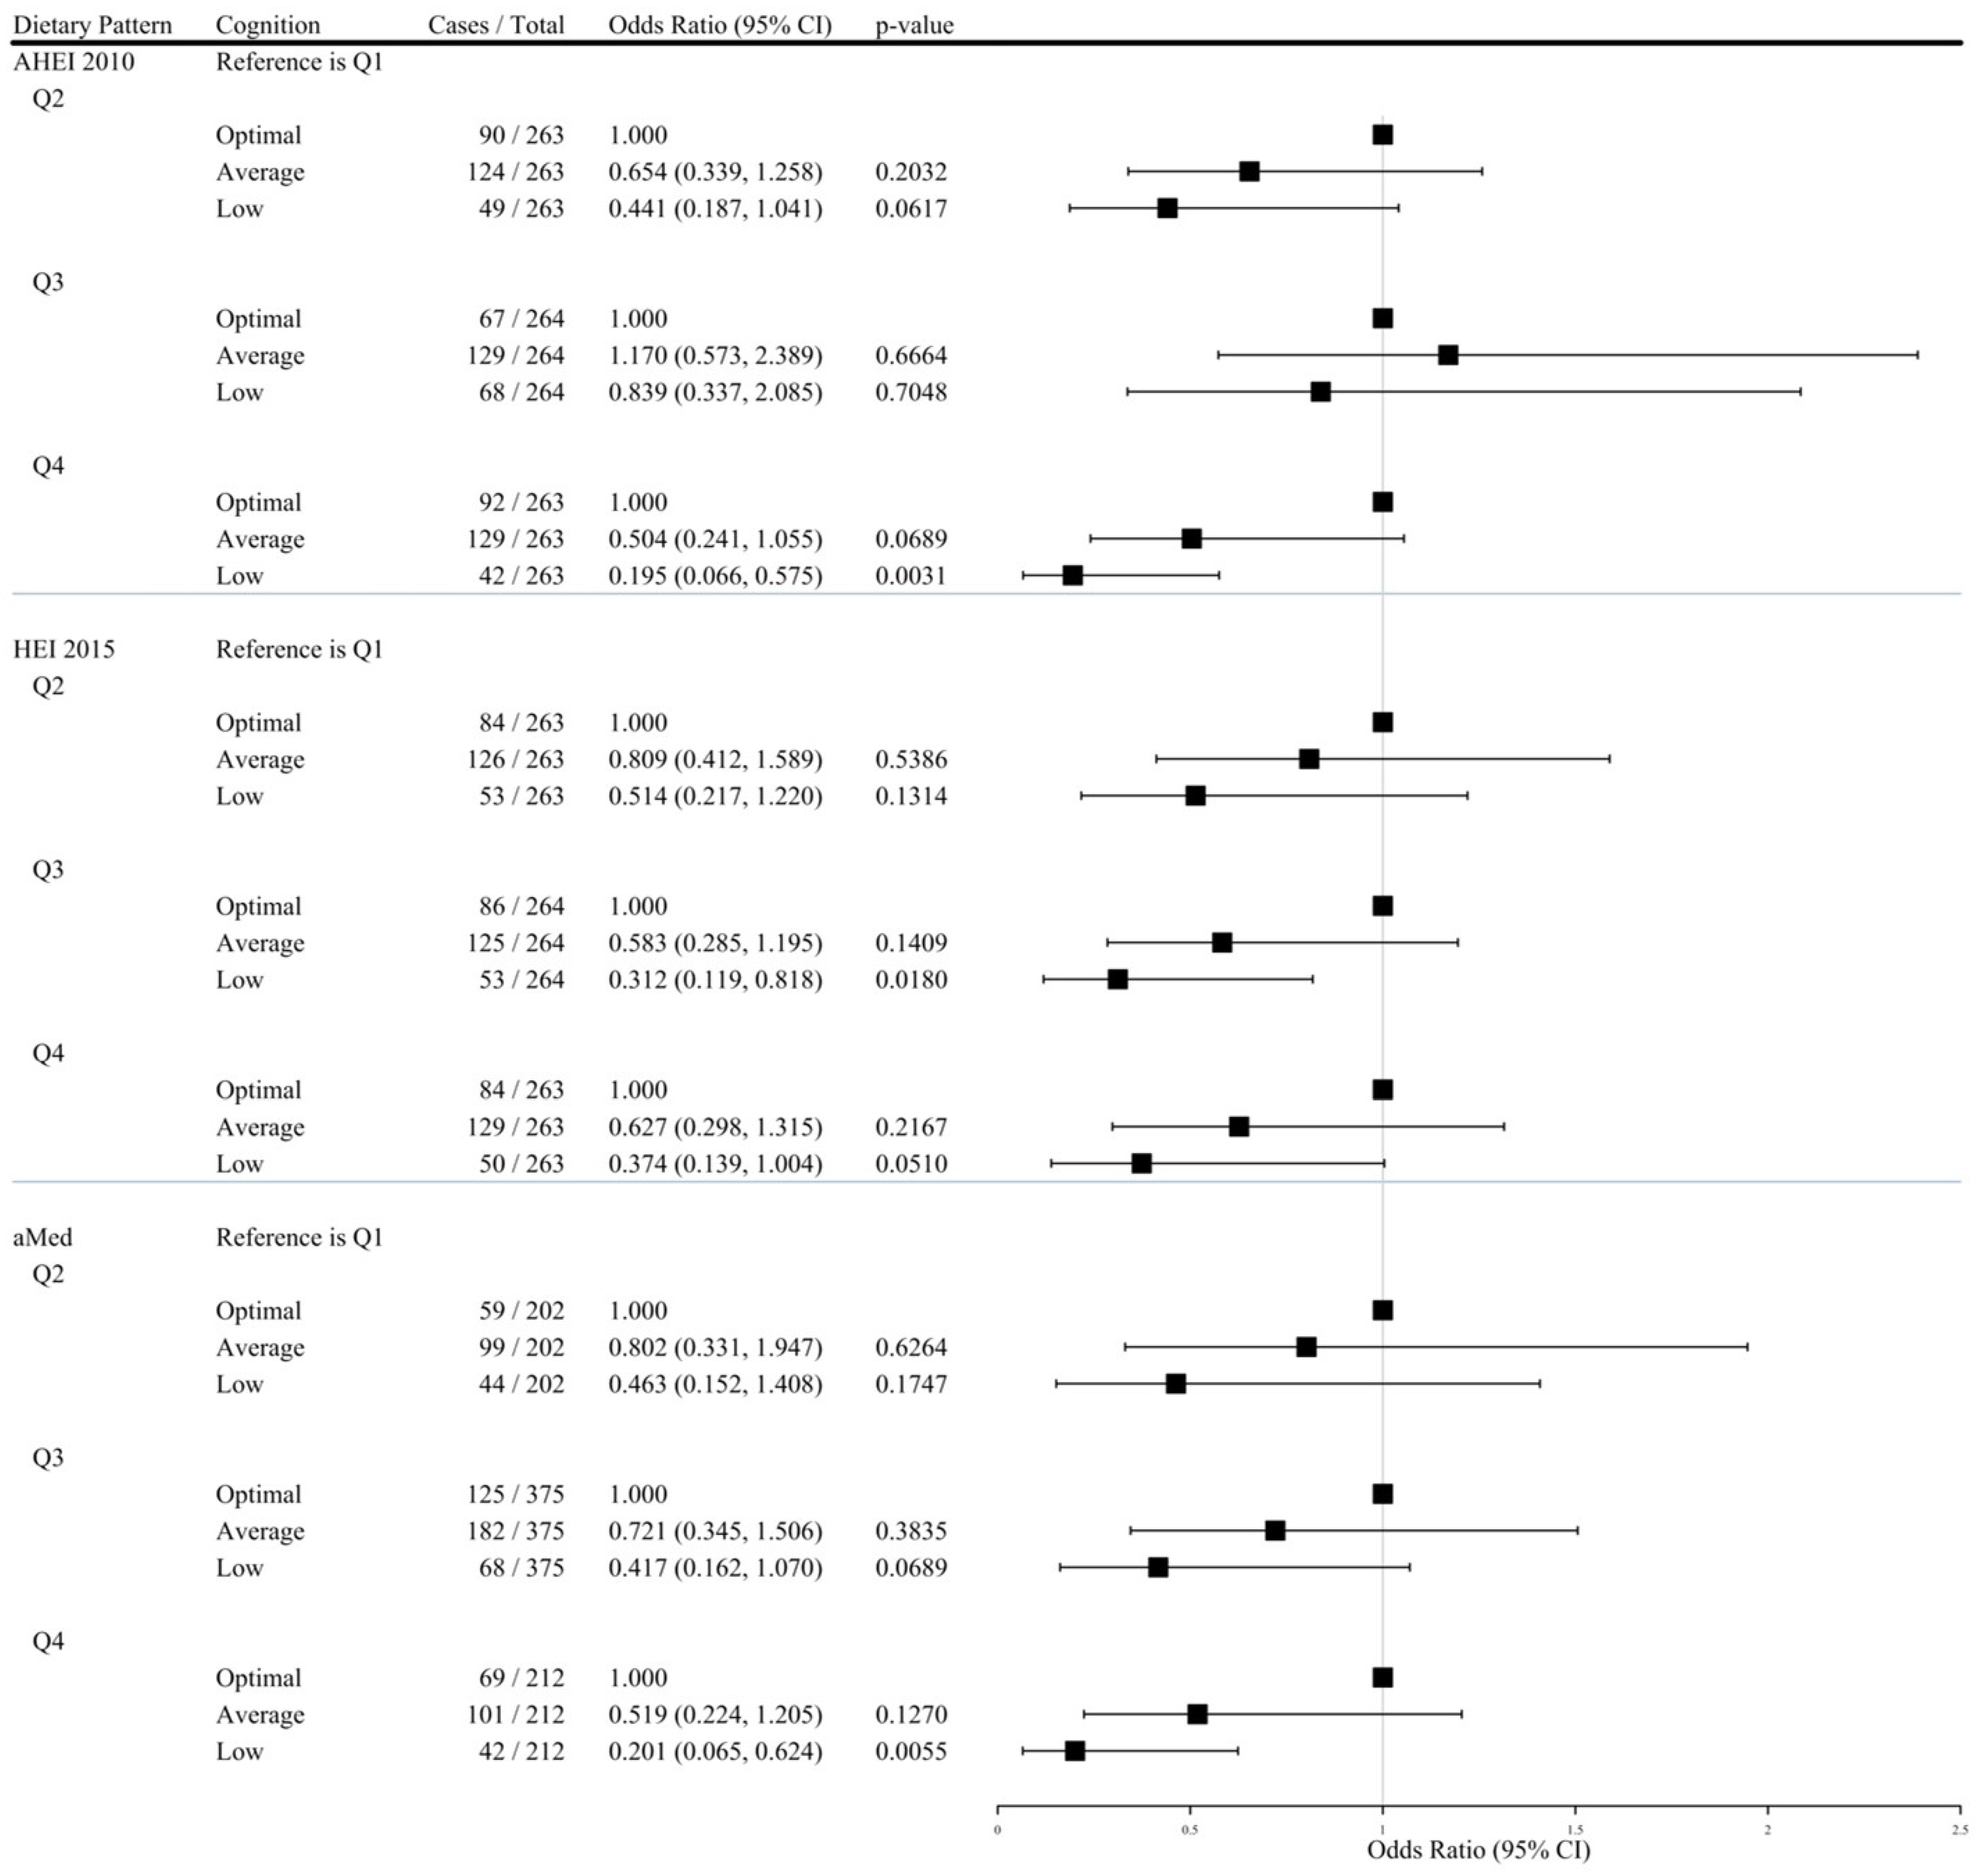
| Q1 1 | Q2 2 | Q3 2 | Q4 2 | PTrend 3 | Per SD Increase 4 | |
|---|---|---|---|---|---|---|
| Alternate Healthy Eating Index 2010 | ||||||
| Optimal Cognition1 | ||||||
| # Cases/Total | 72/263 | 90/263 | 67/264 | 92/263 | SD = 9.966 | |
| 1.000 | 1.000 | 1.000 | 1.000 | – | – | |
| Average Cognition vs. Optimal Cognition | ||||||
| # Cases/Total | 131/263 | 124/263 | 129/264 | 129/263 | SD = 9.966 | |
| Model 1 | 1.000 | 0.757 (0.510, 1.125) | 1.058 (0.701, 1.598) | 0.771 (0.520, 1.141) | 0.4415 | 0.850 (0.715, 1.012) |
| Model 2 | 1.000 | 0.701 (0.467, 1.052) | 0.926 (0.607, 1.415) | 0.637 (0.424, 0.958) * | 0.0916 | 0.901 (0.779, 1.042) |
| Model 3 | 1.000 | 0.668 (0.349, 1.278) | 1.225 (0.602, 2.490) | 0.537 (0.260, 1.109) | 0.2933 | 0.926 (0.724, 1.185) |
| Model 4 | 1.000 | 0.654 (0.339, 1.258) | 1.170 (0.573, 2.389) | 0.504 (0.241, 1.055) | 0.2247 | 0.910 (0.708, 1.170) |
| Low Cognition vs. Optimal Cognition | ||||||
| # Cases/Total | 60/263 | 49/263 | 68/264 | 42/263 | SD = 9.966 | |
| Model 1 | 1.000 | 0.653 (0.401, 1.065) | 1.218 (0.753, 1.970) | 0.548 (0.332, 0.904) * | 0.1419 | 0.969 (0.843, 1.114) |
| Model 2 | 1.000 | 0.535 (0.318, 0.900) * | 0.940 (0.563, 1.568) | 0.382 (0.222, 0.657) *** | 0.0072 | 0.739 (0.611, 0.894) ††† |
| Model 3 | 1.000 | 0.452 (0.193, 1.057) | 0.893 (0.361, 2.206) | 0.216 (0.074, 0.631) *** | 0.0247 | 0.691 (0.490, 0.974) † |
| Model 4 | 1.000 | 0.441 (0.187, 1.041) | 0.839 (0.337, 2.085) | 0.195 (0.066, 0.575) *** | 0.0152 | 0.667 (0.471, 0.945) † |
| Healthy Eating Index 2015 | ||||||
| Optimal Cognition1 | ||||||
| # Cases/Total | 67/263 | 84/263 | 86/264 | 84/263 | SD = 9.192 | |
| 1.000 | 1.000 | 1.000 | 1.000 | – | – | |
| Average Cognition vs. Optimal Cognition | ||||||
| # Cases/Total | 133/263 | 126/263 | 125/264 | 129/263 | SD = 9.192 | |
| Model 1 | 1.000 | 0.756 (0.505, 1.131) | 0.732 (0.490, 1.095) | 0.774 (0.517, 1.157) | 0.2317 | 0.928 (0.807, 1.067) |
| Model 2 | 1.000 | 0.756 (0.500, 1.142) | 0.647 (0.426, 0.982) * | 0.703 (0.461, 1.069) | 0.0825 | 0.875 (0.756, 1.013) |
| Model 3 | 1.000 | 0.838 (0.429, 1.634) | 0.595 (0.291, 1.215) | 0.648 (0.311, 1.349) | 0.1780 | 0.763 (0.586, 0.994) † |
| Model 4 | 1.000 | 0.809 (0.412, 1.589) | 0.583 (0.285, 1.195) | 0.627 (0.298, 1.315) | 0.1583 | 0.752 (0.575, 0.984) † |
| Low Cognition vs. Optimal Cognition | ||||||
| # Cases/Total | 63/263 | 53/263 | 53/264 | 50/263 | SD = 9.192 | |
| Model 1 | 1.000 | 0.671 (0.413, 1.091) | 0.655 (0.403, 1.065) | 0.633 (0.388, 1.034) | 0.0783 | 0.887 (0.746, 1.053) |
| Model 2 | 1.000 | 0.672 (0.402, 1.123) | 0.521 (0.309, 0.877) * | 0.541 (0.318, 0.920) * | 0.0159 | 0.797 (0.660, 0.962) † |
| Model 3 | 1.000 | 0.537 (0.229, 1.263) | 0.322 (0.123, 0.840) * | 0.408 (0.154, 1.081) | 0.0336 | 0.649 (0.457, 0.921) † |
| Model 4 | 1.000 | 0.514 (0.217, 1.220) | 0.312 (0.119, 0.818) * | 0.374 (0.139, 1.004) | 0.0241 | 0.627 (0.440, 0.895) † |
| Alternate Mediterranean Diet | ||||||
| Optimal Cognition1 | ||||||
| # Cases/Total | 68/264 | 59/202 | 125/375 | 69/212 | SD = 1.778 | |
| 1.000 | 1.000 | 1.000 | 1.000 | – | – | |
| Average Cognition vs. Optimal Cognition | ||||||
| # Cases/Total | 131/264 | 99/202 | 182/375 | 101/212 | SD = 1.778 | |
| Model 1 | 1.000 | 0.871 (0.563, 1.346) | 0.756 (0.522, 1.095) | 0.760 (0.497, 1.161) | 0.1811 | 0.931 (0.810, 1.070) |
| Model 2 | 1.000 | 0.796 (0.510, 1.243) | 0.657 (0.448, 0.964) * | 0.609 (0.392, 0.947) * | 0.0213 | 0.864 (0.748, 0.999) † |
| Model 3 | 1.000 | 0.783 (0.324, 1.891) | 0.701 (0.337, 1.458) | 0.506 (0.222, 1.162) | 0.0965 | 0.820 (0.628, 1.070) |
| Model 4 | 1.000 | 0.802 (0.331, 1.947) | 0.721 (0.345, 1.506) | 0.519 (0.224, 1.205) | 0.1116 | 0.823 (0.629, 1.078) |
| Low Cognition vs. Optimal Cognition | ||||||
| # Cases/Total | 65/264 | 44/202 | 68/375 | 42/212 | SD = 1.778 | |
| Model 1 | 1.000 | 0.780 (0.465, 1.309) | 0.569 (0.363, 0.893) * | 0.637 (0.381, 1.063) | 0.0554 | 0.843 (0.709, 1.003) |
| Model 2 | 1.000 | 0.669 (0.386, 1.159) | 0.439 (0.271, 0.711) *** | 0.428 (0.245, 0.746) *** | 0.0014 | 0.734 (0.608, 0.886) ††† |
| Model 3 | 1.000 | 0.436 (0.145, 1.310) | 0.414 (0.163, 1.053) | 0.203 (0.066, 0.621) ** | 0.0079 | 0.587 (0.407, 0.847) ††† |
| Model 4 | 1.000 | 0.463 (0.152, 1.408) | 0.417 (0.162, 1.070) | 0.201 (0.065, 0.624) *** | 0.0073 | 0.580 (0.401, 0.841) ††† |
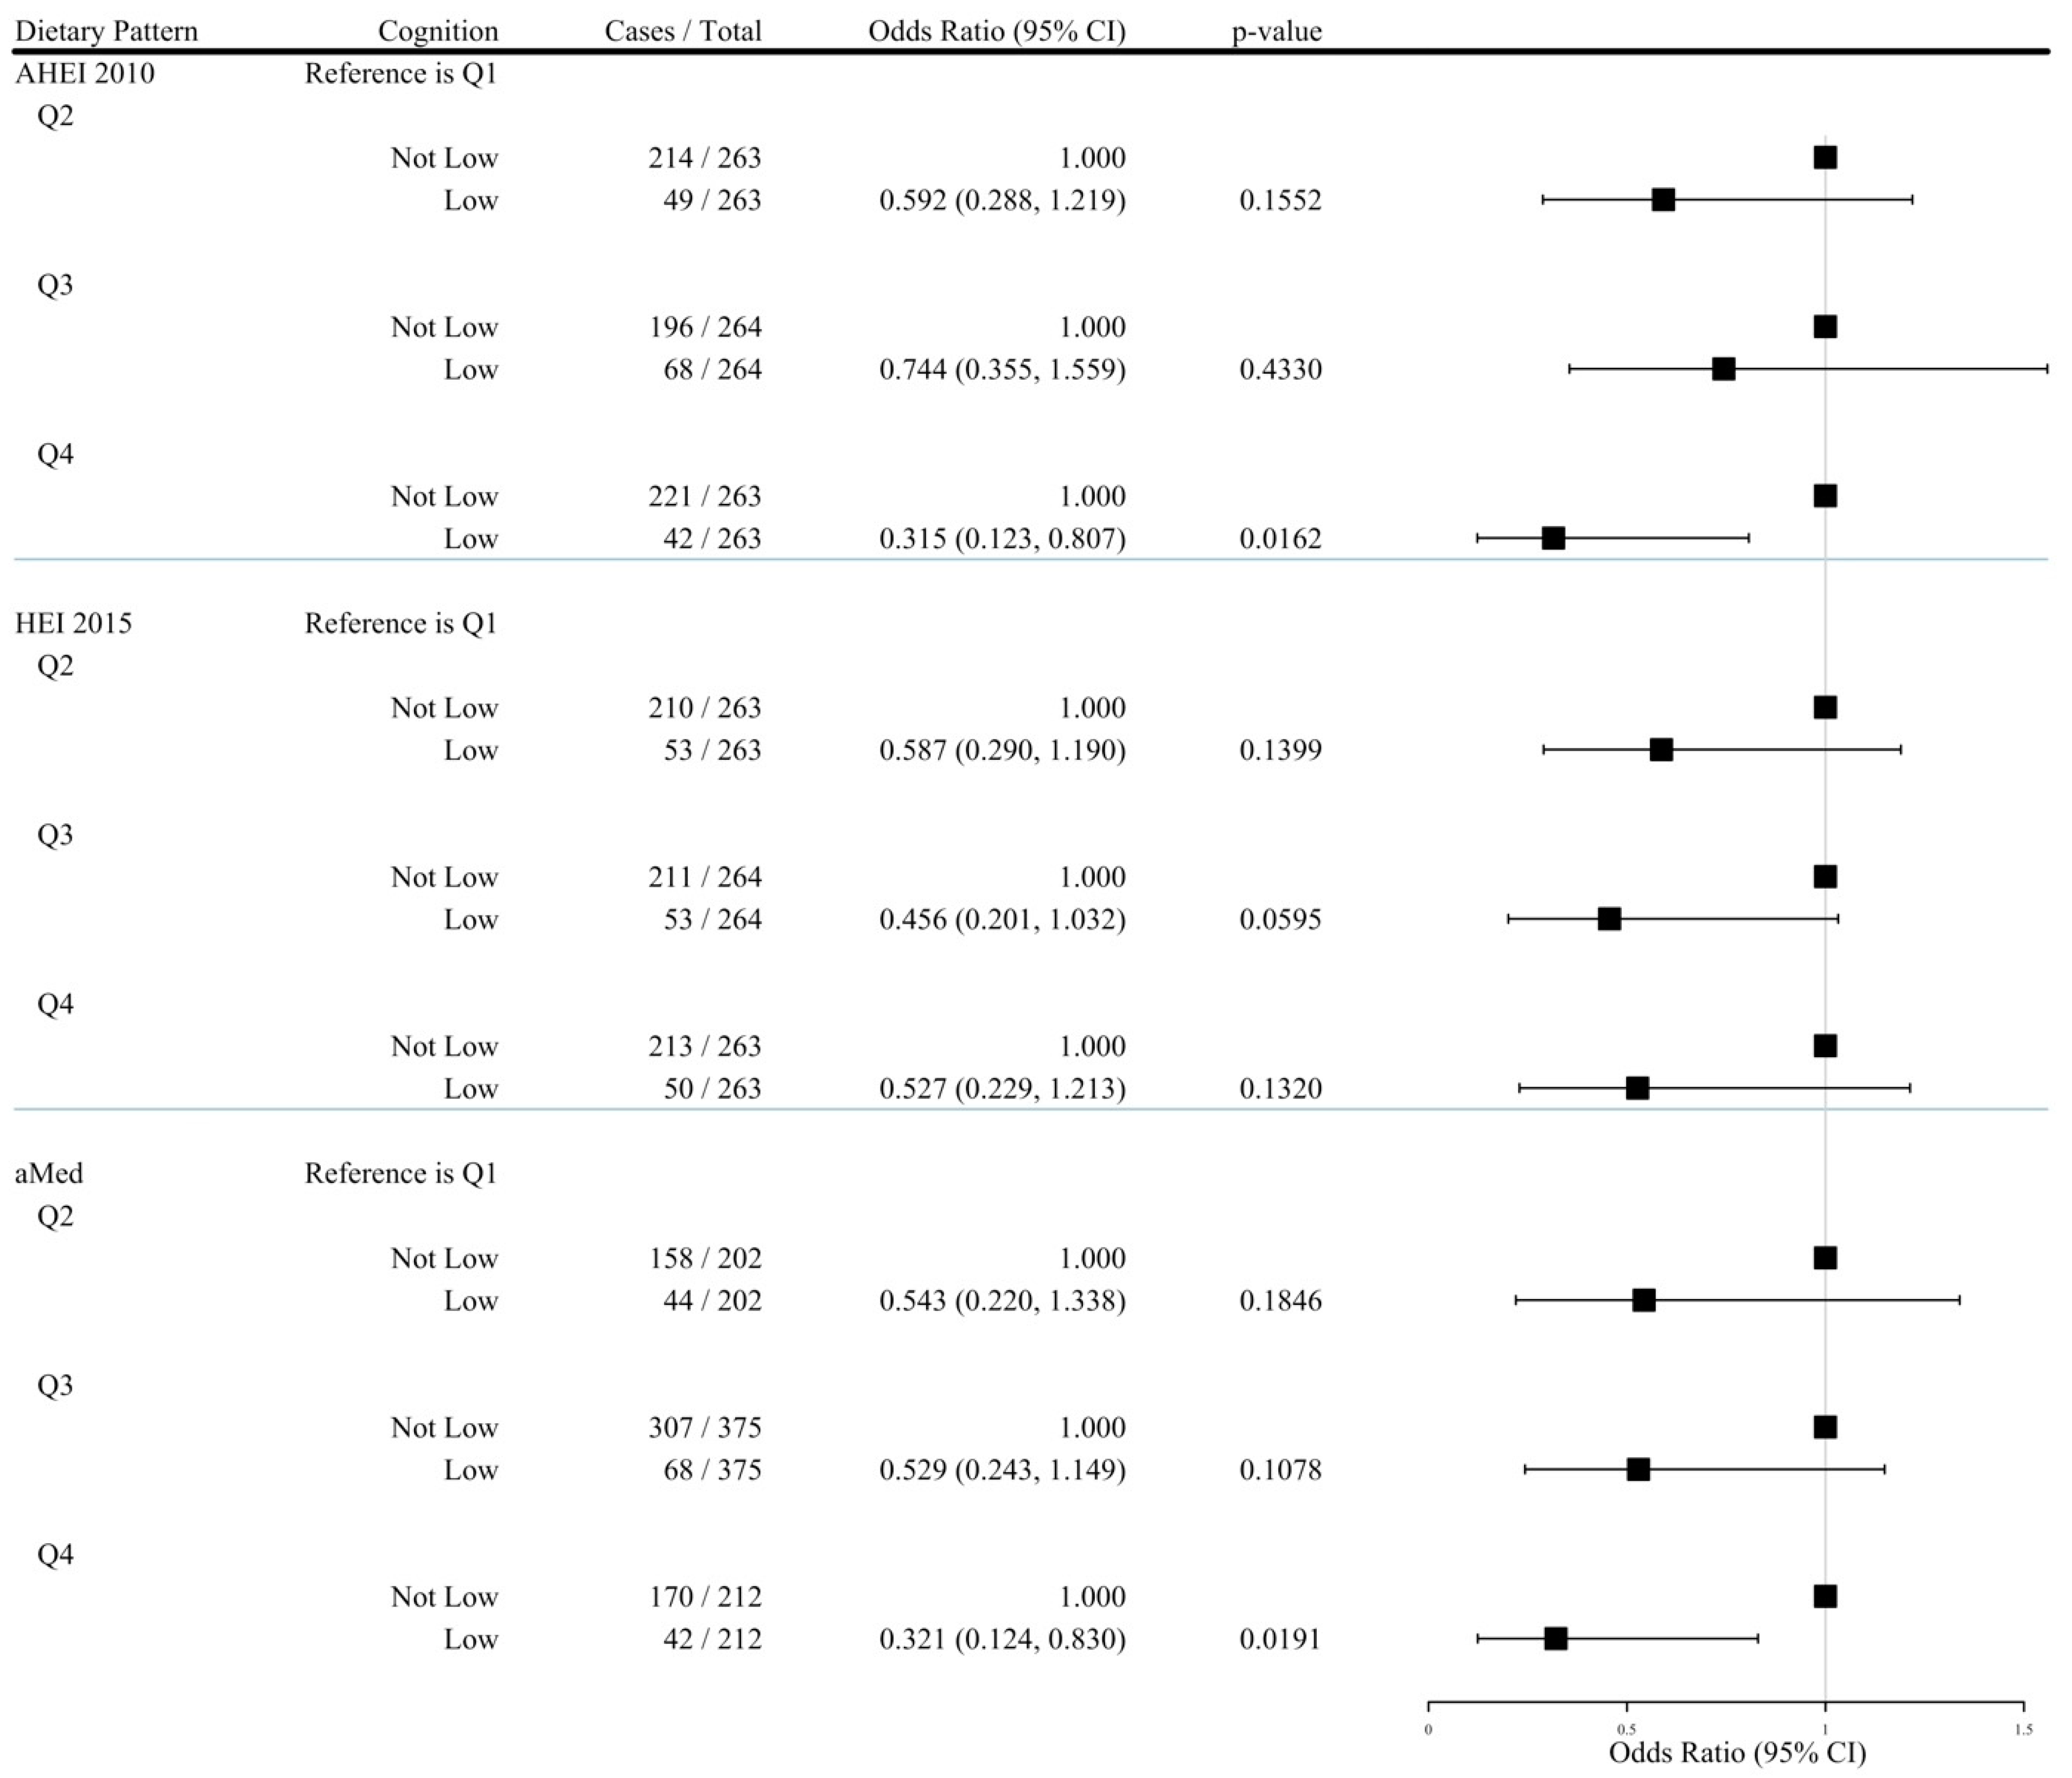
| Q1 1 | Q2 2 | Q3 2 | Q4 2 | PTrend 3 | Per SD Increase 4 | |
|---|---|---|---|---|---|---|
| Alternate Healthy Eating Index 2010 | ||||||
| Low Cognition | ||||||
| # Cases/Total | 60/263 | 49/263 | 68/264 | 42/263 | SD = 9.966 | |
| Model 1 | 1.000 | 0.775 (0.507, 1.183) | 1.174 (0.788, 1.749) | 0.643 (0.415, 0.997) * | 0.2105 | 0.867 (0.745, 1.008) |
| Model 2 | 1.000 | 0.675 (0.434, 1.051) | 0.984 (0.647, 1.496) | 0.514 (0.323, 0.818) ** | 0.0316 | 0.791 (0.672, 0.931) ††† |
| Model 3 | 1.000 | 0.596 (0.291, 1.220) | 0.763 (0.366, 1.591) | 0.332 (0.130, 0.846) * | 0.0443 | 0.729 (0.542, 0.979) † |
| Model 4 | 1.000 | 0.592 (0.288, 1.219) | 0.744 (0.355, 1.559) | 0.315 (0.123, 0.807) * | 0.0344 | 0.714 (0.530, 0.962) † |
| Healthy Eating Index 2015 | ||||||
| Low Cognition | ||||||
| # Cases/Total | 63/263 | 53/263 | 53/264 | 50/263 | SD = 9.192 | |
| Model 1 | 1.000 | 0.801 (0.530, 1.211) | 0.797 (0.527, 1.206) | 0.745 (0.490, 1.132) | 0.1789 | 0.928 (0.799, 1.078) |
| Model 2 | 1.000 | 0.813 (0.529, 1.250) | 0.700 (0.453, 1.080) | 0.685 (0.439, 1.069) | 0.0739 | 0.871 (0.742, 1.022) |
| Model 3 | 1.000 | 0.596 (0.296, 1.202) | 0.463 (0.205, 1.043) | 0.558 (0.245, 1.268) | 0.0970 | 0.789 (0.590, 1.056) |
| Model 4 | 1.000 | 0.587 (0.290, 1.190) | 0.456 (0.201, 1.032) | 0.527 (0.229, 1.213) | 0.0778 | 0.773 (0.575, 1.038) |
| Alternate Mediterranean Diet | ||||||
| Low Cognition | ||||||
| # Cases/Total | 65/264 | 44/202 | 68/375 | 42/212 | SD = 1.778 | |
| Model 1 | 1.000 | 0.853 (0.551, 1.318) | 0.678 (0.462, 0.995) * | 0.756 (0.488, 1.173) | 0.1486 | 0.881 (0.758, 1.024) |
| Model 2 | 1.000 | 0.784 (0.497, 1.235) | 0.585 (0.391, 0.875) ** | 0.600 (0.377, 0.956) * | 0.0194 | 0.810 (0.690, 0.951) †† |
| Model 3 | 1.000 | 0.519 (0.213, 1.263) | 0.535 (0.248, 1.154) | 0.330 (0.129, 0.844) * | 0.0346 | 0.676 (0.495, 0.923) † |
| Model 4 | 1.000 | 0.543 (0.220, 1.338) | 0.529 (0.243, 1.149) | 0.321 (0.124, 0.830) * | 0.0284 | 0.667 (0.487, 0.914) † |
Disclaimer/Publisher’s Note: The statements, opinions and data contained in all publications are solely those of the individual author(s) and contributor(s) and not of MDPI and/or the editor(s). MDPI and/or the editor(s) disclaim responsibility for any injury to people or property resulting from any ideas, methods, instructions or products referred to in the content. |
© 2025 by the authors. Licensee MDPI, Basel, Switzerland. This article is an open access article distributed under the terms and conditions of the Creative Commons Attribution (CC BY) license (https://creativecommons.org/licenses/by/4.0/).
Share and Cite
Ogarrio, K.; Santos, M.P.; De Anda-Duran, I.; Potts, K.S.; Bazzano, L.A.; Ley, S.H. Association Between Dietary Patterns and Cognitive Function in Midlife Adults: The Bogalusa Heart Study. Nutrients 2025, 17, 1636. https://doi.org/10.3390/nu17101636
Ogarrio K, Santos MP, De Anda-Duran I, Potts KS, Bazzano LA, Ley SH. Association Between Dietary Patterns and Cognitive Function in Midlife Adults: The Bogalusa Heart Study. Nutrients. 2025; 17(10):1636. https://doi.org/10.3390/nu17101636
Chicago/Turabian StyleOgarrio, Kristen, Maria P. Santos, Ileana De Anda-Duran, Kaitlin S. Potts, Lydia A. Bazzano, and Sylvia H. Ley. 2025. "Association Between Dietary Patterns and Cognitive Function in Midlife Adults: The Bogalusa Heart Study" Nutrients 17, no. 10: 1636. https://doi.org/10.3390/nu17101636
APA StyleOgarrio, K., Santos, M. P., De Anda-Duran, I., Potts, K. S., Bazzano, L. A., & Ley, S. H. (2025). Association Between Dietary Patterns and Cognitive Function in Midlife Adults: The Bogalusa Heart Study. Nutrients, 17(10), 1636. https://doi.org/10.3390/nu17101636