

Extra-Thyroidal Impacts of Serum Iodine Concentrations During Early Pregnancy on Metabolic Profiles and Pregnancy Outcomes: Prospective Study Based on Huizhou Mother–Infant Cohort

Abstract
1. Introduction
2. Materials and Methods
2.1. Participants and Recruitment
2.2. Data Collection from Questionnaire Survey and Biochemical Testing
2.3. Diagnosis of Gestational Complications and Metabolic Conditions
2.4. Obstetric and Birth Outcomes
2.5. Statistical Analysis
3. Results

| Number of Gestational Metabolic Syndromes | p | |||
|---|---|---|---|---|
| 0 (n = 785) | 1–2 (n = 547) | 3–4 (n = 55) | ||
| Maternal age, years | 27.7 ± 3.5 | 28.6 ± 3.7 | 32.1 ± 3.9 | <0.001 |
| Pre-pregnancy BMI, kg/m2 | 19.4 ± 1.8 | 23.1 ± 3.9 | 26.5 ± 3.6 | <0.001 |
| Education, university or above, n (%) | 195 (24.9%) | 117 (21.5%) | 10 (18.5%) | 0.105 |
| Nulliparous, n (%) | 469 (59.9%) | 271 (49.5%) | 19 (34.5%) | <0.001 |
| Smoking (active or passive), n (%) | 427 (54.4%) | 294 (53.7%) | 33 (60.0%) | 0.674 |
| Alcohol drinking, n (%) | 22 (2.8%) | 16 (2.9%) | 1 (1.8%) | 0.911 |
| Dietary seaweed and kelp intake, g/d (n = 157) | 10 (2.0, 22.5) | 10 (2.0, 40.0) | 20 (2.0, 80.0) | 0.811 |
| Usage of iodinized salt, n (%) (n = 729) | 176 (43.9%) | 148 (49.5%) | 16 (55.2%) | 0.534 |
| Gestationl weeks for biochemical testing, wks | 12.4 (12.0, 12.4) | 12.4 (12.1, 12.7) | 12.4 (12.0, 12.7) | 0.826 |
| Family history of diabetes, n% | 50 (6.4%) | 56 (10.2%) | 13 (23.6%) | <0.001 |
| Medical history of GDM, n (%) | 13 (1.7%) | 43 (7.9%) | 8 (14.5%) | <0.001 |
| Medical history of GH, n (%) | 2 (0.3%) | 8 (1.5%) | 2 (3.6%) | 0.028 |
| Medical history of PCOS, n (%) | 13 (1.7%) | 29 (5.3%) | 4 (7.3%) | <0.001 |
| Current GDM, n (%) | 0 | 186 (34.0%) | 49 (89.1%) | <0.001 |
| Current GH, n (%) | 0 | 16 (2.9%) | 12 (21.8%) | <0.001 |
| Current hyperlipidemia, n% | 0 | 201 (36.7%) | 53 (96.4%) | <0.001 |
| Current euthyroid, n% | 693 (90.5%) | 496 (93.2%) | 49 (90.7%) | 0.207 |
| GWG at T1, kg | 0.41 ± 2.20 | 1.39 ± 2.93 | 3.56 ± 3.97 | <0.001 |
| Body fat % (n = 709) | 26.2 ± 5.0 | 32.9 ± 6.3 | 35.7 ± 4.2 | <0.001 |
| Triglycerides, mmol/L | 1.04 ± 0.26 | 1.44 ± 0.66 | 2.37 ± 0.92 | <0.001 |
| Uric acid, μmol/L | 228.8 ± 56.3 | 252.9 ± 61.5 | 272.1 ± 65.9 | 0.001 |
| HbA1c (%) (n = 188) | 4.91 ± 0.45 | 5.21 ± 0.44 | 5.42 ± 0.38 | <0.001 |
| TyG index | 8.17 ± 0.27 | 8.49 ± 0.37 | 9.08 ± 0.38 | <0.001 |
| Framingham steatosis index (FSI) | 12.2 ± 0.4 | 13.5 ± 0.9 | 15.5 ± 0.8 | <0.001 |
| SIC at T1, μg/L | 90.0 ± 16.6 | 90.0 ± 17.1 | 90.3 ± 17.5 | 0.992 |
| TSH, mIU/L | 1.28 ± 1.16 | 1.31 ± 1.38 | 1.37 ± 0.92 | 0.060 |
| FT3, pmol/L | 5.01 ± 1.07 | 5.14 ± 0.98 | 5.36 ± 0.76 | 0.011 |
| FT4, pmol/L | 17.98 ± 3.26 | 16.87 ± 2.92 | 15.68 ± 2.53 | <0.001 |
| FT3/FT4 ratio | 0.281 ± 0.041 | 0.308 ± 0.050 | 0.348 ± 0.061 | <0.001 |
| TPOAb+, n/total (%) * | 9/34 (20.9%) | 2/11 (15.4%) | 0/5 (0%) | 0.495 |
| TGAb+, n/total (%) * | 4/20 (16.7%) | 0/6 (0%) | 0/1 (0%) | 0.512 |
| TRAb+, n/total (%) * | 0/11 (0%) | 0/5 (0%) | 0/2 (0%) | N.A |
| Pregnancy outcomes | ||||
| Gestational weeks at delivery, wks | 39.3 ± 1.3 | 39.2 ± 1.6 | 38.3 ± 1.5 | <0.001 |
| Birth weight, kg | 3.11 ± 0.43 | 3.13 ± 0.47 | 3.12 ± 0.64 | 0.869 |
| Fetal distress, n (%) | 46 (7.8%) | 26 (6.4%) | 2 (5.6%) | 0.640 |
| Vaginal delivery, n (%) | 433 (55.2%) | 262 (47.9%) | 20 (36.4%) | 0.001 |
| Crude Model | Model 1 | Model 2 (+Thyroid Markers) | p for Non-Linearity | |||||||
|---|---|---|---|---|---|---|---|---|---|---|
| B (95% CI) | β | p | B (95% CI) | β | p | B (95% CI) | β | p | ||
| GWG at T1 # | −3.778 (−5.540, −2.016) | −0.110 | <0.001 | −3.901 (−5.669, −2.133) | −0.113 | <0.001 | −0.985 (−2.825, 0.855) | −0.029 | 0.294 | 0.231 |
| BMI at T1 # | −3.247 (−5.712, −0.783) | −0.068 | 0.010 | −3.358 (−5.730, −0.987) | −0.070 | 0.006 | 1.849 (−0.463, 4.162) | 0.039 | 0.117 | 0.683 |
| Lg BF% * | 0.002 (−0.045, 0.049) | 0.002 | 0.944 | 0.021 (−0.020, 0.062) | 0.023 | 0.313 | 0.040 (−0.003, 0.084) | 0.044 | 0.068 | 0.959 |
| FBG, mmol/L | 0.022 (−0.206, 0.251) | 0.005 | 0.848 | 0.104 (−0.118, 0.326) | 0.023 | 0.358 | 0.143 (−0.094, 0.381) | 0.032 | 0.237 | 0.101 |
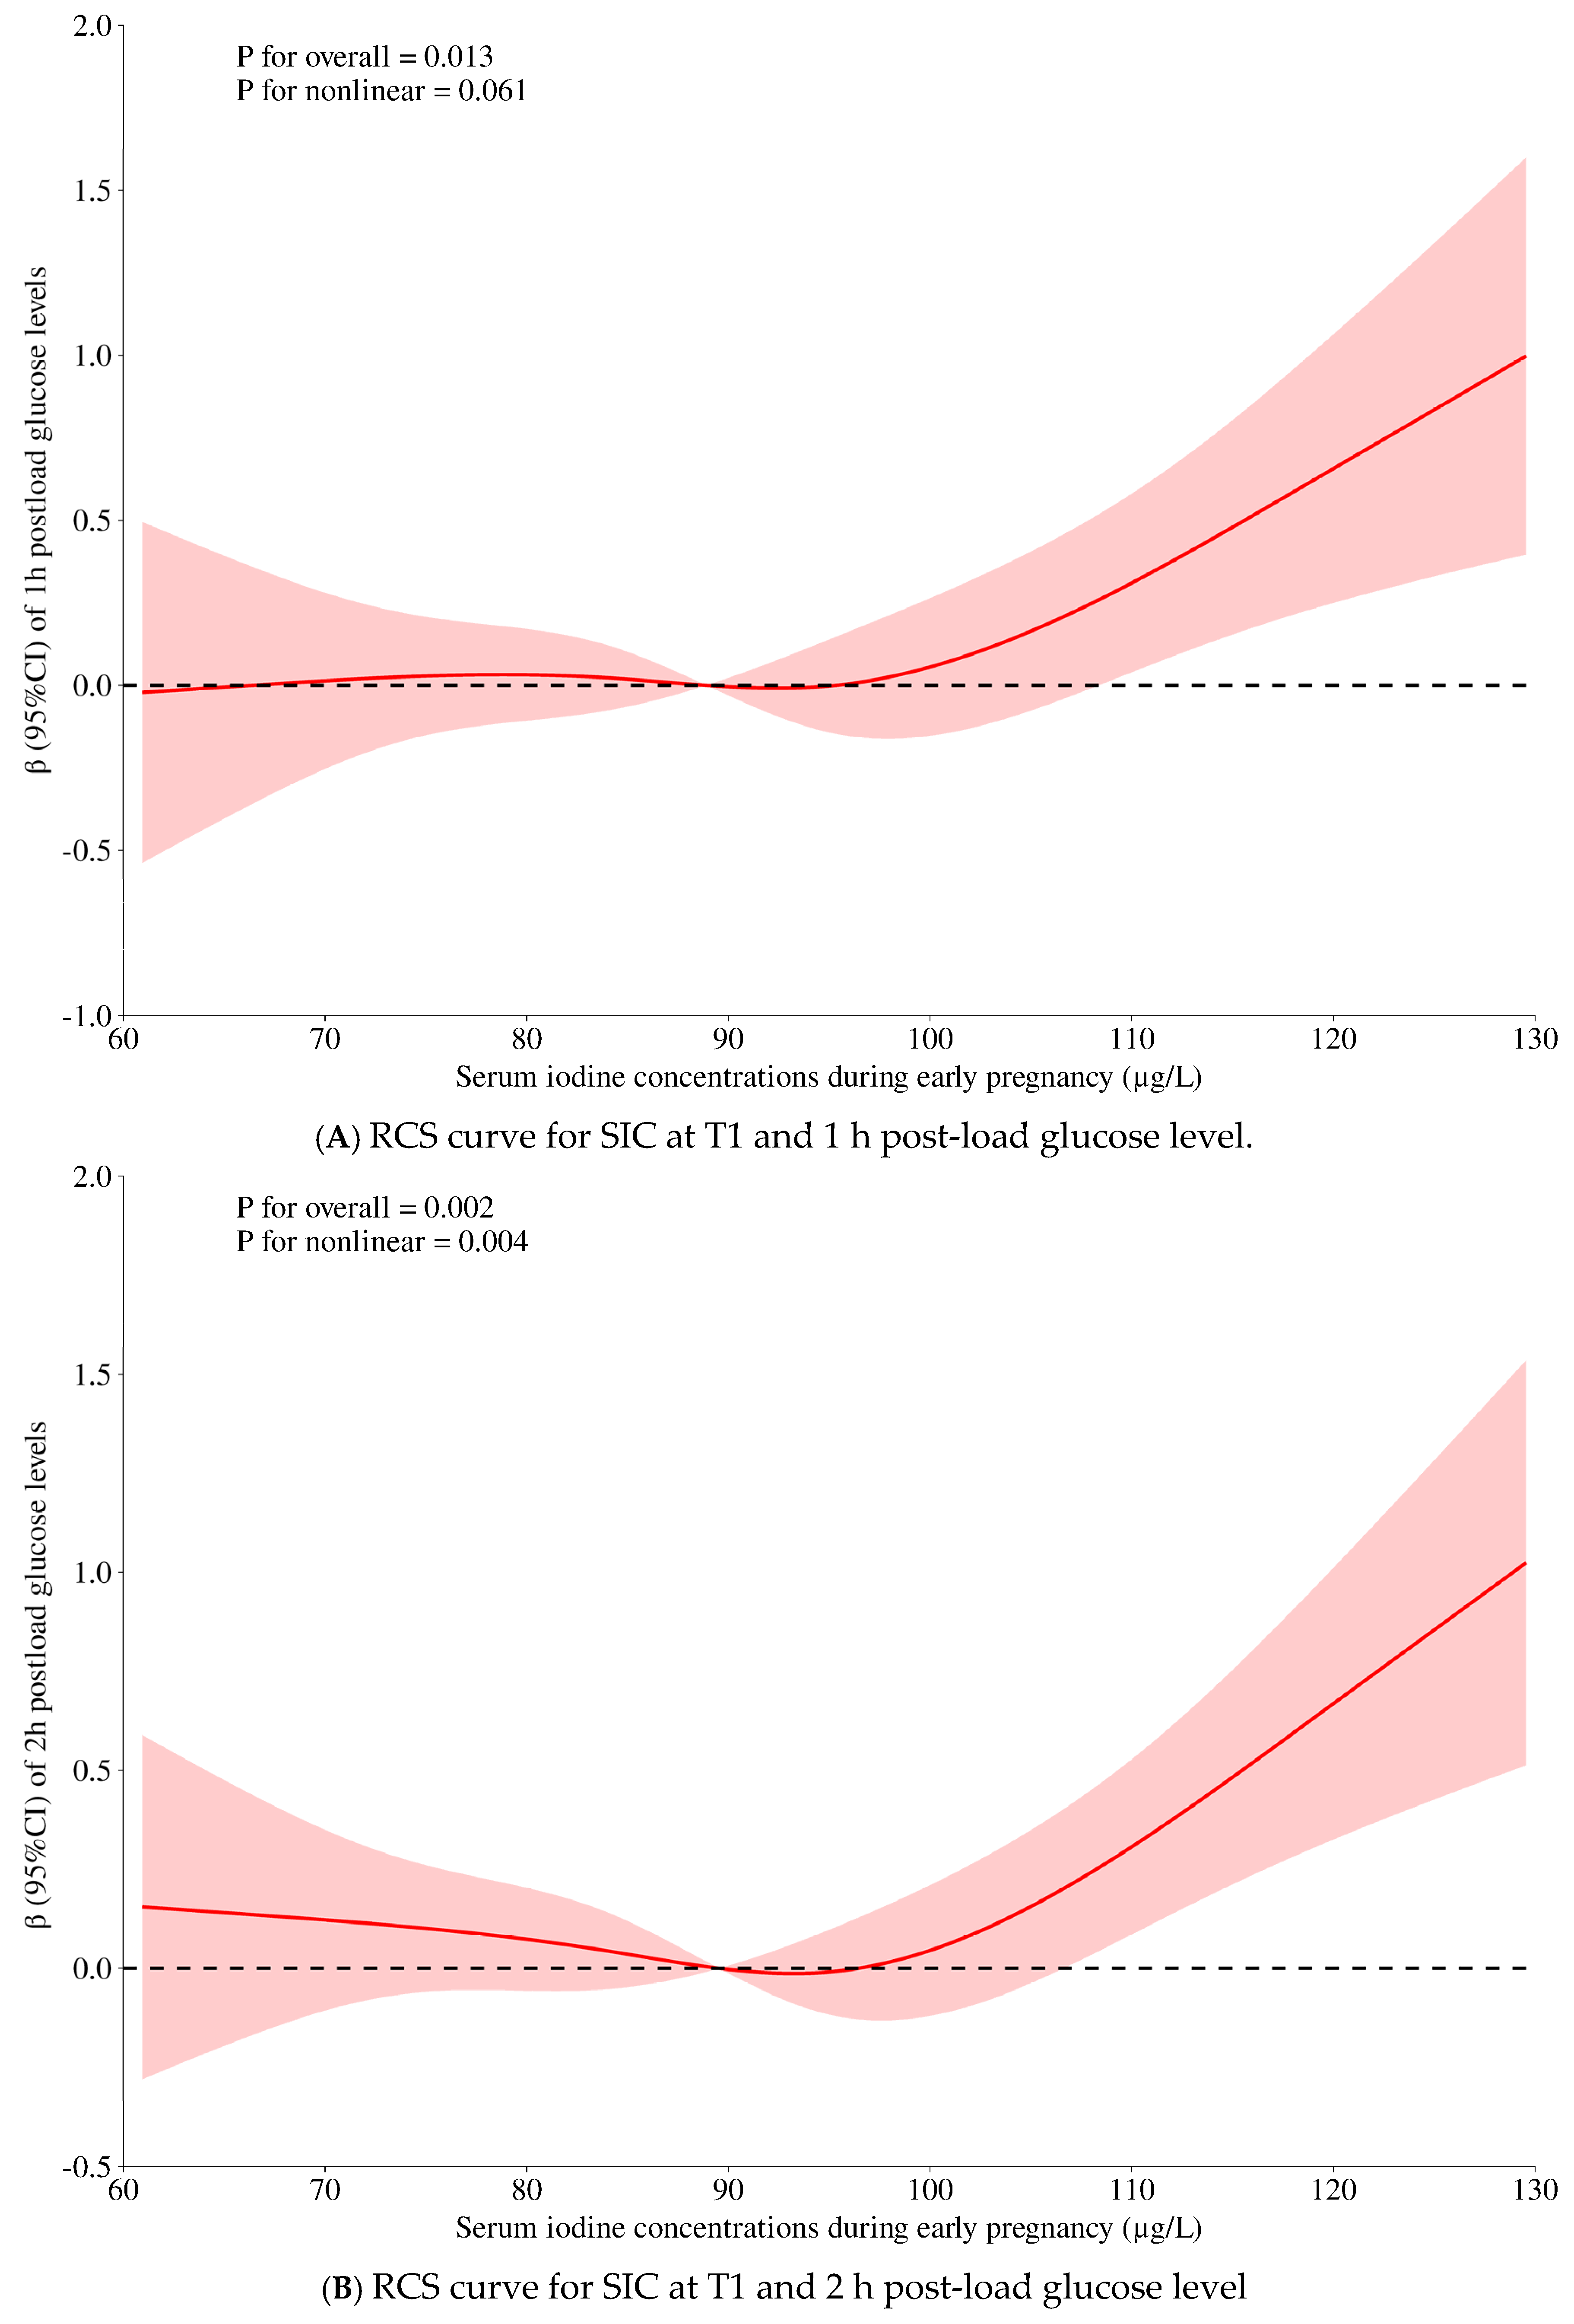
| 1-h PG, mmol/L | 0.105 (−0.920, 1.130) | 0.005 | 0.840 | 0.459 (−0.535, 1.454) | 0.023 | 0.365 | 0.880 (−0.180, 1.940) | 0.044 | 0.104 | 0.061 |
| 2-h PG, mmol/L | 0.381 (−0.494, 1.257) | 0.022 | 0.393 | 0.698 (−0.150, 1.546) | 0.041 | 0.107 | 1.053 (0.150, 1.956) | 0.062 | 0.022 | 0.004 |
| HbA1c, % * | 0.072 (−0.031, 0.175) | 0.036 | 0.170 | 0.082 (−0.022, 0.185) | 0.041 | 0.121 | 0.095 (−0.016, 0.206) | 0.047 | 0.092 | 0.108 |
| LgTG, mmol/L | 0.261 (0.157, 0.365) | 0.128 | <0.001 | 0.289 (0.193, 0.384) | 0.142 | <0.001 | 0.375 (0.275, 0.475) | 0.185 | <0.001 | 0.592 |
| TC, mmol/L | 0.301 (−0.133, 0.735) | 0.036 | 0.174 | 0.334 (−0.100, 0.768) | 0.040 | 0.132 | 0.406 (−0.057, 0.870) | 0.048 | 0.085 | 0.420 |
| TyG index | 0.528 (0.298, 0.758) | 0.117 | <0.001 | 0.617 (0.406, 0.828) | 0.137 | <0.001 | 0.791 (0.569, 1.013) | 0.176 | <0.001 | 0.721 |
| TyG-BMI # | −12.63 (−34.37, 9.11) | −0.030 | 0.255 | −11.55 (−32.47, 9.37) | −0.027 | 0.279 | 30.78 (10.27, 51.29) | 0.073 | 0.003 | 0.668 |
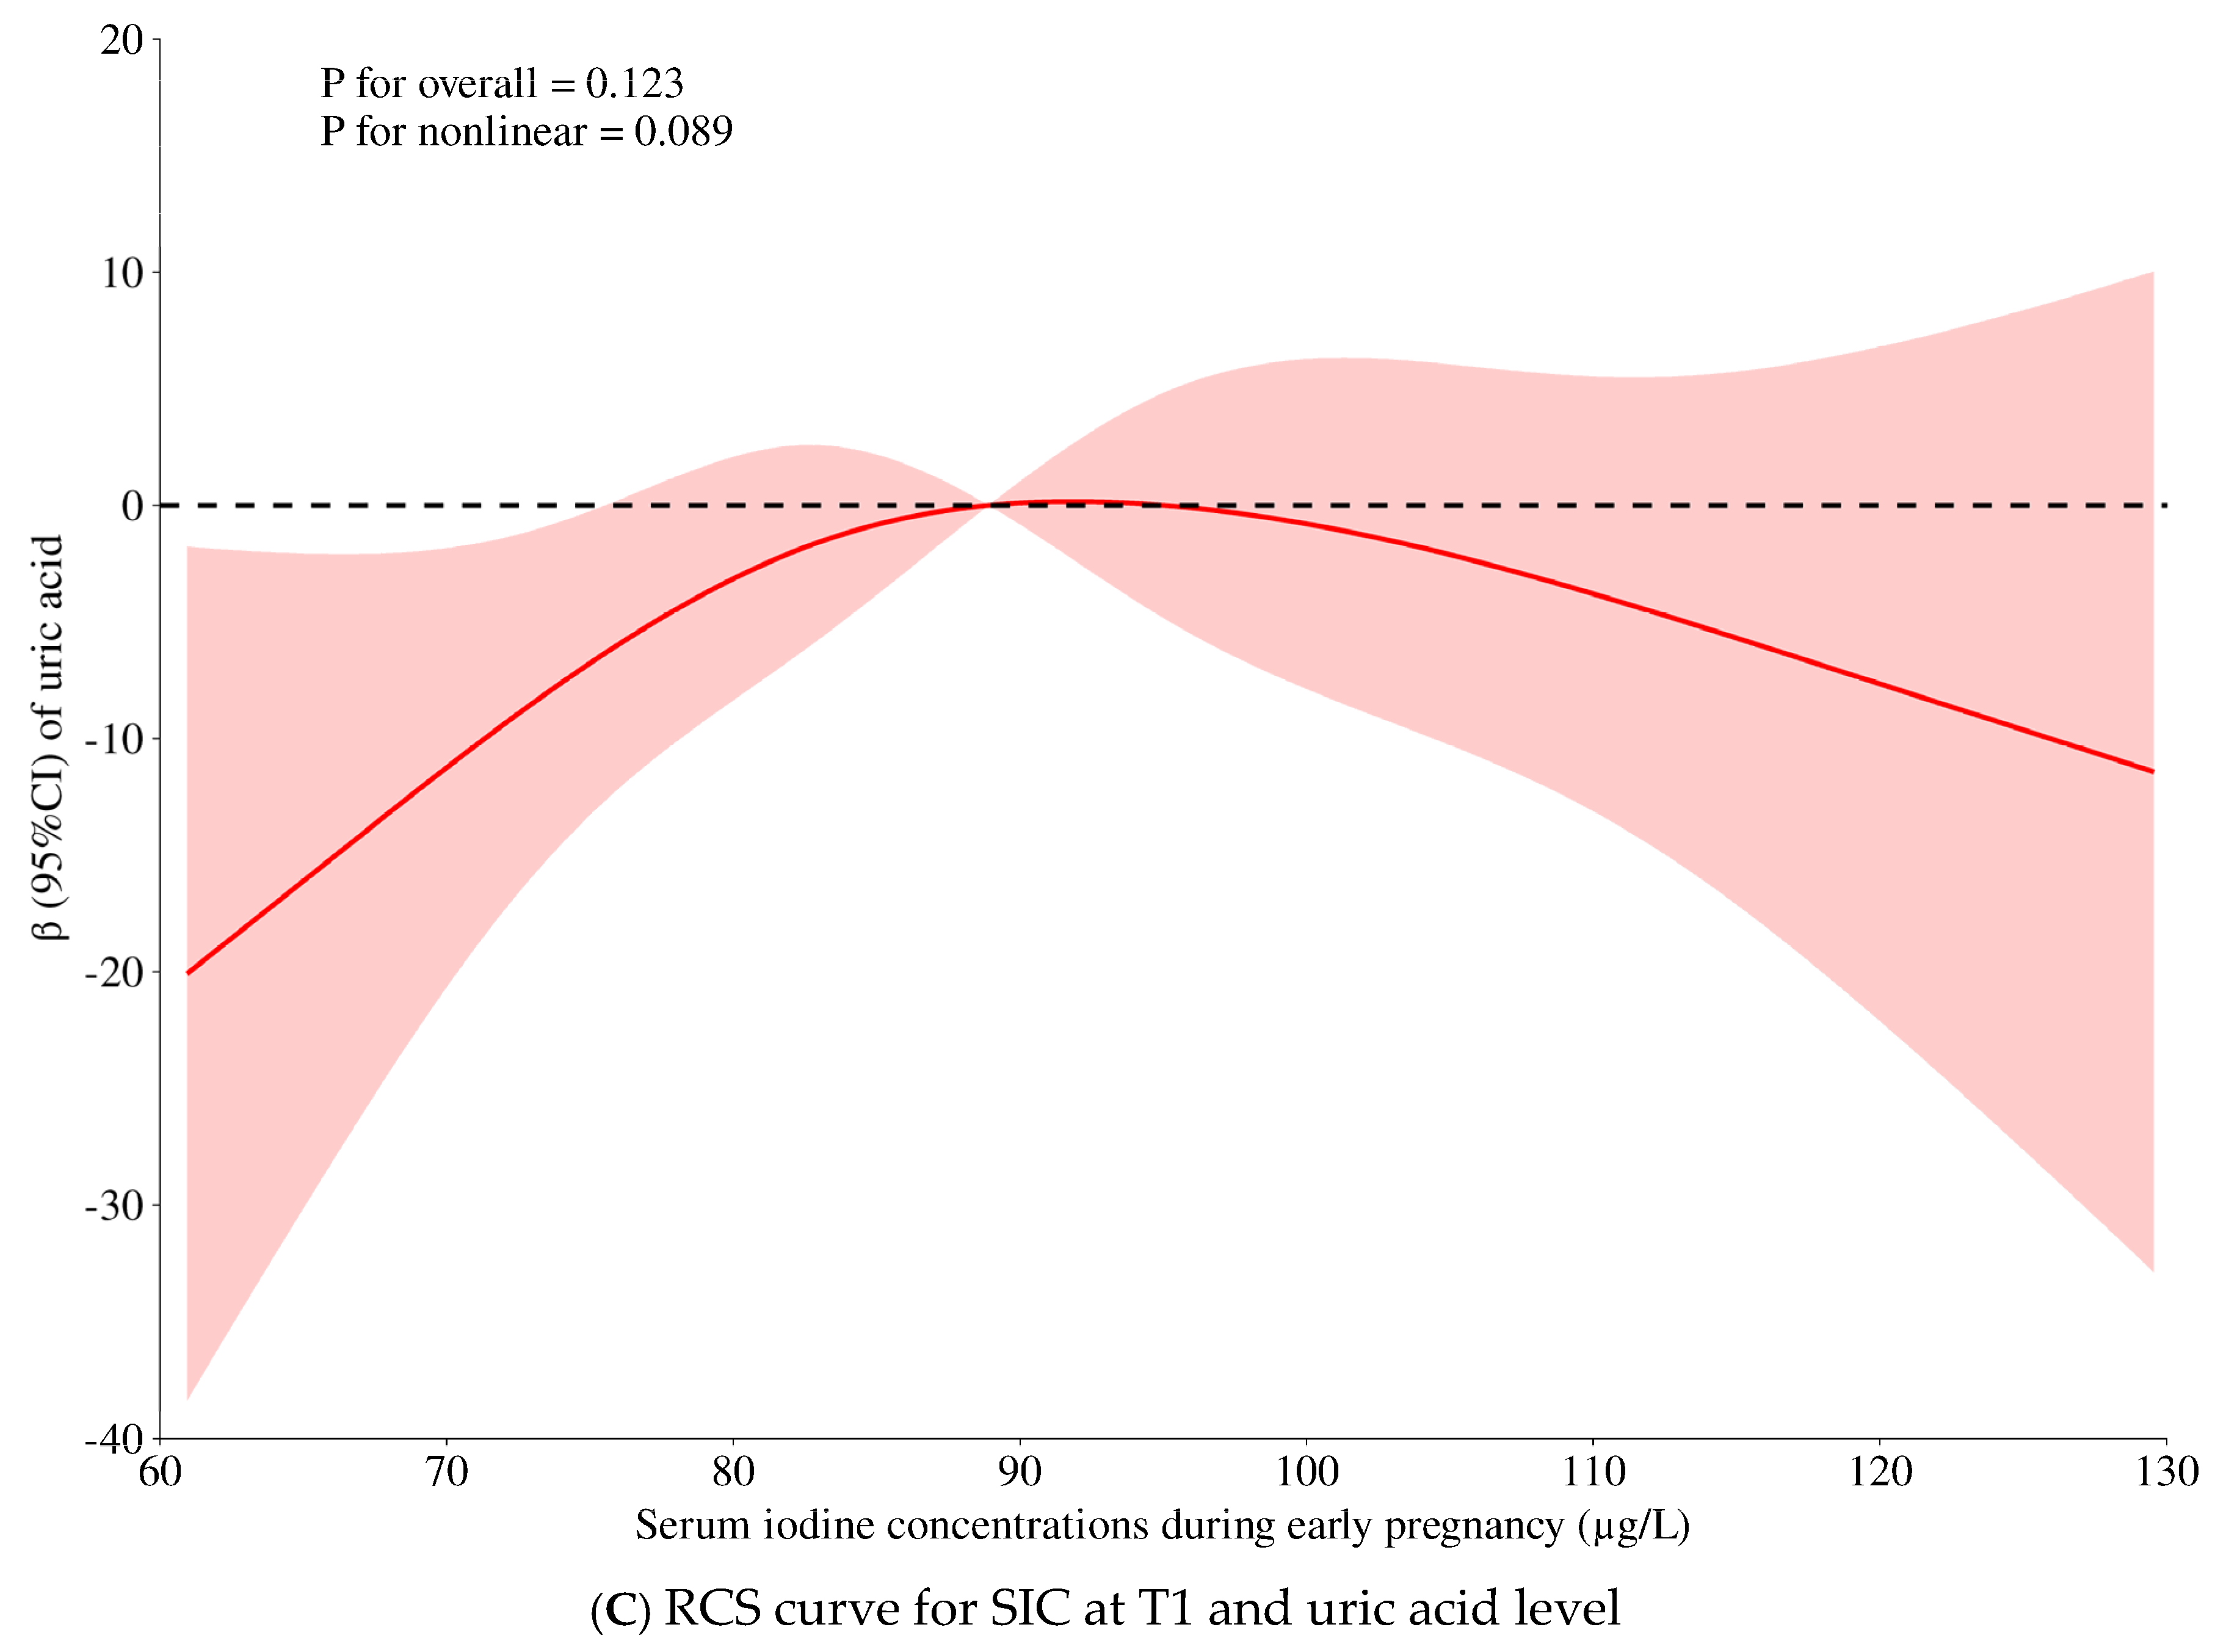
| Uric acid, μmol/L | 41.72 (3.08, 80.37) | 0.055 | 0.034 | 45.18 (7.86, 82.51) | 0.060 | 0.018 | 33.95 (−5.98, 73.87) | 0.045 | 0.096 | 0.089 |
| FSI # | −0.172 (−0.860, 0.516) | −0.013 | 0.624 | −0.264 (−0.900, 0.372) | −0.021 | 0.416 | 1.014 (0.860, 1.163) | 0.080 | 0.001 | 0.885 |
| Metabolic Factors | Estimated Means ± SE (Model 1) | p | Estimated Means ± SE (Model 2) | p |
|---|---|---|---|---|
| BMI at T1, kg/m2 | 0.012 | 0.398 | ||
| Low SIC at T1 | 21.8 ± 0.2 | 21.5 ± 0.2 | ||
| High SIC at T1 | 21.2 ± 0.2 | 21.6 ± 0.2 | ||
| Mean difference | −0.58 ± 0.23 | 0.19 ± 0.22 | ||
| GWG at T1, kg | <0.001 | 0.300 | ||
| Low SIC at T1 | 1.12 ± 0.12 | 0.94 ± 0.12 | ||
| High SIC at T1 | 0.52 ± 0.12 | 0.76 ± 0.12 | ||
| Mean difference | –0.60 ± 0.17 | –0.18 ± 0.17 | ||
| BF% at T1, % | <0.001 | <0.001 | ||
| Low SIC at T1 | 28.7 ± 0.2 | 28.7 ± 0.2 | ||
| High SIC at T1 | 30.0 ± 0.2 | 30.1 ± 0.3 | ||
| Mean difference | 1.32 ± 0.35 | 1.35 ± 0.36 | ||
| Fasting glucose, mmol/L | 0.824 | 0.846 | ||
| Low SIC at T1 | 4.48 ± 0.02 | 4.48 ± 0.02 | ||
| High SIC at T1 | 4.49 ± 0.02 | 4.49 ± 0.02 | ||
| Mean difference | 0.005 ± 0.024 | 0.005 ± 0.026 | ||
| 1 h PG, mmol/L | 0.450 | 0.191 | ||
| Low SIC at T1 | 7.83 ± 0.08 | 7.78 ± 0.08 | ||
| High SIC at T1 | 7.91 ± 0.08 | 7.93 ± 0.08 | ||
| Mean difference | 0.08 ± 0.11 | 0.15 ± 0.12 | ||
| 2 h PG, mmol/L | 0.351 | 0.200 | ||
| Low SIC at T1 | 6.78 ± 0.07 | 6.75 ± 0.07 | ||
| High SIC at T1 | 6.87 ± 0.07 | 6.88 ± 0.07 | ||
| Mean difference | 0.09 ± 0.10 | 0.13 ± 0.10 | ||
| HAb1c at T1, % * | 0.020 | 0.050 | ||
| Low SIC at T1 | 5.13 ± 0.06 | 5.12 ± 0.06 | ||
| High SIC at T1 | 5.33 ± 0.06 | 5.31 ± 0.07 | ||
| Mean difference | 0.203 ± 0.086 | 0.187 ± 0.094 | ||
| TGs, mmol/L | 0.002 | <0.001 | ||
| Low SIC at T1 | 1.17 ± 0.02 | 1.16 ± 0.02 | ||
| High SIC at T1 | 1.28 ± 0.02 | 1.30 ± 0.03 | ||
| Mean difference | 0.109 ± 0.034 | 0.138 ± 0.036 | ||
| TC, mmol/L | 0.094 | 0.061 | ||
| Low SIC at T1 | 4.12 ± 0.03 | 4.12 ± 0.03 | ||
| High SIC at T1 | 4.19 ± 0.03 | 4.21 ± 0.03 | ||
| Mean difference | 0.074 ± 0.044 | 0.087 ± 0.047 | ||
| TyG index | <0.001 | <0.001 | ||
| Low SIC at T1 | 8.26 ± 0.02 | 8.25 ± 0.02 | ||
| High SIC at T1 | 8.36 ± 0.02 | 8.37 ± 0.02 | ||
| Mean difference | 0.100 ± 0.024 | 0.122 ± 0.025 | ||
| TyG-BMI | <0.001 | <0.001 | ||
| Low SIC at T1 | 177.9 ± 0.4 | 177.8 ± 0.4 | ||
| High SIC at T1 | 180.1 ± 0.4 | 180.5 ± 0.4 | ||
| Mean difference | 2.19 ± 0.55 | 2.66 ± 0.58 | ||
| Uric acid, μmol/L | 0.025 | 0.195 | ||
| Low SIC at T1 | 238.9 ± 2.7 | 240.5 ± 2.7 | ||
| High SIC at T1 | 247.5 ± 2.7 | 245.7 ± 2.8 | ||
| Mean difference | 8.63 ± 3.8 | 5.22 ± 4.03 | ||
| FSI | 0.001 | <0.001 | ||
| Low SIC at T1 | 12.7 ± 0.03 | 12.7 ± 0.03 | ||
| High SIC at T1 | 12.8 ± 0.03 | 12.8 ± 0.03 | ||
| Mean difference | 0.12 ± 0.04 | 0.12 ± 0.04 | ||
3.1. The Joint Effects of Maternal SICs (T1) and Metabolic Conditions on Pregnancy Outcomes (Table 4 and Table 5)
| n | Crude Model | Model 1 | Model 2 | p for Interaction | |
|---|---|---|---|---|---|
| Postpartum bleeding, mL | 0.104 | ||||
| Low SIC | p | 0.001 | 0.001 | 0.011 | |
| No GMS (0 item) | 288 | 198.3 ± 6.2 | 201.7 ± 4.9 | 203.0 ± 5.1 | |
| High risk of GMS (≥1 item) | 228 | 229.5 ± 6.9 ** | 225.5 ± 5.5 ** | 223.4 ± 5.7 * | |
| Mean difference | 31.2 ± 9.3 ** | 23.8 ± 7.4 ** | 20.3 ± 8.0 * | ||
| High SIC | p | 0.002 | 0.016 | 0.026 | |
| No GMS (0 item) | 301 | 189.8 ± 5.8 | 193.9 ± 4.8 | 194.1 ± 5.0 | |
| High risk of GMS (≥1 item) | 216 | 217.3 ± 6.8 ** | 212.3 ± 5.7 * | 212.4 ± 6.0 * | |
| Mean difference | 27.5 ± 8.9 | 18.4 ± 7.6 * | 18.2 ± 8.1 * | ||
| Postpartum bleeding, mL | 0.002 | ||||
| Low SIC | p | <0.001 | 0.001 | 0.007 | |
| Pre-pregnancy BMI < 23.0 | 405 | 200.5 ± 5.1 | 204.8 ± 4.1 | 205.1 ± 4.1 | |
| Pre-pregnancy BMI ≥ 23.0 | 131 | 244.4 ± 9.0 ** | 231.7 ± 7.2 ** | 229.2 ± 7.6 ** | |
| Mean difference | 43.9 ± 10.3 | 26.9 ± 8.3 | 24.1 ± 8.9, | ||
| High SIC | p | <0.001 | 0.001 | 0.005 | |
| Pre-pregnancy BMI < 23.0 | 429 | 193.4 ± 4.8 | 195.1 ± 3.9 | 195.5 ± 4.1 | |
| Pre-pregnancy BMI ≥ 23.0 | 108 | 231.0 ± 9.6 ** | 225.2 ± 8.1 ** | 223.2 ± 8.5 ** | |
| Mean difference | 37.6 ± 10.7 ** | 30.0 ± 9.2 ** | 27.7 ± 9.7 ** | ||
| Postpartum bleeding, mL | 0.003 | ||||
| Low SIC | p | 0.001 | 0.013 | 0.094 | |
| FSI < median | 264 | 196.6 ± 6.4 | 203.1 ± 5.1 | 205.3 ± 5.4 | |
| FSI ≥ median | 252 | 228.3 ± 6.6 | 221.7 ± 5.2 | 219.1 ± 5.5 | |
| Mean difference | p | 31.6 ± 9.2 ** | 18.6 ± 7.4 | 13.8 ± 8.2 | |
| High SIC | <0.001 | <0.001 | <0.001 | ||
| FSI < median | 271 | 180.3 ± 6.0 | 186.6 ± 5.1 | 187.4 ± 5.4 | |
| FSI ≥ median | 246 | 224.5 ± 6.3 ** | 218.0 ± 5.4 ** | 217.3 ± 5.6 ** | |
| Mean difference | 44.3 ± 8.7 ** | 31.4 ± 7.6 ** | 29.9 ± 8.2 ** | ||
| Delivery weeks, GWs | 0.046 | ||||
| Low SIC | 0.130 | 0.336 | 0.378 | ||
| TGs < 1.7 mmol/L | 460 | 39.3 ± 0.1 | 39.3 ± 0.1 | 39.3 ± 0.1 | |
| TGs ≥ 1.7 mmol/L | 57 | 39.0 ± 0.2 | 39.1 ± 0.2 | 39.1 ± 0.2 | |
| Mean difference | −0.3 ± 0.2 | −0.2 ± 0.2 | −0.2 ± 0.2 | ||
| High SIC | <0.001 | <0.001 | 0.001 | ||
| TGs < 1.7 mmol/L | 454 | 39.3 ± 0.1 | 39.3 ± 0.1 | 39.3 ± 0.1 | |
| TGs ≥ 1.7 mmol/L | 64 | 38.4 ± 0.2 ** | 38.6 ± 0.2 ** | 38.5 ± 0.2 ** | |
| Mean difference | −0.9 ± 0.2 ** | −0.7 ± 0.2 ** | −0.7 ± 0.2 ** | ||
| Delivery weeks, GWs | 0.043 | ||||
| Low SIC | 0.074 | 0.117 | 0.160 | ||
| No hyperlipidemia | 435 | 39.3 ± 0.1 | 39.3 ± 0.1 | 39.3 ± 0.1 | |
| Yes hyperlipidemia | 82 | 39.0 ± 0.2 | 39.1 ± 0.2 | 39.1 ± 0.2 | |
| Mean difference | −0.3 ± 0.2 | −0.3 ± 0.2 | −0.2 ± 0.2 | ||
| High SIC | <0.001 | <0.001 | <0.001 | ||
| No hyperlipidemia | 419 | 39.4 ± 0.1 | 39.3 ± 0.1 | 39.3 ± 0.1 | |
| Yes hyperlipidemia | 99 | 38.6 ± 0.2 | 38.7 ± 0.2 ** | 38.6 ± 0.2 ** | |
| Mean difference | −0.8 ± 0.2 | −0.7 ± 0.2 | −0.7 ± 0.2 ** | ||
| Birth weight, kg | 0.071 | ||||
| Low SIC | 0.826 | 0.314 | 0.672 | ||
| No hyperlipidemia | 435 | 3.16 ± 0.02 | 3.15 ± 0.02 | 3.16 ± 0.02 | |
| Yes hyperlipidemia | 82 | 3.17 ± 0.05 | 3.20 ± 0.04 | 3.18 ± 0.04 | |
| Mean difference | 0.012 ± 0.055 | 0.045 ± 0.045 | 0.019 ± 0.045 | ||
| High SIC | 0.015 | 0.947 | 0.952 | ||
| No hyperlipidemia | 419 | 3.10 ± 0.02 | 3.08 ± 0.02 | 3.08 ± 0.02 | |
| Yes hyperlipidemia | 99 | 2.98 ± 0.05 | 3.08 ± 0.04 | 3.08 ± 0.04 | |
| Mean difference | −0.122 ± 0.050 | 0.003 ± 0.041 | 0.003 ± 0.042 | ||
| Birth length, cm | 0.096 | ||||
| Low SIC | 0.652 | 0.483 | 0.871 | ||
| No hyperlipidemia | 434 | 49.9 ± 0.1 | 49.8 ± 0.1 | 49.9 ± 0.1 | |
| Yes hyperlipidemia | 82 | 49.8 ± 0.2 | 50.0 ± 0.2 | 49.9 ± 0.2 | |
| Mean difference | −0.10 ± 0.23 | 0.13 ± 0.19 | 0.03 ± 0.19 | ||
| High SIC | 0.007 | 0.803 | 0.777 | ||
| No hyperlipidemia | 419 | 49.8 ± 0.1 | 49.7 ± 0.1 | 49.6 ± 0.1 | |
| Yes hyperlipidemia | 97 | 49.1 ± 0.2 ** | 49.7 ± 0.2 | 49.7 ± 0.2 | |
| Mean difference | −0.66 ± 0.25 ** | 0.05 ± 0.19 | 0.06 ± 0.20 | ||
| Birth length, cm | 0.045 | ||||
| Low SIC | 0.496 | 0.052 | 0.189 | ||
| TGs < 1.7 mmol/L | 460 | 49.8 ± 0.1 | 49.8 ± 0.1 | 49.8 ± 0.1 | |
| TGs ≥ 1.7 mmol/L | 57 | 50.0 ± 0.2 | 50.2 ± 0.2 | 50.1 ± 0.2 | |
| Mean difference | 0.18 ± 0.26 | 0.43 ± 0.22 | 0.29 ± 0.22 | ||
| High SIC | 0.036 | 0.487 | 0.436 | ||
| TGs < 1.7 mmol/L | 454 | 49.7 ± 0.1 | 49.6 ± 0.1 | 49.6 ± 0.1 | |
| TGs ≥ 1.7 mmol/L | 64 | 49.1 ± 0.3 * | 49.8 ± 0.2 | 49.8 ± 0.2 | |
| Mean difference | −0.62 ± 0.29 * | 0.23 ± 0.49 | 0.18 ± 0.25 | ||
| Birth length, cm | 0.017 | ||||
| Low SIC | 0.883 | 0.043 | 0.104 | ||
| Normal | 518 | 49.8 ± 0.1 | 49.8 ± 0.1 | 49.8 ± 0.1 | |
| GH | 17 | 49.8 ± 0.5 | 50.6 ± 0.4 * | 50.4 ± 0.4 | |
| Mean difference | −0.07 ± 0.46 | 0.75 ± 0.37 * | 0.61 ± 0.37 | ||
| High SIC | 0.003 | 0.013 | 0.005 | ||
| Normal | 525 | 49.7 ± 0.1 | 49.7 ± 0.1 | 49.7 ± 0.1 | |
| GH | 11 | 47.7 ± 0.7 ** | 48.5 ± 0.49 * | 48.2 ± 0.5 ** | |
| Mean difference | −1.97 ± 0.66 ** | −1.22 ± 0.49 * | −1.45 ± 0.52 ** |
| Cases/n | Crude Or (95% CI) | Model 1 OR (95% CI) | Model 2 OR (95% CI) | p for Interaction | |
|---|---|---|---|---|---|
| SGA | 0.107 | ||||
| Low SIC, low FSI | 58/256 | 1 | 1 | 1 | |
| Low SIC, high FSI | 53/237 | 0.983 (0.644, 1.501) | 0.890 (0.544, 1.455) | 1.128 (0.653, 1.948) | |
| High SIC, low FSI | 89/266 | 1 | 1 | 1 | |
| High SIC, high FSI | 55/234 | 0.611 (0.412, 0.907) | 0.580 (0.360, 0.934) | 0.535 (0.322, 0.889) | |
| LGA | 0.095 | ||||
| Low SIC, normal lipids | 16/340 | 1 | 1 | 1 | |
| Low SIC, hyperlipidemia | 7/66 | 2.373 (0.936, 6.018) | 1.905 (0.681, 5.332) | 1.691 (0.596, 4.801) | |
| High SIC, normal lipids | 15/300 | 1 | 1 | 1 | |
| High SIC, hyperlipidemia | 2/73 | 0.578 (0.128, 2.601) | 0.464 (0.099, 2.182) | 0.424 (0.089, 2.029) | |
| LBW | 0.098 | ||||
| Low SIC, normal BP | 27/518 | 1 | 1 | 1 | |
| Low SIC, GH | 3/17 | 4.157 (1.122, 15.409) | 3.011 (0.383, 23.709) | 3.372 (0.413, 27.534) | |
| High SIC, normal BP | 34/525 | 1 | 1 | 1 | |
| High SIC, GH | 2/11 | 3.591 (0.733, 17.594) | 1.929 (0.084, 44.125) | 1.893 (0.080, 44.778) |
3.2. Sensitivity and Subgroup Analyses
4. Discussion
4.1. Current Findings and Implications
4.2. Maternal Iodine with Metabolic Components
4.3. Maternal Iodine, BMI, and the Risk of Postpartum Hemorrhage
4.4. Maternal Iodine, Glycemic Control, and Pregnancy Outcomes
4.5. Maternal Iodine, Lipids, and Gestational Duration
4.6. Maternal Iodine, the FSI, and the Risk of SGA
4.7. High Maternal SICs and GH and Lowered Birth Length
4.8. Study Strengths and Limitations
5. Conclusions
Supplementary Materials
Author Contributions
Funding
Institutional Review Board Statement
Informed Consent Statement
Data Availability Statement
Acknowledgments
Conflicts of Interest
References
- Li, S.; Ma, S.; Yao, X.; Liu, P. Effects of Metabolic Syndrome on Pregnancy Outcomes in Women Without Polycystic Ovary Syndrome. J. Endocr. Soc. 2024, 8, bvae143. [Google Scholar] [CrossRef] [PubMed]
- Rani, V.; Deep, G.; Singh, R.K.; Palle, K.; Yadav, U.C. Oxidative stress and metabolic disorders: Pathogenesis and therapeutic strategies. Life Sci. 2016, 148, 183–193. [Google Scholar] [CrossRef] [PubMed]
- Zhang, L.; Shang, F.; Liu, C.; Zhai, X. The correlation between iodine and metabolism: A review. Front. Nutr. 2024, 11, 1346452. [Google Scholar] [CrossRef]
- Lee, S.Y.; Pearce, E.N. Reproductive endocrinology: Iodine intake in pregnancy–even a little excess is too much. Nat. Rev. Endocrinol. 2015, 11, 260–261. [Google Scholar] [CrossRef]
- Pearce, E.N.; Lazarus, J.H.; Moreno-Reyes, R.; Zimmermann, M.B. Consequences of iodine deficiency and excess in pregnant women: An overview of current knowns and unknowns. Am. J. Clin. Nutr. 2016, 104 (Suppl. 3), 918s–923s. [Google Scholar] [CrossRef]
- Aceves, C.; Mendieta, I.; Anguiano, B.; Delgado-González, E. Molecular Iodine Has Extrathyroidal Effects as an Antioxidant, Differentiator, and Immunomodulator. Int. J. Mol. Sci. 2021, 22, 1228. [Google Scholar] [CrossRef]
- Sorrenti, S.; Baldini, E.; Pironi, D.; Lauro, A.; D’Orazi, V.; Tartaglia, F.; Tripodi, D.; Lori, E.; Gagliardi, F.; Praticò, M.; et al. Iodine: Its Role in Thyroid Hormone Biosynthesis and Beyond. Nutrients 2021, 13, 4469. [Google Scholar] [CrossRef]
- Liu, J.; Liu, L.; Jia, Q.; Zhang, X.; Jin, X.; Shen, H. Effects of Excessive Iodine Intake on Blood Glucose, Blood Pressure, and Blood Lipids in Adults. Biol. Trace Elem. Res. 2019, 192, 136–144. [Google Scholar] [CrossRef]
- Wu, Y.; Long, H.H.; Zhang, S.J.; Li, M.M.; Chen, C.G.; Wang, C.; Sheng, Z.Y.; Ye, Y.B.; Zuo, S.Y.; Pan, W.J.; et al. Reference Intervals of Serum Iodine Concentration in Chinese Pregnant Women. Biol. Trace Elem. Res. 2024, 202, 2457–2465. [Google Scholar] [CrossRef]
- Cui, T.; Wang, W.; Chen, W.; Pan, Z.; Gao, S.; Tan, L.; Pearce, E.N.; Zimmermann, M.B.; Shen, J.; Zhang, W. Serum Iodine Is Correlated with Iodine Intake and Thyroid Function in School-Age Children from a Sufficient-to-Excessive Iodine Intake Area. J. Nutr. 2019, 149, 1012–1018. [Google Scholar] [CrossRef]
- Aakre, I.; Solli, D.D.; Markhus, M.W.; Mæhre, H.K.; Dahl, L.; Henjum, S.; Alexander, J.; Korneliussen, P.A.; Madsen, L.; Kjellevold, M. Commercially available kelp and seaweed products—Valuable iodine source or risk of excess intake? Food Nutr. Res. 2021, 65, 7584. [Google Scholar] [CrossRef] [PubMed]
- Fisher, D.A.; Klein, A.H. Thyroid development and disorders of thyroid function in the newborn. N. Engl. J. Med. 1981, 304, 702–712. [Google Scholar] [CrossRef]
- Liu, Z.M.; Wu, Y.; Long, H.H.; Chen, C.G.; Wang, C.; Ye, Y.B.; Shen, Z.Y.; Ye, M.T.; Zhang, S.J.; Li, M.M.; et al. Associations of Maternal Serum Iodine Concentration with Obstetric Complications and Birth Outcomes-Longitudinal Analysis Based on the Huizhou Mother-Infant Cohort, South China. Nutrients 2023, 15, 2868. [Google Scholar] [CrossRef] [PubMed]
- Yu, S.; Yin, Y.; Cheng, Q.; Han, J.; Cheng, X.; Guo, Y.; Sun, D.; Xie, S.; Qiu, L. Validation of a simple inductively coupled plasma mass spectrometry method for detecting urine and serum iodine and evaluation of iodine status of pregnant women in Beijing. Scand. J. Clin. Lab. Investig. 2018, 78, 501–507. [Google Scholar] [CrossRef] [PubMed]
- American Diabetes, A. Diagnosis and classification of diabetes mellitus. Diabetes Care 2010, 33 (Suppl. 1), S62–S69. [Google Scholar] [CrossRef]
- Wu, H.; Yi, M.H.; Liu, B.G.; Xu, Y.; Wu, Q.; Liu, Y.H.; Lu, L.P. Association of gestational metabolic syndrome with the Chinese Healthy Eating Index in mid-pregnancy: A cross-sectional study. Nutr. Metab. 2024, 21, 8. [Google Scholar] [CrossRef]
- Abbassi-Ghanavati, M.; Greer, L.G.; Cunningham, F.G. Pregnancy and laboratory studies: A reference table for clinicians. Obstet. Gynecol. 2009, 114, 1326–1331. [Google Scholar] [CrossRef]
- Cho, Y.K.; Kim, M.; Kim, Y.J.; Jung, C.H.; Lee, W.J.; Park, J.Y. Predictive value of the Framingham steatosis index for cardiovascular risk: A nationwide population-based cohort study. Front. Cardiovasc. Med. 2023, 10, 1163052. [Google Scholar] [CrossRef]
- Chen, J.; Mao, X.; Deng, M.; Luo, G. Validation of nonalcoholic fatty liver disease (NAFLD) related steatosis indices in metabolic associated fatty liver disease (MAFLD) and comparison of the diagnostic accuracy between NAFLD and MAFLD. Eur. J. Gastroenterol. Hepatol. 2023, 35, 394–401. [Google Scholar] [CrossRef]
- Liu, H.; Chen, J.; Qin, Q.; Yan, S.; Wang, Y.; Li, J.; Ding, S. Association between TyG index trajectory and new-onset lean NAFLD: A longitudinal study. Front. Endocrinol. 2024, 15, 1321922. [Google Scholar] [CrossRef]
- Kong, B.H. Chinese Textbook of Obstetrics and Gynecology, 10th ed.; The People’s Health Press Co., Ltd.: Beijing, China, 2024. [Google Scholar]
- Zong, X.N.; Li, H.; Zhang, Y.Q.; Wu, H.H.; Zhao, G.L. Construction of China national newborn growth standards based on a large low-risk sample. Sci. Rep. 2021, 11, 16093. [Google Scholar] [CrossRef] [PubMed]
- Jin, M.; Zhang, Z.; Li, Y.; Teng, D.; Shi, X.; Ba, J.; Chen, B.; Du, J.; He, L.; Lai, X.; et al. U-Shaped Associations Between Urinary Iodine Concentration and the Prevalence of Metabolic Disorders: A Cross-Sectional Study. Thyroid 2020, 30, 1053–1065. [Google Scholar] [CrossRef] [PubMed]
- Villatoro-Santos, C.R.; Ramirez-Zea, M.; Villamor, E. Urinary sodium, iodine, and volume in relation to metabolic syndrome in Mesoamerican children and their parents. Nutr. Metab. Cardiovasc. Dis. 2022, 32, 1774–1783. [Google Scholar] [CrossRef] [PubMed]
- Mancini, F.R.; Rajaobelina, K.; Dow, C.; Habbal, T.; Affret, A.; Balkau, B.; Bonnet, F.; Boutron-Ruault, M.C.; Fagherazzi, G. High iodine dietary intake is associated with type 2 diabetes among women of the E3N-EPIC cohort study. Clin. Nutr. 2019, 38, 1651–1656. [Google Scholar] [CrossRef]
- Park, J.K.; Woo, H.W.; Kim, M.K.; Shin, J.; Lee, Y.H.; Shin, D.H.; Shin, M.H.; Choi, B.Y. Dietary iodine, seaweed consumption, and incidence risk of metabolic syndrome among postmenopausal women: A prospective analysis of the Korean Multi-Rural Communities Cohort Study (MRCohort). Eur. J. Nutr. 2021, 60, 135–146. [Google Scholar] [CrossRef]
- Zhao, J.; Su, Y.; Zhang, J.A.; Fang, M.; Liu, X.; Jia, X.; Li, X. Inverse Association Between Iodine Status and Prevalence of Metabolic Syndrome: A Cross-Sectional Population-Based Study in a Chinese Moderate Iodine Intake Area. Diabetes Metab. Syndr. Obes. 2021, 14, 3691–3701. [Google Scholar] [CrossRef]
- Shen, X.; Yang, L.; Liu, Y.Y.; Zhang, X.H.; Cai, P.; Huang, J.F.; Jiang, L. Associations between urinary iodine concentration and the prevalence of metabolic disorders: A cross-sectional study. Front. Endocrinol. 2023, 14, 1153462. [Google Scholar] [CrossRef]
- Lee, K.W.; Shin, D.; Song, W.O. Low Urinary Iodine Concentrations Associated with Dyslipidemia in US Adults. Nutrients 2016, 8, 171. [Google Scholar] [CrossRef]
- Xiao, Y.; Sun, H.; Li, C.; Li, Y.; Peng, S.; Fan, C.; Teng, W.; Shan, Z. Effect of Iodine Nutrition on Pregnancy Outcomes in an Iodine-Sufficient Area in China. Biol. Trace Elem. Res. 2018, 182, 231–237. [Google Scholar] [CrossRef]
- Ezemaduka Okoli, C.B.; Woldu, H.G.; Peterson, C.A. Low Urinary Iodine Concentration Is Associated with Increased Risk for Elevated Plasma Glucose in Females: An Analysis of NHANES 2011–12. Nutrients 2021, 13, 4523. [Google Scholar] [CrossRef]
- Wang, X.; Xian, T.; Zhang, L.; Jia, X.; Man, F.; Liu, L.; Zhang, J.; Zhang, X.; Yu, D.; Sun, L.; et al. Associations between urinary iodine concentration, lipid profile and other cardiometabolic risk factors in adolescents: A cross-sectional, population-based analysis. Br. J. Nutr. 2019, 121, 1039–1048. [Google Scholar] [CrossRef] [PubMed]
- Wang, C.; Shang, X.; Fu, Y.; Guo, P.; Wang, P.; Yan, S. Investigating the impact of elevated urinary trace elements on non-alcoholic fatty liver disease using vibration-controlled transient elastography. Front. Endocrinol. 2024, 15, 1310044. [Google Scholar] [CrossRef] [PubMed]
- Mehran, L.; Amouzegar, A.; Azizi, F. Thyroid disease and the metabolic syndrome. Curr. Opin. Endocrinol. Diabetes Obes. 2019, 26, 256–265. [Google Scholar] [CrossRef] [PubMed]
- Biete, M.; Vasudevan, S. Gestational diabetes mellitus: Impacts on fetal neurodevelopment, gut dysbiosis, and the promise of precision medicine. Front. Mol. Biosci. 2024, 11, 1420664. [Google Scholar] [CrossRef]
- Durmaz, A.; Komurcu, N. Relationship Between Maternal Characteristics and Postpartum Hemorrhage: A Meta-Analysis Study. J. Nurs. Res. 2018, 26, 362–372. [Google Scholar] [CrossRef]
- Romero, R.; Casanova, B.; Pulido, N.; Suarez, A.I.; Rodriguez, E.; Rovira, A. Stimulation of glucose transport by thyroid hormone in 3T3-L1 adipocytes: Increased abundance of GLUT1 and GLUT4 glucose transporter proteins. J. Endocrinol. 2000, 164, 187–195. [Google Scholar] [CrossRef]
- Ellerbrock, J.; Hubers, E.; Ghossein-Doha, C.; Schiffer, V.; Alers, R.J.; Jorissen, L.; Neer, J.V.; Zelis, M.; Janssen, E.; Landewé-Cleuren, S.; et al. Second-Trimester Constituents of the Metabolic Syndrome and Pregnancy Outcome: An Observational Cohort Study. Nutrients 2022, 14, 2933. [Google Scholar] [CrossRef]
- Herter-Aeberli, I.; Cherkaoui, M.; El Ansari, N.; Rohner, R.; Stinca, S.; Chabaa, L.; von Eckardstein, A.; Aboussad, A.; Zimmermann, M.B. Iodine Supplementation Decreases Hypercholesterolemia in Iodine-Deficient, Overweight Women: A Randomized Controlled Trial. J. Nutr. 2015, 145, 2067–2075. [Google Scholar] [CrossRef]
- Liu, M.; Li, S.M.; Li, X.W.; Wang, P.H.; Liang, P.; Li, S.H. Exploratory study on the association between high iodine intake and lipid. Zhonghua Liu Xing Bing Xue Za Zhi 2009, 30, 699–701. [Google Scholar]
- Lv, Y.; Xu, L.; He, Z.; Liu, X.; Guo, Y. The association between pregnancy levels of blood lipids and the risk of preterm birth. Sci. Rep. 2024, 14, 10800. [Google Scholar] [CrossRef]
- Liu, H.; Peng, D. Update on dyslipidemia in hypothyroidism: The mechanism of dyslipidemia in hypothyroidism. Endocr. Connect. 2022, 11, e210002. [Google Scholar] [CrossRef] [PubMed]
- Zhao, L.N.; Xu, J.; Peng, X.L.; Tian, L.Y.; Hao, L.P.; Yang, X.F.; Ying, C.J.; Sun, X.F. Dose and time-dependent hypercholesterolemic effects of iodine excess via TRbeta1-mediated down regulation of hepatic LDLr gene expression. Eur. J. Nutr. 2010, 49, 257–265. [Google Scholar] [CrossRef] [PubMed]
- Chen, B.; Ji, X.; Zhang, L.; Hou, Z.; Li, C.; Tong, Y. Fish oil supplementation improves pregnancy outcomes and size of the newborn: A meta-analysis of 21 randomized controlled trials. J. Matern. Fetal Neonatal Med. 2016, 29, 2017–2027. [Google Scholar] [CrossRef] [PubMed]
- Liang, N.; Zhu, H.; Cai, X.; Le, Z.; Wang, H.; He, D.; Xiao, R.; Yu, H. The high maternal TG level at early trimester was associated with the increased risk of LGA newborn in non-obesity pregnant women. Lipids Health Dis. 2018, 17, 294. [Google Scholar] [CrossRef]
- Liu, Z.M.; Long, H.H.; Li, D.; Fang, A.P.; Chen, C.G.; Wang, C.; Li, M.M.; Wu, Y.; Zhang, S.J.; Pan, W.J. Maternal Serum Iodine Concentrations in Early Pregnancy Exhibited Well Diagnostic Ability for Thyroid Dysfunction, Inverse Associations with Gestational Weight Gain, and Birth Size: Longitudinal Analyses Based on Huizhou Mother-Infant Cohort. Biol. Trace Elem. Res. 2024; online ahead of print. [Google Scholar] [CrossRef]
- Hubel, E.; Fishman, S.; Holopainen, M.; Käkelä, R.; Shaffer, O.; Houri, I.; Zvibel, I.; Shibolet, O. Repetitive amiodarone administration causes liver damage via adipose tissue ER stress-dependent lipolysis, leading to hepatotoxic free fatty acid accumulation. Am. J. Physiol. Gastrointest. Liver Physiol. 2021, 321, G298–G307. [Google Scholar] [CrossRef]
- Guo, Y.; Hu, C.; Xia, B.; Zhou, X.; Luo, S.; Gan, R.; Duan, P.; Tan, Y. Iodine excess induces hepatic, renal and pancreatic injury in female mice as determined by attenuated total reflection Fourier-transform infrared spectrometry. J. Appl. Toxicol. 2022, 42, 600–616. [Google Scholar] [CrossRef]
- Xia, Y.; Qu, W.; Zhao, L.N.; Han, H.; Yang, X.F.; Sun, X.F.; Hao, L.P.; Xu, J. Iodine excess induces hepatic steatosis through disturbance of thyroid hormone metabolism involving oxidative stress in BALB/c mice. Biol. Trace Elem. Res. 2013, 154, 103–110. [Google Scholar] [CrossRef]
- Ress, C.; Kaser, S. Mechanisms of intrahepatic triglyceride accumulation. World J. Gastroenterol. 2016, 22, 1664–1673. [Google Scholar] [CrossRef]
- Panaitescu, A.M.; Syngelaki, A.; Prodan, N.; Akolekar, R.; Nicolaides, K.H. Chronic hypertension and adverse pregnancy outcome: A cohort study. Ultrasound Obstet. Gynecol. 2017, 50, 228–235. [Google Scholar] [CrossRef]

Disclaimer/Publisher’s Note: The statements, opinions and data contained in all publications are solely those of the individual author(s) and contributor(s) and not of MDPI and/or the editor(s). MDPI and/or the editor(s) disclaim responsibility for any injury to people or property resulting from any ideas, methods, instructions or products referred to in the content. |
© 2025 by the authors. Licensee MDPI, Basel, Switzerland. This article is an open access article distributed under the terms and conditions of the Creative Commons Attribution (CC BY) license (https://creativecommons.org/licenses/by/4.0/).
Share and Cite
Liu, Z.; Chen, C.; Wang, C.; Wang, Y.; Li, M.; Pan, W. Extra-Thyroidal Impacts of Serum Iodine Concentrations During Early Pregnancy on Metabolic Profiles and Pregnancy Outcomes: Prospective Study Based on Huizhou Mother–Infant Cohort. Nutrients 2025, 17, 1626. https://doi.org/10.3390/nu17101626
Liu Z, Chen C, Wang C, Wang Y, Li M, Pan W. Extra-Thyroidal Impacts of Serum Iodine Concentrations During Early Pregnancy on Metabolic Profiles and Pregnancy Outcomes: Prospective Study Based on Huizhou Mother–Infant Cohort. Nutrients. 2025; 17(10):1626. https://doi.org/10.3390/nu17101626
Chicago/Turabian StyleLiu, Zhaomin, Chaogang Chen, Cheng Wang, Yaqian Wang, Minmin Li, and Wenjing Pan. 2025. "Extra-Thyroidal Impacts of Serum Iodine Concentrations During Early Pregnancy on Metabolic Profiles and Pregnancy Outcomes: Prospective Study Based on Huizhou Mother–Infant Cohort" Nutrients 17, no. 10: 1626. https://doi.org/10.3390/nu17101626
APA StyleLiu, Z., Chen, C., Wang, C., Wang, Y., Li, M., & Pan, W. (2025). Extra-Thyroidal Impacts of Serum Iodine Concentrations During Early Pregnancy on Metabolic Profiles and Pregnancy Outcomes: Prospective Study Based on Huizhou Mother–Infant Cohort. Nutrients, 17(10), 1626. https://doi.org/10.3390/nu17101626