
Unlocking Cognitive Potential: Association of Sarcopenia and Mediterranean Diet on Cognitive Function in Community-Dwelling Elderly of the Dalmatian Region
 ,
,  and
and
Abstract
1. Introduction
2. Materials and Methods
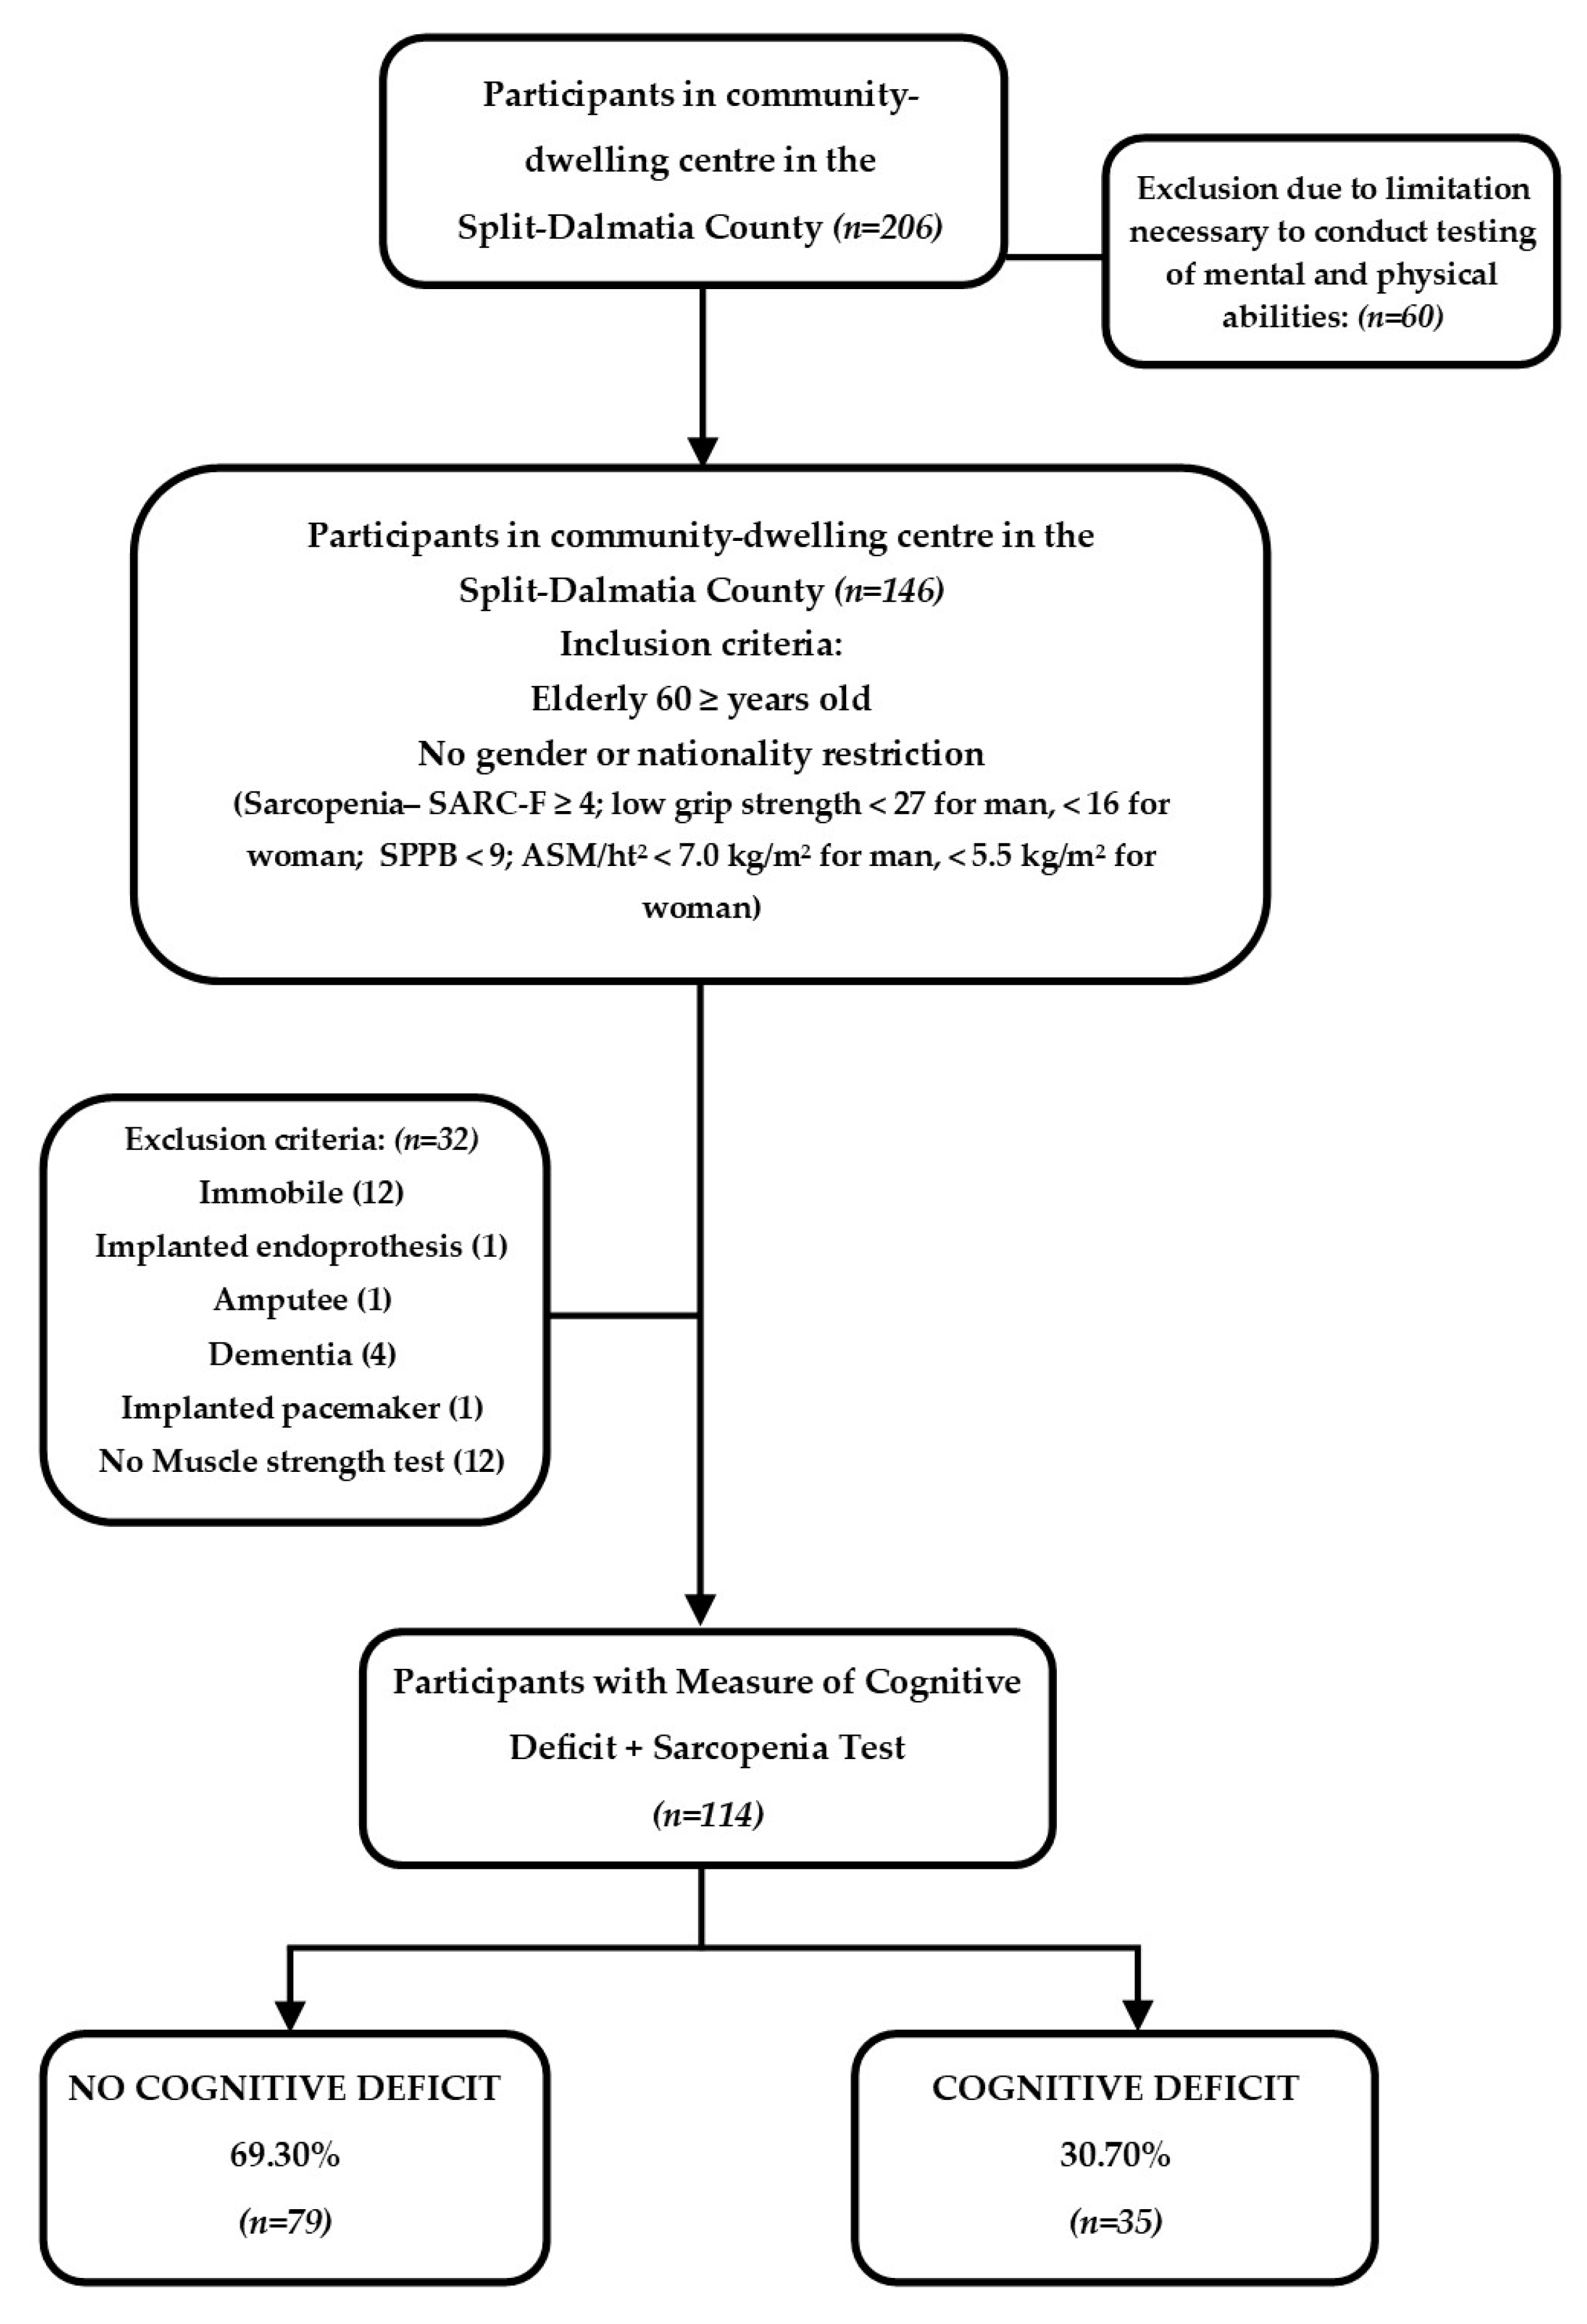
2.1. Study Population and Eligibility Criteria
2.2. The Assessment of Sarcopenia
2.3. Assessment of the Cognitive Deficit
2.4. Assessment of Nutritional Status
2.5. Assessment of Mediterranean Diet (MeDi)
2.6. Statistical Analysis
3. Results
3.1. Characteristics of the Study Population
Study Population by Cognitive Decline Due to MMSE
4. Discussion
5. Conclusions
Supplementary Materials
Author Contributions
Funding
Institutional Review Board Statement
Informed Consent Statement
Data Availability Statement
Conflicts of Interest
References
- Krznarić, ž.; Vranešić Bender, D.; Ljubas Kelečić, D.; Reiner, Ž.; Tomek Roksandić, S.; Kekez, D.; Pavić, T. Hrvatske smjernice za prehranu osoba starije dobi, dio II—Klinička prehrana. Liječ. Vjesn. 2011, 133, 299–307. [Google Scholar] [PubMed]
- Goodpaster, B.H.; Park, S.W.; Harris, T.B.; Kritchevsky, S.B.; Nevitt, M.; Schwartz, A.V.; Simonsick, E.M.; Tylavsky, F.A.; Visser, M.; Newman, A.B.; et al. The Loss of Skeletal Muscle Strength, Mass, and Quality in Older Adults: The Health, Aging and Body Composition Study. J. Gerontol. A Biol. Sci. Med. Sci. 2006, 61, 1059–1064. [Google Scholar] [CrossRef] [PubMed]
- Bertschi, D.; Kiss, C.M.; Beerli, N.; Kressig, R.W. Sarcopenia in hospitalized geriatric patients: Insights into prevalence and associated parameters using new EWGSOP2 guidelines. Eur. J. Clin. Nutr. 2020, 75, 653–660. [Google Scholar] [CrossRef] [PubMed]
- Peng, T.-C.; Chen, W.-L.; Wu, L.-W.; Chang, Y.-W.; Kao, T.-W. Sarcopenia and cognitive impairment: A systematic review and meta-analysis. Clin. Nutr. 2019, 39, 2695–2701. [Google Scholar] [CrossRef] [PubMed]
- Rasmussen, P.; Brassard, P.; Adser, H.; Pedersen, M.V.; Leick, L.; Hart, E.; Secher, N.H.; Pedersen, B.K.; Pilegaard, H. Evidence for a release of brain-derived neurotrophic factor from the brain during exercise. Exp. Physiol. 2009, 94, 1062–1069. [Google Scholar] [CrossRef] [PubMed]
- Shikany, J.M.; Safford, M.M.; Soroka, O.; Brown, T.M.; Newby, P.K.; Durant, R.W.; Judd, S.E. Mediterranean Diet Score, Dietary Patterns, and Risk of Sudden Cardiac Death in the REGARDS Study. J. Am. Heart Assoc. 2021, 10, e019158. [Google Scholar] [CrossRef] [PubMed]
- Tsivgoulis, G.; Judd, S.; Letter, A.J.; Alexandrov, A.V.; Howard, G.; Nahab, F.; Unverzagt, F.W.; Moy, C.; Howard, V.J.; Kissela, B.; et al. Adherence to a Mediterranean diet and risk of incident cognitive impairment. Neurology 2013, 80, 1684–1692. [Google Scholar] [CrossRef] [PubMed]
- Reynolds, E. Vitamin B12, folic acid, and the nervous system. Lancet Neurol. 2006, 5, 949–960. [Google Scholar] [CrossRef] [PubMed]
- Solfrizzi, V.; Colacicco, A.M.; D’introno, A.; Capurso, C.; Torres, F.; Rizzo, C.; Capurso, A.; Panza, F. Dietary intake of unsaturated fatty acids and age-related cognitive decline: A 8.5-year follow-up of the Italian Longitudinal Study on Aging. Neurobiol. Aging 2006, 27, 1694–1704. [Google Scholar] [CrossRef]
- Martinez-Lacoba, R.; Pardo-Garcia, I.; Amo-Saus, E.; Escribano-Sotos, F. Mediterranean diet and health outcomes: A systematic meta-review. Eur. J. Public Health 2018, 28, 955–961. [Google Scholar] [CrossRef]
- Nissensohn, M.; Román-Viñas, B.; Sánchez-Villegas, A.; Piscopo, S.; Serra-Majem, L. The Effect of the Mediterranean Diet on Hypertension: A Systematic Review and Meta-Analysis. J. Nutr. Educ. Behav. 2016, 48, 42–53.e1. [Google Scholar] [CrossRef] [PubMed]
- Estruch, R.; Ros, E.; Salas-Salvadó, J.; Covas, M.-I.; Corella, D.; Arós, F.; Gómez-Gracia, E.; Ruiz-Gutiérrez, V.; Fiol, M.; Lapetra, J.; et al. Primary Prevention of Cardiovascular Disease with a Mediterranean Diet Supplemented with Extra-Virgin Olive Oil or Nuts. N. Engl. J. Med. 2018, 378, e34. [Google Scholar] [CrossRef]
- Bach-Faig, A.; Berry, E.M.; Lairon, D.; Reguant, J.; Trichopoulou, A.; Dernini, S.; Medina, F.X.; Battino, M.; Belahsen, R.; Miranda, G.; et al. Mediterranean diet pyramid today. Science and cultural updates. Public Health Nutr. 2011, 14, 2274–2284. [Google Scholar] [CrossRef] [PubMed]
- Folstein, M.F.; Folstein, S.E.; McHugh, P.R. “Mini-Mental State”. A Practical Method for Grading the Cognitive State of Patients for the Clinician. J. Psychiatr. Res. 1975, 12, 189–198. [Google Scholar] [CrossRef]
- Corrigan, J.D.; Hinkeldey, N.S. Relationships between Parts A and B of the Trail Making Test. J. Clin. Psychol. 1987, 43, 402–409. [Google Scholar] [CrossRef] [PubMed]
- Gaudino, E.A.; Geisler, M.W.; Squires, N.K. Construct validity in the trail making test: What makes part B harder? J. Clin. Exp. Neuropsychol. 1995, 17, 529–535. [Google Scholar] [CrossRef]
- Lezak, M.D.; Howieson, D.B.; Loring, D.W. Neuropsychological Assessment, 4th ed.; Oxford University Press: New York, NY, USA, 2004. [Google Scholar]
- Reitan, R.M. Validity of the Trail Making Test as an Indicator of Organic Brain Damage. Percept. Mot. Ski. 1958, 8, 271–276. [Google Scholar] [CrossRef]
- Smith, A. How to Calculate Standard Scores for the Symbol Digital Modalities Test; Western Psychological Services: Los Angeles, CA, USA, 1973. [Google Scholar]
- Jang, I.Y.; Lee, E.; Lee, H.; Park, H.; Kim, S.; Kim, K.-I.; Jung, H.W.; Kim, D.H. Characteristics of sarcopenia by European consensuses and a phenotype score. J. Cachexia Sarcopenia Muscle 2019, 11, 497–504. [Google Scholar] [CrossRef]
- Chen, L.-K.; Woo, J.; Assantachai, P.; Auyeung, T.-W.; Chou, M.-Y.; Iijima, K.; Jang, H.C.; Kang, L.; Kim, M.; Kim, S.; et al. Asian Working Group for Sarcopenia: 2019 Consensus Update on Sarcopenia Diagnosis and Treatment. J. Am. Med. Dir. Assoc. 2020, 21, 300–307.e302. [Google Scholar] [CrossRef]
- Cruz-Jentoft, A.J.; Bahat, G.; Bauer, J.; Boirie, Y.; Bruyère, O.; Cederholm, T.; Cooper, C.; Landi, F.; Rolland, Y.; Sayer, A.A.; et al. Sarcopenia: Revised European consensus on definition and diagnosis. J. Am. Geriatr. Soc. 2019, 48, 601. [Google Scholar] [CrossRef]
- Malmstrom, T.K.; Morley, J.E. SARC-F: A Simple Questionnaire to Rapidly Diagnose Sarcopenia. J. Am. Med. Dir. Assoc. 2013, 14, 531–532. [Google Scholar] [CrossRef] [PubMed]
- Taekema, D.G.; Gussekloo, J.; Maier, A.B.; Westendorp, R.G.J.; De Craen, A.J.M. Handgrip strength as a predictor of functional, psychological and social health. A prospective population-based study among the oldest old. J. Am. Geriatr. Soc. 2010, 39, 331–337. [Google Scholar] [CrossRef] [PubMed]
- Compton, D.M.; Bachman, L.D.; Logan, J.A. Aging and Intellectual Ability in Young, Middle-Aged, and Older Educated Adults: Preliminary Results from a Sample of College Faculty. Psychol. Rep. 1997, 81, 79–90. [Google Scholar] [CrossRef] [PubMed]
- Salthouse, T.A. The processing-speed theory of adult age differences in cognition. Psychol. Rev. 1996, 103, 403–428. [Google Scholar] [CrossRef] [PubMed]
- Milne, A.C.; Potter, J.; Vivanti, A.; Avenell, A. Protein and Energy Supplementation in Elderly People at Risk from Malnutrition (Review); John Wiley & Sons, Ltd.: Hoboken, NJ, USA, 2009. [Google Scholar]
- Gariballa, S.; Forster, S.; Walters, S.; Powers, H. A Randomized, Double-Blind, Placebo-Controlled Trial of Nutritional Supplementation during Acute Illness. Am. J. Med. 2006, 119, 693–699. [Google Scholar] [CrossRef] [PubMed]
- Body Mass Index (BMI). Available online: https://www.who.int/data/gho/data/themes/topics/topic-details/GHO/body-mass-index (accessed on 15 February 2024).
- Molarius, A.; Seidell, J.; Sans, S.; Tuomilehto, J.; Kuulasmaa, K. Waist and hip circumferences, and waist-hip ratio in 19 populations of the WHO MONICA Project. Int. J. Obes. 1999, 23, 116–125. [Google Scholar] [CrossRef] [PubMed]
- Monteagudo, C.; Mariscal-Arcas, M.; Rivas, A.; Lorenzo-Tovar, M.L.; Tur, J.A.; Olea-Serrano, F. Proposal of a Mediterranean Diet Serving Score. PLoS ONE 2015, 10, e0128594. [Google Scholar] [CrossRef] [PubMed]
- Tomita, Y.; Tanaka, S.; Takahashi, S.; Takeuchi, N. Detecting cognitive decline in community-dwelling older adults using simple cognitive and motor performance tests. Geriatr. Gerontol. Int. 2020, 20, 212–217. [Google Scholar] [CrossRef] [PubMed]
- Chen, J.-H.; Waite, L.J.; Lauderdale, D.S. Marriage, Relationship Quality, and Sleep among U.S. Older Adults. J. Health Soc. Behav. 2015, 56, 356–377. [Google Scholar] [CrossRef] [PubMed]
- Barragán-García, M.; Ramírez-Aldana, R.; López-Ortega, M.; Sánchez-García, S.; García-Peña, C. Widowhood Status and Cognitive Function in Community-Dwelling Older Adults from the Mexican Health and Aging Study (MHAS). J. Popul. Ageing 2021, 15, 605–622. [Google Scholar] [CrossRef]
- Muniz-Terrera, G.; Matthews, F.; Dening, T.; Huppert, F.A.; Brayne, C.; CC75C Group. Education and trajectories of cognitive decline over 9 years in very old people: Methods and risk analysis. J. Am. Geriatr. Soc. 2008, 38, 277–282. [Google Scholar] [CrossRef]
- Piccinin, A.M.; Muniz-Terrera, G.; Clouston, S.; Reynolds, C.A.; Thorvaldsson, V.; Deary, I.J.; Deeg, D.J.; Johansson, B.; Mackinnon, A.; Spiro, A.; et al. Coordinated Analysis of Age, Sex, and Education Effects on Change in MMSE Scores. J. Gerontol. Ser. B 2012, 68, 374–390. [Google Scholar] [CrossRef] [PubMed]
- Sink, K.M.; Espeland, M.A.; Castro, C.M.; Church, T.; Cohen, R.; Dodson, J.A.; Guralnik, J.; Hendrie, H.C.; Jennings, J.; Katula, J.; et al. Effect of a 24-Month Physical Activity Intervention vs Health Education on Cognitive Outcomes in Sedentary Older Adults. JAMA 2015, 314, 781–790. [Google Scholar] [CrossRef] [PubMed]
- Burdette, J.H.; Laurienti, P.J.; Espeland, M.A.; Morgan, A.; Telesford, Q.; Vechlekar, C.D.; Hayasaka, S.; Jennings, J.M.; Katula, J.A.; Kraft, R.A.; et al. Using network science to evaluate exercise-associated brain changes in older adults. Front. Aging Neurosci. 2010, 2, 23. [Google Scholar] [CrossRef]
- Erickson, K.I.; Leckie, R.L.; Weinstein, A.M. Physical activity, fitness, and gray matter volume. Neurobiol. Aging 2014, 35, S20–S28. [Google Scholar] [CrossRef] [PubMed]
- Gligoroska, J.P.; Manchevska, S. The effect of physical activity on cognition-physiological mechanism. Mater. Soc. Med. 2012, 24, 198–202. [Google Scholar] [CrossRef]
- Song, D.; Yu, D.S. Effects of a moderate-intensity aerobic exercise programme on the cognitive function and quality of life of community-dwelling elderly people with mild cognitive impairment: A randomised controlled trial. Int. J. Nurs. Stud. 2019, 93, 97–105. [Google Scholar] [CrossRef] [PubMed]
- Campos, M.W.; Serebrisky, D.; Castaldelli-Maia, J.M. Smoking and Cognition. Curr. Drug Abus. Rev. 2016, 9, 76–79. [Google Scholar] [CrossRef] [PubMed]
- Momtaz, Y.A.; Hamid, T.A.; Haron, S.A.; Bagat, M.F.; Mohammadi, F. Prevalence of hypotension and its association with cognitive function among older adults. Aging Ment. Health 2017, 22, 447–452. [Google Scholar] [CrossRef]
- Benetos, A.; Petrovic, M.; Strandberg, T. Hypertension Management in Older and Frail Older Patients. Circ. Res. 2019, 124, 1045–1060. [Google Scholar] [CrossRef]
- Shah, R.C.; Janos, A.L.; Kline, J.E.; Yu, L.; Leurgans, S.E.; Wilson, R.S.; Wei, P.; Bennett, D.A.; Heilman, K.M.; Tsao, J.W. Cognitive Decline in Older Persons Initiating Anticholinergic Medications. PLoS ONE 2013, 8, e64111. [Google Scholar] [CrossRef] [PubMed]
- Wu, Y.; Wang, C.; Hung, C.; Lin, M.; Wang, P.; Chen, L. Association between using medications with anticholinergic properties and short-term cognitive decline among older men: A retrospective cohort study in Taiwan. Geriatr. Gerontol. Int. 2017, 17, 57–64. [Google Scholar] [CrossRef] [PubMed]
- Ding, D.; Zhou, F.; Cao, Y.; Liang, X.; Wu, W.; Xiao, Z.; Zhao, Q.; Deng, W. Cholesterol profiles and incident cognitive decline among older adults: The Shanghai Aging Study. J. Am. Geriatr. Soc. 2020, 50, 472–479. [Google Scholar] [CrossRef] [PubMed]
- Forti, P.; Pisacane, N.; Rietti, E.; Lucicesare, A.; Olivelli, V.; Mariani, E.; Mecocci, P.; Ravaglia, G. Metabolic Syndrome and Risk of Dementia in Older Adults. J. Am. Geriatr. Soc. 2010, 58, 487–492. [Google Scholar] [CrossRef] [PubMed]
- Guo, Y.; Li, P.; Ma, X.; Huang, X.; Liu, Z.; Ren, X.; Yang, Y.; Halm-Lutterodt, N.V.; Yuan, L. Association of Circulating Cholesterol Level with Cognitive Function and Mild Cognitive Impairment in the Elderly: A Community-based Population Study. Curr. Alzheimer Res. 2020, 17, 556–565. [Google Scholar] [CrossRef] [PubMed]
- Momtaz, Y.A.; Haron, S.A.; Hamid, T.A.; Ibrahim, R.; Tanjani, P.T. Body Mass Index (BMI) and Cognitive Functions in Later Life. Curr. Alzheimer Res. 2018, 15, 195–200. [Google Scholar] [CrossRef] [PubMed]
- Dahl, A.; Hassing, L.B.; Fransson, E.; Berg, S.; Gatz, M.; Reynolds, C.A.; Pedersen, N.L. Being Overweight in Midlife Is Associated with Lower Cognitive Ability and Steeper Cognitive Decline in Late Life. J. Gerontol. Ser. A 2009, 65A, 57–62. [Google Scholar] [CrossRef] [PubMed]
- Kerwin, D.R.; Zhang, Y.; Kotchen, J.M.; Espeland, M.A.; Van Horn, L.; McTigue, K.M.; Robinson, J.G.; Powell, L.; Kooperberg, C.; Hoffmann, R.; et al. The Cross-Sectional Relationship Between Body Mass Index, Waist-Hip Ratio, and Cognitive Performance in Postmenopausal Women Enrolled in the Women’s Health Initiative. J. Am. Geriatr. Soc. 2010, 58, 1427–1432. [Google Scholar] [CrossRef] [PubMed]
- Noh, H.-M.; Oh, S.; Song, H.J.; Lee, E.Y.; Jeong, J.-Y.; Ryu, O.-H.; Hong, K.-S.; Kim, D.-H. Relationships between cognitive function and body composition among community-dwelling older adults: A cross-sectional study. BMC Geriatr. 2017, 17, 259. [Google Scholar] [CrossRef]
- Uchida, K.; Sugimoto, T.; Tange, C.; Nishita, Y.; Shimokata, H.; Saji, N.; Kuroda, Y.; Matsumoto, N.; Kishino, Y.; Ono, R.; et al. Association between Reduction of Muscle Mass and Faster Declines in Global Cognition among Older People: A 4-Year Prospective Cohort Study. J. Nutr. Health Aging 2023, 27, 932–939. [Google Scholar] [CrossRef]
- Bilski, J.; Pierzchalski, P.; Szczepanik, M.; Bonior, J.; Zoladz, J.A. Multifactorial Mechanism of Sarcopenia and Sarcopenic Obesity. Role of Physical Exercise, Microbiota and Myokines. Cells 2022, 11, 160. [Google Scholar] [CrossRef]
- Cao, X.; Yang, B.; Zhou, J. Waist-to-calf circumstance ratio and cognitive function among Chinese older adults: Mediating roles of physical performance and social activity. Front. Aging Neurosci. 2023, 15, 1166341. [Google Scholar] [CrossRef]
- Spiteri, K.; Broom, D.; Bekhet, A.H.; de Caro, J.X.; Laventure, B.; Grafton, K. Barriers and Motivators of Physical Activity Participation in Middle-Aged and Older Adults—A Systematic Review. J. Aging Phys. Act. 2019, 27, 929–944. [Google Scholar] [CrossRef]
- Boquete-Pumar, C.; Álvarez-Salvago, F.; Martínez-Amat, A.; Molina-García, C.; De Diego-Moreno, M.; Jiménez-García, J.D. Influence of Nutritional Status and Physical Fitness on Cognitive Domains among Older Adults: A Cross-Sectional Study. Healthcare 2023, 11, 2963. [Google Scholar] [CrossRef]
- Confortin, S.C.; Barbosa, A.R. Factors Associated with Muscle Strength among Rural Community-Dwelling Older Women in Southern Brazil. J. Geriatr. Phys. Ther. 2015, 38, 162–168. [Google Scholar] [CrossRef]
- Cui, M.; Zhang, S.; Liu, Y.; Gang, X.; Wang, G. Grip Strength and the Risk of Cognitive Decline and Dementia: A Systematic Review and Meta-Analysis of Longitudinal Cohort Studies. Front. Aging Neurosci. 2021, 13, 625551. [Google Scholar] [CrossRef]
- Naharci, M.I.; Katipoglu, B. Relationship between blood pressure index and cognition in older adults. Clin. Exp. Hypertens. 2020, 43, 85–90. [Google Scholar] [CrossRef]
- Guo, Z.; Fratiglioni, L.; Winblad, B.; Viitanen, M. Blood Pressure and Performance on the Mini-Mental State Examination in the Very Old: Cross-sectional and Longitudinal Data from the Kungsholmen Project. Am. J. Epidemiol. 1997, 145, 1106–1113. [Google Scholar] [CrossRef]
- Starr, J.; Deary, I.; Inch, S.; Cross, S.; MacLennan, W. Blood pressure and cognitive decline in healthy old people. J. Hum. Hypertens. 1997, 11, 777–781. [Google Scholar] [CrossRef]
- Liu, X.; Xia, X.; Hu, F.; Hou, L.; Jia, S.; Liu, Y.; Deng, L.; Zhang, Y.; Zhao, W.; Zhang, G.; et al. Nutrition status mediates the association between cognitive decline and sarcopenia. Aging 2021, 13, 8599–8610. [Google Scholar] [CrossRef]
- Suzuki, H.; Sakuma, N.; Kobayashi, M.; Ogawa, S.; Inagaki, H.; Edahiro, A.; Ura, C.; Sugiyama, M.; Miyamae, F.; Watanabe, Y.; et al. Normative Data of the Trail Making Test Among Urban Community-Dwelling Older Adults in Japan. Front. Aging Neurosci. 2022, 14, 832158. [Google Scholar] [CrossRef]
- Taylor, M.K.; Mahnken, J.D.; Sullivan, D.K. NHANES 2011–2014 Reveals Cognition of US Older Adults may Benefit from Better Adaptation to the Mediterranean Diet. Nutrients 2020, 12, 1929. [Google Scholar] [CrossRef]
- Wang, Y.; Dong, C.; Han, Y.; Gu, Z.; Sun, C. Immunosenescence, aging and successful aging. Front. Immunol. 2022, 13, 942796. [Google Scholar] [CrossRef]
- Dinu, M.; Pagliai, G.; Casini, A.; Sofi, F. Mediterranean diet and multiple health outcomes: An umbrella review of meta-analyses of observational studies and randomised trials. Eur. J. Clin. Nutr. 2018, 72, 30–43. [Google Scholar] [CrossRef]


| No (%) Population | p * | |||
|---|---|---|---|---|
| MMSE ≥ 24 (n = 79) | MMSE < 24 (n = 35) | Total (n = 114) | ||
| Sex, n (%) | 0.89 * | |||
| Female | 60 (75.9) | 27 (77.1) | 87 (76.3) | |
| Male | 19 (24.1) | 8 (22.9) | 27 (23.7) | |
| Age, years, median (IQR) | 79 (72–85) | 84 (79–88) | 81 (74–86) | 0.01 *** |
| Institution, n (%) | ||||
| Stationary | 27 (38.6) | 18 (52.9) | 45 (43.3) | 0.17 |
| Residential part | 43 (61.4) | 16 (47.1) | 59 (56.7) | |
| Age of entering the institution, median (IQR) | 72 (66–81) | 80 (73–85.3) | 76 (68.5–84) | <0.001 *** |
| Duration, median (IQR) | 4 (0–11) | 3 (0–5.3) | 4 (0–8) | |
| Marriage status, n (%) | ||||
| Not married | 17 (21.5) | 4 (11.4) | 21 (18.4) | 0.02 * |
| Married | 17 (21.5) | 1 (2.9) | 18 (15.8) | |
| Divorced | 7 (8.9) | 4 (11.4) | 11 (9.6) | |
| Widowers | 38 (48.1) | 26 (74.3) | 64 (56.1) | |
| Education level, n (%) | ||||
| Less than high school | 19 (24.4) | 21 (60) | 40 (35.4) | 0.001 * |
| High school graduate | 42 (53.8) | 10 (28.6) | 52 (46) | |
| College graduate | 17 (21.8) | 4 (11.4) | 21 (18.6) | |
| Previous job activity, n (%) | ||||
| Sedentary life | 25 (32.1) | 4 (11.4) | 29 (25.7) | 0.03 * |
| Less physical activity | 33 (42.3) | 15 (42.9) | 48 (42.5) | |
| Heavier physical activity | 20 (25.6) | 16 (45.7) | 36 (31.9) | |
| Smoker (previous, current), n (%) | 28 (35.4) | 6 (17.1) | 34 (29.8) | 0.05 * |
| Smoking (n cigarettes/year), median (IQR) | 111,690 (66,619.8–191,625) | 324,120 (158,775–438,000) | 131,400 (83,044.8–212,430) | 0.01 *** |
| Blood pressure variables | ||||
| Arterial hypertension, n (%) | 55 (69.6) | 23 (65.7) | 78 (68.4) | 0.67 * |
| SBP, mmHg, median (IQR) | 139 (122–154) | 121 (110–133) | 130.5 (116–151.3) | <0.001 *** |
| DBP, mmHg, median (IQR) | 80 (74–89) | 72 (66–78) | 77 (71–86) | <0.001 *** |
| Medications (pc), median (IQR) | 4 (3–8) | 6 (5–8) | 5 (3–8) | 0.02 *** |
| Laboratory parameter, median (IQR) | ||||
| Total cholesterol (mmol/L) | 4.8 (3.8–5.5) | 5.4 (5–5.7) | 5 (4.4–5.5) | 0.05 *** |
| Triglycerides (mmol/L) | 1.2 (1–1.5) | 1.7 (1.3–3.2) | 1.2 (1–1.7) | 0.04 *** |
| Median (IQR) | p * | |||
|---|---|---|---|---|
| MMSE ≥ 24 (n = 79) | MMSE < 24 (n = 35) | Total (n = 114) | ||
| Anthropometric Parameters | ||||
| Weight (kg), median (IQR) | 71.45 (62.28–86.63) | 69.2 (61.7–85.1) | 71.2 (62.28–85.35) | 0.68 |
| Height (cm), median (IQR) | 163 (158–169) | 162 (158–165) | 163 (158–168) | 0.49 |
| BMI (kg/m2), median (IQR) | 26.75 (23.33–30.88) | 27.6 (23.4–32) | 26.8 (23.4–31.2) | 0.76 |
| Middle upper arm circumference (cm), median (IQR) | 30 (26.5–34) | 29.5 (26–32) | 30 (26.3–33) | 0.38 |
| Waist circumference (cm), median (IQR) | 97 (87.8–108.5) | 100 (88.8–108.5) | 99 (88–108) | 0.43 |
| WHtR, median (IQR) | 0.6 (0.5–0.7) | 0.6 (0.6–0.7) | 0.6 (0.5–0.7) | 0.17 |
| Body Composition | ||||
| Fat mass (kg), median (IQR) | 25.1 (15–31.5) | 25.6 (14.5–30.6) | 25.4 (14.9–31.2) | 0.61 |
| Fat-free mass (kg), median (IQR) | 46.2 (41.8–53.9) | 47.4 (43.5–54.1) | 46.7 (42.5–53.9) | 0.57 |
| Bone mass (kg), median (IQR) | 2.4 (2.1–2.7) | 2.4 (2.2–2.7) | 2.4 (2.2–2.7) | 0.60 |
| Predicted muscle mass (kg), median (IQR) | 43.9 (39.7–51.2) | 45 (41.3–51.4) | 44.3 (40.3–51.2) | 0.57 |
| Total body water (kg), median (IQR) | 32.4 (29.1–37.7) | 33.1 (30.5–36.8) | 32.8 (29.6–37.6) | 0.68 |
| Phase angle, median (IQR) | 4.5 (3.9–4.8) | 4.4 (3.9–5.1) | 4.5 (3.9–4.8) | >0.99 |
| ASM/ht2 | 6.5 (0–7.6) | 7 (6.2–7.7) | 6.8 (0–7.6) | 0.24 |
| Metabolic age (years), median (IQR) | 69 (63–73.3) | 71 (67–75.3) | 70 (64–75) | 0.17 |
| TRFATM (kg), median (IQR) | 11.8 (8.1–14.9) | 12.2 (7.8–14.5) | 12 (8–14.6) | 0.76 |
| n (%) Population | p * | |||
|---|---|---|---|---|
| MMSE ≥ 24 (n = 79) | MMSE < 24 (n = 35) | Total (n = 114) | ||
| SPPB Total Score | <0.001 * | |||
| Low physical ability | 24 (36.4) | 29 (87.9) | 53 (53.5) | |
| Moderate physical ability | 19 (28.8) | 2 (6.1) | 21 (21.2) | |
| High physical ability | 23 (34.8) | 2 (6.1) | 25 (25.3) | |
| Muscle strength | ||||
| Muscle strength (kg)/ fist grip test—dynamometer (medium value) | 20.3 (15.3–26) | 14 (9.3–20) | 18 (11.6–24.8) | <0.001 ** |
| Predicted muscle mass (kg) | 43.9 (39.7–51.2) | 45 (41.3–51.4) | 44.3 (40.3–51.2) | 0.57 ** |
| MNA (total score), median (IQR) | 25 (20.75–28) | 23.5 (19–27) | 24.75 (19.75–27.5) | 0.01 ** |
| MNA (distribution, pc), n (%) | 77 | 35 | 0.003 * | |
| Normal nutritional status (24–30) | 52 (67.5) | 17 (48.6) | 69 (61.6) | |
| At risk of malnutrition (17–23.5) | 9 (11.7) | 14 (40) | 23 (20.5) | |
| Malnourished (<17) | 16 (20.8) | 4 (11.4) | 20 (17.9) | |
| SARC-F predictive of sarcopenia | 0.006 * | |||
| No | 52 (67.5) | 16 (48.5) | 68 (61.8) | |
| Yes (≥4) | 25 (32.5) | 17 (51.5) | 42 (38.2) | |
| SARC-F (pc), n (%) | 0.02 * | |||
| No difficulty lifting/carrying 4.5 kg | 45 (58.4) | 13 (39.4) | 58 (52.7) | |
| Sometimes difficulty lifting/carrying 4.5 kg | 9 (11.7) | 11 (33.3) | 20 (18.2) | |
| Often difficulty lifting/carrying 4.5 kg | 23 (29.9) | 9 (27.3) | 32 (29.1) | |
| (a) | |
| Spearman’s Correlation Coefficient Rho (p Value) | |
| Total Score MMSE | |
| Muscle strength (kg) | 0.438 (<0.001) |
| Blood pressure—systolic (mmHg) | 0.364 (<0.001) |
| Blood pressure—diastolic (mmHg) | 0.254 (0.01) |
| Upper arm circumference (cm) | 0.342 (0.05) |
| MNA total score | 0.206 (0.03) |
| TMT—A (min) | 0.326 (<0.001) |
| TMT—A (s) | 0.326 (<0.001) |
| TMT—B (min) | 0.528 (<0.001) |
| TMT—B (s) | 0.517 (<0.001) |
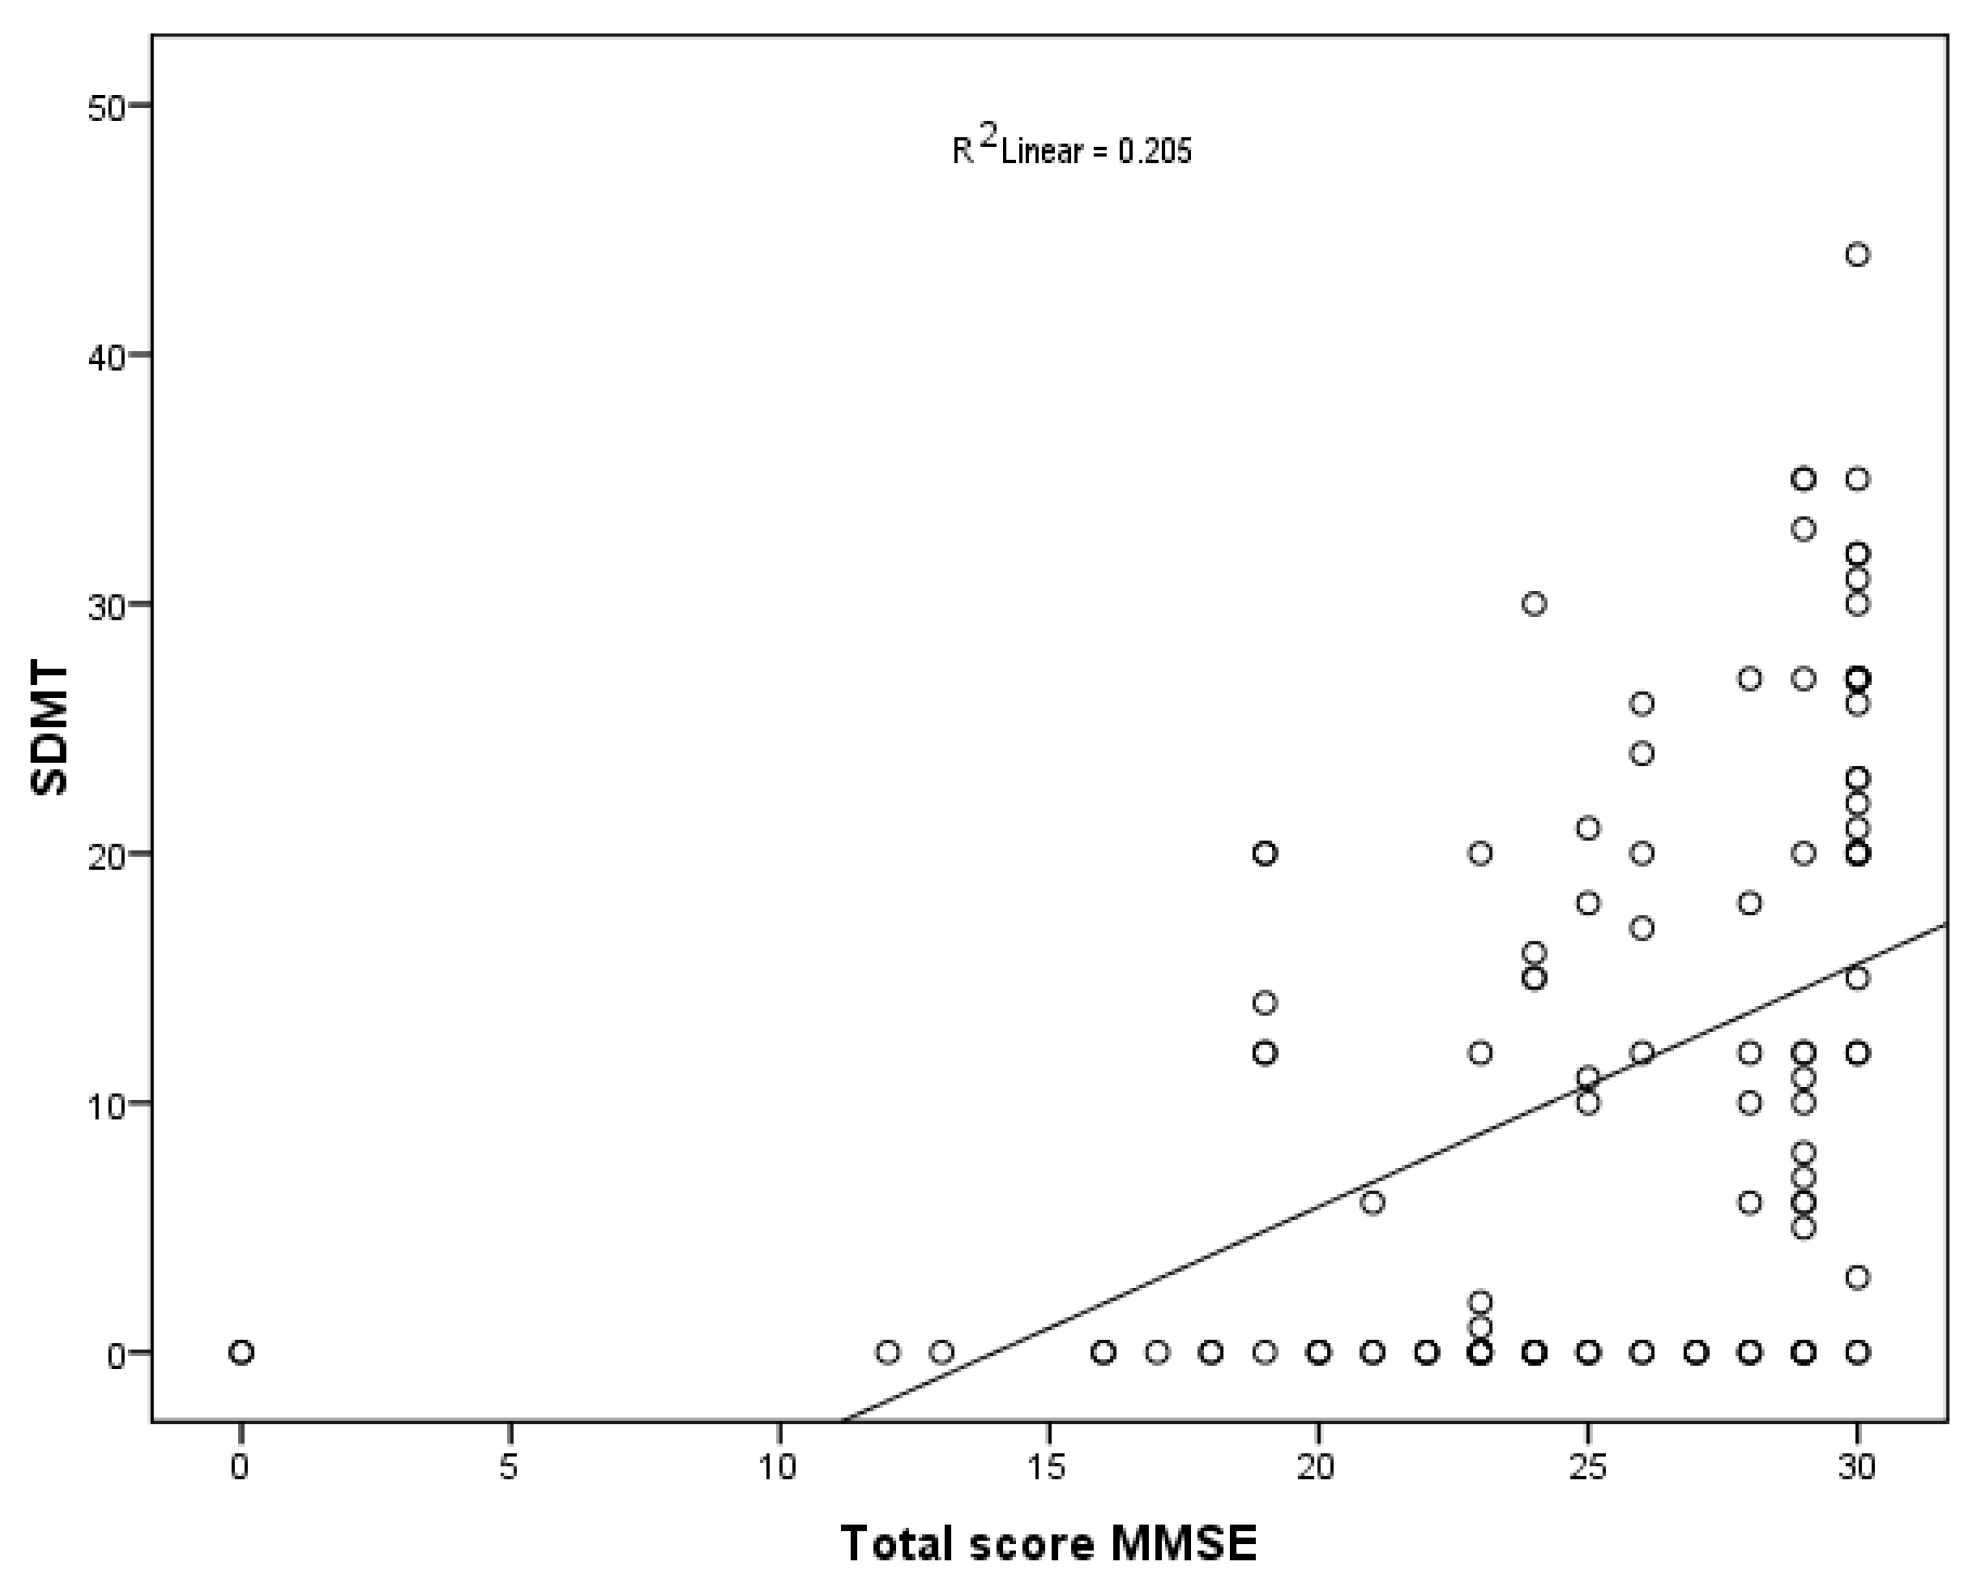
| SDMT (n) | 0.569 (<0.001) |
| MDSS | |
| Potato intake adherence | 0.205 (0.03) |
| Milk and dairy products adherence | 0.185 (0.05) |
| Poultry adherence | 0.310 (<0.001) |
| Red meat adherence | 0.258 (0.01) |
| (b) | |
| Spearman’s Correlation Coefficient Rho (p Value) | |
| Total MMSE Score | |
| Age | −0.286 (<0.001) |
| Age of entering the institution | −0.306 (<0.001) |
| Medications (pc) | −0.218 (0.03) |
| MDSS total score | −0.177 (0.06) |
| Wine (quantity: 1 glass for women, 1–2 glasses for man) | −0.198 (0.03) |
| Bivariate Logistic Regression | ß | _Wald | p Value | OR | 95% CI |
|---|---|---|---|---|---|
| Age | 0.07 | 8.54 | 0.004 | 1.07 | 1.02–1.12 |
| Age of entering the institution | 0.05 | 7.39 | 0.007 | 1.05 | 1.01–1.09 |
| Marriage status (Unmarried) | |||||
| Married | −1.46 | 1.65 | 0.20 | 0.23 | 0.02–2.16 |
| Divorced | 1.23 | 3.03 | 0.08 | 3.42 | 0.86–13.67 |
| Widowed | 1.18 | 4.69 | 0.03 | 3.25 | 1.12–9.46 |
| Education level (Low education level) | |||||
| ≤12 years | −1.49 | 12.86 | 0.003 | 0.22 | 0.09–0.51 |
| >12 years | −1.72 | 9.21 | 0.002 | 0.18 | 0.06–0.54 |
| Activity (Sedentary) | |||||
| Heavier physical activity | 1.83 | 10.57 | 0.001 | 6.26 | 2.07–18.9 |
| Smoker (yes) | −1.09 | 5.62 | 0.02 | 0.33 | 0.13–0.83 |
| Loss of appetite (yes) | 0.80 | 3.97 | 0.04 | 2.24 | 1.01–4.94 |
| Medications (pc) | 0.17 | 7.87 | 0.005 | 1.19 | 1.05–1.34 |
| Muscle strength (kg)/ fist grip test—dynamometer (medium value) | −0.08 | 10.03 | 0.002 | 0.92 | 0.87–0.97 |
| SBP (mmHg) | −0.03 | 9.74 | 0.002 | 0.96 | 0.94–0.98 |
| DBP (mmHg) | −0.04 | 5.29 | 0.02 | 0.96 | 0.93–0.99 |
| SPPB (Low physical activity) | |||||
| Moderate physical activity | −2.48 | 9.91 | 0.002 | 0.08 | 0.02–0.39 |
| High physical activity | −2.62 | 11.17 | 0.001 | 0.07 | 0.02–0.34 |
| MNA (Malnourished), score | |||||
| Malnutrition Risk | 1.365 | 8.02 | 0.005 | 3.87 | 1.52–9.89 |
| Normal nutritional status | 0.28 | 0.42 | 0.52 | 1.32 | 0.57–3.06 |
| Predictive Sarcopenia (≥4) | 1.13 | 9.01 | 0.003 | 3.1 | 1.48–6.49 |
| Triglycerides (mmol/L) | 1.12 | 4.46 | 0.03 | 3.05 | 1.08–8.6 |
| SDMT, score | −0.13 | 20.76 | <0.001 | 0.88 | 0.83–0.93 |
| MDSS total score | 0.09 | 1.96 | 0.16 | 1.1 | 0.96–1.26 |
| Eggs | −0.75 | 8.02 | 0.005 | 0.47 | 0.28–0.79 |
| Poultry (chicken, turkey) | −2.13 | 8.19 | 0.004 | 0.12 | 0.03–0.51 |
| ß—regression coefficients |
| ß | Wald | p Value | OR | 95% CI | |
|---|---|---|---|---|---|
| Multivariate logistic regression | |||||
| Gender | −0.828 | 0.155 | 0.69 | 0.44 | 0.007–26.97 |
| Age | 0.829 | 5.47 | 0.02 | 2.29 | 1.14–4.59 |
| Predictive Sarcopenia (≥4) SARC-F | 5.87 | 4.08 | 0.04 | 353.6 | 1.19–105,308.2 |
| Constant | −83.8 | 5.74 | 0.02 |
Disclaimer/Publisher’s Note: The statements, opinions and data contained in all publications are solely those of the individual author(s) and contributor(s) and not of MDPI and/or the editor(s). MDPI and/or the editor(s) disclaim responsibility for any injury to people or property resulting from any ideas, methods, instructions or products referred to in the content. |
© 2024 by the authors. Licensee MDPI, Basel, Switzerland. This article is an open access article distributed under the terms and conditions of the Creative Commons Attribution (CC BY) license (https://creativecommons.org/licenses/by/4.0/).
Share and Cite
Jelaska, J.; Vučković, M.; Gugić Ordulj, I.; Kolak, E.; Šolić Šegvić, L.; Đapić Kolak, Z.; Keser, I.; Radić, J. Unlocking Cognitive Potential: Association of Sarcopenia and Mediterranean Diet on Cognitive Function in Community-Dwelling Elderly of the Dalmatian Region. Nutrients 2024, 16, 991. https://doi.org/10.3390/nu16070991
Jelaska J, Vučković M, Gugić Ordulj I, Kolak E, Šolić Šegvić L, Đapić Kolak Z, Keser I, Radić J. Unlocking Cognitive Potential: Association of Sarcopenia and Mediterranean Diet on Cognitive Function in Community-Dwelling Elderly of the Dalmatian Region. Nutrients. 2024; 16(7):991. https://doi.org/10.3390/nu16070991
Chicago/Turabian StyleJelaska, Julija, Marijana Vučković, Ivana Gugić Ordulj, Ela Kolak, Lucija Šolić Šegvić, Zdravka Đapić Kolak, Irena Keser, and Josipa Radić. 2024. "Unlocking Cognitive Potential: Association of Sarcopenia and Mediterranean Diet on Cognitive Function in Community-Dwelling Elderly of the Dalmatian Region" Nutrients 16, no. 7: 991. https://doi.org/10.3390/nu16070991
APA StyleJelaska, J., Vučković, M., Gugić Ordulj, I., Kolak, E., Šolić Šegvić, L., Đapić Kolak, Z., Keser, I., & Radić, J. (2024). Unlocking Cognitive Potential: Association of Sarcopenia and Mediterranean Diet on Cognitive Function in Community-Dwelling Elderly of the Dalmatian Region. Nutrients, 16(7), 991. https://doi.org/10.3390/nu16070991