Article

Comparison of Metabolic Syndrome (MetS) Risk and Nutritional Status According to Menopause Age and the Impact of Socioeconomic Status on MetS Prevalence in Postmenopausal Women: A Cross-Sectional Study Based on the 8th Korea National Health and Nutrition Examination Survey (KNHANES)

1
Department of Food Science and Human Nutrition, Jeonbuk National University, Jeonju 54896, Republic of Korea
2
K-Food Research Center, Jeonbuk National University, Jeonju 54896, Republic of Korea
3
Department of Food and Nutrition, Sahmyook University, Seoul 01795, Republic of Korea
*
Author to whom correspondence should be addressed.
Nutrients 2024, 16(7), 967; https://doi.org/10.3390/nu16070967
Submission received: 6 February 2024 / Revised: 14 March 2024 / Accepted: 25 March 2024 / Published: 27 March 2024
(This article belongs to the Section Nutrition and Metabolism)

Abstract

:
The increased life expectancy and the occurrence of premature menopause prolong the mean postmenopausal phase in women’s lifespans. Although the roles of poor socioeconomic status (SES), anthropometric characteristics, and nutritional status in premature menopause and the health of postmenopausal women are well understood, the differences in nutritional status and metabolic syndrome (MetS) prevalence in postmenopausal women depending on their menopause age are less explored. Furthermore, the association between SES and MetS risk in postmenopausal women is not studied. Thus, this study aimed to compare distinct nutritional status and MetS risk between women with premature menopause and natural menopause. Additionally, the association among SES, health-related lifestyle behaviors (HLBs), and MetS risk in postmenopausal women was studied. This study included 31,799 postmenopausal women from the 8th National Health and Nutrition Examination Survey (KNHANES). The relationship between disease prevalence and nutrient intake of the subjects was analyzed using analysis of variance (GLM), and Scheffé test was performed. Multiple logistic regression analysis was used to evaluate the association among SES, HLBs, and MetS as well as premature menopause. Women with premature menopause showed poor SES, anthropometric characteristics, and HLBs compared with women with natural menopause. Additionally, premature menopausal women had markedly lower intakes of protein, polyunsaturated fatty acid, n-3 fatty acid, and β-carotene, but higher intakes of energy, carbohydrate, saturated fatty acid, and sugar than women with natural menopause (p < 0.0001). Premature menopausal women showed significantly higher MetS prevalence by having hypertriglyceridemia (p < 0.0001), hypertension (p = 0.0145), and reduced HDL cholesterol levels (p < 0.0001) relative to natural menopausal women. Furthermore, our findings indicate a substantial link among SES, HLBs, and the risk of premature menopause. In postmenopausal women, deteriorating SES and HLBs appear to influence the prevalence of MetS. Notably, our study reveals that higher intakes of protein, calcium, phosphate, and iron are correlated with a lower risk of developing MetS. These observations suggest that proactive nutritional education for premature menopausal women is necessary to improve MetS risk and their nutritional status. Also, SES-dependent interventions regarding nutrition and HLBs in postmenopausal women will be significant to lower MetS risk, MetS-derived chronic disease, and mortality in postmenopausal women.

1. Introduction

Menopause is the permanent cessation of menstruation caused by the deprivation of ovarian follicular capability and hormone production (e.g., estrogen and progesterone), resulting in the end of reproductive ability in women [1]. Generally, menopause occurs in middle-aged women (≥50 years) and triggers several physical and emotional changes, including sweating, sleeping issues, and depression [2]. Importantly, women’s life expectancy and the number of cases of premature menopause (<40 years) have been increasing [3,4], lengthening the average postmenopausal period in women’s lifespans. For example, in Korean women, the mean age of menopause was 49.9 years, and the life expectancy was 86.6 years in 2021, which was 83.6 years in 2010 [5]. Moreover, one out of hundreds of Korean women experience premature menopause [6].
Socioeconomic status (SES) is one of the critical factors determining menopausal age [7,8]. In fact, a lower SES was significantly associated with an elevated incidence of premature ovarian insufficiency and early menopause (between ages 40 and 45 years) [8]. The significant roles of SES in menopausal age come from its effects on an individual’s health-related lifestyle behaviors (HLBs, e.g., smoking, physical activities, and alcohol intake), nutritional status, and anthropometric parameters [9,10,11]. For instance, appropriate body weight and body fat percentage are pivotal to maintaining a regular ovulatory cycle and lowering the risk of amenorrhea and premature menopause [12,13]. Additionally, the association between smoking and premature menopause has been consistently reported [14].
Due to the abrupt end of hormone production, menopause leads to metabolic dysregulation, such as hyperlipidemia and insulin resistance, increasing the risk of multiple chronic diseases (cardiovascular disease and diabetes) in postmenopausal women [15,16]. Indeed, about 22% of postmenopausal women show metabolic syndrome (MetS) by having higher fasting glucose level (≥100 mg/dL) and systolic blood pressure (≥130 mmHg) [16]. Therefore, the importance of the nutritional condition of postmenopausal women has been emphasized to maintain health and prevent the incidence of chronic disease. For instance, adequate consumption of antioxidant nutrients (e.g., vitamin A, and vitamin C) is positively correlated with bone health in postmenopausal women [17,18]. Although the association between the nutritional condition and diverse menopause-related health issues in postmenopausal women has been well explored, differences in the nutritional status and MetS prevalence of postmenopausal women depending on their menopausal age are less investigated. Moreover, according to Choi and colleagues, poor SES markedly elevates the osteoporosis risk in postmenopausal women [19]; however, the impact of SES on the MetS risk in postmenopausal women is unexplored.
Therefore, utilizing recent nationally representative data (the 8th Korea National Health and Nutrition Examination Survey (KNHANES VIII-2), 2020), the current study aimed to (1) compare the differences in socioeconomic, HLBs, and anthropometric parameters between women with premature and natural menopause; (2) compare differences in average nutrient intake and MetS risk between women with premature and natural menopause; and (3) scrutinize the association among SES, HLBs, and MetS risk in postmenopausal women.

2. Materials and Methods

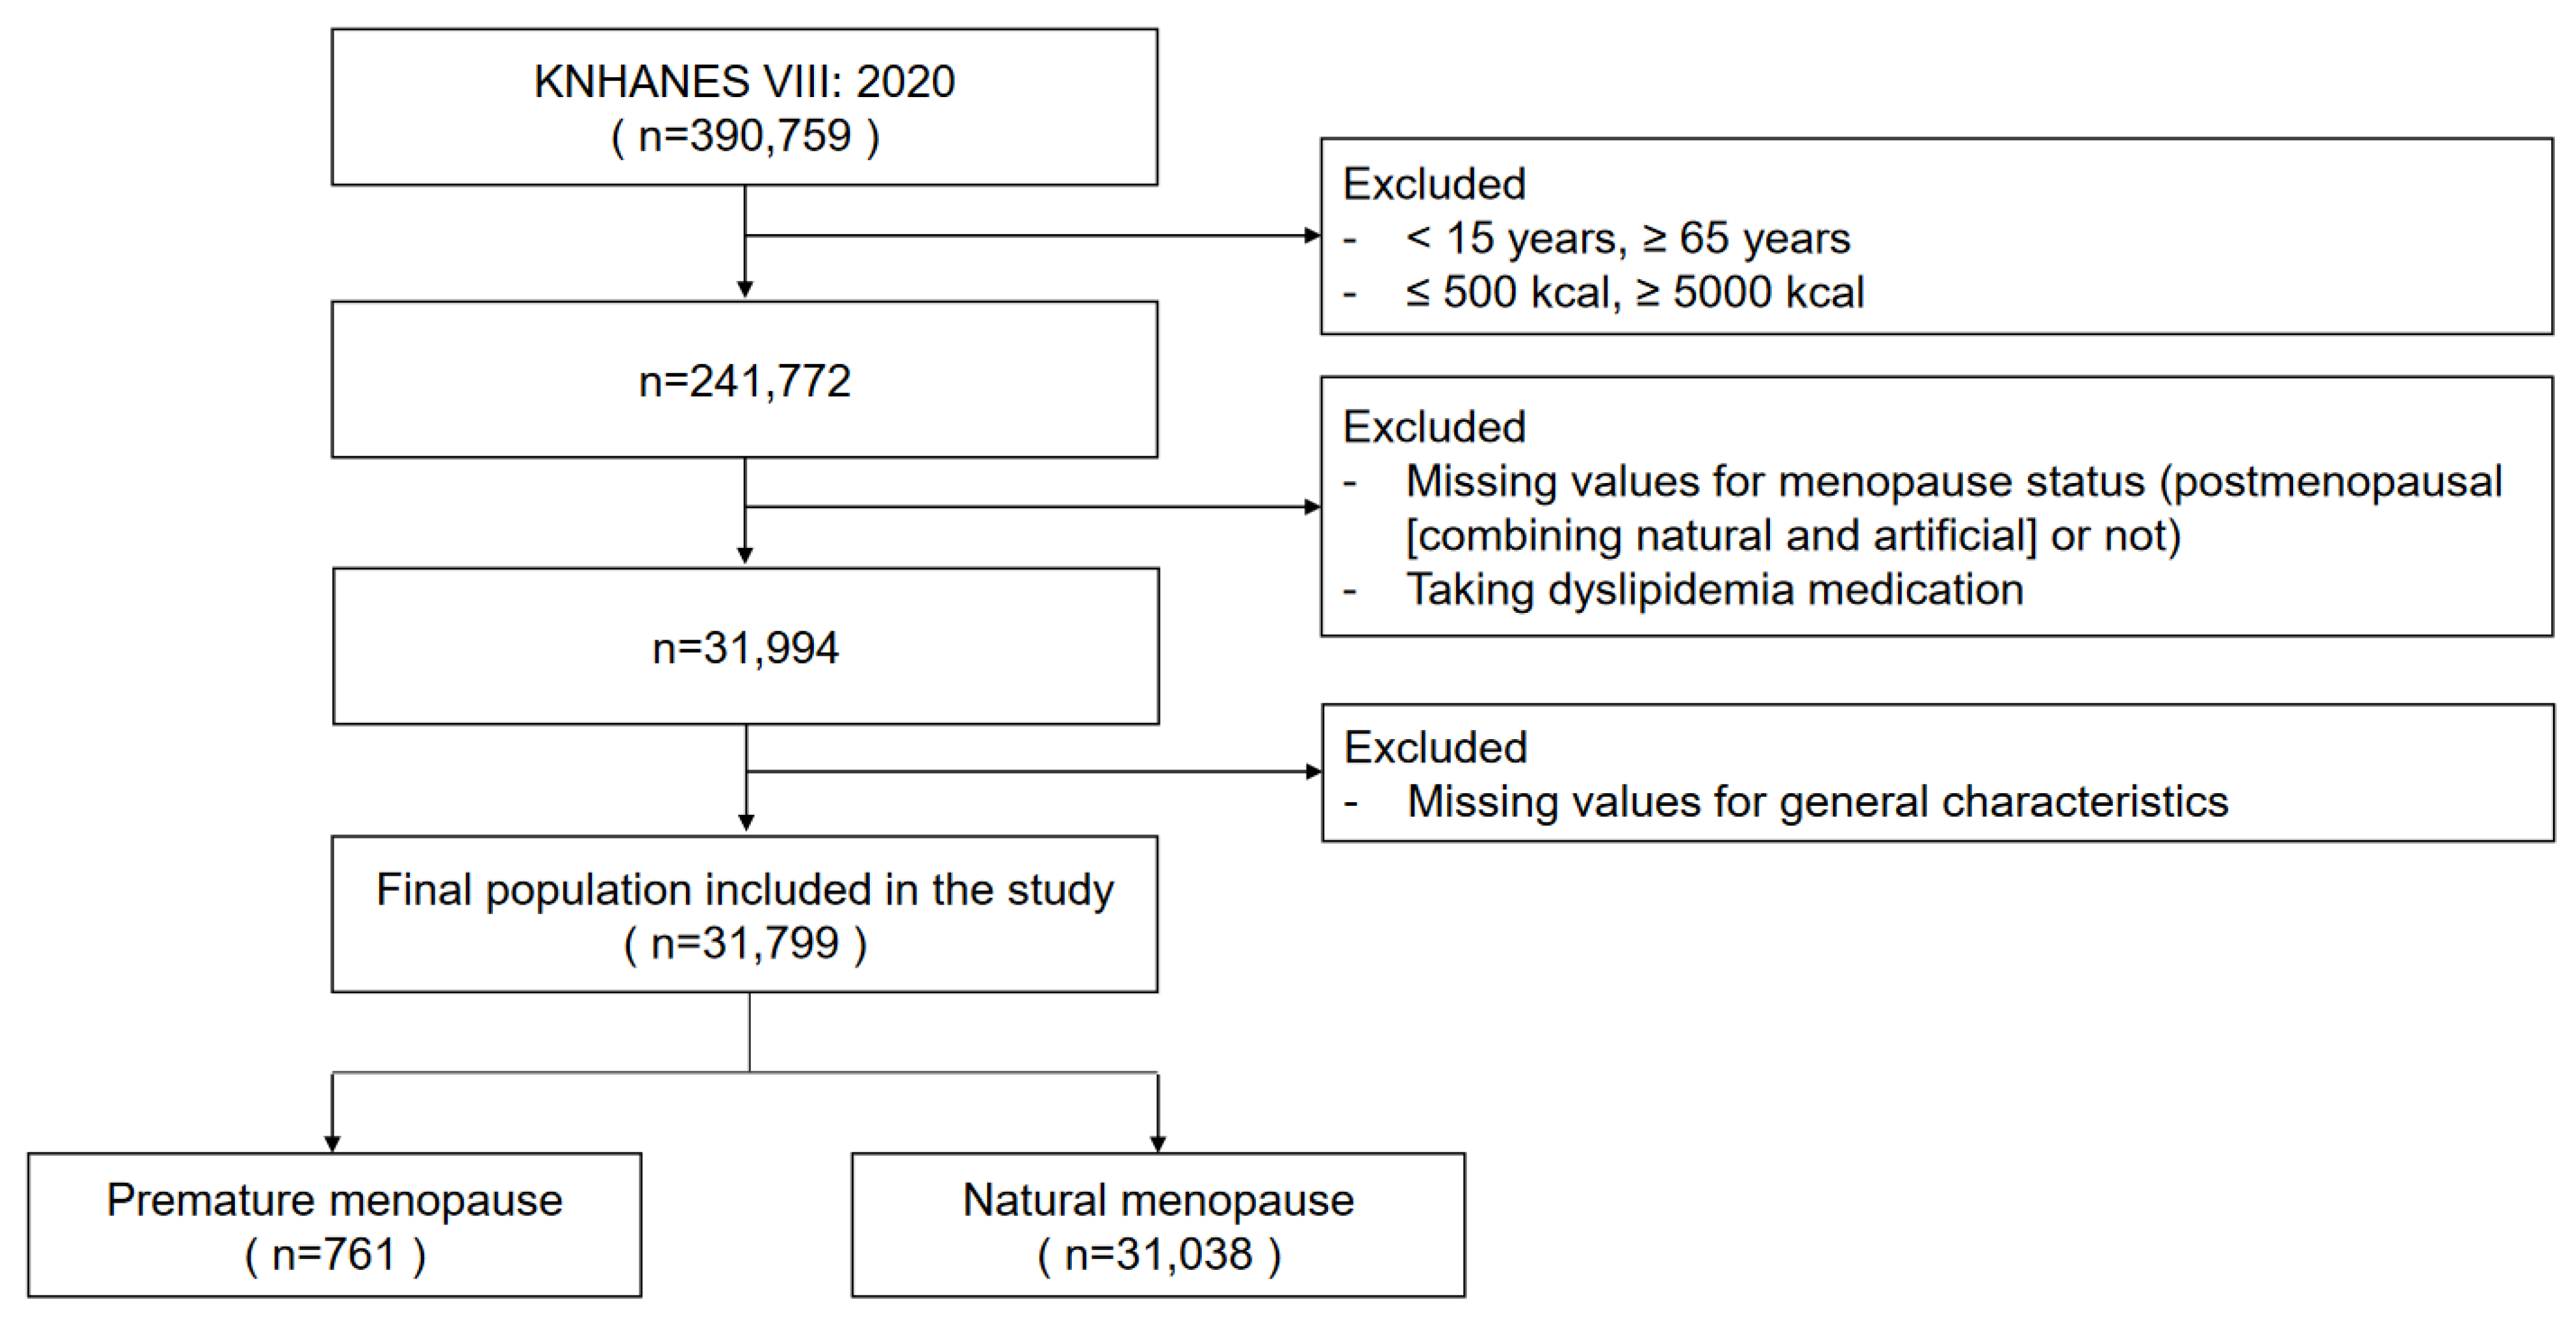
2.1. Study Design and Participants

This study used raw data from the 8th KNHANES (2020). The KNHANES is an extensive, cross-sectional survey targeting individuals aged 1 year and older. Conducted by the Korea Centers for Disease Control and Prevention (KCDC) since 1998, this nationwide study aims to uncover health-related factors through a combination of health examinations, interviews, and nutritional assessments. Each generation of the survey encompasses approximately 2000 to 3000 South Korean participants.
Among the total subjects, 164,088 postmenopausal women who did not menstruate were extracted after excluding those women aged 15 to 65 who were surveyed by the Korean Dietary Reference Intake Index (KDRIs) who answered before menarche, without menstruation, or with an unknown menstrual status. Among them, 31,994 people with natural menopause and artificial menopause were selected for the amenorrhea question. Artificial menopause refers to cases of artificial menopause due to female diseases. In this study, cases of menopause due to artificial causes, such as oophorectomy and hysterectomy, were included. Among them, subjects taking drugs that may affect lipid metabolism were excluded. The final study subjects were classified into 761 women with early menopause and 31,038 women with normal menopause based on the age of 40 at the time of menopause (Figure 1).

2.2. Research Contents and Methods

For the general information of the research subjects, income level, education level, and marital status investigated in the KNHANES were used for analysis. For lifestyle, data on drinking experience and frequency, smoking status, and physical activity level were used for analysis.
As for physical characteristics, height, weight, waist circumference (WC), and body mass index (BMI), which were investigated through a physical examination survey, were used. In addition, data investigating the subject’s nutrient intake and prevalence of MetS components were used for analysis. A BMI of less than 25 was classified as normal, whereas a BMI of 25 or more was classified as obese. Additionally, a fasting blood glucose of less than 100 mg/dL was classified as normal, and a fasting blood sugar value higher than 100 mg/dL (≥100 mg/dL) with a doctor’s diagnosis or taking hypoglycemic drugs or insulin injections was classified as diabetic condition. Hypercholesterolemia (HyperCHL) is noted when total cholesterol is 240 mg/dL or higher or cholesterol-lowering drugs are taken. Hypertriglyceridemia (HyperTG) is noted when triglyceride is 200 mg/dL or higher. Hypertension is noted with a blood pressure of 130/85 mmHg or higher. Low high-density lipoprotein cholesterol (HDL-CHL) hyperemia was defined as less than 50 mg/dL.
MetS was defined based on the modified NCEP ATP III following Asian standards for abdominal obesity [20] and metabolic syndrome and noted when more than three of the five criteria were met: (1) elevated blood pressure (average systolic blood pressure > 130 mmHg or diastolic blood pressure > 85 mmHg); (2) low serum concentrations of high-density lipoprotein (HDL) cholesterol (<50 mg/dL for women); (3) serum triglyceride (TG) level (≥150 mg/dL); (4) fasting blood glucose concentrations (≥100 mg/dL); (5) abdominal obesity (waist circumferences for women of ≥85 cm).
The 24-h recall survey was carried out via in-person interviews by trained professionals. To improve recall abilities and gather detailed data on survey items, supplementary materials were utilized during the survey process. A total of 26 nutrients, including energy, protein, fat, and carbohydrates, from the food intake survey using the 24-h recall method of KNHANES were included in the nutrient intake survey.

2.3. Data Analysis

Statistical processing of all data was performed using SAS (release 9.4; SAS Institute, Cary, NC, USA) 9.4 program. Each variable was analyzed using the composite sample design data analysis method considering the colony variables, stratification variables, and weights presented in the 8th KNHANES. Descriptive statistics were expressed as mean, frequency, t-test, and standard deviation. Descriptive statistics were presented for height, weight, WC, and BMI, and the chi-square test was performed by classifying all women as postmenopausal, early menopausal, and normal menopausal. In addition, the prevalence of MetS components according to early menopause and general menopause was compared using a t-test. The relationship between MetS prevalence and the nutrient intake of the subjects was analyzed using analysis of variance (GLM), and Scheffé test was carried out. In our analysis, we employed univariate logistic regression to evaluate the associations among SES, HLBs, MetS, and premature menopause. This assessment was adjusted for age and BMI to account for their potential confounding effects. Additionally, in our forest plot analysis, which focused on the relationship between nutrient intakes and MetS, we made adjustments for age, BMI, and energy intake. These adjustments were crucial to isolate the effects of nutrient intake on MetS while controlling for these significant variables. The statistical significance of all data analysis results was analyzed based on p < 0.05.

3. Results

3.1. Sociodemographic and Anthropometric Characteristics According to Menopausal Status

Table 1 shows the sociodemographic features of the subjects. At the time of the survey, women with premature menopause had an average current age of 56.114 ± 9.850 years, while women experiencing natural menopause had an average current age of 57.276 ± 4.365 years. The average age of menopause among women with premature menopause was 36.223 ± 2.709 years, and the value was 50.622 ± 3.252 years for naturally menopausal women. Based on menopausal status, there were significant differences in age, income level, education, alcohol drinking status, smoking, walking, leisure-related moderate-intensity physical activities, and self-assessment of health (p < 0.0001). Women with premature menopause showed the highest proportion at the middle-high income level (51.25%) and ≤elementary school education (40.87%), while naturally menopausal women had the highest distribution at the high-income level (44.78%) and high school education (43.00%). Compared with naturally menopausal women, premature menopausal women showed markedly higher levels of heavy alcohol drinking (premature: 4.86% vs. natural: 2.93%), current smoking (premature: 9.33% vs. natural: 2.19%), not walking more than 5 days a week (premature: 70.17% vs. natural: 55.86%), leisure-related moderate-intensity physical activities (premature: 34.30% vs. natural: 25.16%), and poor self-assessment of health (premature: 32.72% vs. natural: 17.85%). Additionally, women with premature menopause had lower values in the good (premature: 17.08% vs. natural: 27.74%) self-assessment of health than women with natural menopause.
Participants’ anthropometric characteristics based on menopausal status are shown in Table 2. Compared to naturally menopausal women, premature menopausal women had significantly lower weight (p = 0.0238), WC (p < 0.0001), and BMI (p = 0.0003).

3.2. Prevalence of Metabolic Syndrome Components Based on Menopausal Status

Details on the prevalence of MetS components of the subjects according to menopausal status are shown in Table 3. Women with natural menopause had a markedly higher prevalence of obesity (p < 0.0001), diabetes (p < 0.0001), and HyperCHL (p < 0.0001), also higher HDL cholesterol (p < 0.0001) than women with premature menopause. On the other hand, the prevalence of HyperTG (p < 0.0001) and hypertension (p = 0.0145) was higher in premature menopausal women compared to naturally menopausal women. Women with natural menopause showed significantly lower levels of metabolic diagnosis compared to women with premature menopause (>3, premature: 19.97% vs. natural: 9.62%).

3.3. Average Daily Nutrient Intake According to Menopausal Status

There were significant differences in daily nutrient intake based on menopausal status (Table 4). Premature menopausal women had significantly higher average daily intakes of energy (p < 0.0001), carbohydrate (p < 0.0001), saturated fatty acid (SFA, p < 0.0001), fiber (p < 0.0001), sugar (p < 0.0001), calcium (p = 0.0014), phosphorus (p < 0.0001), retinol (p = 0.0297), and thiamin (p < 0.0001) than women with natural menopausal women. Contrastingly, naturally menopausal women showed markedly higher mean daily intakes of water (p = 0.0258), protein (p < 0.0001), polyunsaturated fatty acid (PUSFA, p = 0.0004), n-3 fatty acid (p < 0.0001), iron (p < 0.0001), sodium (p < 0.0001), vitamin A (p < 0.0001), β-carotene (p < 0.0001), and riboflavin (p < 0.0001) compared with premature menopausal women.

3.4. Factors Associated with the Risk of Premature Menopause

Table 5 shows the association among SES, HLBs, and premature menopause risk. The prevalence of premature menopause was significantly 0.209 times lower in middle-high income level (95% CI = 0.122–0.359) and 0.009 times lower in high-income level (95% CI = 0.003–0.023) compared to the reference group (lower-middle). Education level was also significantly associated with premature menopause risk. Compared to the reference group (≤middle school), the prevalence of premature menopause was markedly 2.454 times higher in ≥ high school (95% CI = 1.726–3.489). Additionally, current smoking status was noticeably related to premature menopause prevalence (OR = 4.230; 95% CI = 3.175–5.636). Furthermore, compared to the reference group (<5 days/week), premature menopause risk was 0.675 times lower in the group that walked more than 5 days/week.

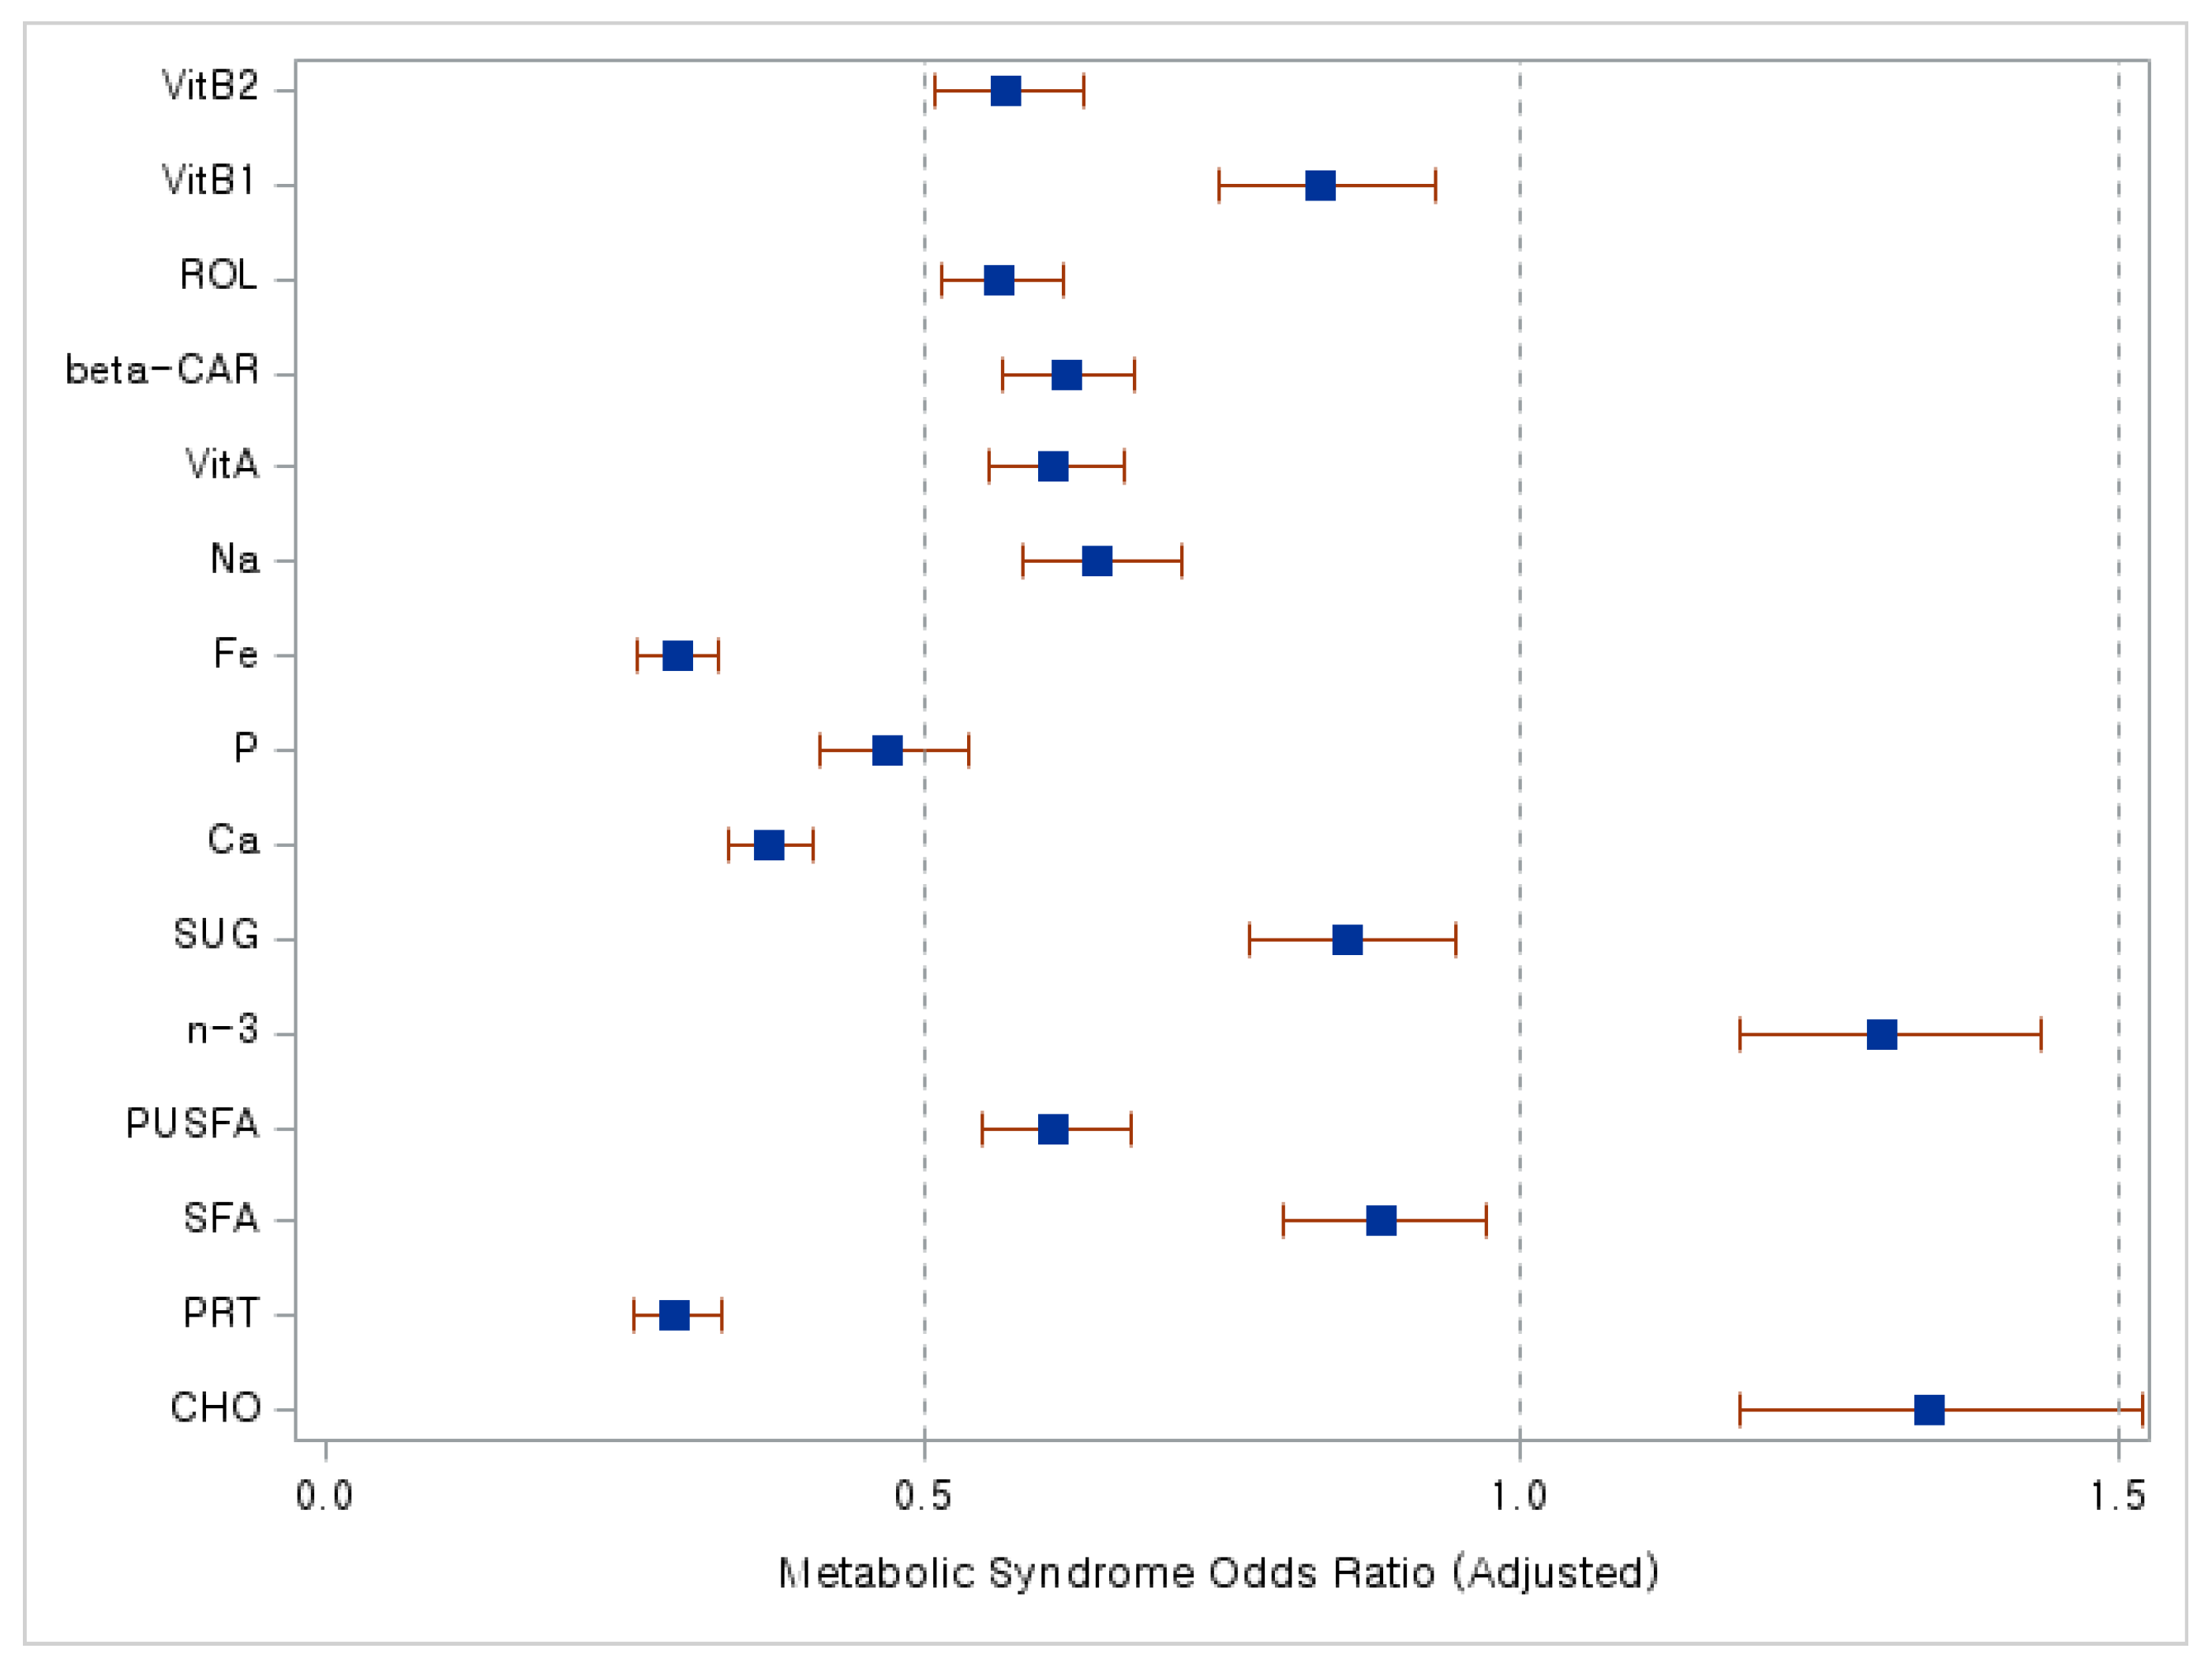
3.5. Factors Associated with the Risk of Metabolic Syndrome in Postmenopausal Women

The association among SES, HLBs, and MetS risk is shown in Table 6. The prevalence of MetS in postmenopausal women was significantly associated with income level. The risk of MetS was 1.816 times higher in the middle-high income group (95% CI = 1.417–2.327) and 2.679 times higher in the high-income group (95% CI = 1.816–3.951) compared to the reference group, which was the lower-middle income level. The risk of MetS in postmenopausal women was significant and 0.764 times lower in ≥ high school (95% CI = 0.637–0.915) than the reference group (≤middle school). In addition, heavy alcohol drinking status (OR = 2.684; 95% CI = 2.148–3.353) and current smoking status (OR = 0.168; 95% CI = 0.115–0.245) were also linked with MetS prevalence in postmenopausal women with statistical significance. Also, walking status and leisure-related moderate-intensity physical activities were strongly associated with MetS risk in postmenopausal women. Compared to the reference group (<5 days/week), the prevalence of MetS in postmenopausal women was 0.524 times lower in the group that walked more than 5 days/week (95% CI = 0.479–0.573) with statistical significance. Self-assessment of health also had a statistical association with MetS risk in postmenopausal women.
We subsequently performed regression analysis to examine if daily nutrient intake, previously identified as varying based on menopausal status, correlates with the risk of MetS in postmenopausal women. The findings are presented in a forest plot (Figure 2). Observing Figure 2, it is evident that higher intakes of protein, calcium, phosphate, and iron are strongly associated with a reduced risk of MetS.

4. Discussion

The current study analyzed the latest nationally representative data (the 8th KNHNES, 2020) and reported the following: (1) the distinct characteristics of SES, HLBs, and anthropometric parameters depending on menopausal age; (2) the differences in MetS prevalence and average nutrient intake relying on menopausal age; (3) the association among SES, HLBs, premature menopause, and the MetS risk in postmenopausal women.
Health inequality has been reported in many countries [21,22]. Individuals having lower SES are likely to have more health issues than those having higher SES due to the worse maintenance in HLBs, nutritional status, and anthropometric characteristics [9,10]. For example, insufficient SES and HLBs are the pivotal factors of premature menopause [7,8]. Consistent with earlier reports, the present study also found that premature menopausal women have markedly poor SES, anthropometric features, and HLBs compared to naturally menopausal women; furthermore, there was a strong association among SES, HLBs, and the risk of premature menopause. As income and education levels increase, the risk of premature menopause was markedly decreased compared to the reference group. Future prospective studies should investigate whether HLB interventions could delay the menopausal age in women having a lower SES as this information is required to investigate the causal relationship of those variables. Furthermore, to improve premature menopause prevalence, it will be critical to inform women regarding the importance of maintenance of proper body weight and body fat percentage especially with young generations showing a high prevalence of severe eating disorders (e.g., anorexia nervosa) [23].
In postmenopausal women, adequate nutrient intake is important to maintain health, ameliorate menopausal-related symptoms, and prevent chronic disease [24,25]. In this study, compared to naturally menopausal women, premature menopausal women showed significantly higher intakes of energy, carbohydrate, SFA, and sugar, but lower consumption of protein, PUSFA, n-3 fatty acid, and β-carotene with statistical significance. As a possible outcome of the aforementioned dietary pattern, women with premature menopause had markedly higher metabolic diagnoses by having an elevated risk of HyperTG and hypertension and lower HDL-CHL levels than women with natural menopause. Since premature menopausal women have a longer mean of the menopausal period than naturally menopausal women, nutritional education for premature menopausal women should be actively performed to prevent MetS and lower the chronic disease risk of this population. Indeed, one year of nutritional intervention in overweight/obese postmenopausal women significantly improves body and body fat weight [26]. Moreover, a low-fat diet with increased levels of fruits and grains in postmenopausal women strongly reduced the incidences of cardiovascular disease, diabetes, and breast cancer [24].
Generally, a lower SES is strongly related to negative dietary patterns because it causes less intake of meat, fruits, and vegetables, but more snack consumption [27]; furthermore, there is a significant association between SES and smoking rate [28], subsequently elevating the risk of MetS and chronic disease incidence. Lately, it has been demonstrated that the prevalence of osteoporosis in postmenopausal women was increased with lower SES due to poor knowledge regarding osteoporosis [19]. The present study also observed that worse SES and HLBs noticeably increase the risk of MetS in postmenopausal women. Interestingly, this study found that high-income levels increased MetS prevalence in postmenopausal women. This potentially occurs because individuals with higher SES chronically suffer from psychosocial stress [29], and it has been presented that higher psychosocial stress accelerates bone loss in postmenopausal women [30]. Considering the deleterious outcomes of MetS in postmenopausal women, proactive SES-dependent nutritional and HLB education, including psychosocial stress control, in postmenopausal women will be necessary to improve the prevalence of MetS, MetS-induced chronic disease, and mortality in postmenopausal women.

5. Conclusions

Utilizing the 8th KNHANES, this study investigated the differences in socioeconomic, HLBs, and anthropometric indicators between premature and naturally menopausal women. The current study also studied the distinct average nutrient intake and prevalence of MetS between women with premature and natural menopause. Most importantly, this study reported the association between SES and the risk of MetS in postmenopausal women. However, the present study has several limitations. First, the cause of premature menopause was not considered (natural menopause vs. artificial menopause). Furthermore, this study cannot explain causality among the variables as it was a cross-sectional study utilizing the 8th KNHANES. Finally, the survey time and menopause period are not matched, especially for premature menopausal women. In the future, longitudinal and prospective studies are required to understand the causal relationship among the variables and to offer concrete basic information for (1) menopause age-based and (2) SES-dependent dietary guidelines and lifestyle interventions for postmenopausal women.

Author Contributions

A.H.: conceptualization, data curation, and writing-original draft. Y.-J.C.: conceptualization, formal analysis, data curation, writing-review & editing, and supervision. All authors have read and agreed to the published version of the manuscript.

Funding

This research received no external funding.

Institutional Review Board Statement

Ethical approval was not required as KNHANES provides anonymous, secondary data that are publicly available for scientific use.

Informed Consent Statement

Written informed consent was obtained from all participants involved in the KNHANES.

Data Availability Statement

All data files are available from the Korea Centers for Disease Control and Prevention database through the following URL: https://knhanes.kdca.go.kr/knhanes/sub03/sub03_02_05.do (assessed on 29 January 2024). Any person, including an international researcher who signs up for membership, can obtain raw data from this website. However, the data access process and user manual are only written in Korean.

Acknowledgments

The authors thank the Korea Ministry of Health and Welfare and the Korea Disease Control and Prevention Agency for allowing the use of their survey data for analysis in the present study.

Conflicts of Interest

The authors declare no conflicts of interest.

Abbreviations

SES, socioeconomic status; HLB, health-related lifestyle behavior; MetS, metabolic syndrome; KNHANES, Korea National Health and Nutrition Examination Survey; KDRIs, Korean Dietary Reference Intake Index; WC, waist circumference; BMI, body mass index; HyperCHL, hypercholesterolemia; HyperTG, hypertriglyceridemia; HDL-CHL, high-density lipoprotein cholesterol; SFA, saturated fatty acid; MUSFA, monosaturated fatty acid; PUSFA, polyunsaturated fatty acid; RAE, retinol activity equivalent; DFE, dietary folate equivalent; and CI, confidence interval.

References

  1. World Health Organization. Research on the Menopause in the 1990s: Report of a WHO Scientific Group. 1996. Available online: https://iris.who.int/handle/10665/41841 (accessed on 6 February 2024).
  2. Williams, R.E.; Levine, K.B.; Kalilani, L.; Lewis, J.; Clark, R.V. Menopause-specific questionnaire assessment in US population-based study shows negative impact on health-related quality of life. Maturitas 2009, 62, 153–159. [Google Scholar] [CrossRef] [PubMed]
  3. Shuster, L.T.; Rhodes, D.J.; Gostout, B.S.; Grossardt, B.R.; Rocca, W.A. Premature menopause or early menopause: Long-term health consequences. Maturitas 2010, 65, 161–166. [Google Scholar] [CrossRef]
  4. Kontis, V.; Bennett, J.E.; Mathers, C.D.; Li, G.; Foreman, K.; Ezzati, M. Future life expectancy in 35 industrialised countries: Projections with a Bayesian model ensemble. Lancet 2017, 389, 1323–1335. [Google Scholar] [CrossRef]
  5. Korean Statistical Information Service. Prospective Population Projection: Nationwide Life Expectancy at Birth. Available online: https://kosis.kr/statHtml/statHtml.do?orgId=101&tblId=DT_1B41&checkFlag=N (accessed on 6 February 2024).
  6. Choe, S.A.; Sung, J. Trends of premature and early menopause: A comparative study of the US National Health and Nutrition Examination Survey and the Korea National Health and Nutrition Examination Survey. J. Korean Med. Sci. 2020, 35, e97. [Google Scholar] [CrossRef] [PubMed]
  7. Batool, M.; Kiran, S.; Mazhar, S.B. Socio-Economic Determinants of Age at Menopause. J. Soc. Obstet. Gynaecol. Pak. 2020, 10, 185–189. [Google Scholar]
  8. Lim, Y.M.; Jeong, K.; Lee, S.R.; Chung, H.W.; Lee, W. Association between premature ovarian insufficiency, early menopause, socioeconomic status in a nationally representative sample from Korea. Maturitas 2019, 121, 22–27. [Google Scholar] [CrossRef] [PubMed]
  9. Gurzkowska, B.; Kułaga, Z.; Litwin, M.; Grajda, A.; Świąder, A.; Kułaga, K.; Góźdź, M.; Wojtyło, M. The relationship between selected socioeconomic factors and basic anthropometric parameters of school-aged children and adolescents in Poland. Eur. J. Pediatr. 2014, 173, 45–52. [Google Scholar] [CrossRef] [PubMed]
  10. Morawa, E.; Erim, Y. Health-related lifestyle behavior and religiosity among first-generation immigrants of polish origin in Germany. Int. J. Environ. Res. Public Health 2018, 15, 2545. [Google Scholar] [CrossRef]
  11. Chan, C.Q.H.; Lee, K.H.; Low, L.L. A systematic review of health status, health seeking behaviour and healthcare utilisation of low socioeconomic status populations in urban Singapore. Int. J. Equity Health 2018, 17, 39. [Google Scholar] [CrossRef]
  12. Frisch, R.E. The right weight: Body fat, menarche and fertility. Proc. Nutr. Soc. 1994, 53, 113–129. [Google Scholar] [CrossRef]
  13. Szegda, K.; Whitcomb, B.W.; Purdue-Smithe, A.; Boutot, M.; Manson, J.; Hankinson, S.; Rosner, B.A.; Bertone-Johnson, E.R. Adult adiposity and risk of early menopause. Hum. Reprod. 2017, 32, 2522–2531. [Google Scholar] [CrossRef] [PubMed]
  14. Schoenaker, D.A.; Jackson, C.A.; Rowlands, J.V.; Mishra, G.D. Socioeconomic position, lifestyle factors and age at natural menopause: A systematic review and meta-analyses of studies across six continents. Int. J. Epidemiol. 2014, 43, 1542–1562. [Google Scholar] [CrossRef] [PubMed]
  15. Lobo, R.A.; Davis, S.R.; De Villiers, T.; Gompel, A.; Henderson, V.W.; Hodis, H.N.; Lumsden, M.A.; Mack, W.J.; Shapiro, S.; Baber, R.J. Prevention of diseases after menopause. Climacteric 2014, 17, 540–556. [Google Scholar] [CrossRef] [PubMed]
  16. Marchi, R.; Dell’Agnolo, C.M.; Lopes, T.C.R.; Gravena, A.A.F.; Demitto, M.O.; Brischiliari, S.C.R.; Borghesan, D.H.P.; Carvalho, M.D.B.; Pelloso, S.M. Prevalence of metabolic syndrome in pre-and postmenopausal women. Arch. Endocrinol. Metab. 2017, 61, 160–166. [Google Scholar] [CrossRef] [PubMed]
  17. Ilesanmi-Oyelere, B.L.; Kruger, M.C. Nutrient and dietary patterns in relation to the pathogenesis of postmenopausal osteoporosis—A literature review. Life 2020, 10, 220. [Google Scholar] [CrossRef] [PubMed]
  18. Kim, D.; Han, A.; Park, Y. Association of dietary total antioxidant capacity with bone mass and osteoporosis risk in Korean Women: Analysis of the Korea national health and nutrition examination survey 2008–2011. Nutrients 2021, 13, 1149. [Google Scholar] [CrossRef] [PubMed]
  19. Choi, M.H.; Yang, J.H.; Seo, J.S.; Kim, Y.J.; Kang, S.W. Prevalence and diagnosis experience of osteoporosis in postmenopausal women over 50: Focusing on socioeconomic factors. PLoS ONE 2021, 16, e0248020. [Google Scholar] [CrossRef] [PubMed]
  20. Son, S.M.; Park, E.J.; Cho, Y.H.; Lee, S.Y.; Choi, J.I.; Lee, Y.I.; Kim, Y.J.; Lee, J.G.; Yi, Y.H.; Tak, Y.J.; et al. Association between Weekend Catch-Up Sleep and Metabolic Syndrome with Sleep Restriction in Korean Adults: A Cross-Sectional Study Using KNHANES. Diabetes Metab. Syndr. Obes. 2020, 13, 1465–1471. [Google Scholar] [CrossRef] [PubMed]
  21. Harper, S.; Lynch, J. Trends in socioeconomic inequalities in adult health behaviors among US states, 1990–2004. Public Health Rep. 2007, 122, 177–189. [Google Scholar] [CrossRef]
  22. Mackenbach, J.P.; Stirbu, I.; Roskam, A.-J.R.; Schaap, M.M.; Menvielle, G.; Leinsalu, M.; Kunst, A.E.; European Union Working Group on Socioeconomic Inequalities in Health. Socioeconomic inequalities in health in 22 European countries. N. Engl. J. Med. 2008, 358, 2468–2481. [Google Scholar] [CrossRef]
  23. Lee, S.M.; Hong, M.; Park, S.; Kang, W.S.; Oh, I.H. Economic burden of eating disorders in South Korea. J. Eat. Disord. 2021, 9, 30. [Google Scholar] [CrossRef] [PubMed]
  24. Prentice, R.L.; Aragaki, A.K.; Howard, B.V.; Chlebowski, R.T.; Thomson, C.A.; Van Horn, L.; Tinker, L.F.; Manson, J.E.; Anderson, G.L.; Kuller, L.E.; et al. Low-fat dietary pattern among postmenopausal women influences long-term cancer, cardiovascular disease, and diabetes outcomes. J. Nutr. 2019, 149, 1565–1574. [Google Scholar] [CrossRef] [PubMed]
  25. Noll, P.R.E.S.; Campos, C.A.S.; Leone, C.; Zangirolami-Raimundo, J.; Noll, M.; Baracat, E.; Júnior, J.M.S.; Sorpreso, I.C.E. Dietary intake and menopausal symptoms in postmenopausal women: A systematic review. Climacteric 2021, 24, 128–138. [Google Scholar] [CrossRef] [PubMed]
  26. Foster-Schubert, K.E.; Alfano, C.M.; Duggan, C.R.; Xiao, L.; Campbell, K.L.; Kong, A.; Bain, C.E.; Wang, C.Y.; Blackburn, G.L.; McTiernan, A. Effect of diet and exercise, alone or combined, on weight and body composition in overweight-to-obese postmenopausal women. Obesity 2012, 20, 1628–1638. [Google Scholar] [CrossRef] [PubMed]
  27. Marra, M.; Migliardi, A.; Costa, G. Health inequalities and nutrition in Italy during crisis times. Epidemiol. Prev. 2015, 39, 322–331. [Google Scholar] [PubMed]
  28. Bruggink, J.W.; de Goeij, M.C.; Otten, F.; Kunst, A.E. Changes between pre-crisis and crisis period in socioeconomic inequalities in health and stimulant use in Netherlands. Eur. J. Public Health 2016, 26, 772–777. [Google Scholar] [CrossRef]
  29. Hoveling, L.A.; Liefbroer, A.C.; Bültmann, U.; Smidt, N. Socioeconomic differences in metabolic syndrome development: Examining the mediating role of chronic stress using the Lifelines Cohort Study. BMC Public Health 2022, 22, 261. [Google Scholar] [CrossRef]
  30. Follis, S.L.; Bea, J.; Klimentidis, Y.; Hu, C.; Crandall, C.; Garcia, D.O.; Shadyab, A.H.; Nassir, R.; Chen, Z. Psychosocial stress and bone loss among postmenopausal women: Results from the Women’s Health Initiative. J. Epidemiol. Community Health 2019, 73, 888–892. [Google Scholar] [CrossRef]
Figure 1. Flowchart depicting the selection process of study participants.
Nutrients 16 00967 g001
Figure 2. Analysis of metabolic syndrome (MetS) risk in postmenopausal women relative to nutrient intake. A forest plot. Abbreviations: CHO, carbohydrate; PRT, protein; SFA, saturated fatty acids; PUSFA, polyunsaturated fatty acids; n-3, omega-3 fatty acids; SUG, sugar; Ca, calcium; P, phosphate; Fe, iron; Na, sodium; VitA, vitamin A; beta-CAR, beta-carotene; ROL, retinol; VitB1, vitamin B1; VitB2, vitamin B2. Blue squares indicate adjusted odds ratio (OR) values, while red lines represent 95% confidence interval (CI) values.
Nutrients 16 00967 g002
Table 1. Health-associated and socioeconomic characteristics of the participants by menopausal status.
Premature Menopause
(N = 761)
Natural Menopause
(N = 31,038)
p (1)
Age at current (2)56.114 ± 9.85057.276 ± 4.365<0.0001
Age at menopause36.223 ± 2.70950.622 ± 3.252<0.0001
N (%)
Age at current <0.0001
15 ≤ age < 3022 (2.89%)0 (0.00%)
30 ≤ age < 4053 (6.96%)0 (0.00%)
40 ≤ age < 50104 (13.67%)1675 (5.40%)
50 ≤ age < 65582 (76.48%)29,363 (94.60%)
Age at menopause <0.0001
age < 50761 (100.00%)9761 (31.45%)
50 ≤ age < 600 (0.00%)21,277 (68.55%)
Income level 0.0003
Low23 (3.02%)3446 (11.10%)
Low-middle183 (24.05%)5385 (17.35%)
Middle-high390 (51.25%)8308 (26.77%)
High165 (21.68%)13,899 (44.78%)
Education <0.0001
≤Elementary school311 (40.87%)2622 (8.45%)
Middle school86 (11.30%)4453 (14.35%)
High school252 (33.11%)13,345 (43.00%)
≥College112 (14.72%)10,618 (34.21%)
Heavy alcohol drinking 0.0019
Yes37 (4.86%)909 (2.93%)
No724 (95.14%)30,129 (97.07%)
Current smoking <0.0001
Yes71 (9.33%)679 (2.19%)
No690 (90.67%)30,359 (97.81%)
Walking <0.0001
<5 days/week534 (70.17%)17,293 (55.86%)
≥5 days/week227 (29.83%)13,664 (44.14%)
Leisure-related physical activities (moderate-intensity) <0.0001
Yes261 (34.30%)7810 (25.16%)
No500 (65.70%)23,228 (74.84%)
Self-assessment of health <0.0001
Good130 (17.08%)8609 (27.74%)
Moderate382 (50.20%)16889 (54.41%)
Poor249 (32.72%)5540 (17.85%)
(1) Different between two groups at α = 0.05 by Mantel–Haenszel chi-square test; (2) means ± standard deviation.
Table 2. Anthropometric characteristics of the participants by menopausal status.
Premature Menopause
(N = 761)
Natural Menopause
(N = 31,038)
p (1)
Height (cm) (2)157.493 ± 6.793157.070 ± 5.6440.0424
Weight (kg)57.500 ± 8.08758.177 ± 8.1690.0238
Waist circumference (cm)78.627 ± 6.85180.999 ± 8.238<0.0001
Body mass index (kg/m2)23.171 ± 2.96723.584 ± 3.1530.0003
(1) Different between two groups at α = 0.05 by ANCOVA test; (2) means ± standard deviation.
Table 3. Prevalence of metabolic syndrome components of the participants by menopausal status.
Premature Menopause
(N = 761)
Natural Menopause
(N = 31,038)
N (%)p (1)
Obesity <0.0001
Yes149 (19.58%)9564 (30.81%)
No612 (80.42%)21,474 (69.19%)
HyperTG (2) <0.0001
Yes260 (34.17%)7441 (23.97%)
No501 (65.83%)23,597 (76.03%)
Diabetes <0.0001
Yes198 (26.02%)11,027 (35.53%)
No563 (73.98%)20,011 (64.47%)
HyperCHL (3) <0.0001
Yes100 (13.14%)6889 (22.20%)
No661 (86.86%)24,149 (77.80%)
Hypertension 0.0145
Yes238 (31.27%)8466 (27.28%)
No523 (68.73%)22,572 (72.72%)
HDL-cholesterol <0.0001
≥50379 (49.80%)19,633 (63.25%)
<50382 (50.20%)11,405 (36.75%)
Metabolic diagnosis <0.0001
≤3609 (80.03%)28,052 (90.38%)
>3152 (19.97%)2986 (9.62%)
(1) Different between two groups at α = 0.05 by Mantel–Haenszel chi-square test; (2) HyperTG, hypertriglyceridemia; (3) HyperCHL, hypercholesterolemia.
Table 4. Daily average nutrient intake of the participants by menopausal status.
Premature Menopause
(N = 761)
Natural Menopause
(N = 31,038)
p (1)
Energy (Kcal) (2)1874.628 ± 21.7881738.942 ± 3.413<0.0001
Water (g)1113.319 ± 14.8071146.723 ± 2.3180.0258
Carbohydrate (g)281.359 ± 1.687267.280 ± 0.264<0.0001
Protein (g)60.367 ± 0.55666.557 ± 0.087<0.0001
Fat (g)43.600 ± 0.60244.299 ± 0.0940.2519
SFA (g) (3)14.309 ± 0.24613.247 ± 0.038<0.0001
MUSFA (g) (4)13.594 ± 0.24414.001 ± 0.0380.0995
PUSFA (g) (5)11.621 ± 0.19412.315 ± 0.0300.0004
n-3 Fatty acid (g)1.698 ± 0.0542.150 ± 0.009<0.0001
n-6 Fatty acid (g)9.905 ± 0.16810.139 ± 0.0260.1673
Cholesterol (mg)233.549 ± 5.412242.466 ± 0.8470.1036
Fiber (g)34.776 ± 0.36529.790 ± 0.057<0.0001
Sugar (g)81.072 ± 1.09363.613 ± 0.171<0.0001
Calcium (mg)540.839 ± 7.113517.873 ± 1.1140.0014
Phosphorus (mg)1151.231 ± 7.9611067.583 ± 1.245<0.0001
Iron (mg)9.275 ± 0.1479.958 ± 0.023<0.0001
Sodium (mg)2173.107 ± 49.3233320.482 ± 7.723<0.0001
Potassium (mg)3043.785 ± 33.1093075.978 ± 5.1840.3368
Vitamin A (μg RAE (6))385.004 ± 18.250477.881 ± 2.857<0.0001
β-Carotene (μg)2403.778 ± 118.1023887.748 ± 18.491<0.0001
Retinol (μg)184.655 ± 14.029153.783 ± 2.1960.0297
Thiamin (mg)1.185 ± 0.0141.053 ± 0.002<0.0001
Riboflavin (mg)1.449 ± 0.0181.552 ± 0.003<0.0001
Niacin (mg)11.440 ± 0.14111.475 ± 0.0220.8106
Folate (μg DFE (7))352.823 ± 4.556354.893 ± 0.7130.6536
Vitamin C (mg)77.730 ± 2.48680.035 ± 0.3890.3597
Energy distribution
%Carbohydrate63.909 ± 0.35661.960 ± 0.056<0.0001
%Protein13.981 ± 0.13015.395 ± 0.020<0.0001
%Fat22.110 ± 0.29622.645 ± 0.0460.0741
(1) Different between two groups at α = 0.05 by ANCOVA test adjusted for age, BMI, and energy (except energy); (2) Age, BMI, and energy (except energy)-adjusted least squares means (LSmeans); (3) SFA, saturated fatty acid; (4) MUSFA, monosaturated fatty acid; (5) PUSFA, polyunsaturated fatty acid; (6) RAE, retinol activity equivalent; (7) DFE, dietary folate equivalent.
Table 5. The association between risk factors and premature menopause.
VariablesPremature Menopause
(N = 761)
p
Adjusted OR (1)95% CI
Body mass index (kg/m2)0.9540.932–0.9780.0002
Income level
Lower-middle1
Middle-high0.2090.122–0.359<0.0001
High0.0090.003–0.023<0.0001
Education
≤Middle school1
≥High school2.4541.726–3.489<0.0001
Heavy alcohol drinking
Yes1.3750.953–1.9840.0885
No1
Current smoking
Yes4.2303.175–5.636<0.0001
No1
Walking
<5 days/week1
≥5 days/week0.6750.572–0.798<0.0001
Leisure-related physical activities (moderate-intensity)
Yes2.2921.946–2.698<0.0001
No1
Self-assessment of health
Good or moderate1
Poor1.1750.854–1.6170.3216
(1) Adjusted for age, BMI, income level, education, alcohol drinking status, current smoking status, walking, leisure-related moderate-intensity physical activities, and self-assessment of health.
Table 6. The association between risk factors and metabolic syndrome in postmenopausal women.
VariablesMetabolic Syndrome
(N = 3138)
p
Adjusted OR (1)95% CI
Body mass index (kg/m2)1.3981.380–1.417<0.0001
Income level
Lower-middle1
Middle-high1.8161.417–2.3270.0470
High2.6791.816–3.951<0.0001
Education
≤Middle school1
≥High school0.7640.637–0.9150.0034
Heavy alcohol drinking
Yes2.6842.148–3.353<0.0001
No1
Current smoking
Yes0.1680.115–0.245<0.0001
No1
Walking
<5 days/week1
≥5 days/week0.5240.479–0.573<0.0001
Leisure-related physical activities (moderate-intensity)
Yes0.5250.464–0.594<0.0001
No1
Self-assessment of health
Good or moderate1
Poor1.2461.050–1.4790.0120
(1) Adjusted for age, BMI, income level, education, alcohol drinking status, current smoking status, walking, leisure-related moderate-intensity physical activities, and self-assessment of health.
Disclaimer/Publisher’s Note: The statements, opinions and data contained in all publications are solely those of the individual author(s) and contributor(s) and not of MDPI and/or the editor(s). MDPI and/or the editor(s) disclaim responsibility for any injury to people or property resulting from any ideas, methods, instructions or products referred to in the content.

