
Pre-Diagnosis Diet Predicts Response to Exclusive Enteral Nutrition and Correlates with Microbiome in Pediatric Crohn Disease

 , , , ,
  , and
on behalf of the Canadian Children IBD Networkadd
Show full author list
, and
on behalf of the Canadian Children IBD Networkadd
Show full author list
Abstract

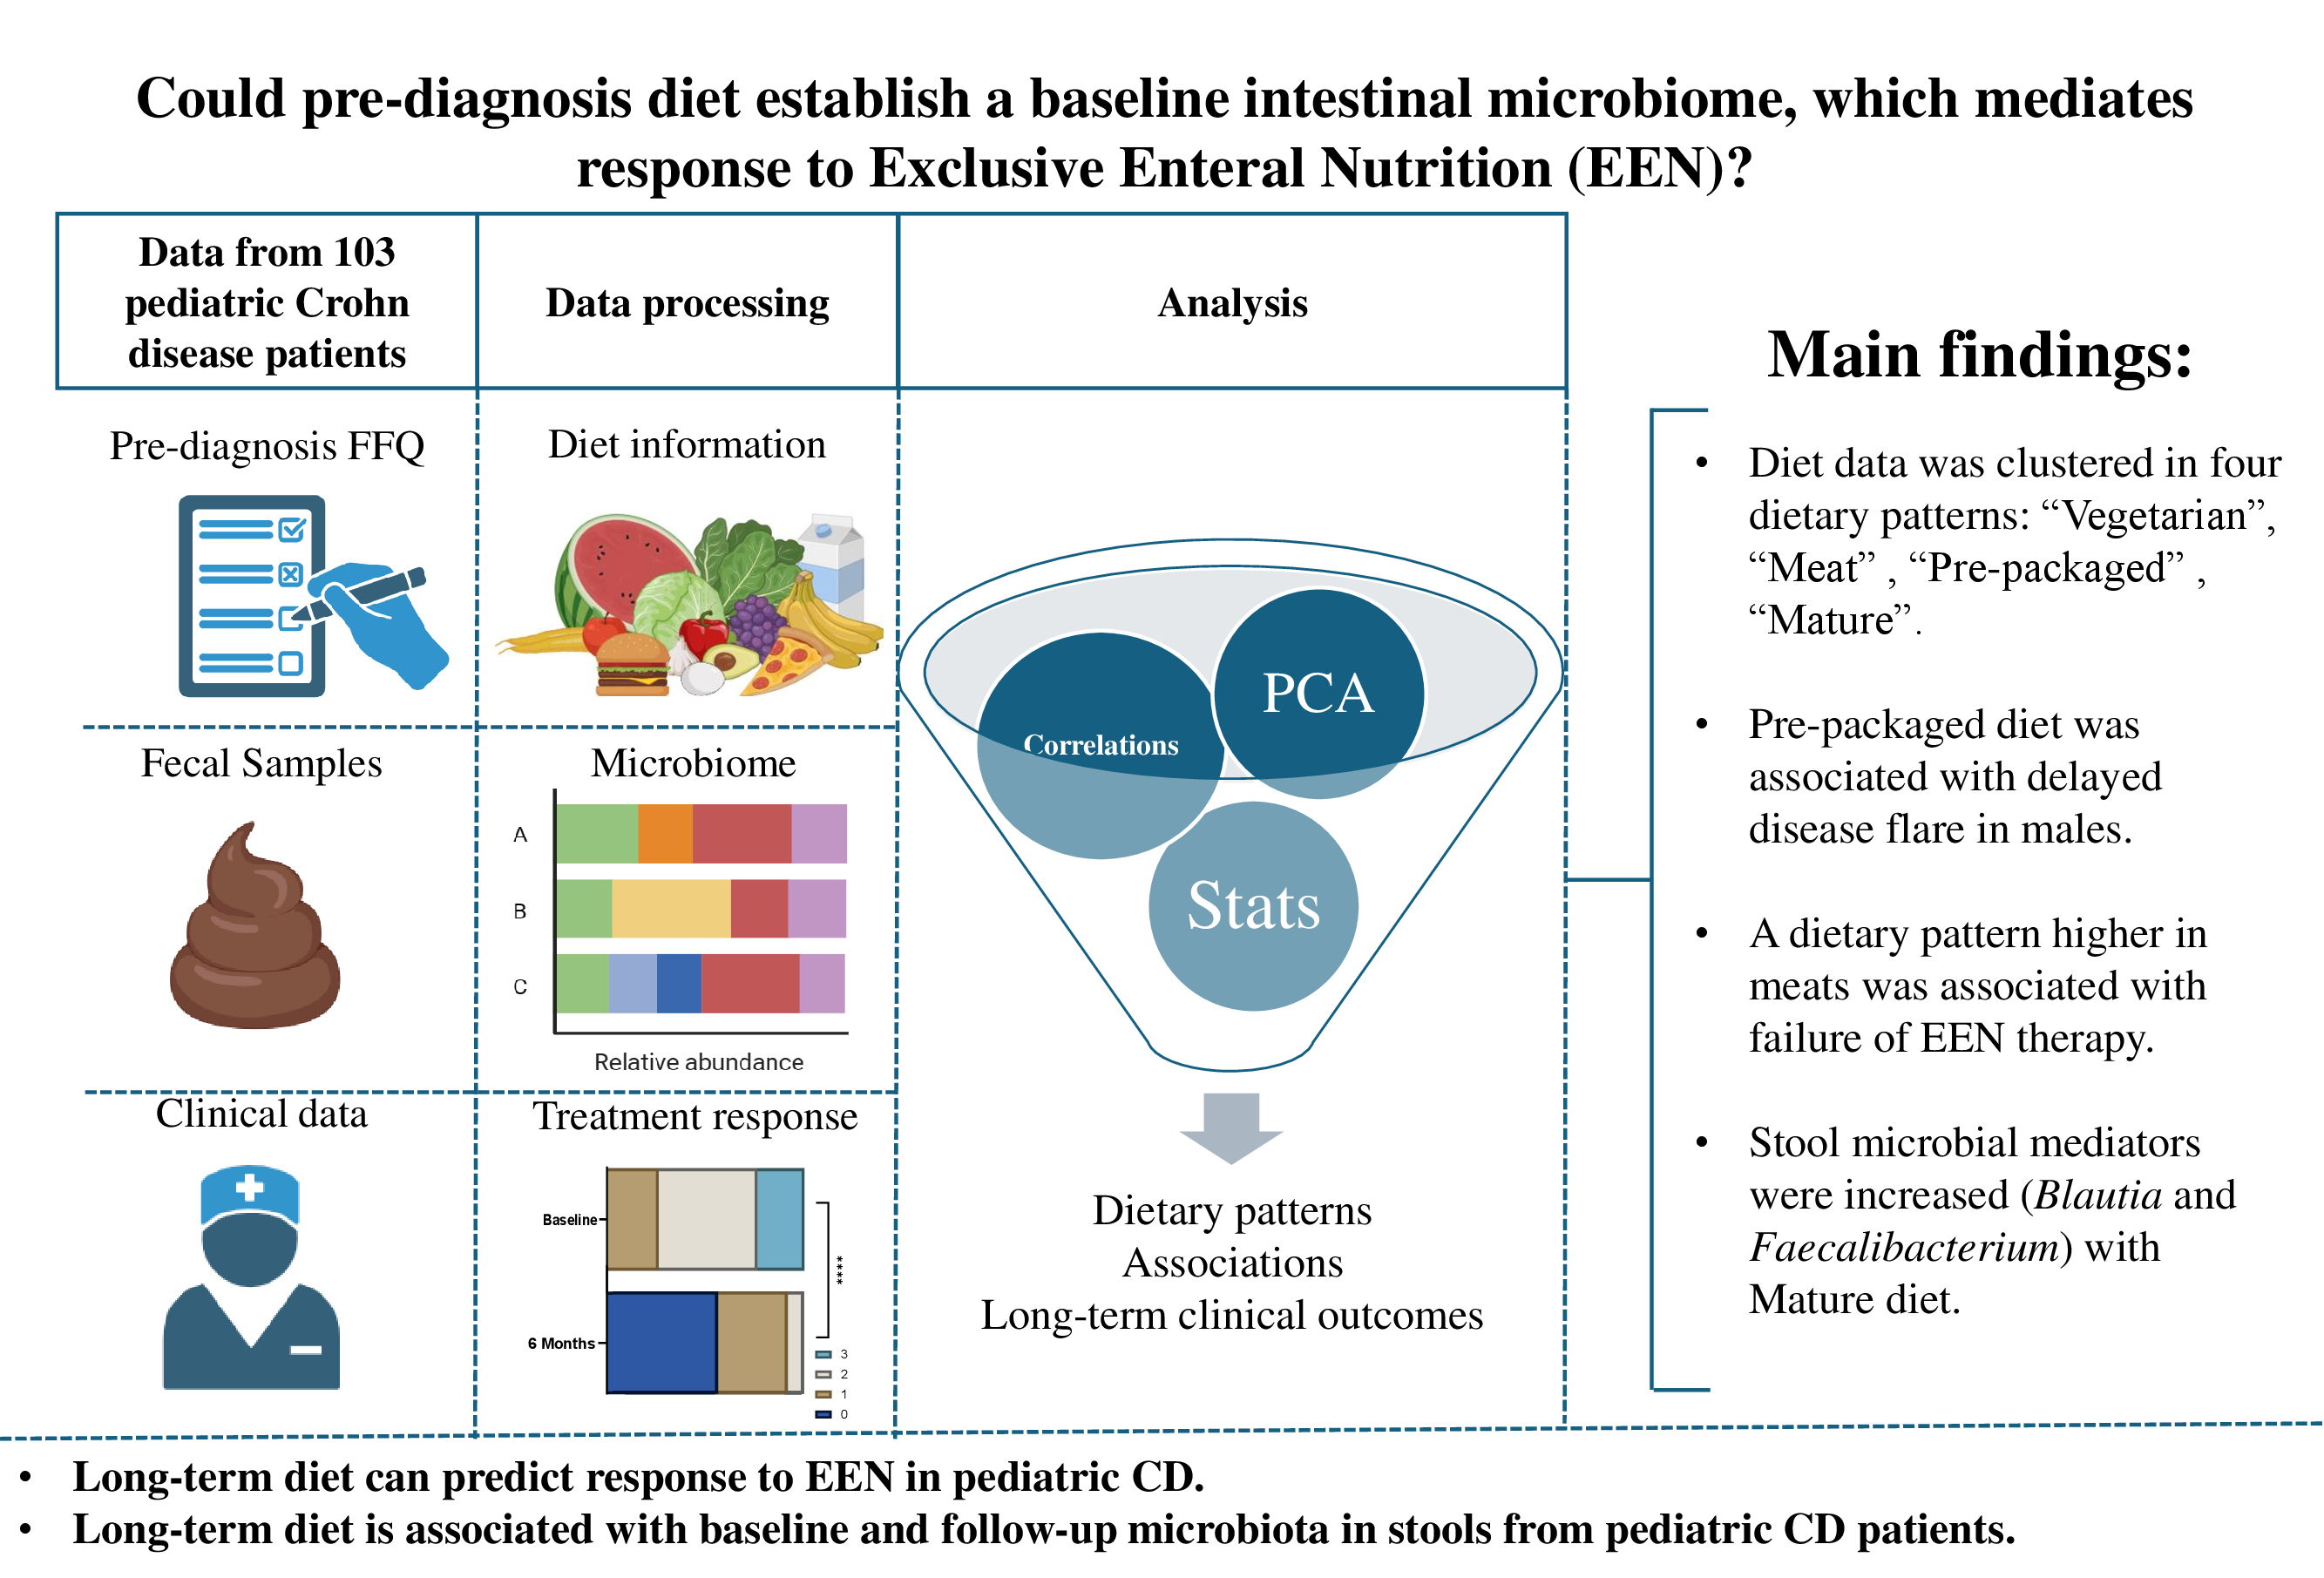
1. Introduction
2. Materials and Methods
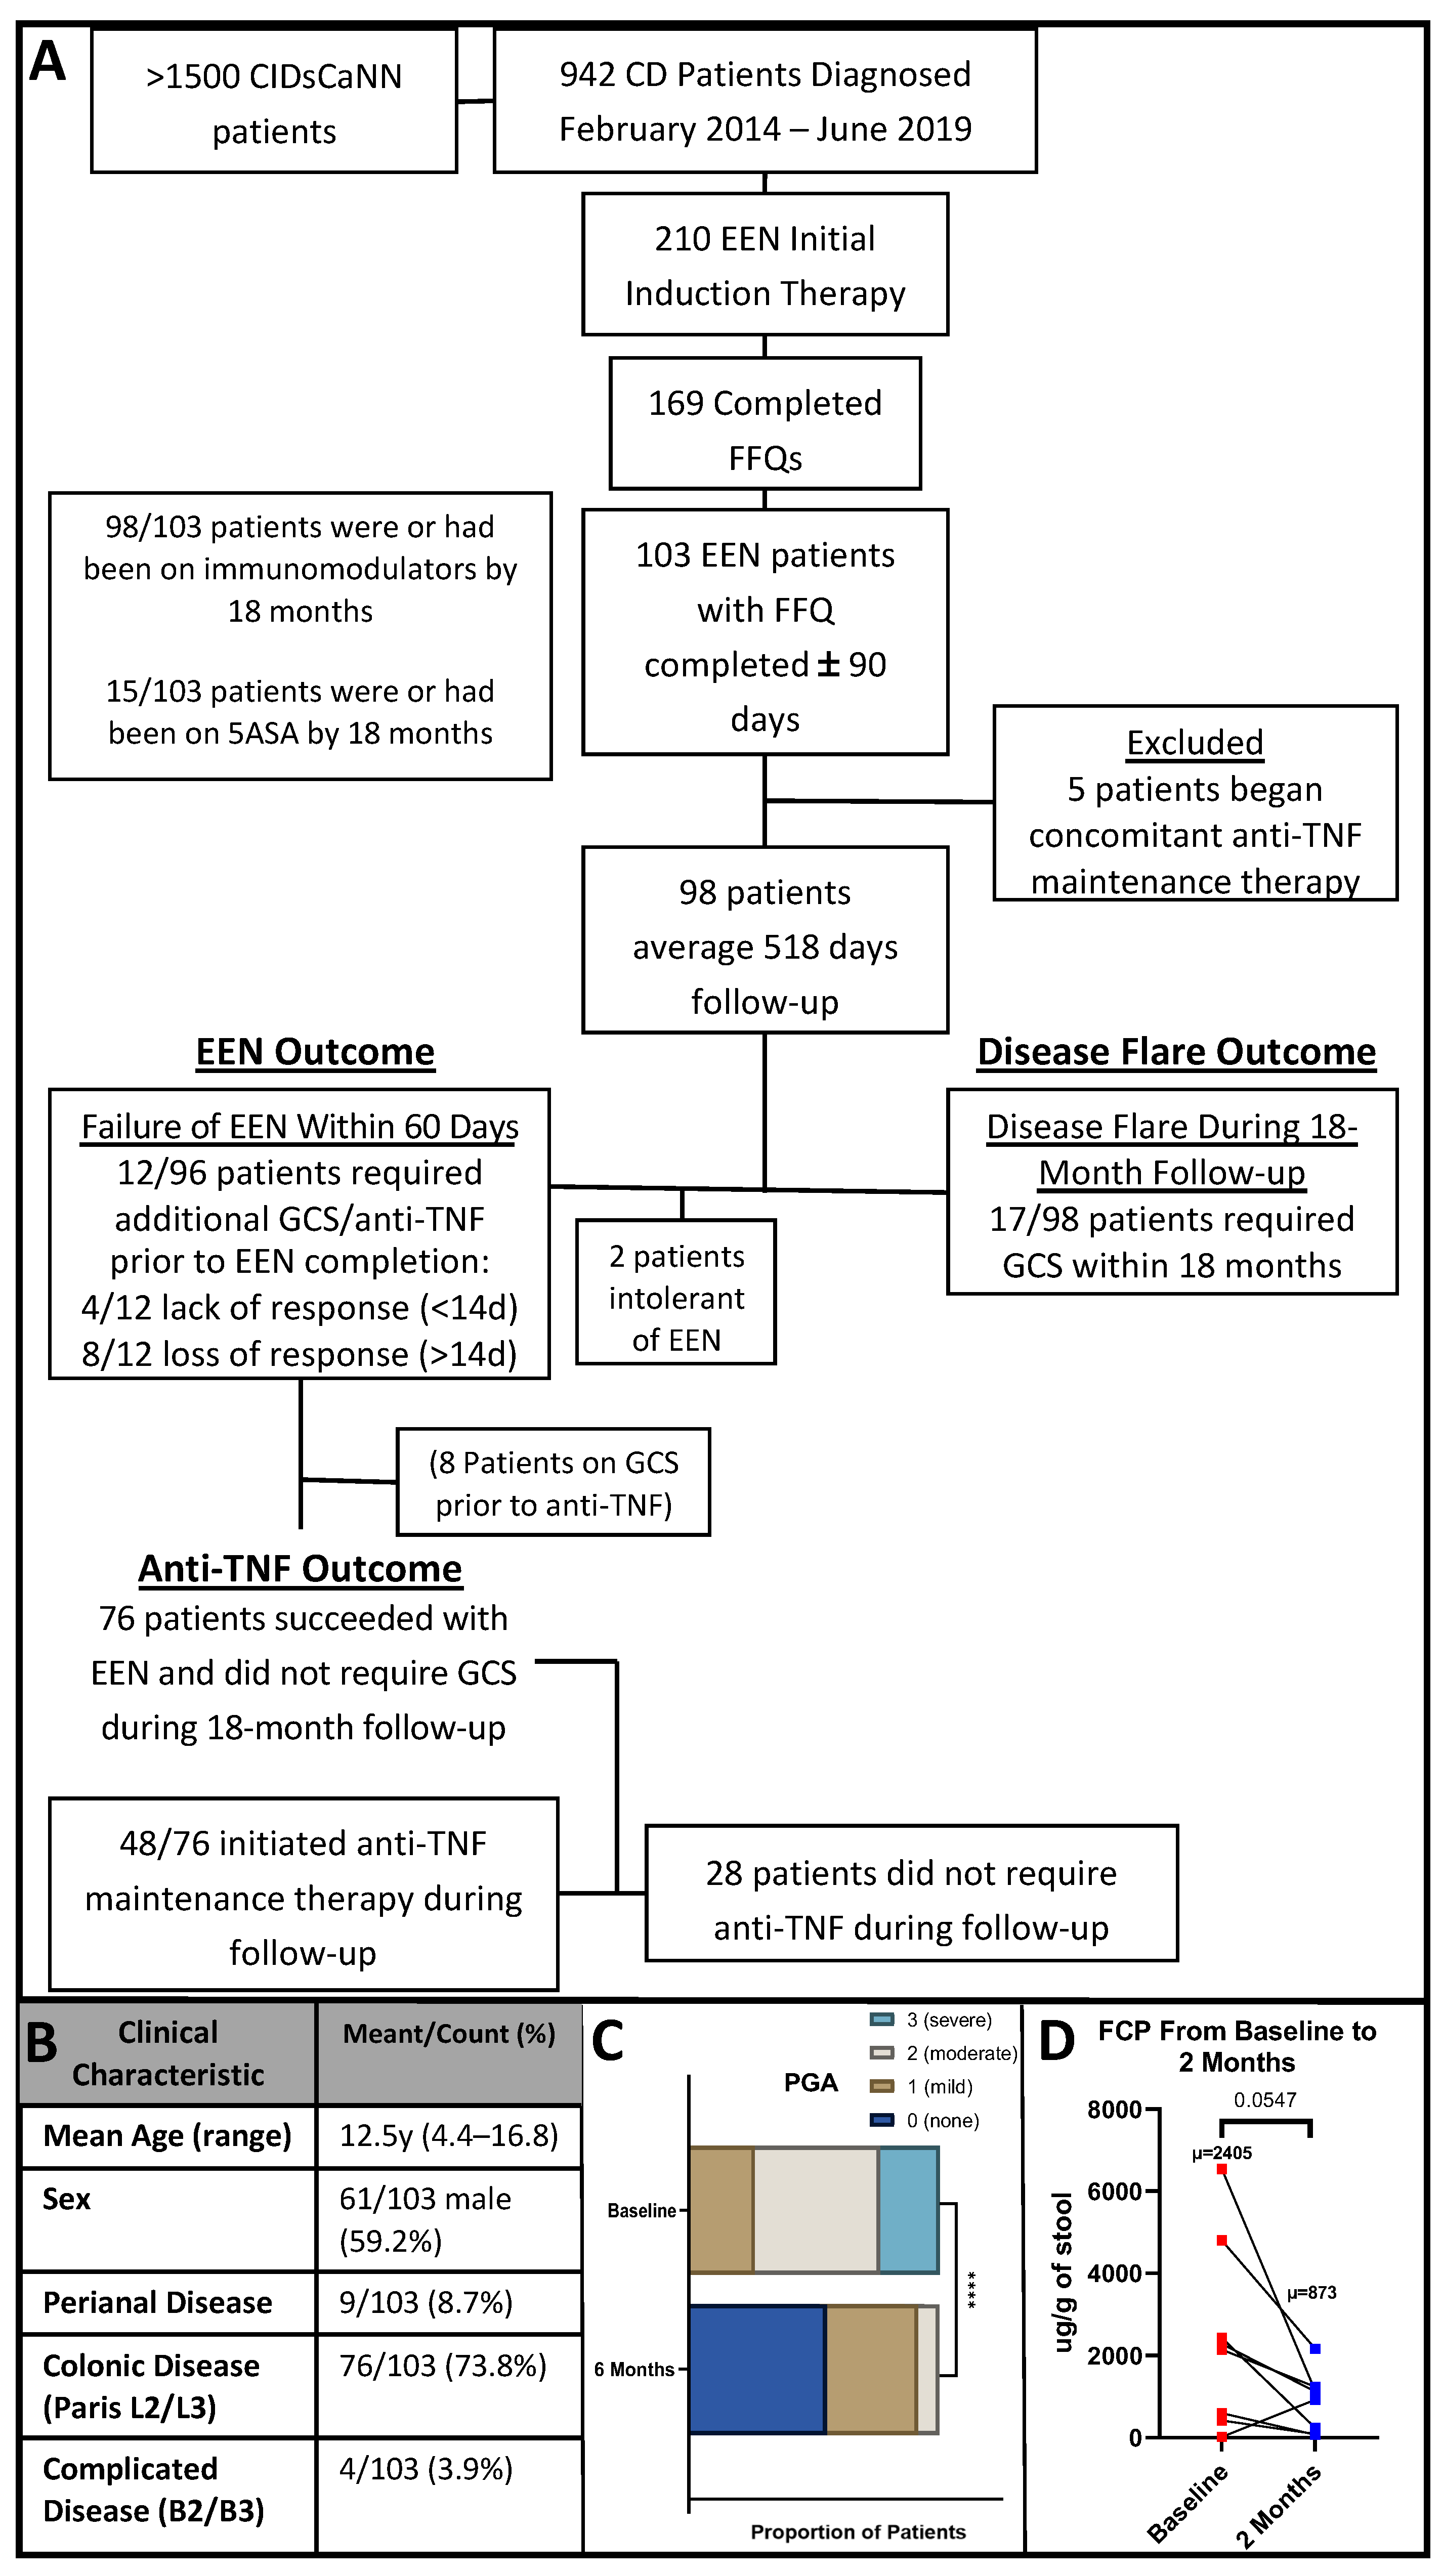
2.1. Setting and Participants
2.2. Patient and Public Engagement
2.3. Study Design
2.4. Clinical Outcomes of Interest
2.5. Fecal Microbiome 16s rRNA Sequencing Analysis
2.6. Statistical Analysis
3. Results
3.1. Patient Clinical Characteristics
3.2. Dietary Pattern Associations with Patient Features
Dietary Pattern Analysis
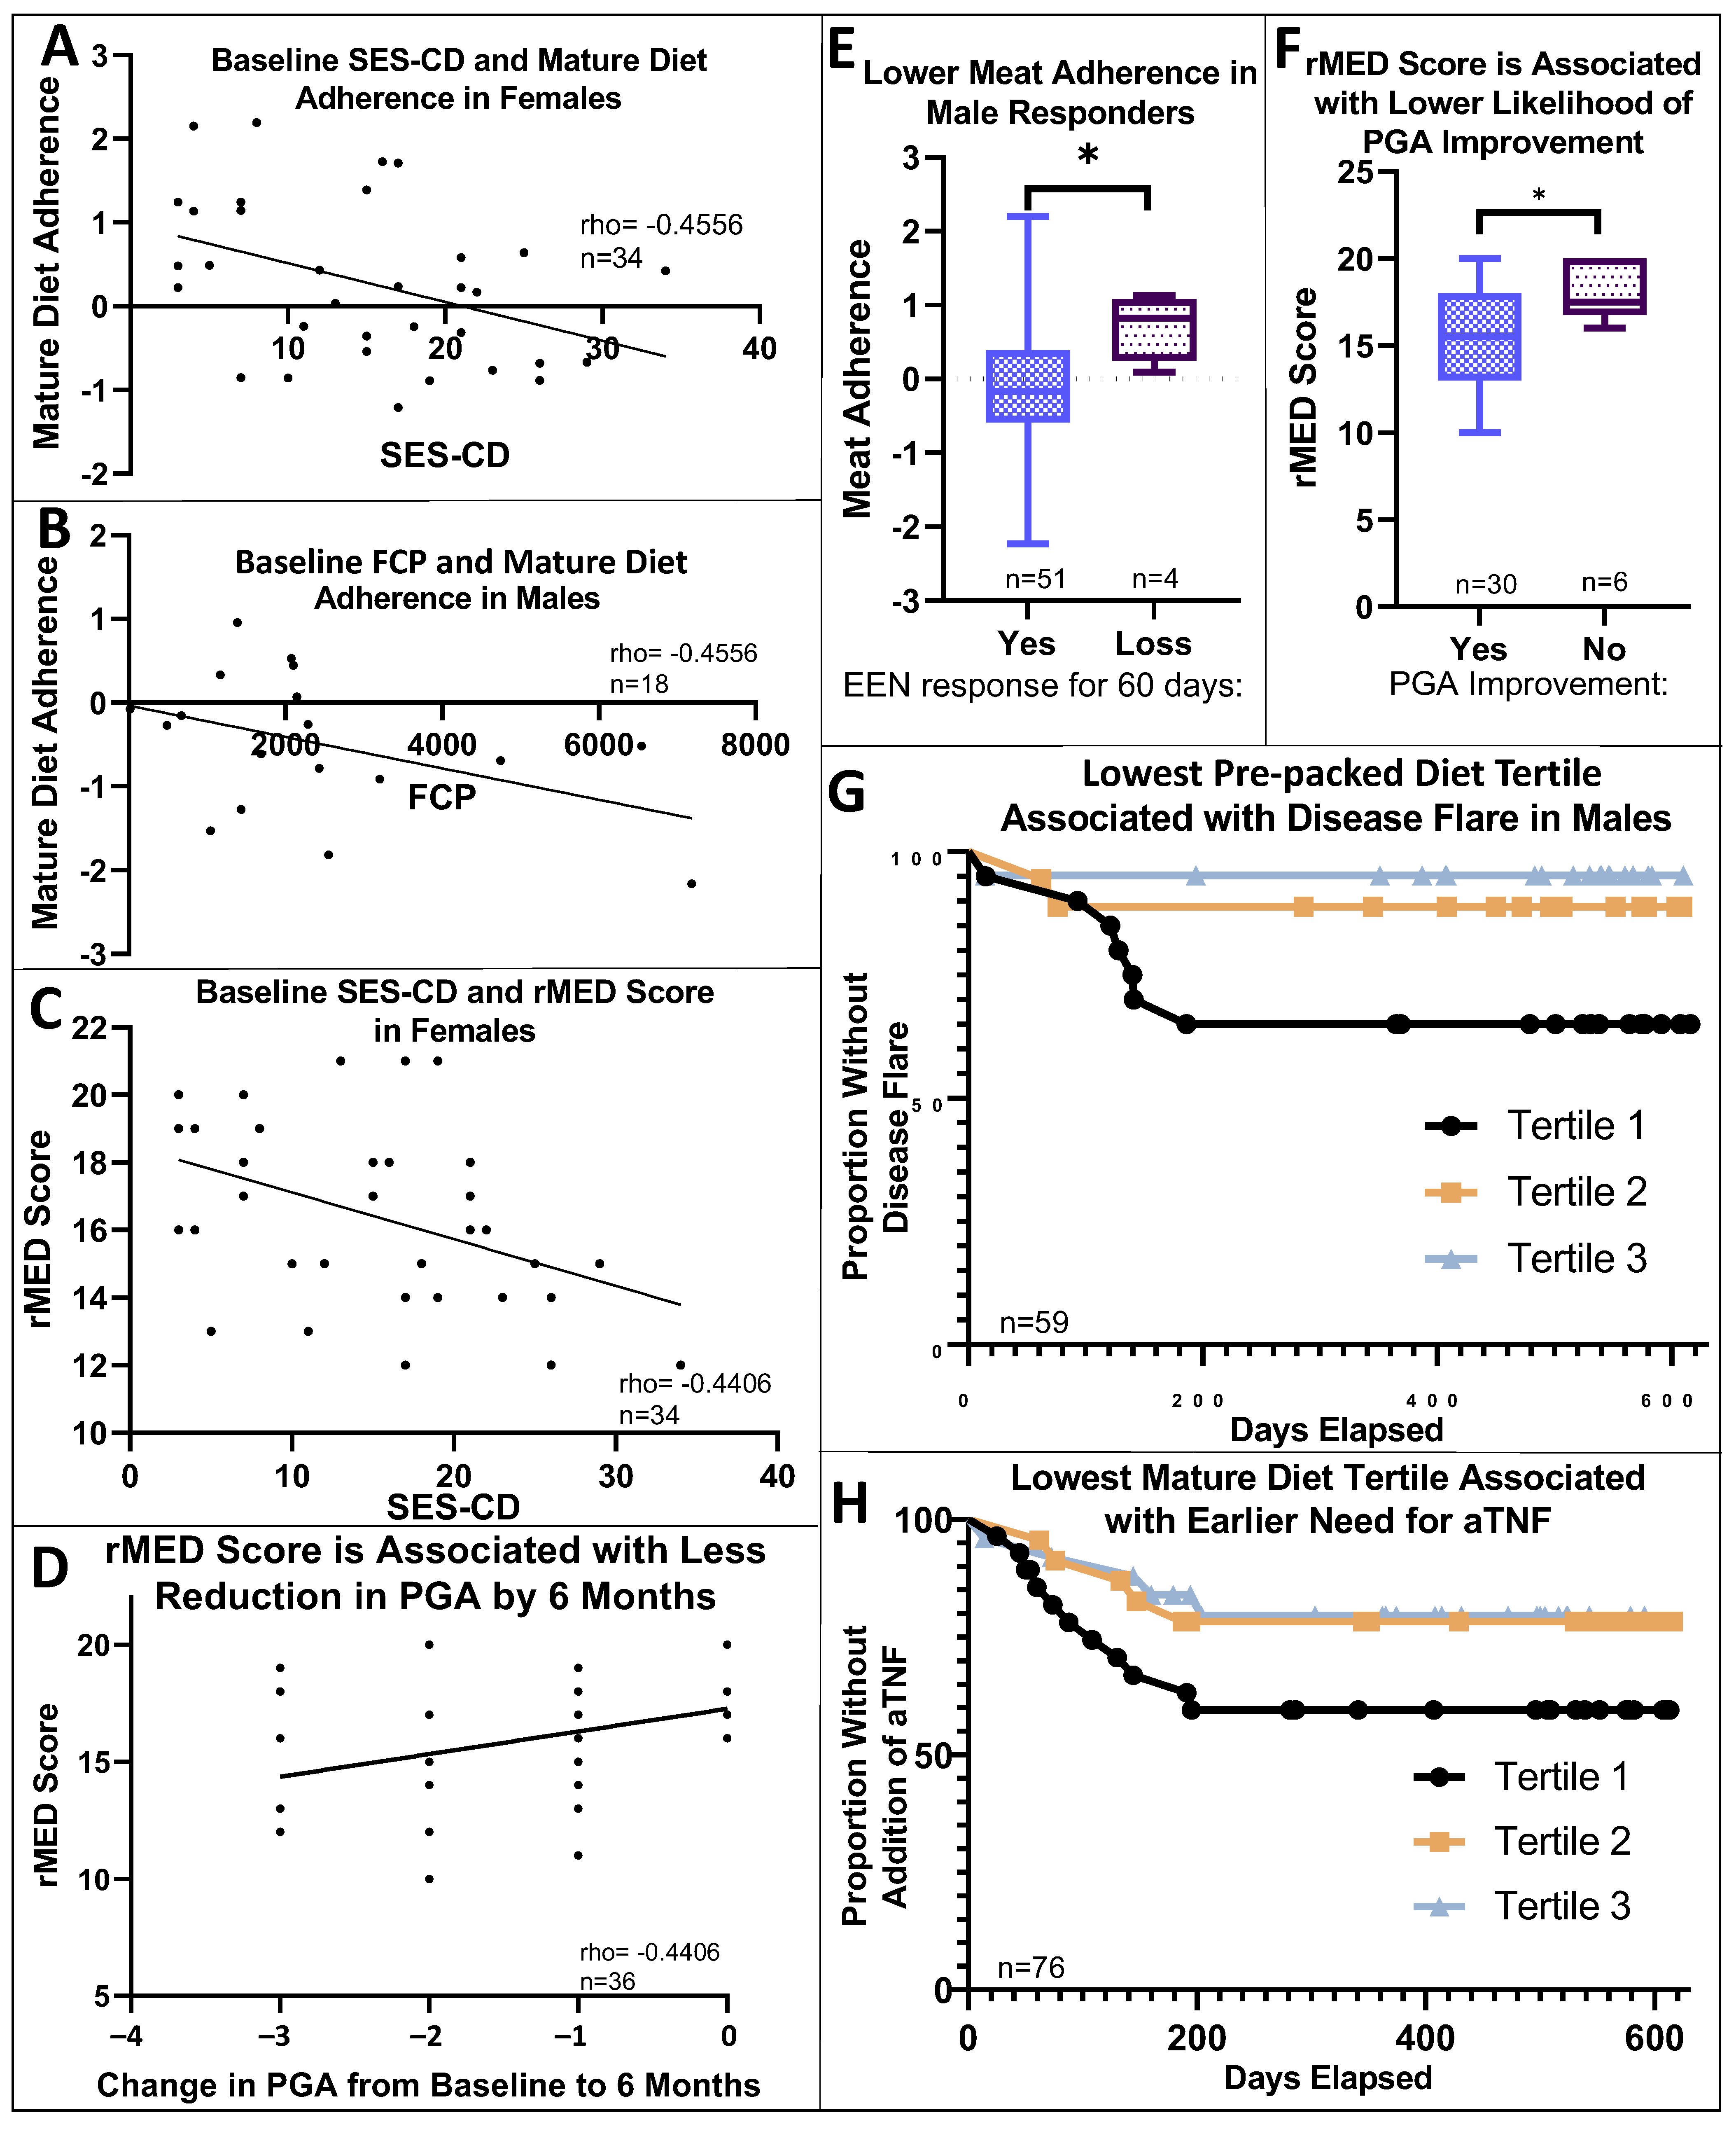
3.3. Dietary Pattern Associations with Clinical Outcomes
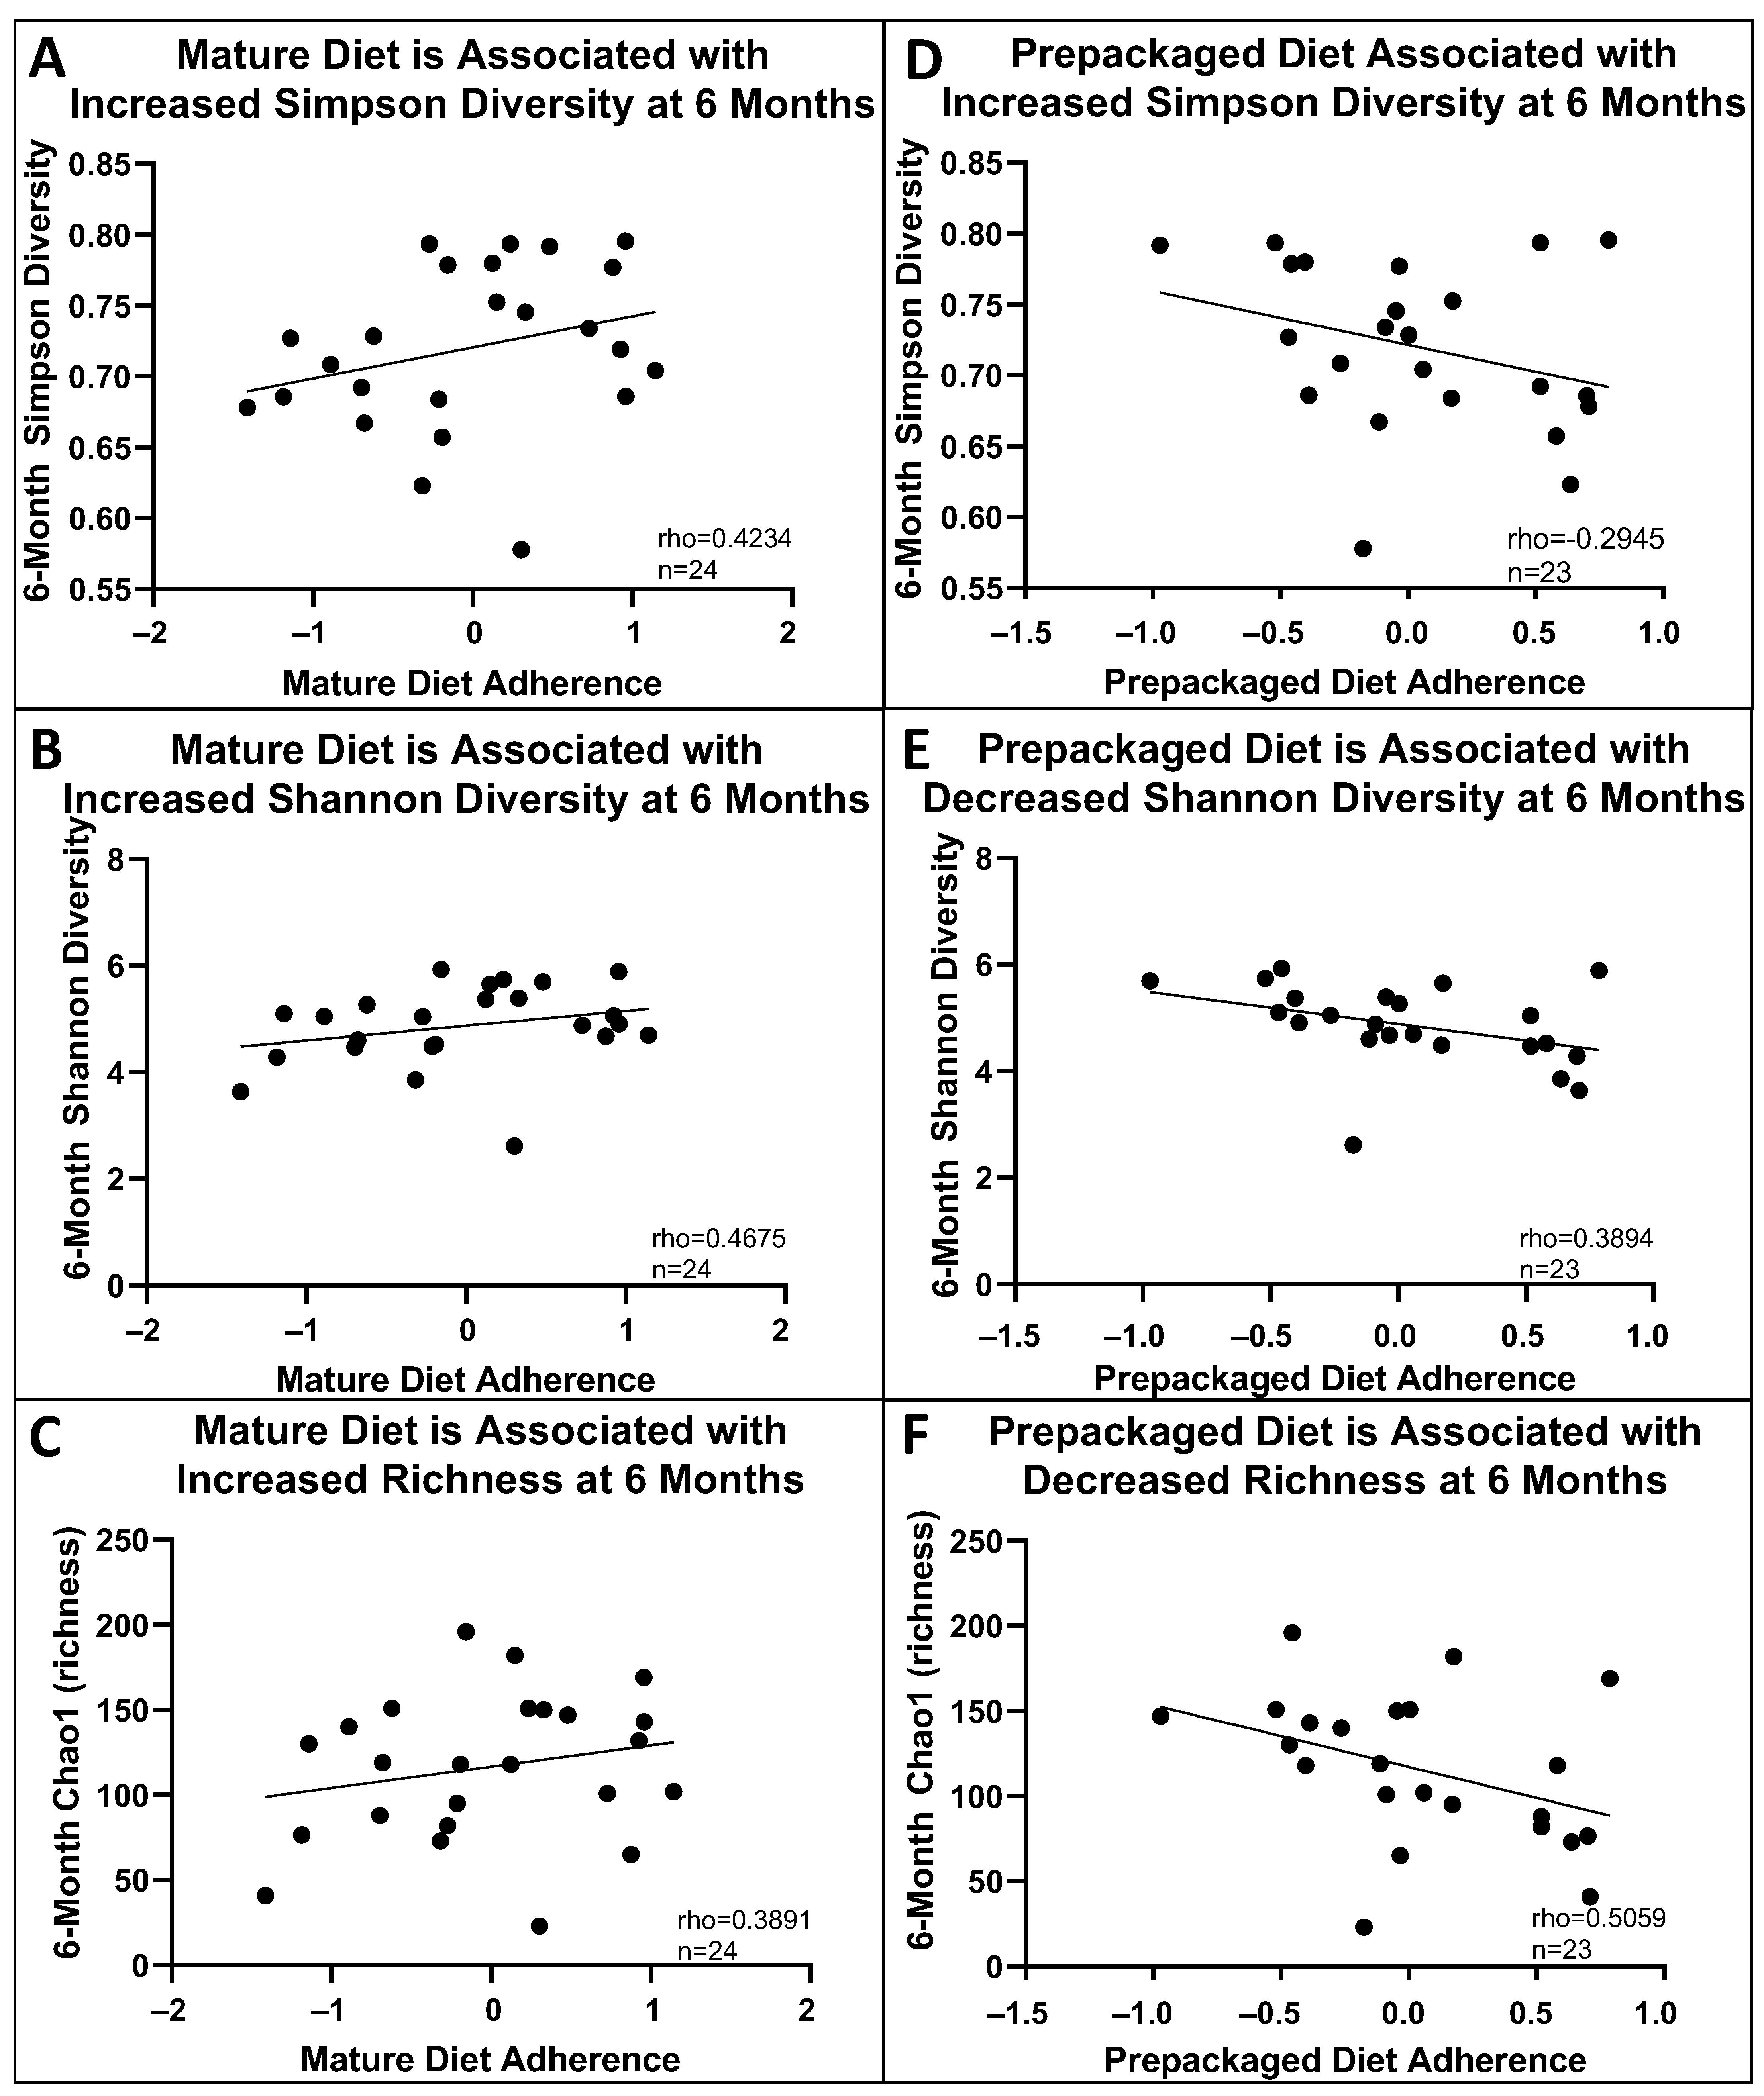
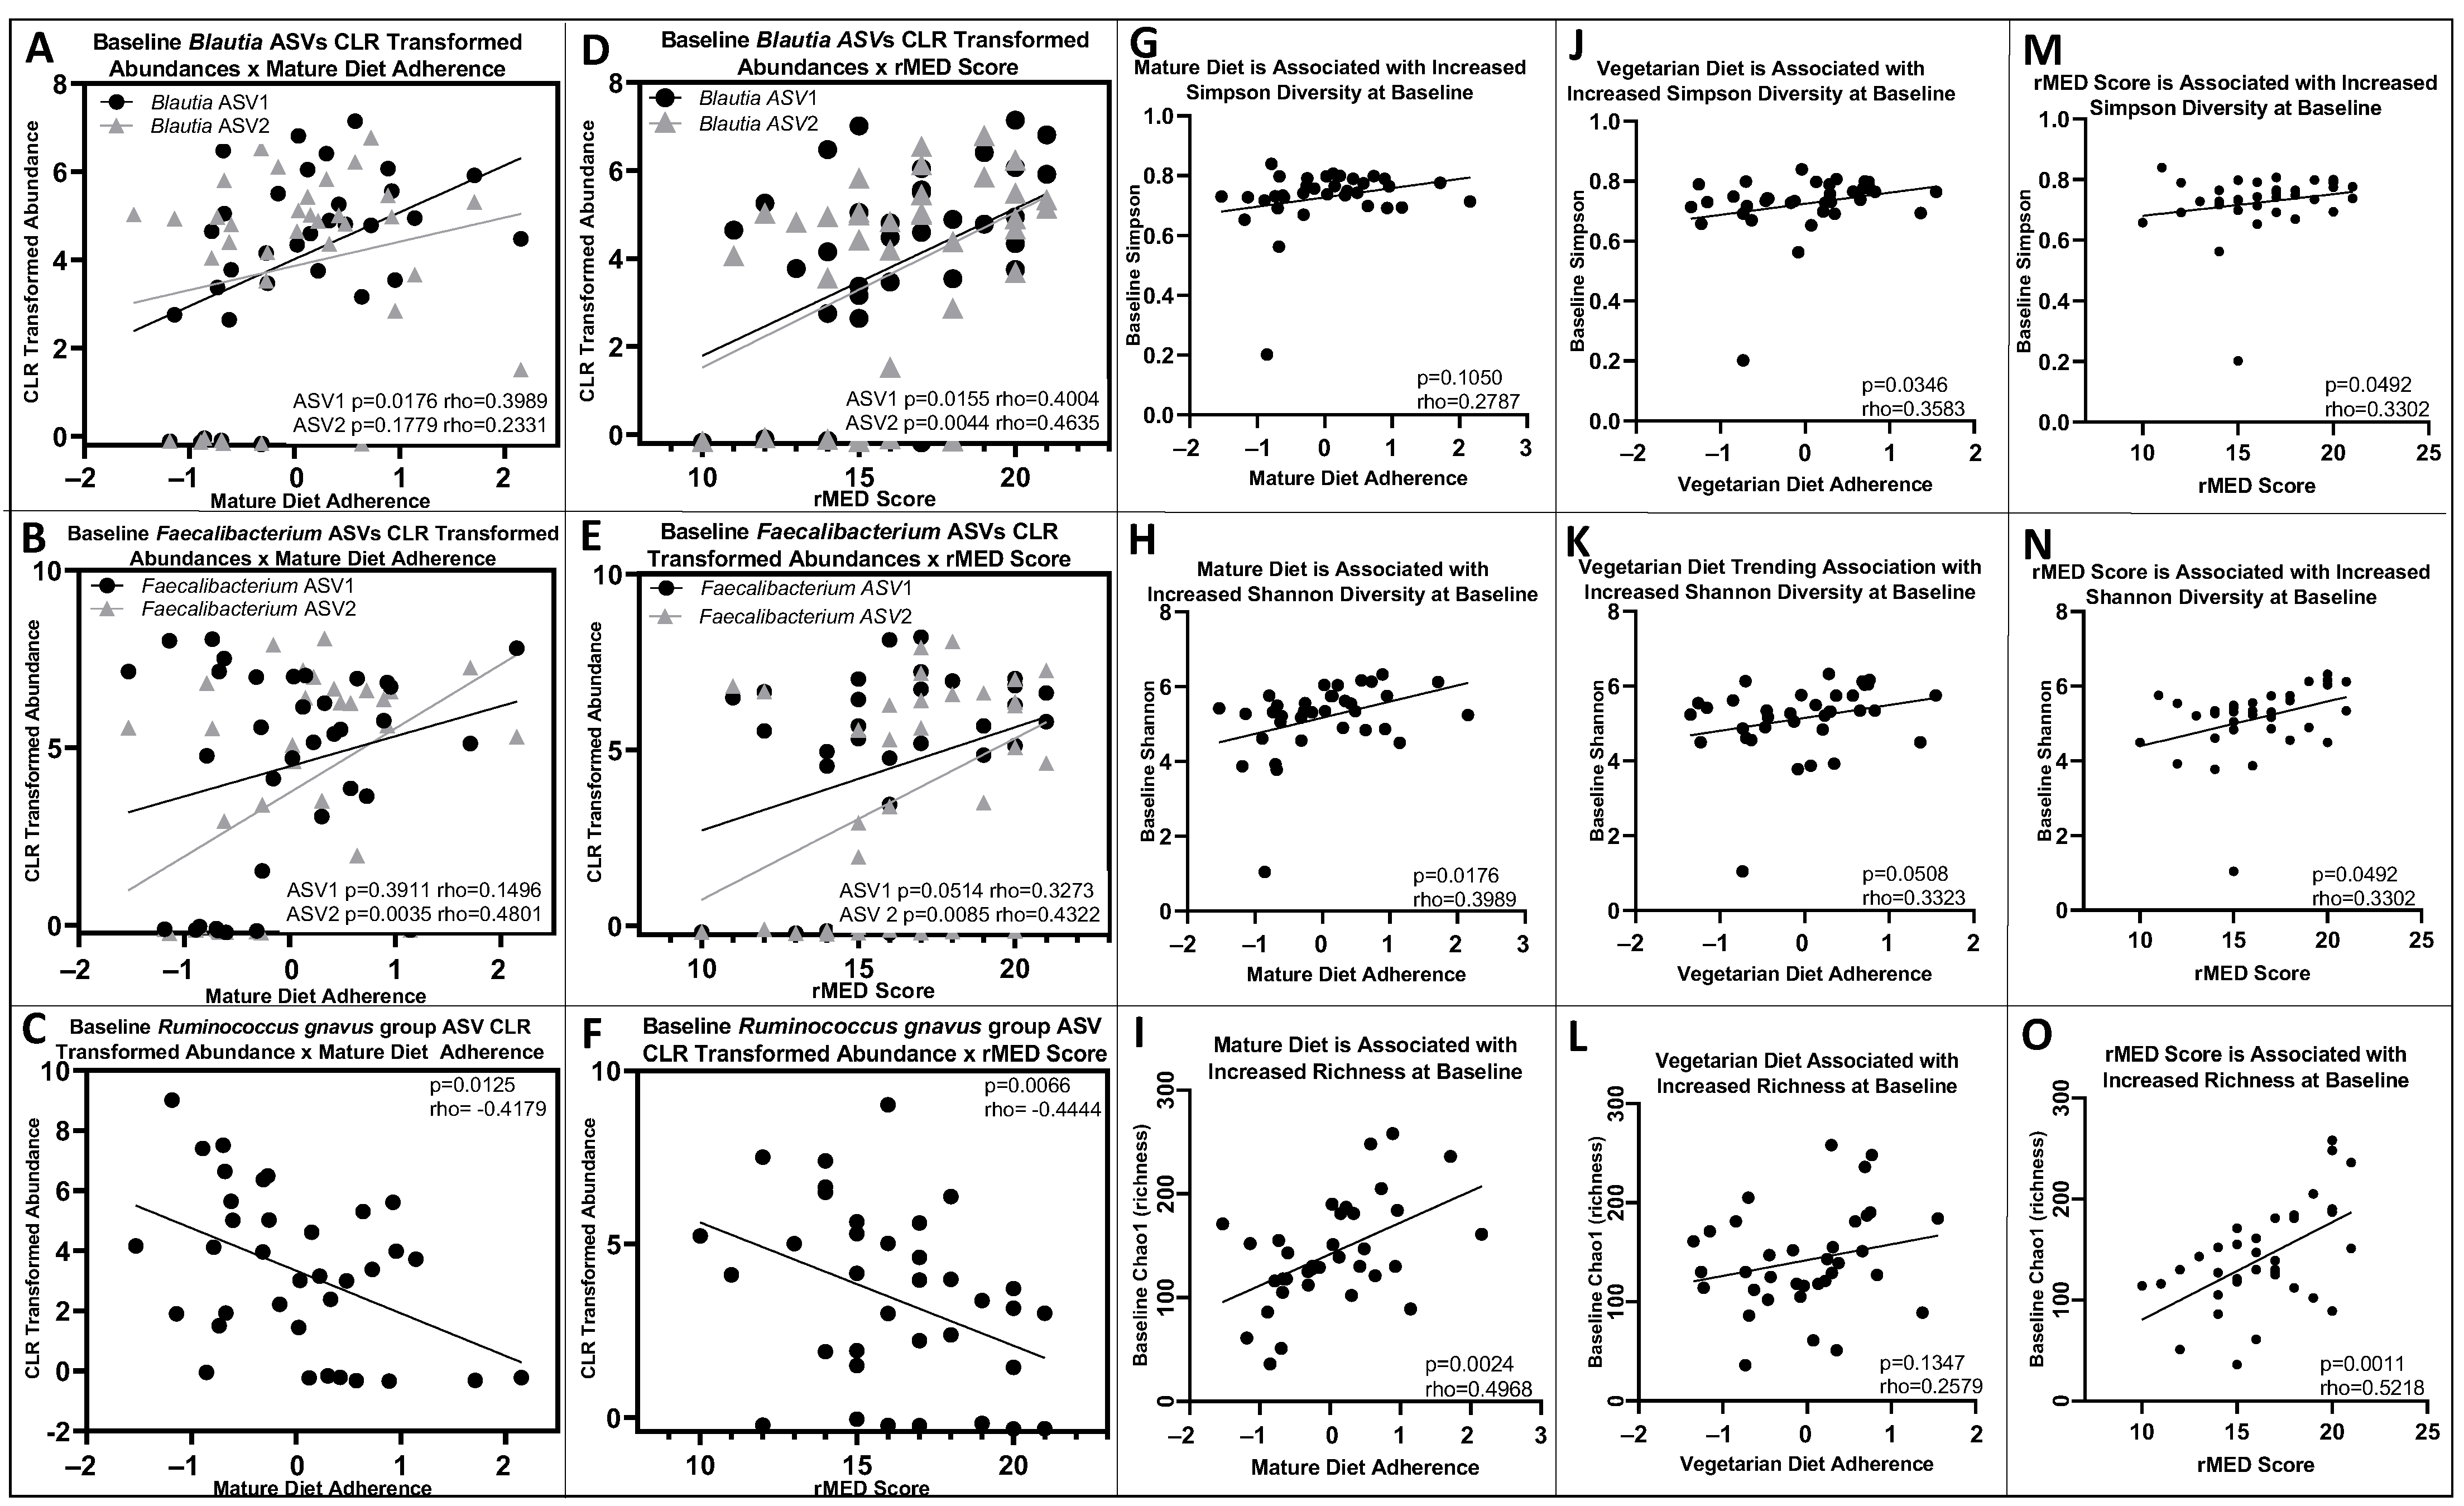
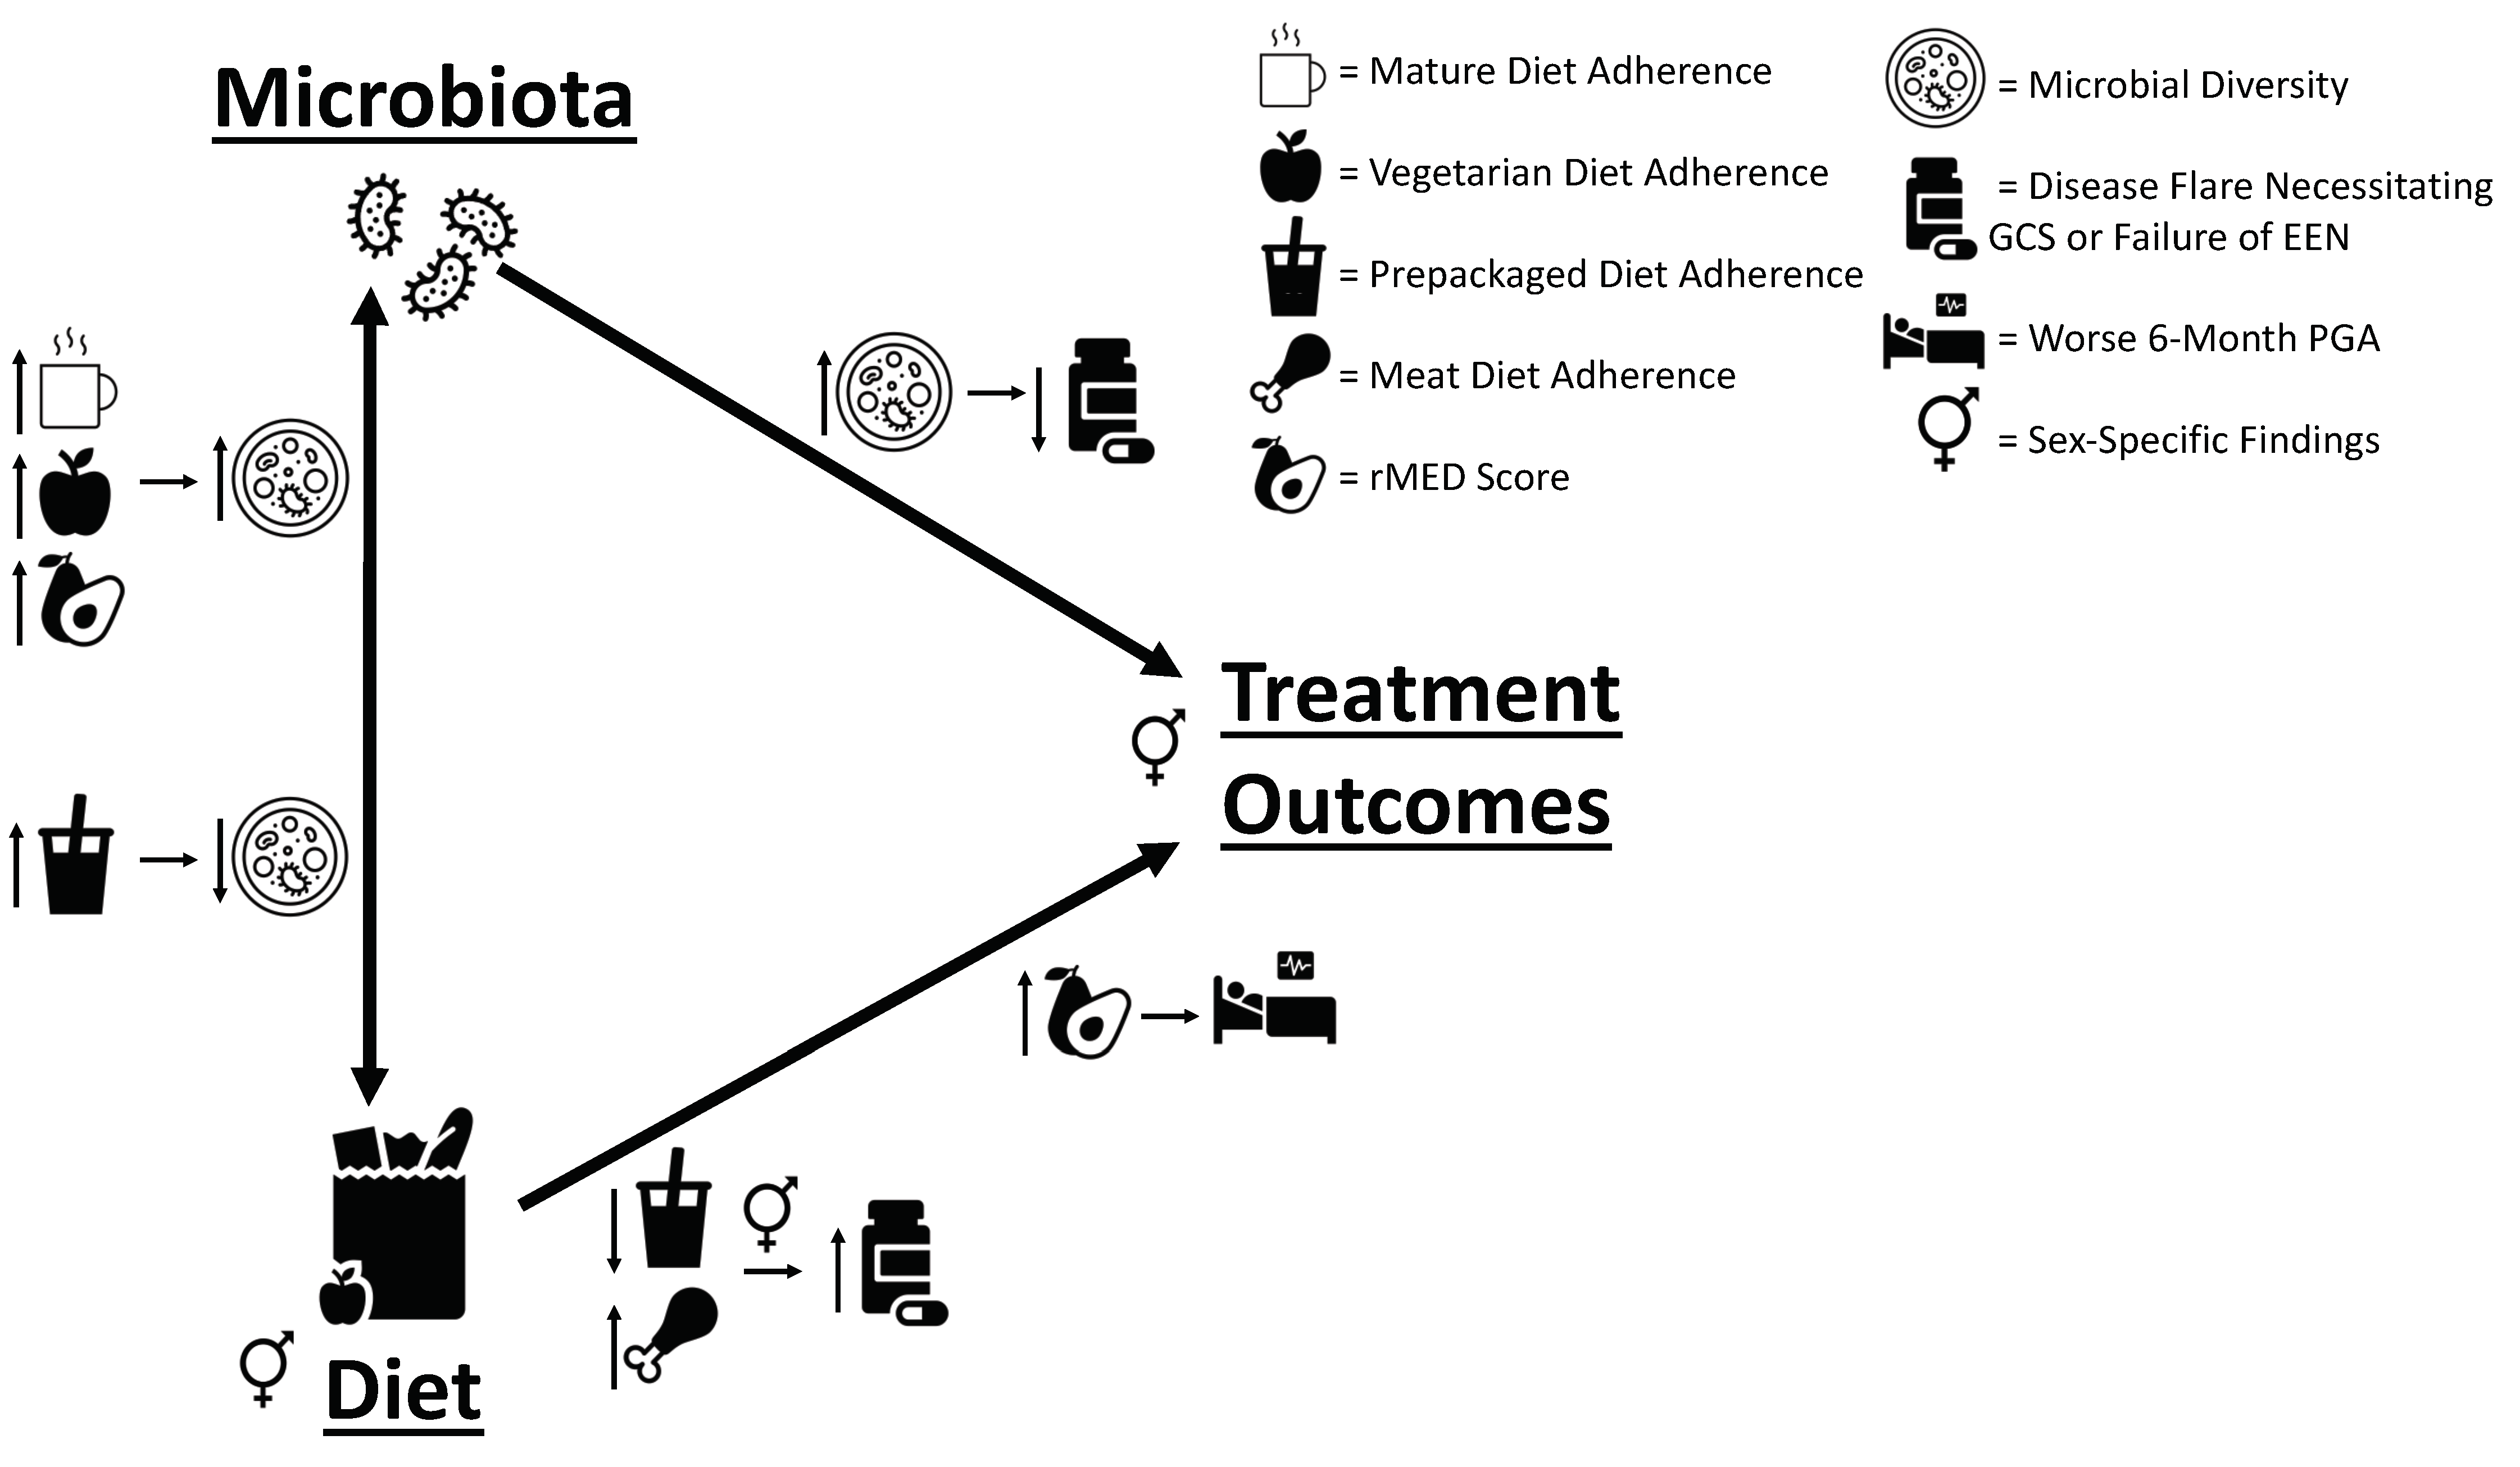
3.4. Baseline and 6-Month Microbial Composition and Diversity Are Associated with Pre-Diagnosis Diet
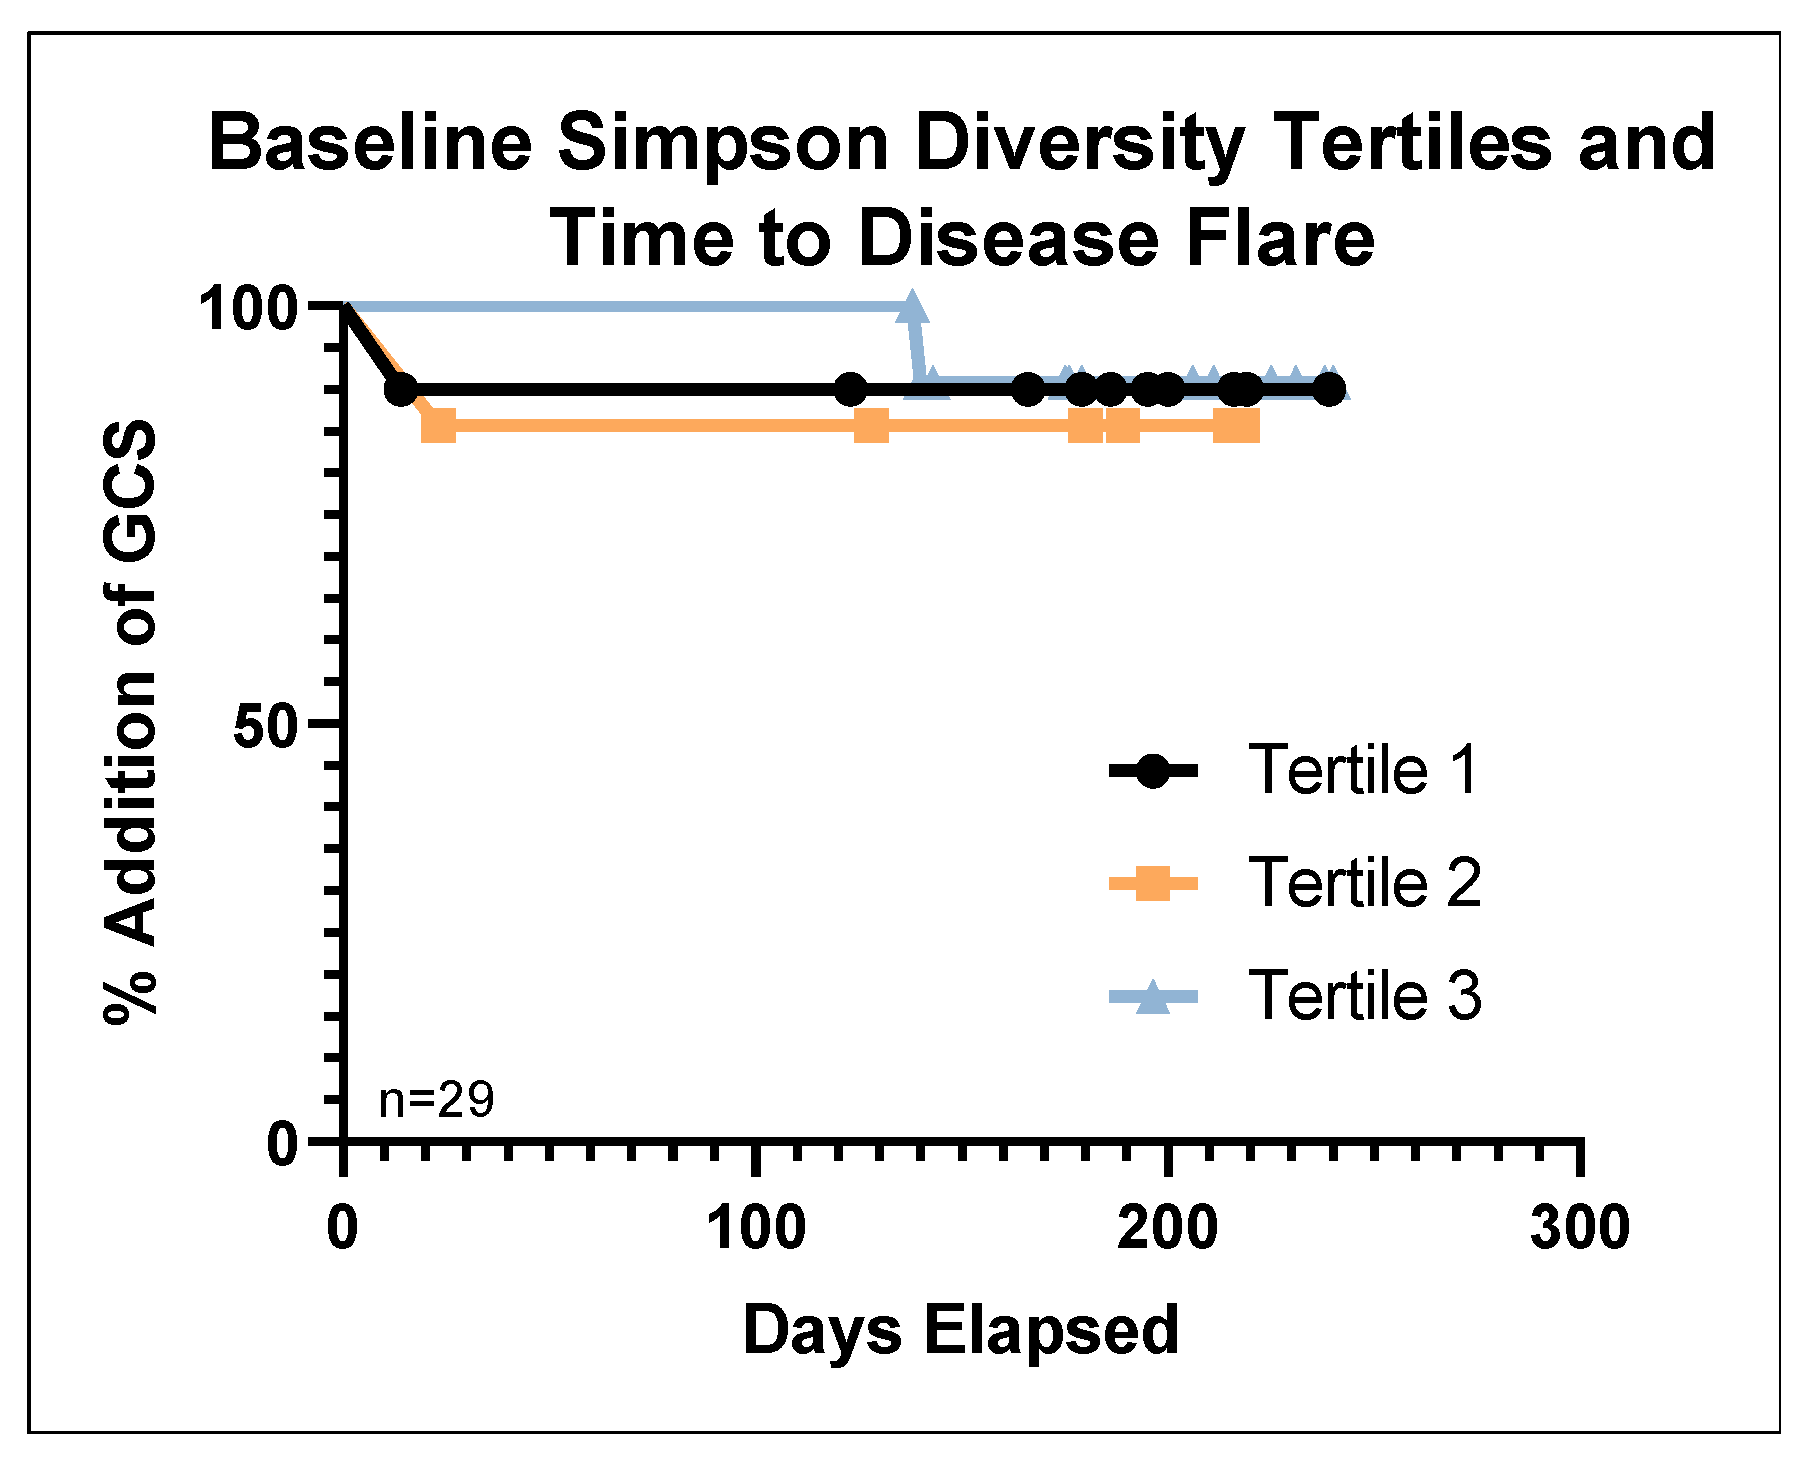
3.5. Lower Baseline Microbial Diversity Was Associated with Earlier Disease Flare
3.6. Additional Sex-Specific Findings
4. Discussion
Limitations
5. Conclusions
Supplementary Materials
Author Contributions
Funding
Institutional Review Board Statement
Informed Consent Statement
Data Availability Statement
Acknowledgments
Conflicts of Interest
References
- Kuenzig, M.E.; Fung, S.G.; Marderfeld, L.; Mak, J.W.Y.; Kaplan, G.G.; Ng, S.C.; Wilson, D.C.; Cameron, F.; Henderson, P.; Kotze, P.G.; et al. Twenty-first Century Trends in the Global Epidemiology of Pediatric-Onset Inflammatory Bowel Disease: Systematic Review. Gastroenterology 2022, 162, 1147–1159.e4. [Google Scholar] [CrossRef] [PubMed]
- Wong, K.; Isaac, D.M.; Wine, E. Growth Delay in Inflammatory Bowel Diseases: Significance, Causes, and Management. Dig. Dis. Sci. 2021, 66, 954–964. [Google Scholar] [CrossRef] [PubMed]
- Chang, J.T. Pathophysiology of Inflammatory Bowel Diseases. N. Engl. J. Med. 2020, 383, 2652–2664. [Google Scholar] [CrossRef] [PubMed]
- Dijk, S.; Armstrong, H.; Valcheva, R.; Wine, E. Paediatric IBD: The host, diet & microbes in pathogenesis & treatment: A narrative review. Dig. Med. Res. 2021, 4. [Google Scholar] [CrossRef]
- Johnson, A.J.; Vangay, P.; Al-Ghalith, G.A.; Hillmann, B.M.; Ward, T.L.; Shields-Cutler, R.R.; Kim, A.D.; Shmagel, A.K.; Syed, A.N.; Students, P.M.C. Daily sampling reveals personalized diet-microbiome associations in humans. Cell Host Microbe 2019, 25, 789–802.e5. [Google Scholar] [CrossRef] [PubMed]
- Kostic, A.D.; Xavier, R.J.; Gevers, D. The microbiome in inflammatory bowel disease: Current status and the future ahead. Gastroenterology 2014, 146, 1489–1499. [Google Scholar] [CrossRef] [PubMed]
- Levine, A.; Boneh, R.S.; Wine, E. Evolving role of diet in the pathogenesis and treatment of inflammatory bowel diseases. Gut 2018, 67, 1726–1738. [Google Scholar] [CrossRef]
- Peters, V.; Spooren, C.; Pierik, M.J.; Weersma, R.K.; van Dullemen, H.M.; Festen, E.A.M.; Visschedijk, M.C.; Masclee, A.A.M.; Hendrix, E.M.B.; Almeida, R.J.; et al. Dietary Intake Pattern is Associated with Occurrence of Flares in IBD Patients. J. Crohn’s Colitis 2021, 15, 1305–1315. [Google Scholar] [CrossRef]
- Chicco, F.; Magrì, S.; Cingolani, A.; Paduano, D.; Pesenti, M.; Zara, F.; Tumbarello, F.; Urru, E.; Melis, A.; Casula, L.; et al. Multidimensional Impact of Mediterranean Diet on IBD Patients. Inflamm. Bowel Dis. 2021, 27, 1–9. [Google Scholar] [CrossRef]
- Lewis, J.D.; Sandler, R.S.; Brotherton, C.; Brensinger, C.; Li, H.; Kappelman, M.D.; Daniel, S.G.; Bittinger, K.; Albenberg, L.; Valentine, J.F.; et al. A Randomized Trial Comparing the Specific Carbohydrate Diet to a Mediterranean Diet in Adults With Crohn’s Disease. Gastroenterology 2021, 161, 837–852.e9. [Google Scholar] [CrossRef]
- Ghosh, T.S.; Rampelli, S.; Jeffery, I.B.; Santoro, A.; Neto, M.; Capri, M.; Giampieri, E.; Jennings, A.; Candela, M.; Turroni, S. Mediterranean diet intervention alters the gut microbiome in older people reducing frailty and improving health status: The NU-AGE 1-year dietary intervention across five European countries. Gut 2020, 69, 1218–1228. [Google Scholar] [CrossRef] [PubMed]
- van Rheenen, P.F.; Aloi, M.; Assa, A.; Bronsky, J.; Escher, J.C.; Fagerberg, U.L.; Gasparetto, M.; Gerasimidis, K.; Griffiths, A.; Henderson, P.; et al. The Medical Management of Paediatric Crohn’s Disease: An ECCO-ESPGHAN Guideline Update. J. Crohn’s Colitis 2021, 15, 171–194. [Google Scholar] [CrossRef] [PubMed]
- Yu, Y.; Chen, K.-C.; Chen, J. Exclusive enteral nutrition versus corticosteroids for treatment of pediatric Crohn’s disease: A meta-analysis. World J. Pediatr. 2019, 15, 26–36. [Google Scholar] [CrossRef] [PubMed]
- Levine, A.; Wine, E. Effects of enteral nutrition on Crohn’s disease: Clues to the impact of diet on disease pathogenesis. Inflamm. Bowel Dis. 2013, 19, 1322–1329. [Google Scholar] [CrossRef] [PubMed]
- Lawley, M.; Wu, J.W.; Navas-López, V.M.; Huynh, H.Q.; Carroll, M.W.; Chen, M.; Medvedev, P.; Day, A.S.; Hussey, S.; Sigall-Boneh, R. Global variation in use of enteral nutrition for pediatric Crohn disease. J. Pediatr. Gastroenterol. Nutr. 2018, 67, e22–e29. [Google Scholar] [CrossRef] [PubMed]
- Diederen, K.; Li, J.V.; Donachie, G.E.; de Meij, T.G.; de Waart, D.R.; Hakvoort, T.B.; Kindermann, A.; Wagner, J.; Auyeung, V.; Te Velde, A.A. Exclusive enteral nutrition mediates gut microbial and metabolic changes that are associated with remission in children with Crohn’s disease. Sci. Rep. 2020, 10, 18879. [Google Scholar] [CrossRef] [PubMed]
- Griffin, N.W.; Ahern, P.P.; Cheng, J.; Heath, A.C.; Ilkayeva, O.; Newgard, C.B.; Fontana, L.; Gordon, J.I. Prior dietary practices and connections to a human gut microbial metacommunity alter responses to diet interventions. Cell Host Microbe 2017, 21, 84–96. [Google Scholar] [CrossRef]
- Faith, J.J.; Guruge, J.L.; Charbonneau, M.; Subramanian, S.; Seedorf, H.; Goodman, A.L.; Clemente, J.C.; Knight, R.; Heath, A.C.; Leibel, R.L. The long-term stability of the human gut microbiota. Science 2013, 341, 1237439. [Google Scholar] [CrossRef]
- Berry, S.E.; Valdes, A.M.; Drew, D.A.; Asnicar, F.; Mazidi, M.; Wolf, J.; Capdevila, J.; Hadjigeorgiou, G.; Davies, R.; Al Khatib, H. Human postprandial responses to food and potential for precision nutrition. Nat. Med. 2020, 26, 964–973. [Google Scholar] [CrossRef]
- Dhaliwal, J.; Walters, T.; Mack, D.; Huynh, H.; Jacobson, K.; Otley, A.; Debruyn, J.; El-Matary, W.; Deslandres, C.; Sherlock, M. Phenotypic variation in paediatric inflammatory bowel disease by age: A multicentre prospective inception cohort study of the Canadian children IBD network. J. Crohn’s Colitis 2020, 14, 445–454. [Google Scholar] [CrossRef]
- Harris, P.A.; Taylor, R.; Minor, B.L.; Elliott, V.; Fernandez, M.; O’Neal, L.; McLeod, L.; Delacqua, G.; Delacqua, F.; Kirby, J. The REDCap consortium: Building an international community of software platform partners. J. Biomed. Inform. 2019, 95, 103208. [Google Scholar] [CrossRef] [PubMed]
- Levine, A.; Griffiths, A.; Markowitz, J.; Wilson, D.C.; Turner, D.; Russell, R.K.; Fell, J.; Ruemmele, F.M.; Walters, T.; Sherlock, M. Pediatric modification of the Montreal classification for inflammatory bowel disease: The Paris classification. Inflamm. Bowel Dis. 2011, 17, 1314–1321. [Google Scholar] [CrossRef] [PubMed]
- Grant, A.; Crane, M.; Laupacis, A.; Griffiths, A.; Burnett, D.; Hood, A.; Kluthe, C.; Maghera, M.; Mann, M.; Mansi, M. Engaging patients and caregivers in research for pediatric inflammatory bowel disease: Top 10 research priorities. J. Pediatr. Gastroenterol. Nutr. 2019, 69, 317–323. [Google Scholar] [CrossRef] [PubMed]
- Levine, A.; Koletzko, S.; Turner, D.; Escher, J.C.; Cucchiara, S.; De Ridder, L.; Kolho, K.-L.; Veres, G.; Russell, R.K.; Paerregaard, A. ESPGHAN revised porto criteria for the diagnosis of inflammatory bowel disease in children and adolescents. J. Pediatr. Gastroenterol. Nutr. 2014, 58, 795–806. [Google Scholar] [CrossRef] [PubMed]
- Shatenstein, B.; Amre, D.; Jabbour, M.; Feguery, H. Examining the relative validity of an adult food frequency questionnaire in children and adolescents. J. Pediatr. Gastroenterol. Nutr. 2010, 51, 645–652. [Google Scholar] [CrossRef] [PubMed]
- Buckland, G.; González, C.A.; Agudo, A.; Vilardell, M.; Berenguer, A.; Amiano, P.; Ardanaz, E.; Arriola, L.; Barricarte, A.; Basterretxea, M. Adherence to the Mediterranean diet and risk of coronary heart disease in the Spanish EPIC Cohort Study. Am. J. Epidemiol. 2009, 170, 1518–1529. [Google Scholar] [CrossRef] [PubMed]
- Trichopoulou, A.; Costacou, T.; Bamia, C.; Trichopoulos, D. Adherence to a Mediterranean diet and survival in a Greek population. N. Engl. J. Med. 2003, 348, 2599–2608. [Google Scholar] [CrossRef] [PubMed]
- Turner, D.; Levine, A.; Walters, T.D.; Focht, G.; Otley, A.; López, V.N.; Koletzko, S.; Baldassano, R.; Mack, D.; Hyams, J.; et al. Which PCDAI Version Best Reflects Intestinal Inflammation in Pediatric Crohn Disease? J. Pediatr. Gastroenterol. Nutr. 2017, 64, 254–260. [Google Scholar] [CrossRef] [PubMed]
- Daperno, M.; D’Haens, G.; Van Assche, G.; Baert, F.; Bulois, P.; Maunoury, V.; Sostegni, R.; Rocca, R.; Pera, A.; Gevers, A. Development and validation of a new, simplified endoscopic activity score for Crohn’s disease: The SES-CD. Gastrointest. Endosc. 2004, 60, 505–512. [Google Scholar] [CrossRef]
- Stearns, J.C.; Davidson, C.J.; McKeon, S.; Whelan, F.J.; Fontes, M.E.; Schryvers, A.B.; Bowdish, D.M.; Kellner, J.D.; Surette, M.G. Culture and molecular-based profiles show shifts in bacterial communities of the upper respiratory tract that occur with age. ISME J. 2015, 9, 1246–1259. [Google Scholar] [CrossRef]
- Bolyen, E.; Rideout, J.R.; Dillon, M.R.; Bokulich, N.A.; Abnet, C.C.; Al-Ghalith, G.A.; Alexander, H.; Alm, E.J.; Arumugam, M.; Asnicar, F.; et al. Reproducible, interactive, scalable and extensible microbiome data science using QIIME 2. Nat. Biotechnol. 2019, 37, 852–857. [Google Scholar] [CrossRef] [PubMed]
- Callahan, B.J.; McMurdie, P.J.; Rosen, M.J.; Han, A.W.; Johnson, A.J.A.; Holmes, S.P. DADA2: High-resolution sample inference from Illumina amplicon data. Nat. Methods 2016, 13, 581–583. [Google Scholar] [CrossRef] [PubMed]
- Turner, D.; Griffiths, A.M.; Walters, T.D.; Seah, T.; Markowitz, J.; Pfefferkorn, M.; Keljo, D.; Waxman, J.; Otley, A.; LeLeiko, N.S. Mathematical weighting of the pediatric Crohn’s disease activity index (PCDAI) and comparison with its other short versions. Inflamm. Bowel Dis. 2012, 18, 55–62. [Google Scholar] [CrossRef]
- StataCorp. Stata Statistical Software: Release 14; StataCorp: College Station, TX, USA, 2015. [Google Scholar]
- Movassagh, E.Z.; Baxter-Jones, A.D.; Kontulainen, S.; Whiting, S.J.; Vatanparast, H. Tracking dietary patterns over 20 years from childhood through adolescence into young adulthood: The Saskatchewan Pediatric Bone Mineral Accrual Study. Nutrients 2017, 9, 990. [Google Scholar] [CrossRef] [PubMed]
- Del-Ponte, B.; Quinte, G.C.; Cruz, S.; Grellert, M.; Santos, I.S. Dietary patterns and attention deficit/hyperactivity disorder (ADHD): A systematic review and meta-analysis. J. Affect. Disord. 2019, 252, 160–173. [Google Scholar] [CrossRef] [PubMed]
- Devkota, S.; Wang, Y.; Musch, M.W.; Leone, V.; Fehlner-Peach, H.; Nadimpalli, A.; Antonopoulos, D.A.; Jabri, B.; Chang, E.B. Dietary-fat-induced taurocholic acid promotes pathobiont expansion and colitis in Il10−/− mice. Nature 2012, 487, 104–108. [Google Scholar] [CrossRef] [PubMed]
- David, L.A.; Maurice, C.F.; Carmody, R.N.; Gootenberg, D.B.; Button, J.E.; Wolfe, B.E.; Ling, A.V.; Devlin, A.S.; Varma, Y.; Fischbach, M.A. Diet rapidly and reproducibly alters the human gut microbiome. Nature 2014, 505, 559–563. [Google Scholar] [CrossRef] [PubMed]
- Levine, A.; Rhodes, J.M.; Lindsay, J.O.; Abreu, M.T.; Kamm, M.A.; Gibson, P.R.; Gasche, C.; Silverberg, M.S.; Mahadevan, U.; Boneh, R.S.; et al. Dietary Guidance From the International Organization for the Study of Inflammatory Bowel Diseases. Clin. Gastroenterol. Hepatol. 2020, 18, 1381–1392. [Google Scholar] [CrossRef] [PubMed]
- Papa, E.; Docktor, M.; Smillie, C.; Weber, S.; Preheim, S.P.; Gevers, D.; Giannoukos, G.; Ciulla, D.; Tabbaa, D.; Ingram, J. Non-invasive mapping of the gastrointestinal microbiota identifies children with inflammatory bowel disease. PLoS ONE 2012, 7, e39242. [Google Scholar] [CrossRef]
- Olbjørn, C.; Småstuen, M.C.; Thiis-Evensen, E.; Nakstad, B.; Vatn, M.H.; Jahnsen, J.; Ricanek, P.; Vatn, S.; Moen, A.E.; Tannæs, T.M. Fecal microbiota profiles in treatment-naïve pediatric inflammatory bowel disease–associations with disease phenotype, treatment, and outcome. Clin. Exp. Gastroenterol. 2019, 12, 37. [Google Scholar] [CrossRef]
- Zhou, L.; Zhang, M.; Wang, Y.; Dorfman, R.G.; Liu, H.; Yu, T.; Chen, X.; Tang, D.; Xu, L.; Yin, Y. Faecalibacterium prausnitzii produces butyrate to maintain Th17/Treg balance and to ameliorate colorectal colitis by inhibiting histone deacetylase 1. Inflamm. Bowel Dis. 2018, 24, 1926–1940. [Google Scholar] [CrossRef] [PubMed]
- Bolte, L.A.; Vich Vila, A.; Imhann, F.; Collij, V.; Gacesa, R.; Peters, V.; Wijmenga, C.; Kurilshikov, A.; Campmans-Kuijpers, M.J.E.; Fu, J.; et al. Long-term dietary patterns are associated with pro-inflammatory and anti-inflammatory features of the gut microbiome. Gut 2021, 70, 1287–1298. [Google Scholar] [CrossRef] [PubMed]
- Hart, L.; Farbod, Y.; Szamosi, J.C.; Yamamoto, M.; Britz-McKibbin, P.; Halgren, C.; Zachos, M.; Pai, N. Effect of Exclusive Enteral Nutrition and Corticosteroid Induction Therapy on the Gut Microbiota of Pediatric Patients with Inflammatory Bowel Disease. Nutrients 2020, 12, 1691. [Google Scholar] [CrossRef] [PubMed]
- Levine, A.; Wine, E.; Assa, A.; Boneh, R.S.; Shaoul, R.; Kori, M.; Cohen, S.; Peleg, S.; Shamaly, H.; On, A. Crohn’s disease exclusion diet plus partial enteral nutrition induces sustained remission in a randomized controlled trial. Gastroenterology 2019, 157, 440–450.e8. [Google Scholar] [CrossRef] [PubMed]
- Bolnick, D.I.; Snowberg, L.K.; Hirsch, P.E.; Lauber, C.L.; Org, E.; Parks, B.; Lusis, A.J.; Knight, R.; Caporaso, J.G.; Svanbäck, R. Individual diet has sex-dependent effects on vertebrate gut microbiota. Nat. Commun. 2014, 5, 4500. [Google Scholar] [CrossRef]
- de Bie, C.; Kindermann, A.; Escher, J. Use of exclusive enteral nutrition in paediatric Crohn’s disease in The Netherlands. J. Crohn’s Colitis 2013, 7, 263–270. [Google Scholar] [CrossRef] [PubMed]
- Martín-Masot, R.; Herrador-López, M.; Navas-López, V.M. Dietary Habit Modifications in Paediatric Patients after One Year of Treatment with the Crohn’s Disease Exclusion Diet. Nutrients 2023, 15, 554. [Google Scholar] [CrossRef]
- Cosnes, J.; Beaugerie, L.; Carbonnel, F.; Gendre, J.P. Smoking cessation and the course of Crohn’s disease: An intervention study. Gastroenterology 2001, 120, 1093–1099. [Google Scholar] [CrossRef]
- Willett, W.C.; Howe, G.R.; Kushi, L.H. Adjustment for total energy intake in epidemiologic studies. Am. J. Clin. Nutr. 1997, 65, 1220S–1228S. [Google Scholar] [CrossRef]
- Szamosi, J.C.; Forbes, J.D.; Copeland, J.K.; Knox, N.C.; Shekarriz, S.; Rossi, L.; Graham, M.; Bonner, C.; Guttman, D.S.; Van Domselaar, G. Assessment of inter-laboratory variation in the characterization and analysis of the mucosal microbiota in Crohn’s disease and ulcerative colitis. Front. Microbiol. 2020, 11, 2028. [Google Scholar] [CrossRef]
- Wang, Q.; Garrity, G.M.; Tiedje, J.M.; Cole, J.R. Naive Bayesian classifier for rapid assignment of rRNA sequences into the new bacterial taxonomy. Appl. Environ. Microbiol. 2007, 73, 5261–5267. [Google Scholar] [CrossRef] [PubMed]


| Dietary Pattern: | “Vegetarian” | “Meat” | “Pre-Packaged” | “Mature” |
|---|---|---|---|---|
| Food Groups Positively Associated (factor loading) | Whole Grains 0.3048 | Rice, Rice Noodles, Couscous 0.2887 | High-Fiber Cereals 0.3944 | Chicken, Turkey without skin/fried 0.207 |
| Vegetable Soup 0.3134 | Other Soups 0.4105 | Sugary Condiments 0.2856 | Fish 0.2581 | |
| Soy/Tofu 0.3047 | Red Meat 0.277 | Breaded Fish 0.3549 | Seafood 0.2148 | |
| Salad Dressing 0.2733 | Pork 0.3495 | Diet Soda 0.4256 | Vegetables 0.3751 | |
| Fruit 0.2103 | Liver Organs 0.2043 | Fruit 0.2546 | ||
| Full-Fat Dairy 0.2678 | Chicken, Turkey with skin or fried 0.3161 | Coffee 0.2245 | ||
| Butter 0.2973 | Alcohol 0.2503 | |||
| Milk Alternatives 0.2153 | ||||
| Food Groups Negatively Associated (factor loading) | Chicken, Turkey with skin or fried −0.222 | Chicken, Turkey without skin/fried −0.2104 | Lean Red Meat −0.2424 | Pizza −0.3615 |
| Granola Bars −0.2191 | Processed Meat −0.2182 |
Disclaimer/Publisher’s Note: The statements, opinions and data contained in all publications are solely those of the individual author(s) and contributor(s) and not of MDPI and/or the editor(s). MDPI and/or the editor(s) disclaim responsibility for any injury to people or property resulting from any ideas, methods, instructions or products referred to in the content. |
© 2024 by the authors. Licensee MDPI, Basel, Switzerland. This article is an open access article distributed under the terms and conditions of the Creative Commons Attribution (CC BY) license (https://creativecommons.org/licenses/by/4.0/).
Share and Cite
Dijk, S.; Jarman, M.; Zhang, Z.; Lawley, M.; Ahmad, M.; Suarez, R.; Rossi, L.; Chen, M.; Wu, J.; Carroll, M.W.; et al. Pre-Diagnosis Diet Predicts Response to Exclusive Enteral Nutrition and Correlates with Microbiome in Pediatric Crohn Disease. Nutrients 2024, 16, 1033. https://doi.org/10.3390/nu16071033
Dijk S, Jarman M, Zhang Z, Lawley M, Ahmad M, Suarez R, Rossi L, Chen M, Wu J, Carroll MW, et al. Pre-Diagnosis Diet Predicts Response to Exclusive Enteral Nutrition and Correlates with Microbiome in Pediatric Crohn Disease. Nutrients. 2024; 16(7):1033. https://doi.org/10.3390/nu16071033
Chicago/Turabian StyleDijk, Stephanie, Megan Jarman, Zhengxiao Zhang, Morgan Lawley, Muzammil Ahmad, Ricardo Suarez, Laura Rossi, Min Chen, Jessica Wu, Matthew W. Carroll, and et al. 2024. "Pre-Diagnosis Diet Predicts Response to Exclusive Enteral Nutrition and Correlates with Microbiome in Pediatric Crohn Disease" Nutrients 16, no. 7: 1033. https://doi.org/10.3390/nu16071033
APA StyleDijk, S., Jarman, M., Zhang, Z., Lawley, M., Ahmad, M., Suarez, R., Rossi, L., Chen, M., Wu, J., Carroll, M. W., Otley, A., Sherlock, M., Mack, D. R., Jacobson, K., deBruyn, J. C., El-Matary, W., Deslandres, C., Rashid, M., Church, P. C., ... Wine, E., on behalf of the Canadian Children IBD Network. (2024). Pre-Diagnosis Diet Predicts Response to Exclusive Enteral Nutrition and Correlates with Microbiome in Pediatric Crohn Disease. Nutrients, 16(7), 1033. https://doi.org/10.3390/nu16071033