Low-Protein Infant Formula Enriched with Alpha-Lactalbumin during Early Infancy May Reduce Insulin Resistance at 12 Months: A Follow-Up of a Randomized Controlled Trial

 , ,
, ,
Abstract
1. Introduction
2. Materials and Methods
2.1. Intervention Study
2.2. Follow-Up Study
2.2.1. Anthropometrics and Dietary Intake
2.2.2. Biochemical Analyses
2.2.3. Statistical Analyses
3. Results
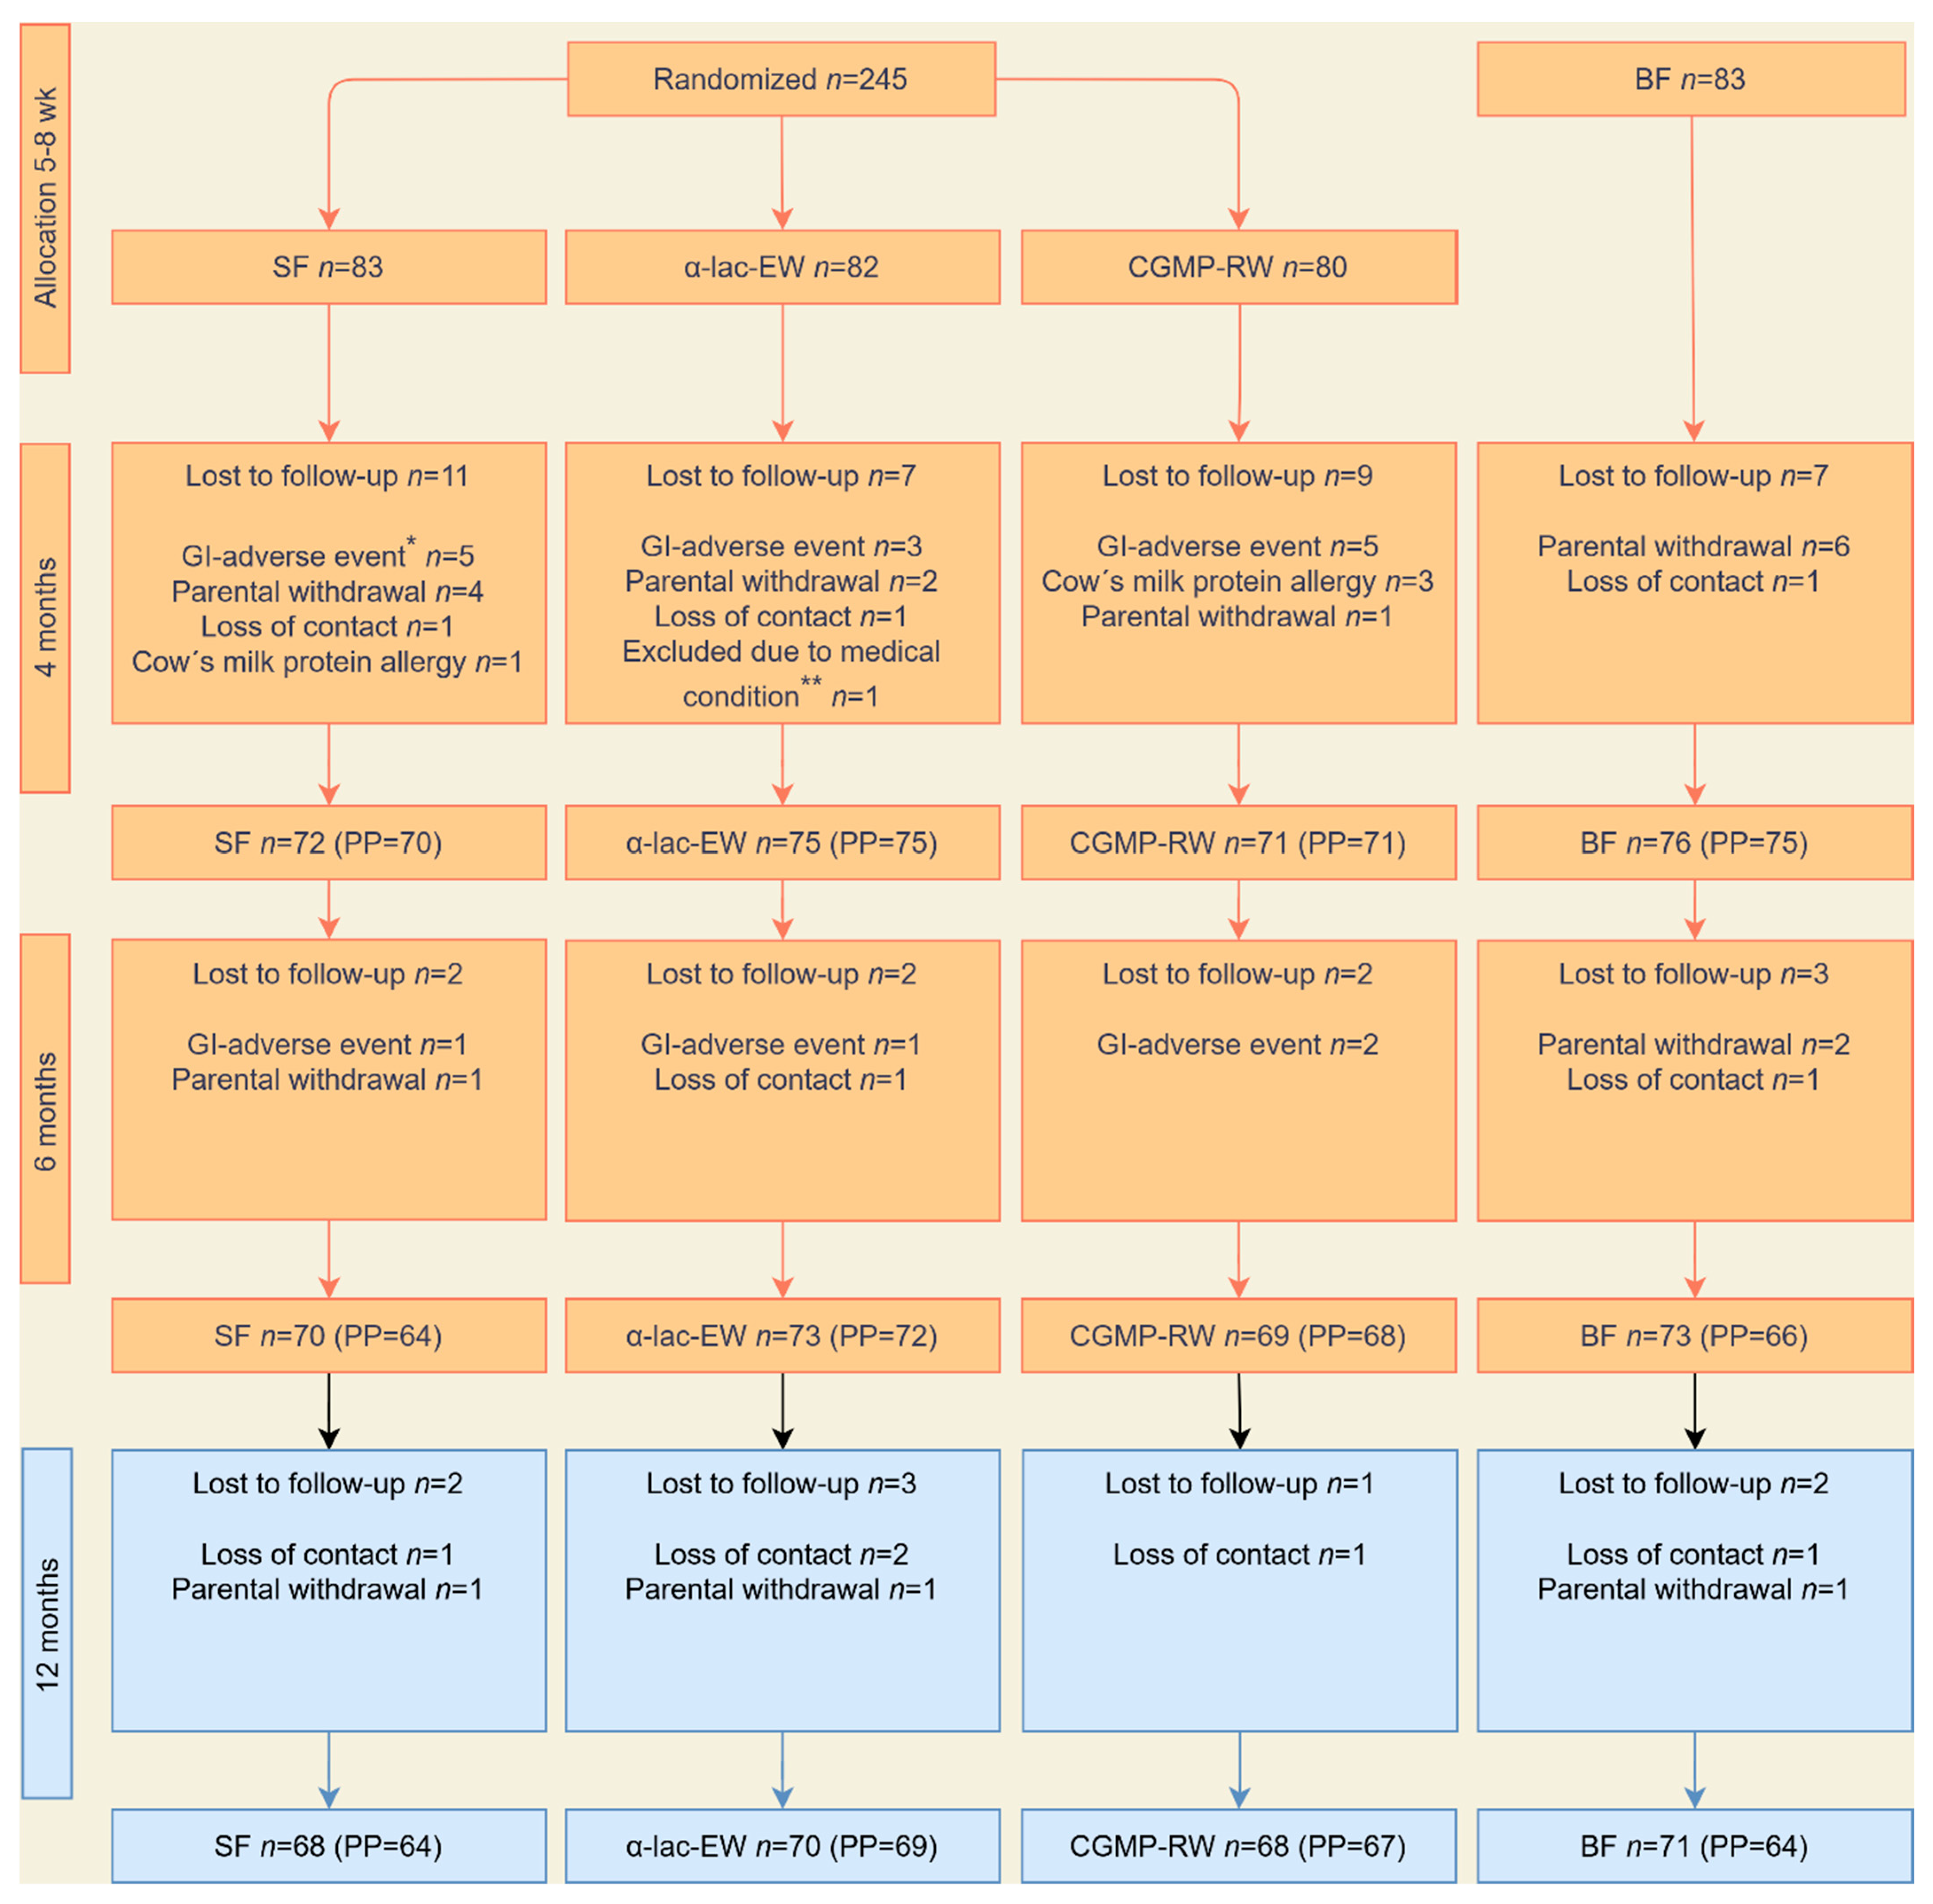
3.1. Study Groups
3.2. Growth
3.3. Nutrient Intake
3.4. Biochemistry
3.5. Associations between Hormonal and Metabolic Markers and Growth
4. Discussion
5. Conclusions
Supplementary Materials
Author Contributions
Funding
Institutional Review Board Statement
Informed Consent Statement
Data Availability Statement
Acknowledgments
Conflicts of Interest
References
- World Health Organization. World Health Statistics 2023: Monitoring Health for the SDGs, Sustainable Development Goals; World Health Organization: Geneva, Switzerland, 2023; Available online: https://www.who.int/publications/i/item/9789240074323 (accessed on 17 October 2023).
- Baird, J.; Fisher, D.; Lucas, P.; Kleijnen, J.; Roberts, H.; Law, C. Being big or growing fast: Systematic review of size and growth in infancy and later obesity. BMJ 2005, 331, 929. [Google Scholar] [CrossRef]
- Ong, K.K.; Loos, R.J. Rapid infancy weight gain and subsequent obesity: Systematic reviews and hopeful suggestions. Acta Paediatr. 2006, 95, 904–908. [Google Scholar] [CrossRef] [PubMed]
- Weng, S.F.; Redsell, S.A.; Swift, J.A.; Yang, M.; Glazebrook, C.P. Systematic review and meta-analyses of risk factors for childhood overweight identifiable during infancy. Arch. Dis. Child. 2012, 97, 1019–1026. [Google Scholar] [CrossRef]
- Zheng, M.; Lamb, K.E.; Grimes, C.; Laws, R.; Bolton, K.; Ong, K.K.; Campbell, K. Rapid weight gain during infancy and subsequent adiposity: A systematic review and meta-analysis of evidence. Obes. Rev. 2018, 19, 321–332. [Google Scholar] [CrossRef] [PubMed]
- Luque, V.; Closa-Monasterolo, R.; Escribano, J.; Ferré, N. Early Programming by Protein Intake: The Effect of Protein on Adiposity Development and the Growth and Functionality of Vital Organs. Nutr. Metab. Insights. 2015, 8 (Suppl. S1), 49–56. [Google Scholar] [CrossRef] [PubMed]
- Koletzko, B.; Brands, B.; Chourdakis, M.; Cramer, S.; Grote, V.; Hellmuth, C.; Kirchberg, F.; Prell, C.; Rzehak, P.; Uhl, O.; et al. The Power of Programming and the EarlyNutrition project: Opportunities for health promotion by nutrition during the first thousand days of life and beyond. Ann. Nutr. Metab. 2014, 64, 187–196. [Google Scholar] [CrossRef] [PubMed]
- Kouwenhoven, S.M.P.; Fleddermann, M.; Finken, M.J.J.; Twisk, J.W.R.; van der Beek, E.M.; Abrahamse-Berkeveld, M.; van de Heijning, B.J.M.; van Harskamp, D.; van Goudoever, J.B.; Koletzko, B.V. Early-Life Metabolic and Hormonal Markers in Blood and Growth until Age 2 Years: Results from a Randomized Controlled Trial in Healthy Infants Fed a Modified Low-Protein Infant Formula. Nutrients 2021, 13, 1159. [Google Scholar] [CrossRef]
- Putet, G.; Labaune, J.M.; Mace, K.; Steenhout, P.; Grathwohl, D.; Raverot, V.; Morel, Y.; Picaud, J.-C. Effect of dietary protein on plasma insulin-like growth factor-1, growth, and body composition in healthy term infants: A randomised, double-blind, controlled trial (Early Protein and Obesity in Childhood (EPOCH) study). Br. J. Nutr. 2016, 115, 271–284. [Google Scholar] [CrossRef]
- Socha, P.; Grote, V.; Gruszfeld, D.; Janas, R.; Demmelmair, H.; Closa-Monasterolo, R.; Subías, J.E.; Scaglioni, S.; Verduci, E.; Dain, E.; et al. Milk protein intake, the metabolic-endocrine response, and growth in infancy: Data from a randomized clinical trial. Am. J. Clin. Nutr. 2011, 94 (6 Suppl), 1776s–1784s. [Google Scholar]
- Tinghäll Nilsson, U.; Hernell, O.; Lönnerdal, B.; Hartvigsen, M.L.; Jacobsen, L.N.; Kvistgaard, A.S.; Karlsland Åkeson, P. Low-Protein Formulas with Alpha-Lactalbumin-Enriched or Glycomacropeptide-Reduced Whey: Effects on Growth, Nutrient Intake and Protein Metabolism during Early Infancy: A Randomized, Double-Blinded Controlled Trial. Nutrients 2023, 15, 1010. [Google Scholar] [CrossRef]
- Akeson, P.M.; Axelsson, I.E.; Räihä, N.C. Growth and nutrient intake in three- to twelve-month-old infants fed human milk or formulas with varying protein concentrations. J. Pediatr. Gastroenterol. Nutr. 1998, 26, 1–8. [Google Scholar] [CrossRef] [PubMed]
- Alexander, D.D.; Yan, J.; Bylsma, L.C.; Northington, R.S.; Grathwohl, D.; Steenhout, P.; Erdmann, P.; Spivey-Krobath, E.; Haschke, F. Growth of infants consuming whey-predominant term infant formulas with a protein content of 1.8 g/100 kcal: A multicenter pooled analysis of individual participant data. Am. J. Clin. Nutr. 2016, 104, 1083–1092. [Google Scholar] [CrossRef] [PubMed]
- Camier, A.; Davisse-Paturet, C.; Scherdel, P.; Lioret, S.; Heude, B.; Charles, M.A.; de Lauzon-Guillain, B. Early growth according to protein content of infant formula: Results from the EDEN and ELFE birth cohorts. Pediatr. Obes. 2021, 16, e12803. [Google Scholar] [CrossRef] [PubMed]
- Davis, A.M.; Harris, B.J.; Lien, E.L.; Pramuk, K.; Trabulsi, J. Alpha-lactalbumin-rich infant formula fed to healthy term infants in a multicenter study: Plasma essential amino acids and gastrointestinal tolerance. Eur. J. Clin. Nutr. 2008, 62, 1294–1301. [Google Scholar] [CrossRef] [PubMed]
- Fleddermann, M.; Demmelmair, H.; Grote, V.; Nikolic, T.; Trisic, B.; Koletzko, B. Infant formula composition affects energetic efficiency for growth: The BeMIM study, a randomized controlled trial. Clin. Nutr. 2014, 33, 588–595. [Google Scholar] [CrossRef] [PubMed]
- Koletzko, B.; von Kries, R.; Closa, R.; Escribano, J.; Scaglioni, S.; Giovannini, M.; Beyer, J.; Demmelmair, H.; Gruszfeld, D.; Dobrzanska, A.; et al. Lower protein in infant formula is associated with lower weight up to age 2 y: A randomized clinical trial. Am. J. Clin. Nutr. 2009, 89, 1836–1845. [Google Scholar] [CrossRef]
- Kouwenhoven, S.M.P.; Antl, N.; Finken, M.J.J.; Twisk, J.W.R.; van der Beek, E.M.; Abrahamse-Berkeveld, M.; van de Heijning, B.J.M.; Schierbeek, H.; Holdt, L.M.; van Goudoever, J.B.; et al. A modified low-protein infant formula supports adequate growth in healthy, term infants: A randomized, double-blind, equivalence trial. Am. J. Clin. Nutr. 2020, 111, 962–974. [Google Scholar] [CrossRef]
- Lien, E.L.; Davis, A.M.; Euler, A.R. Growth and safety in term infants fed reduced-protein formula with added bovine alpha-lactalbumin. J. Pediatr. Gastroenterol. Nutr. 2004, 38, 170–176. [Google Scholar] [PubMed]
- Liotto, N. Protein content of infant formula for the healthy full-term infant. Am. J. Clin. Nutr. 2020, 111, 946–947. [Google Scholar] [CrossRef]
- Petersen, H.; Nomayo, A.; Zelenka, R.; Foster, J.; Tvrdík, J.; Jochum, F. Adequacy and safety of α-lactalbumin-enriched low-protein infant formula: A randomized controlled trial. Nutrition 2020, 74, 110728. [Google Scholar] [CrossRef]
- Timby, N.; Domellöf, E.; Hernell, O.; Lönnerdal, B.; Domellöf, M. Neurodevelopment, nutrition, and growth until 12 mo of age in infants fed a low-energy, low-protein formula supplemented with bovine milk fat globule membranes: A randomized controlled trial. Am. J. Clin. Nutr. 2014, 99, 860–868. [Google Scholar] [CrossRef] [PubMed]
- Trabulsi, J.; Capeding, R.; Lebumfacil, J.; Ramanujam, K.; Feng, P.; McSweeney, S.; Harris, B.; DeRusso, P. Effect of an α-lactalbumin-enriched infant formula with lower protein on growth. Eur. J. Clin. Nutr. 2011, 65, 167–174. [Google Scholar] [CrossRef] [PubMed]
- Abrams, S.A.; Hawthorne, K.M.; Pammi, M. A systematic review of controlled trials of lower-protein or energy-containing infant formulas for use by healthy full-term infants. Adv. Nutr. 2015, 6, 178–188. [Google Scholar] [CrossRef] [PubMed]
- Patro-Gołąb, B.; Zalewski, B.M.; Kouwenhoven, S.M.; Karaś, J.; Koletzko, B.; Bernard van Goudoever, J.; Szajewska, H. Protein Concentration in Milk Formula, Growth, and Later Risk of Obesity: A Systematic Review. J. Nutr. 2016, 146, 5515–5564. [Google Scholar] [CrossRef] [PubMed]
- Ren, Q.; Li, K.; Sun, H.; Zheng, C.; Zhou, Y.; Lyu, Y.; Ye, W.; Shi, H.; Zhang, W.; Xu, Y.; et al. The Association of Formula Protein Content and Growth in Early Infancy: A Systematic Review and Meta-Analysis. Nutrients 2022, 14, 2255. [Google Scholar] [CrossRef] [PubMed]
- Lönnerdal, B. Infant formula and infant nutrition: Bioactive proteins of human milk and implications for composition of infant formulas. Am. J. Clin. Nutr. 2014, 99, 712s–717s. [Google Scholar] [CrossRef] [PubMed]
- Totzauer, M.; Escribano, J.; Closa-Monasterolo, R.; Luque, V.; Verduci, E.; ReDionigi, A.; Langhendries, J.P.; Martin, F.; Xhonneux, A.; Gruszfeld, D.; et al. Different protein intake in the first year and its effects on adiposity rebound and obesity throughout childhood: 11 years follow-up of a randomized controlled trial. Pediatr. Obes. 2022, 17, e12961. [Google Scholar] [CrossRef] [PubMed]
- Weber, M.; Grote, V.; Closa-Monasterolo, R.; Escribano, J.; Langhendries, J.P.; Dain, E.; Giovannini, M.; Verduci, E.; Gruszfeld, D.; Socha, P.; et al. Lower protein content in infant formula reduces BMI and obesity risk at school age: Follow-up of a randomized trial. Am. J. Clin. Nutr. 2014, 99, 1041–1051. [Google Scholar] [CrossRef]
- Demmelmair, H.; Fleddermann, M.; Koletzko, B. Infant Feeding Choices during the First Post-Natal Months and Anthropometry at Age Seven Years: Follow-Up of a Randomized Clinical Trial. Nutrients 2022, 14, 3900. [Google Scholar] [CrossRef]
- Fleddermann, M.; Demmelmair, H.; Hellmuth, C.; Grote, V.; Trisic, B.; Nikolic, T.; Koletzko, B. Association of infant formula composition and anthropometry at 4 years: Follow-up of a randomized controlled trial (BeMIM study). PLoS ONE 2018, 13, e0199859. [Google Scholar] [CrossRef]
- World Health Organization. Who Child Growth Standards: Length/Height-for-Age, Weight-for-Age, Weight-for-Length, Weight-for-Height, and Body Mass Indeex-for-Age: Methods and Development; World Health Organization: Geneva, Switzerland, 2006; Available online: https://www.who.int/publications/i/item/924154693X (accessed on 15 March 2023).
- World Health Organization. Who Child Growth Standards: Head Circumference-for-Age, Arm Circumference-for-Age, Triceps Skinfold-for-Age and Subscapular Skinfold-for-Age: Methodes and Development; World Health Organization: Geneva, Switzerland, 2007; Available online: https://www.who.int/publications/i/item/9789241547185 (accessed on 16 March 2023).
- De Spiegeleer, M.; De Paepe, E.; Van Meulebroek, L.; Gies, I.; De Schepper, J.; Vanhaecke, L. Paediatric obesity: A systematic review and pathway mapping of metabolic alterations underlying early disease processes. Mol. Med. 2021, 27, 145. [Google Scholar] [CrossRef] [PubMed]
- Lynch, C.J.; Adams, S.H. Branched-chain amino acids in metabolic signalling and insulin resistance. Nat. Rev. Endocrinol. 2014, 10, 723–736. [Google Scholar] [CrossRef]
- Zhao, X.; Gang, X.; Liu, Y.; Sun, C.; Han, Q.; Wang, G. Using Metabolomic Profiles as Biomarkers for Insulin Resistance in Childhood Obesity: A Systematic Review. J. Diabetes Res. 2016, 2016, 8160545. [Google Scholar] [CrossRef] [PubMed]
- Voerman, E.; Jaddoe, V.W.; Franco, O.H.; Steegers, E.A.; Gaillard, R. Critical periods and growth patterns from fetal life onwards associated with childhood insulin levels. Diabetologia 2017, 60, 81–88. [Google Scholar] [CrossRef]
- Totzauer, M.; Luque, V.; Escribano, J.; Closa-Monasterolo, R.; Verduci, E.; ReDionigi, A.; Hoyos, J.; Langhendries, J.P.; Gruszfeld, D.; Socha, P.; et al. Effect of Lower Versus Higher Protein Content in Infant Formula Through the First Year on Body Composition from 1 to 6 Years: Follow-Up of a Randomized Clinical Trial. Obesity 2018, 26, 1203–1210. [Google Scholar] [CrossRef] [PubMed]
- Ong, K.K.; Langkamp, M.; Ranke, M.B.; Whitehead, K.; Hughes, I.A.; Acerini, C.L.; Dunger, D.B. Insulin-like growth factor I concentrations in infancy predict differential gains in body length and adiposity: The Cambridge Baby Growth Study. Am. J. Clin. Nutr. 2009, 90, 156–161. [Google Scholar] [CrossRef] [PubMed]
- Savino, F.; Nanni, G.E.; Maccario, S.; Oggero, R.; Mussa, G.C. Relationships between IGF-I and weight Z score, BMI, tricipital skin-fold thickness, type of feeding in healthy infants in the first 5 months of life. Ann. Nutr. Metab. 2005, 49, 83–87. [Google Scholar] [CrossRef] [PubMed]
- Savino, F.; Fissore, M.F.; Grassino, E.C.; Nanni, G.E.; Oggero, R.; Silvestro, L. Ghrelin, leptin and IGF-I levels in breast-fed and formula-fed infants in the first years of life. Acta Paediatr. 2005, 94, 531–537. [Google Scholar] [CrossRef] [PubMed]
- Beyerlein, A.; Thiering, E.; Pflueger, M.; Bidlingmaier, M.; Stock, J.; Knopff, A.; Winkler, C.; Heinrich, J.; Ziegler, A.G. Early infant growth is associated with the risk of islet autoimmunity in genetically susceptible children. Pediatr. Diabetes. 2014, 15, 534–542. [Google Scholar] [CrossRef]
- Liu, X.; Vehik, K.; Huang, Y.; Elding Larsson, H.; Toppari, J.; Ziegler, A.G.; She, J.X.; Rewers, M.; Hagopian, W.A.; Akolkar, B.; et al. Distinct Growth Phases in Early Life Associated With the Risk of Type 1 Diabetes: The TEDDY Study. Diabetes Care 2020, 43, 556–562. [Google Scholar] [CrossRef]
- Aronsson, C.A.; Tamura, R.; Vehik, K.; Uusitalo, U.; Yang, J.; Haller, M.J.; Toppari, J.; Hagopian, W.; McIndoe, R.A.; Rewers, M.J.; et al. Dietary Intake and Body Mass Index Influence the Risk of Islet Autoimmunity in Genetically At-Risk Children: A Mediation Analysis Using the TEDDY Cohort. Pediatr. Diabetes. 2023, 2023, 3945064. [Google Scholar] [CrossRef] [PubMed]
- Escribano, J.; Luque, V.; Ferre, N.; Zaragoza-Jordana, M.; Grote, V.; Koletzko, B.; Gruszfeld, D.; Socha, P.; Dain, E.; Van Hees, J.N.; et al. Increased protein intake augments kidney volume and function in healthy infants. Kidney Int. 2011, 79, 783–790. [Google Scholar] [CrossRef] [PubMed]
- Luque, V.; Escribano, J.; Grote, V.; Ferre, N.; Koletzko, B.; Gruszfeld, D.; Socha, P.; Langhendries, J.P.; Goyens, P.; Closa-Monasterolo, R.; et al. Does insulin-like growth factor-1 mediate protein-induced kidney growth in infants? A secondary analysis from a randomized controlled trial. Pediatr. Res. 2013, 74, 223–229. [Google Scholar] [CrossRef] [PubMed]
- Lammert, A.; Kiess, W.; Bottner, A.; Glasow, A.; Kratzsch, J. Soluble leptin receptor represents the main leptin binding activity in human blood. Biochem. Biophys. Res. Commun. 2001, 283, 982–988. [Google Scholar] [CrossRef] [PubMed]
- Zepf, F.D.; Rao, P.; Moore, J.; Stewart, R.; Ladino, Y.M.; Hartmann, B.T. Human breast milk and adipokines—A potential role for the soluble leptin receptor (sOb-R) in the regulation of infant energy intake and development. Med. Hypotheses 2016, 86, 53–55. [Google Scholar] [CrossRef] [PubMed]
- Marousez, L.; Lesage, J.; Eberlé, D. Epigenetics: Linking Early Postnatal Nutrition to Obesity Programming? Nutrients 2019, 11, 2966. [Google Scholar] [CrossRef]
- Simeoni, U.; Yzydorczyk, C.; Siddeek, B.; Benahmed, M. Epigenetics and neonatal nutrition. Early Hum. Dev. 2014, 90 (Suppl. S2), S23–S24. [Google Scholar] [CrossRef]
- World Health Organization. Global Strategy for Infant and Young Child Feeding; World Health Organization: Geneva, Switzerland, 2003. [Google Scholar]
- National Board of Health and Welfare (Socialstyrelsen). Statistik om Amning 2020 Stockholm: National Board of Health and Welfare. 2022. Available online: https://www.socialstyrelsen.se/statistik-och-data/statistik/alla-statistikamnen/amning/ (accessed on 22 April 2023).
- European Union. Commission Delegated Regulation (EU) 2016/127 of 25 September 2015 Supplementing REGULATION (EU) No 609/2013 of the European Parliament and of the Council as Regards the Specific Compositional and Information Requirements for Infant Formula and Follow-On Formula and as Regards Requirements on Information Relating to Infant and Young Child Feeding. Available online: https://eur-lex.europa.eu/legal-content/EN/TXT/?uri=CELEX%3A02016R0127-20230317 (accessed on 29 September 2021).


| SF n = 68 | α-lac-EW n = 70 | CGMP-RW n = 68 | BF n = 71 | |
|---|---|---|---|---|
| Gestational age (week) | 39.6 ± 1.2 | 39.7 ± 1.3 | 40.1 ± 1.2 | 40.0 ± 1.1 |
| Birth weight (g) | 3498 ± 460 | 3519 ± 450 | 3590 ± 455 | 3552 ± 432 |
| Birth length (cm) | 50.4 ± 2.2 | 50.2 ± 2.0 | 50.4 ± 1.7 | 50.4 ± 1.9 |
| Birth head circumference (cm) | 34.7 ± 1.2 | 35.0 ± 1.3 | 35.0 ± 1.2 | 35.1 ± 1.5 |
| Age at inclusion (d) | 49.6 ± 5.0 | 49.4 ± 4.4 | 49.2 ± 5.9 | 50.5 ± 4.7 |
| Ever breastfed before inclusion (n (%)) | 50 (72) | 55 (79) | 60 (88) | 71 (100) |
| Days of breast-feeding before inclusion (n) | 14.9 ± 14.2 | 17.9 ± 15.3 | 18.2 ± 14.2 | 50.0 ± 4.8 |
| Male (n (%)) | 35 (51) | 34 (49) | 34 (50) | 33 (47) |
| Complementary feeding during intervention (n (%)) 1 | 22 (32) | 25 (37) | 26 (39) | 22 (32) |
| Age at follow-up visit (m) | 12.0 ± 0.23 | 12.0 ± 0.32 | 12.0 ± 0.36 | 12.1 ± 0.34 |
| Maternal age (y) | 31.4 ± 4.8 | 31.6 ± 4.5 | 31.6 ± 4.4 | 32.6 ± 4.3 |
| Maternal origin (n (%)) | ||||
| Nordic | 66 (96) | 64 (91) | 64 (94) | 64 (90) |
| European (non-Nordic) | 2 (3) | 3 (4) | 3 (4) | 5 (7) |
| Non-European | 1 (1) | 3 (4) | 1 (1) | 2 (3) |
| Maternal higher education (n (%)) 2 | 37 (54) | 42 (60) | 49 (72) | 57 (80) |
| Maternal smoking during pregnancy (n (%)) | 3 (4) | 3 (4) | 2 (3) | 0 (0) |
| Maternal BMI at enrollment (kg/m2) | 28.4 ± 5.2 | 27.3 ± 5.1 | 26.3 ± 4.3 | 25.1 ± 3.6 |
| Weight gain during pregnancy (kg) | 12.8 ± 6.4 | 13.6 ± 6.8 | 14.9 ± 6.3 | 14.0 ± 5.3 |
| Gestational diabetes (n (%)) | 2 (3) | 1 (1) | 4 (6) | 5 (7) |
| Paternal origin (n (%)) | ||||
| Nordic | 57 (85) | 63 (93) | 63(94) | 55 (80) |
| European (non-Nordic) | 4 (6) | 3 (4) | 2 (3) | 9 (13) |
| Non-European | 6 (9) | 2(3) | 2 (3) | 5 (7) |
| Paternal higher education (n (%)) | 25 (37) | 30 (44) | 40 (60) | 50 (72) |
| Paternal smoking during pregnancy (n (%)) | 11 (16) | 6 (9) | 3 (5) | 7 (10) |
| Paternal BMI (kg/m2) | 26.6 ± 4.1 | 27.1 ± 5.8 | 26.4 ± 4.0 | 25.8 ± 3.6 |
| SF | α-lac-EW | CGMP-RW | p-Value 1,2 | BF | |||||
|---|---|---|---|---|---|---|---|---|---|
| n | n | n | n | ||||||
| Weight (g) | |||||||||
| 6 mo | 70 | 8323 ± 879 a | 73 | 8228 ± 1025 a | 69 | 8342 ± 1009 a | 0.76 (0.67) | 73 | 7771 ± 923 |
| 12 mo | 68 | 10,584 ± 1222 a | 70 | 10,236 ± 1205 | 68 | 10,315 ± 1214 a | 0.22 (0.11) | 71 | 9719 ± 962 |
| Weight gain | |||||||||
| 6–12 mo (g/d) | 68 | 12.5 ± 3.5 a,b,c | 70 | 11.0 ± 2.7 | 68 | 10.7 ± 3.2 | 0.002 (0.008) | 70 # | 10.9 ± 2.9 |
| 6–12 mo (g/kg/d) | 68 | 1.2 ± 0.23 c | 70 | 1.1 ± 0.23 | 68 | 1.0 ± 0.25 | 0.002 (0.008) | 70 # | 1.1 ± 0.27 |
| Length (cm) | |||||||||
| 6 mo | 70 | 67.9 ± 2.5 | 73 | 67.9 ± 2.4 | 69 | 67.8 ± 2.3 | 0.99 (0.98) | 73 | 67.1 ± 2.6 |
| 12 mo | 68 | 76.3 ± 2.8 | 70 | 76.1 ± 2.9 | 68 | 76.2 ± 2.4 | 0.91 (0.19) | 71 | 75.2 ± 2.4 |
| Length gain (mm/d) | |||||||||
| 6–12 mo | 68 | 0.46 ± 0.09 | 70 | 0.45 ± 0.07 | 68 | 0.45 ± 0.06 | 0.64 (0.70) | 70 # | 0.45 ± 0.06 |
| HC ** (cm) | |||||||||
| 6 mo | 70 | 43.9 ± 1.2 | 73 | 43.9 ± 1.6 | 69 | 43.9 ± 1.6 | 0.84 (0.71) | 73 | 43.7 ± 1.5 |
| 12 mo | 68 | 46.8 ± 1.2 | 70 | 46.7 ± 1.5 | 68 | 46.7 ± 1.7 | 0.90 (0.077) | 71 | 46.5 ± 1.4 |
| HC gain (mm/d) | |||||||||
| 6–12 mo | 68 | 0.2 ± 0.03 | 70 | 0.2 ± 0.03 | 68 | 0.2 ± 0.03 | 0.21 (0.18) | 70 # | 0.2 ± 0.03 |
| BMI (kg/m2) | |||||||||
| 6 mo | 70 | 18.1 ± 1.5 a | 73 | 17.8 ± 1.6 | 69 | 18.1 ± 1.5 a | 0.51 (0.44) | 73 | 17.2 ± 1.3 |
| 12 mo | 68 | 18.2 ± 1.6 a | 70 | 17.6 ± 1.4 | 68 | 17.7 ± 1.5 | 0.081(0.11) | 71 | 17.1 ± 1.1 |
| Z-score 12 mo | |||||||||
| BMIZ | 68 | 0.99 ± 1.01 a | 70 | 0.68 ± 0.88 | 68 | 0.74 ± 0.94 | 0.12 (0.16) | 71 | 0.38 ± 0.75 |
| WAZ | 68 | 1.04 ± 0.96 a | 70 | 0.79 ± 0.94 a | 68 | 0.84 ± 0.98 a | 0.25 (0.07) | 71 | 0.37 ± 0.75 |
| WLZ | 68 | 1.07 ± 0.99 a | 70 | 0.76 ± 0.89 | 68 | 0.81 ± 0.96 | 0.13 (0.28) | 71 | 0.40 ± 0.75 |
| LAZ | 68 | 0.56 ± 1.10 | 70 | 0.51 ± 1.07 | 68 | 0.53 ± 0.99 | 0.95 (0.28) | 71 | 0.17 ± 0.91 |
| HCZ | 68 | 0.97 ± 0.87 | 70 | 0.92 ± 1.01 | 68 | 0.91 ± 1.11 | 0.94 (0.56) | 71 | 0.80 ± 0.94 |
| SF n = 66 | α-lac-EW n = 68 | CGMP-RW n = 68 | p-Value 1 | BF n = 44 # | |
|---|---|---|---|---|---|
| Energy (kcal) | 891 ± 170 | 892 ± 174 | 866 ± 157 | 0.61 | 866 ±183 |
| Energy (kcal/kg) | 85.4 ± 18.8 | 87.7 ± 15.9 | 84.6 ± 15.6 | 0.55 | 87.7 ± 17.9 |
| Protein (g) | 28.6 ± 7.0 | 30.4 ± 8.0 | 28.8 ±7.0 | 0.30 | 29.2 ±7.0 |
| Protein (g/kg) | 2.7 ± 0.6 | 3.0 ± 0.8 | 2.8 ± 0.7 | 0.083 | 3.0 ± 0.7 |
| Fat (g) | 34.1 ± 8.4 | 35.0 ± 10.1 | 33.3 ± 8.2 | 0.56 | 33.1 ± 10.1 |
| Fat (g/kg) | 3.3 ± 0.9 | 3.4 ± 1.0 | 3.3 ± 0.8 | 0.44 | 3.4 ± 1.0 |
| Carbohydrate (g) | 111.2 ± 21.1 | 108.0 ± 22.8 | 106.8 ± 20.3 | 0.48 | 107.1 ± 25.0 |
| Carbohydrate (g/kg) | 10.7 ± 2.3 | 10.6 ± 2.0 | 10.4 ± 1.9 | 0.78 | 10.8 ± 2.2 |
| SF | α-lac-EW | CGMP-RW | p-Value 1,2 | BF | |||||
|---|---|---|---|---|---|---|---|---|---|
| n | n | n | n | ||||||
| Insulin (mIU/L) | 64 | 6.07 (4.96–7.43) a | 67 | 4.78 (3.94–5.78) | 65 | 4.31 (3.47–5.36) | 0.056 (0.092) | 63 | 3.28 (2.56–4.19) |
| C-peptide (nmol/L) | 64 | 0.73 ± 0.37 a,b | 67 | 0.62 ± 0.36 | 65 | 0.59 ± 0.24 | 0.035 (0.046) | 63 | 0.53 ± 0.28 |
| IGF-1 (µg/L) | 64 | 67.8 (62.2–73.9) | 67 | 61.6 (55.6–68.3) | 65 | 63.3 (57.5–69.7) | 0.35 (0.86) | 63 | 59.5 (53.7–65.9) |
| Leptin (ng/mL) | 62 | 2.81 (2.33–3.40) | 65 | 2.22 (1.86–2.65) | 63 | 2.49 (2.16–2.87) | 0.15 (0.062) | 57 | 2.42 (2.07–2.83) |
| SLR (ng/mL) | 63 | 44.2 ± 7.9 | 65 | 43.3 ± 10.9 | 64 | 44.1 ± 10.5 | 0.85 (0.86) | 58 | 45.1 ± 9.8 |
| Hb (g/L) | 58 | 118 ± 10 | 62 | 119 ± 7 | 60 | 119 ± 7 | 0.72 (0.53) | 56 | 116 ± 8 |
| Metabolic and Hormonal Marker | Age (mo) | Weight (g) | Length (cm) | BMI | Weight Gain 6–12 mo (g/d) | ||||||||
|---|---|---|---|---|---|---|---|---|---|---|---|---|---|
| Β | CI (95%) | p | Β | CI (95%) | p | Β | CI (95%) | p | B | CI (95%) | p | ||
| Insulin 4 mo | |||||||||||||
| 6 | 348 | 212, 484 | <0.001 | 0.6 | 0.3, 0.9 | <0.001 | 0.5 | 0.2, 0.7 | <0.001 | ||||
| 12 | 369 | 183, 555 | <0.001 | 0.9 | 0.5, 1.3 | <0.001 | 0.3 | 0.01, 0.5 | 0.27 | 0.09 | −0.5, 0.8 | 0.70 | |
| Insulin 6 mo | |||||||||||||
| 6 | 280 | 146, 414 | <0.001 | 0.4 | 0.08, 0.7 | 0.014 | 0.4 | 0.15, 0.6 | 0.001 | ||||
| 12 | 205 | 415, 395 | 0.035 | 0.6 | 0.2, 1.0 | 0.002 | 0.06 | −0.2, 0.3 | 0.65 | −0.4 | −1.0, 0.2 | 0.19 | |
| Insulin 12 mo | |||||||||||||
| 12 | 130 | −19, 279 | 0.086 | 0.4 | 0.06, 0.7 | 0.021 | 0.03 | −0.2, 0.2 | 0.78 | 0.7 | 0.2, 1.1 | 0.005 | |
| C-peptide 4 mo | |||||||||||||
| 6 | 776 | 356, 1197 | <0.001 | 0.8 | −0.2, 1.8 | 0.11 | 1.2 | 0.5, 2.0 | 0.001 | ||||
| 12 | 792 | 222, 1362 | 0.007 | 1.5 | 0.2, 2.7 | 0.027 | 0.8 | −0.03, 1.5 | 0.06 | −0.03 | −1.8, 1.8 | 0.97 | |
| C-peptide 6 mo | |||||||||||||
| 6 | 760 | 330, 1190 | <0.001 | 0.9 | −0.07, 2.0 | 0.067 | 1.1 | 0.4, 1.9 | 0.004 | ||||
| 12 | 576 | −30, 1181 | 0.063 | 1.3 | 0.02, 2.6 | 0.047 | 0.4 | −0.4, 1.1 | 0.32 | −0.9 | −2.8, 1.1 | 0.37 | |
| C-peptide 12 mo | |||||||||||||
| 12 | 166 | −23, 557 | 0.41 | 0.01 | −0.8, 0.9 | 0.023 | 0.2 | −0.3, 0.7 | 0.39 | 1.1 | −0.1, 2.4 | 0.073 | |
| IGF-1 4 mo | |||||||||||||
| 6 | 798 | 471, 1126 | <0.001 | 1.7 | 1.0, 2.4 | <0.001 | 0.8 | 0.3, 1.4 | 0.005 | ||||
| 12 | 829 | 385, 1272 | <0.001 | 2.4 | 1.5, 3.3 | <0.001 | 0.3 | −0.3, 0.9 | 0.33 | 0.2 | −1.3, 1.6 | 0.83 | |
| IGF-1 6 mo | |||||||||||||
| 6 | 587 | 317, 857 | <0.001 | 0.9 | 0.3, 1.5 | 0.002 | 0.8 | 0.3, 1.3 | 0.001 | ||||
| 12 | 640 | 259, 1022 | 0.001 | 2.3 | 1.5, 3.0 | <0.001 | 0.04 | −0.5, 0.5 | 0.88 | 0.4 | −0.9, 1.6 | 0.55 | |
| IGF-1 12 mo | |||||||||||||
| 12 | 945 | 626, 1264 | <0.001 | 2.1 | 1.5, 2.8 | <0.001 | 0.6 | 0.2, 1.0 | 0.006 | 3.0 | 2.0, 4.0 | <0.001 | |
| Leptin 4 mo | |||||||||||||
| 6 | 570 | 400, 738 | <0.001 | 0.1 | −0.3, 0.6 | 0.57 | 1.2 | 0.9, 1.4 | <0.001 | ||||
| 12 | 422 | 182, 663 | <0.001 | 0.2 | −0.4, 0.8 | 0.48 | 0.6 | 0.3, 0.9 | <0.001 | −0.9 | −1.6, 0.09 | 0.028 | |
| Leptin 6 mo | |||||||||||||
| 6 | 644 | 472, 815 | <0.001 | 0.2 | −0.3, 0.6 | 0.41 | 1.3 | 1.0, 1.6 | <0.001 | ||||
| 12 | 704 | 451, 958 | <0.001 | 0.6 | 0.01, 1.1 | 0.046 | 1.0 | 0.7, 1.3 | <0.001 | 0.3 | −0.6, 1.2 | 0.50 | |
| Leptin 12 mo | |||||||||||||
| 12 | 793 | 605, 982 | <0.001 | 0.6 | 0.5, 1.4 | <0.001 | 0.9 | 0.7, 1.2 | <0.001 | 2.0 | 1.4, 2.6 | <0.001 | |
Disclaimer/Publisher’s Note: The statements, opinions and data contained in all publications are solely those of the individual author(s) and contributor(s) and not of MDPI and/or the editor(s). MDPI and/or the editor(s) disclaim responsibility for any injury to people or property resulting from any ideas, methods, instructions or products referred to in the content. |
© 2024 by the authors. Licensee MDPI, Basel, Switzerland. This article is an open access article distributed under the terms and conditions of the Creative Commons Attribution (CC BY) license (https://creativecommons.org/licenses/by/4.0/).
Share and Cite
Tinghäll Nilsson, U.; Lönnerdal, B.; Hernell, O.; Kvistgaard, A.S.; Jacobsen, L.N.; Karlsland Åkeson, P. Low-Protein Infant Formula Enriched with Alpha-Lactalbumin during Early Infancy May Reduce Insulin Resistance at 12 Months: A Follow-Up of a Randomized Controlled Trial. Nutrients 2024, 16, 1026. https://doi.org/10.3390/nu16071026
Tinghäll Nilsson U, Lönnerdal B, Hernell O, Kvistgaard AS, Jacobsen LN, Karlsland Åkeson P. Low-Protein Infant Formula Enriched with Alpha-Lactalbumin during Early Infancy May Reduce Insulin Resistance at 12 Months: A Follow-Up of a Randomized Controlled Trial. Nutrients. 2024; 16(7):1026. https://doi.org/10.3390/nu16071026
Chicago/Turabian StyleTinghäll Nilsson, Ulrika, Bo Lönnerdal, Olle Hernell, Anne Staudt Kvistgaard, Lotte Neergaard Jacobsen, and Pia Karlsland Åkeson. 2024. "Low-Protein Infant Formula Enriched with Alpha-Lactalbumin during Early Infancy May Reduce Insulin Resistance at 12 Months: A Follow-Up of a Randomized Controlled Trial" Nutrients 16, no. 7: 1026. https://doi.org/10.3390/nu16071026
APA StyleTinghäll Nilsson, U., Lönnerdal, B., Hernell, O., Kvistgaard, A. S., Jacobsen, L. N., & Karlsland Åkeson, P. (2024). Low-Protein Infant Formula Enriched with Alpha-Lactalbumin during Early Infancy May Reduce Insulin Resistance at 12 Months: A Follow-Up of a Randomized Controlled Trial. Nutrients, 16(7), 1026. https://doi.org/10.3390/nu16071026