Effects of Additional Protein Intake on Lean Body Mass in Patients Undergoing Multimodal Treatment for Morbid Obesity


Abstract
1. Introduction
2. Materials and Methods
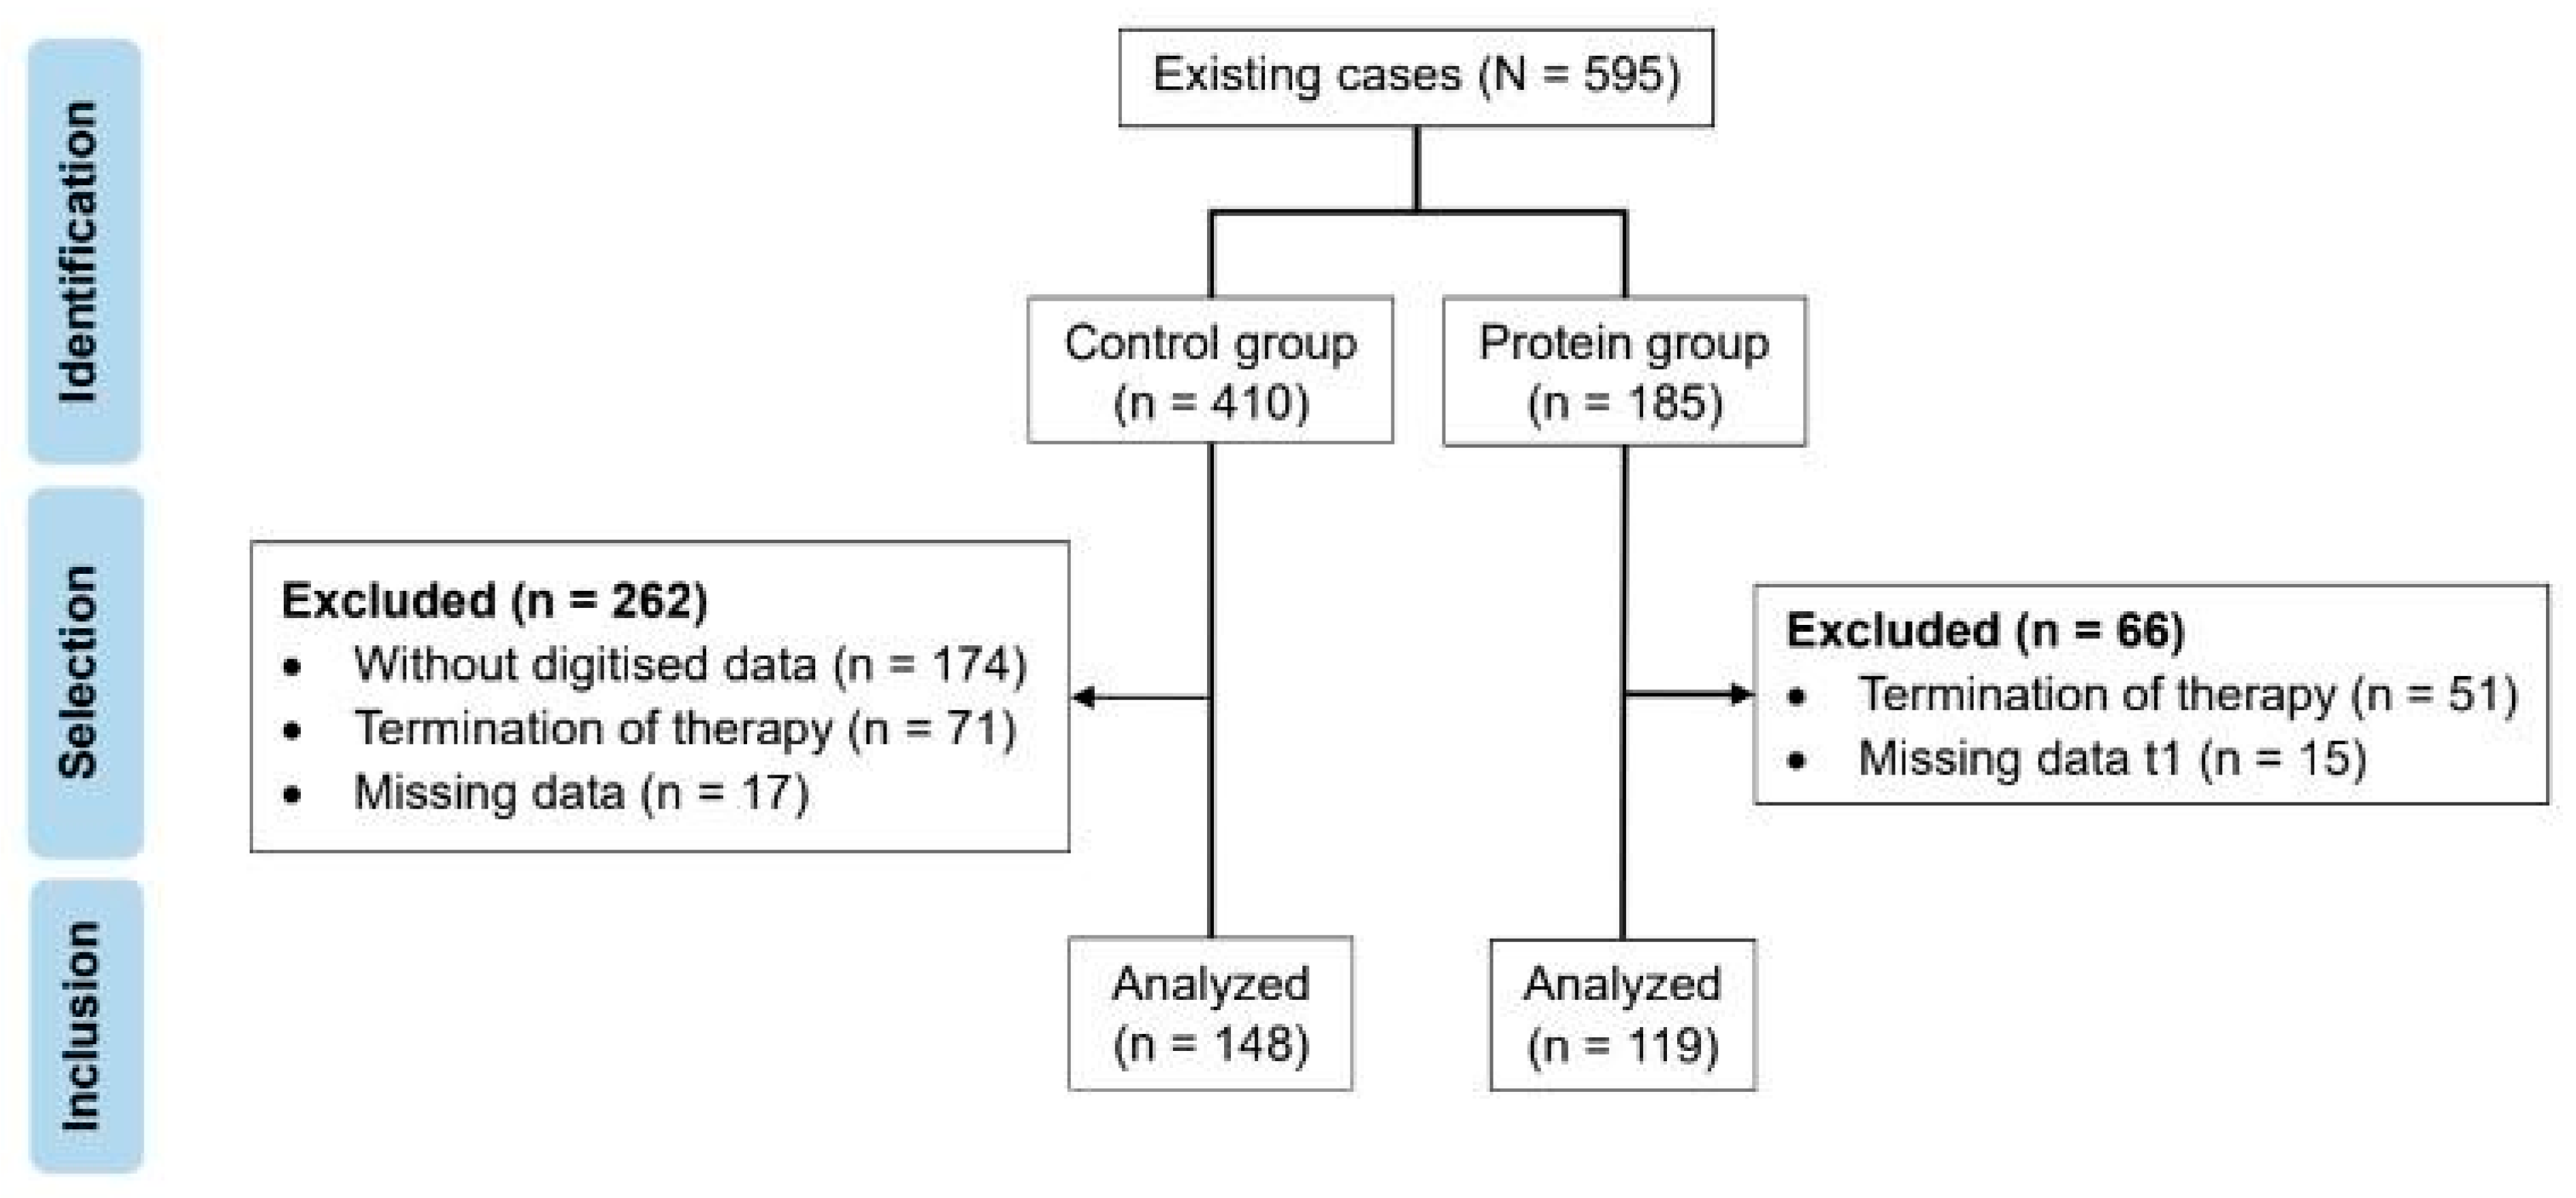
2.1. Subjects
2.2. Dietary Intervention
2.3. Exercise Intervention
2.4. Bioelectrical Impedance Analysis
2.5. Additional Paramenters
2.6. Statistical Evaluation
3. Results
3.1. Baseline Characteristics
3.2. Protein Intake
3.3. Changes in Body Weight, BMI and Lean Body Mass after 12 Weeks
4. Discussion
5. Conclusions
Supplementary Materials
Author Contributions
Funding
Institutional Review Board Statement
Informed Consent Statement
Data Availability Statement
Conflicts of Interest
References
- World Health Organization (WHO). World Obesity Day 2022—Accelerating Action to Stop Obesity. Available online: https://www.who.int/news/item/04-03-2022-world-obesity-day-2022-accelerating-action-to-stop-obesity (accessed on 2 October 2023).
- World Health Organization (WHO). Obesity and Overweight. Available online: https://www.who.int/news-room/fact-sheets/detail/obesity-and-overweight (accessed on 2 October 2023).
- Kloock, S.; Ziegler, C.G.; Dischinger, U. Obesity and its comorbidities, current treatment options and future perspectives: Challenging bariatric surgery? Pharmacol. Ther. 2023, 251, 108549. [Google Scholar] [CrossRef] [PubMed]
- Wadden, T.A.; Tronieri, J.S.; Butryn, M.L. Lifestyle modification approaches for the treatment of obesity in adults. Am. Psychol. 2020, 75, 235–251. [Google Scholar] [CrossRef] [PubMed]
- Seid, H.; Rosenbaum, M. Low Carbohydrate and Low-Fat Diets: What We Don’t Know and Why we Should Know It. Nutrients 2019, 11, 2749. [Google Scholar] [CrossRef] [PubMed]
- Bosy-Westphal, A.; Wolf, A.; Bührens, F.; Hitze, B.; Czech, N.; Mönig, H.; Selberg, O.; Settler, U.; Pfeuffer, M.; Schrezenmeir, J.; et al. Familial influences and obesity-associated metabolic risk factors contribute to the variation in resting energy expenditure: The Kiel Obesity Prevention Study. Am. J. Clin. Nutr. 2008, 87, 1695–1701. [Google Scholar] [CrossRef] [PubMed][Green Version]
- Bosy-Westphal, A.; Schautz, B.; Lagerpusch, M.; Pourhassan, M.; Braun, W.; Goele, K.; Heller, M.; Glüer, C.-C.; Müller, M.J. Effect of weight loss and regain on adipose tissue distribution, composition of lean mass and resting energy expenditure in young overweight and obese adults. Int. J. Obes. 2013, 37, 1371–1377. [Google Scholar] [CrossRef] [PubMed]
- Freiberger, E.; Goisser, S.; Porzel, S.; Volkert, D.; Kemmler, W.; Sieber, C.; Bollheimer, C. Sarcopenic obesity and complex interventions with nutrition and exercise in community-dwelling older persons—A narrative review. Clin. Interv. Aging 2015, 10, 1267–1282. [Google Scholar] [CrossRef] [PubMed]
- Holmes, C.J.; Racette, S.B. The Utility of Body Composition Assessment in Nutrition and Clinical Practice: An Overview of Current Methodology. Nutrients 2021, 13, 2493. [Google Scholar] [CrossRef]
- Baum, J.I.; Kim, I.-Y.; Wolfe, R.R. Protein Consumption and the Elderly: What Is the Optimal Level of Intake? Nutrients 2016, 8, 359. [Google Scholar] [CrossRef]
- Janssen, T.A.H.; Van Every, D.W.; Phillips, S.M. The impact and utility of very low-calorie diets: The role of exercise and protein in preserving skeletal muscle mass. Curr. Opin. Clin. Nutr. Metab. Care 2023, 26, 521–527. [Google Scholar] [CrossRef]
- Ard, J.D.; Lewis, K.H.; Rothberg, A.; Auriemma, A.; Coburn, S.L.; Cohen, S.S.; Loper, J.; Matarese, L.; Pories, W.J.; Periman, S. Effectiveness of a Total Meal Replacement Program (OPTIFAST Program) on Weight Loss: Results from the OPTIWIN Study. Obesity 2019, 27, 22–29. [Google Scholar] [CrossRef]
- Clina, J.G.; Sayer, R.D.; Pan, Z.; Cohen, C.W.; McDermott, M.T.; Catenacci, V.A.; Wyatt, H.R.; Hill, J.O. High- and normal-protein diets improve body composition and glucose control in adults with type 2 diabetes: A randomized trial. Obesity 2023, 31, 2021–2030. [Google Scholar] [CrossRef] [PubMed]
- Tang, M.; Armstrong, C.L.; Leidy, H.J.; Campbell, W.W. Normal vs. high-protein weight loss diets in men: Effects on body composition and indices of metabolic syndrome. Obesity 2013, 21, E204–E210. [Google Scholar] [CrossRef]
- Leidy, H.J.; Carnell, N.S.; Mattes, R.D.; Campbell, W.W. Higher Protein Intake Preserves Lean Mass and Satiety with Weight Loss in Pre-obese and Obese Women. Obesity 2007, 15, 421–429. [Google Scholar] [CrossRef] [PubMed]
- Villareal, D.T.; Chode, S.; Parimi, N.; Sinacore, D.R.; Hilton, T.; Armamento-Villareal, R.; Napoli, N.; Qualls, C.; Shah, K. Weight Loss, Exercise, or Both and Physical Function in Obese Older Adults. N. Engl. J. Med. 2011, 364, 1218–1229. [Google Scholar] [CrossRef]
- Pasiakos, S.M.; Cao, J.J.; Margolis, L.M.; Sauter, E.R.; Whigham, L.D.; McClung, J.P.; Rood, J.C.; Carbone, J.W.; Combs, G.F., Jr.; Young, A.J. Effects of high-protein diets on fat-free mass and muscle protein synthesis following weight loss: A randomized controlled trial. FASEB J. 2013, 27, 3837–3847. [Google Scholar] [CrossRef]
- Englert, I.; Bosy-Westphal, A.; Bischoff, S.C.; Kohlenberg-Müller, K. Impact of Protein Intake during Weight Loss on Preservation of Fat-Free Mass, Resting Energy Expenditure, and Physical Function in Overweight Postmenopausal Women: A Randomized Controlled Trial. Obes. Facts 2021, 14, 259–270. [Google Scholar] [CrossRef]
- Smith, G.I.; Commean, P.K.; Reeds, D.N.; Klein, S.; Mittendorfer, B. Effect of Protein Supplementation during Diet-Induced Weight Loss on Muscle Mass and Strength: A Randomized Controlled Study. Obesity 2018, 26, 854–861. [Google Scholar] [CrossRef] [PubMed]
- Weimann, A.; Fischer, M.; Oberänder, N.; Prodehl, G.; Weber, N.; Andrä, M.; Krug, J.; Wallstabe, I.; Schiefke, I.; Bischoff, S.C. Willing to go the extra mile: Prospective evaluation of an intensified non-surgical treatment for patients with morbid obesity. Clin. Nutr. 2019, 38, 1773–1781. [Google Scholar] [CrossRef]
- Dupertuis, Y.M.; Pereira, A.G.; Karsegard, V.L.; Hemmer, A.; Biolley, E.; Collet, T.-H.; Genton, L. Influence of the type of electrodes in the assessment of body composition by bioelectrical impedance analysis in the supine position. Clin. Nutr. 2022, 41, 2455–2463. [Google Scholar] [CrossRef]
- Krieger, J.W.; Sitren, H.S.; Daniels, M.J.; Langkamp-Henken, B. Effects of variation in protein and carbohydrate intake on body mass and composition during energy restriction: A meta-regression. Am. J. Clin. Nutr. 2006, 83, 260–274. [Google Scholar] [CrossRef]
- Wycherley, T.P.; Moran, L.J.; Clifton, P.M.; Noakes, M.; Brinkworth, G.D. Effects of energy-restricted high-protein, low-fat compared with standard-protein, low-fat diets: A meta-analysis of randomized controlled trials. Am. J. Clin. Nutr. 2012, 96, 1281–1298. [Google Scholar] [CrossRef] [PubMed]
- Ogilvie, A.R.; Schlussel, Y.; Sukumar, D.; Meng, L.; Shapses, S.A. Higher protein intake during caloric restriction improves diet quality and attenuates loss of lean body mass. Obesity 2022, 30, 1411–1419. [Google Scholar] [CrossRef] [PubMed]
- Layman, D.K.; Evans, E.; Baum, J.I.; Seyler, J.; Erickson, D.J.; Boileau, R.A. Dietary Protein and Exercise Have Additive Effects on Body Composition during Weight Loss in Adult Women. J. Nutr. 2005, 135, 1903–1910. [Google Scholar] [CrossRef] [PubMed]
- Camajani, E.; Persichetti, A.; Watanabe, M.; Contini, S.; Vari, M.; Di Bernardo, S.; Faro, M.; Lubrano, C.; Gnessi, L.; Caprio, M.; et al. Whey Protein, L-Leucine and Vitamin D Supplementation for Preserving Lean Mass during a Low-Calorie Diet in Sarcopenic Obese Women. Nutrients 2022, 14, 1884. [Google Scholar] [CrossRef] [PubMed]
- Due, A.; Toubro, S.; Skov, A.R.; Astrup, A. Effect of normal-fat diets, either medium or high in protein, on body weight in overweight subjects: A randomised 1-year trial. Int. J. Obes. 2004, 28, 1283–1290. [Google Scholar] [CrossRef] [PubMed]
- Das, S.K.; Gilhooly, C.H.; Golden, J.K.; Pittas, A.G.; Fuss, P.J.; A Cheatham, R.; Tyler, S.; Tsay, M.; A McCrory, M.; Lichtenstein, A.H.; et al. Long-term effects of 2 energy-restricted diets differing in glycemic load on dietary adherence, body composition, and metabolism in CALERIE: A 1-y randomized controlled trial. Am. J. Clin. Nutr. 2007, 85, 1023–1030. [Google Scholar] [CrossRef]
- Verreijen, A.M.; Engberink, M.F.; Memelink, R.G.; van der Plas, S.E.; Visser, M.; Weijs, P.J. Effect of a high protein diet and/or resistance exercise on the preservation of fat free mass during weight loss in overweight and obese older adults: A randomized controlled trial. Nutr. J. 2017, 16, 10. [Google Scholar] [CrossRef]
- Backx, E.M.P.; Tieland, M.; Berg, K.J.B.-V.D.; Claessen, P.R.; van Loon, L.J.C.; de Groot, L.C.P.G.M. Protein intake and lean body mass preservation during energy intake restriction in overweight older adults. Int. J. Obes. 2016, 40, 299–304. [Google Scholar] [CrossRef] [PubMed]
- Larsen, A.E.; Bibby, B.M.; Hansen, M. Effect of a Whey Protein Supplement on Preservation of Fat Free Mass in Overweight and Obese Individuals on an Energy Restricted Very Low Caloric Diet. Nutrients 2018, 10, 1918. [Google Scholar] [CrossRef]
- Muscogiuri, G.; El Ghoch, M.; Colao, A.; Hassapidou, M.; Yumuk, V.; Busetto, L.; Obesity Management Task Force (OMTF) of the European Association for the Study of Obesity (EASO). European Guidelines for Obesity Management in Adults with a Very Low-Calorie Ketogenic Diet: A Systematic Review and Meta-Analysis. Obes. Facts 2021, 14, 222–245. [Google Scholar] [CrossRef]
- Layman, D.K.; Boileau, R.A.; Erickson, D.J.; Painter, J.E.; Shiue, H.; Sather, C.; Christou, D.D. A Reduced Ratio of Dietary Carbohydrate to Protein Improves Body Composition and Blood Lipid Profiles during Weight Loss in Adult Women. J. Nutr. 2003, 133, 411–417. [Google Scholar] [CrossRef]
- Campos-Nonato, I.; Hernandez, L.; Barquera, S. Effect of a High-Protein Diet versus Standard-Protein Diet on Weight Loss and Biomarkers of Metabolic Syndrome: A Randomized Clinical Trial. Obes. Facts 2017, 10, 238–251. [Google Scholar] [CrossRef] [PubMed]
- Bull, F.C.; Al-Ansari, S.S.; Biddle, S.; Borodulin, K.; Buman, M.P.; Cardon, G.; Carty, C.; Chaput, J.-P.; Chastin, S.; Chou, R.; et al. World Health Organization 2020 guidelines on physical activity and sedentary behaviour. Br. J. Sports Med. 2020, 54, 1451–1462. [Google Scholar] [CrossRef] [PubMed]
- Yoshinaga, I.; Yasutake, K.; Moriguchi, R.; Imai, K.; Abe, S.; Ono, M.; Ueno, H.; Watanabe, K.; Kato, M.; Nakano, S.; et al. Relationship between underreporting of energy intake and blood ketone levels in Japanese women with obesity: A retrospective study. Exp. Ther. Med. 2023, 25, 97. [Google Scholar] [CrossRef]
- Fischer, M.; Weimann, T.; Oberänder, N.; Schupitza, L.; Hösel, J.; Weimann, A. Remote Treatment Successfully Delivers a Usual Care Weight Loss and Lifestyle Intervention in Adults with Morbid Obesity. Ann. Nutr. Metab. 2022, 78, 328–335. [Google Scholar] [CrossRef] [PubMed]
- Walowski, C.O.; Braun, W.; Maisch, M.J.; Jensen, B.; Peine, S.; Norman, K.; Müller, M.J.; Bosy-Westphal, A. Reference Values for Skeletal Muscle Mass—Current Concepts and Methodological Considerations. Nutrients 2020, 12, 755. [Google Scholar] [CrossRef]
- Weigle, D.S.; A Breen, P.; Matthys, C.C.; Callahan, H.S.; E Meeuws, K.; Burden, V.R.; Purnell, J.Q. A high-protein diet induces sustained reductions in appetite, ad libitum caloric intake, and body weight despite compensatory changes in diurnal plasma leptin and ghrelin concentrations. Am. J. Clin. Nutr. 2005, 82, 41–48. [Google Scholar] [CrossRef]
- Westerterp, K.; Wilson, S.; Rolland, V. Diet induced thermogenesis measured over 24h in a respiration chamber: Effect of diet composition. Int. J. Obes. 1999, 23, 287–292. [Google Scholar] [CrossRef] [PubMed]
- Westerterp-Plantenga, M.; Nieuwenhuizen, A.; Tomé, D.; Soenen, S.; Westerterp, K. Dietary Protein, Weight Loss, and Weight Maintenance. Annu. Rev. Nutr. 2009, 29, 21–41. [Google Scholar] [CrossRef]
- Westerterp-Plantenga, M.S.; Lemmens, S.G.; Westerterp, K.R. Dietary protein—Its role in satiety, energetics, weight loss and health. Br. J. Nutr. 2012, 108, S105–S112. [Google Scholar] [CrossRef]


| Variables | Control Group (CG) | Protein Group (PG) | p-Value a |
|---|---|---|---|
| Number of patients (n) | 148 (100%) | 119 (100%) | |
| Age [years] | 46.3 (±11.8) | 45.2 (±13.1) | 0.504 |
| Sex [female:male] | 101:47 (68.2:31.8%) | 84:35 (70.6:29.4%) | 0.691 |
| Education [<12 y:≥12 y] | 111:37 (25:75%) | 81:38 (68.1:31.9%) | 0.220 |
| Gastric balloon [yes:no] | 92: 56 (37.6:62.2%) | 65:54 (54.6:45.4%) | 0.260 |
| Height [m] | 1.67 (±0.10) | 1.69 (±0.10) | 0.328 |
| Body weight [kg] | 136 (±27.9) | 132 (±26.8) | 0.276 |
| BMI [kg/m2] | 48.2 (±8.02) | 46.3 (±8.50) | 0.070 |
| Normalized body weight b [kg] | 61.9 (±7.19) | 62.8 (±7.31) | 0.329 |
| Waist–hip ratio | 1.03 (±0.08) | 1.04 (±0.08) | 0.738 |
| HbA1c c | 6.70 (5.20–13.9) | 6.55 (5.50–8.80) | 0.399 |
| Body fat [kg] | 66.4 (±18.3) | 63.5 (±17.5) | 0.198 |
| Body fat [%] | 48.8 (±7.36) | 47.9 (±7.43) | 0.352 |
| Total body water [L] | 51.9 (±12.9) | 51.1 (±12.7) | 0.641 |
| Lean body mass (LBM) [kg] | 70.8 (±17.6) | 69.8 (±17.3) | 0.633 |
| Extracellular mass (ECM) [kg] | 35.4 (±9.06) | 35.1 (±8.53) | 0.786 |
| Body cell mass (BCM) [kg] | 35.4 (±9.71) | 34.7 (±9.57) | 0.546 |
| ECM/BCM | 1.02 (±0.18) | 1.03 (±0.16) | 0.608 |
| Basal metabolic rate [kcal] | 1736 (±307) | 1714 (±302) | 0.552 |
| Phase angle [°] | 5.66 (±0.81) | 5.57 (±0.71) | 0.348 |
| t0 | t1 | |||||
|---|---|---|---|---|---|---|
| Mean (SD) | Mean (SD) | Diff. | p-Value (Time) a | p-Value (Time × Group) b | ||
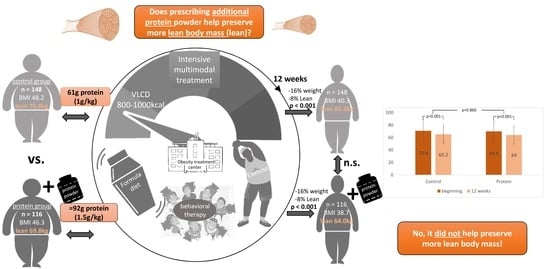
| Body weight [kg] | CG (n = 148) | 136 (±27.8) | 113 (±24.5) | 22.2 (16.4%) | ||
| PG (n = 119) | 132 (±26.8) | 110 (±23.5) | 21.6 (16.4%) | <0.001 | 0.571 | |
| BMI [kg/m2] | CG (n = 148) | 48.2 (±8.02) | 40.3 (±7.29) | 7.84 (16.3%) | ||
| PG (n = 119) | 46.3 (±8.50) | 38.7 (±7.93) | 7.61 (16.4%) | <0.001 | 0.444 | |
| LBM [kg] | CG (n = 148) | 70.8 (17.6) | 65.2 (15.4) | 5.68 (8.02%) | ||
| PG (n = 119) | 69.8 (17.3) | 64.0 (14.3) | 5.79 (8.30%) | <0.001 | 0.860 |
Disclaimer/Publisher’s Note: The statements, opinions and data contained in all publications are solely those of the individual author(s) and contributor(s) and not of MDPI and/or the editor(s). MDPI and/or the editor(s) disclaim responsibility for any injury to people or property resulting from any ideas, methods, instructions or products referred to in the content. |
© 2024 by the authors. Licensee MDPI, Basel, Switzerland. This article is an open access article distributed under the terms and conditions of the Creative Commons Attribution (CC BY) license (https://creativecommons.org/licenses/by/4.0/).
Share and Cite
Stein, W.; Sauer, H.J.; Oberänder, N.; Weimann, A.; Fischer, M. Effects of Additional Protein Intake on Lean Body Mass in Patients Undergoing Multimodal Treatment for Morbid Obesity. Nutrients 2024, 16, 864. https://doi.org/10.3390/nu16060864
Stein W, Sauer HJ, Oberänder N, Weimann A, Fischer M. Effects of Additional Protein Intake on Lean Body Mass in Patients Undergoing Multimodal Treatment for Morbid Obesity. Nutrients. 2024; 16(6):864. https://doi.org/10.3390/nu16060864
Chicago/Turabian StyleStein, Wiebke, Helen Josephine Sauer, Nadine Oberänder, Arved Weimann, and Martin Fischer. 2024. "Effects of Additional Protein Intake on Lean Body Mass in Patients Undergoing Multimodal Treatment for Morbid Obesity" Nutrients 16, no. 6: 864. https://doi.org/10.3390/nu16060864
APA StyleStein, W., Sauer, H. J., Oberänder, N., Weimann, A., & Fischer, M. (2024). Effects of Additional Protein Intake on Lean Body Mass in Patients Undergoing Multimodal Treatment for Morbid Obesity. Nutrients, 16(6), 864. https://doi.org/10.3390/nu16060864