
Glutathione Supplementation Prevents Neonatal Parenteral Nutrition-Induced Short- and Long-Term Epigenetic and Transcriptional Disruptions of Hepatic H2O2 Metabolism in Guinea Pigs


Abstract

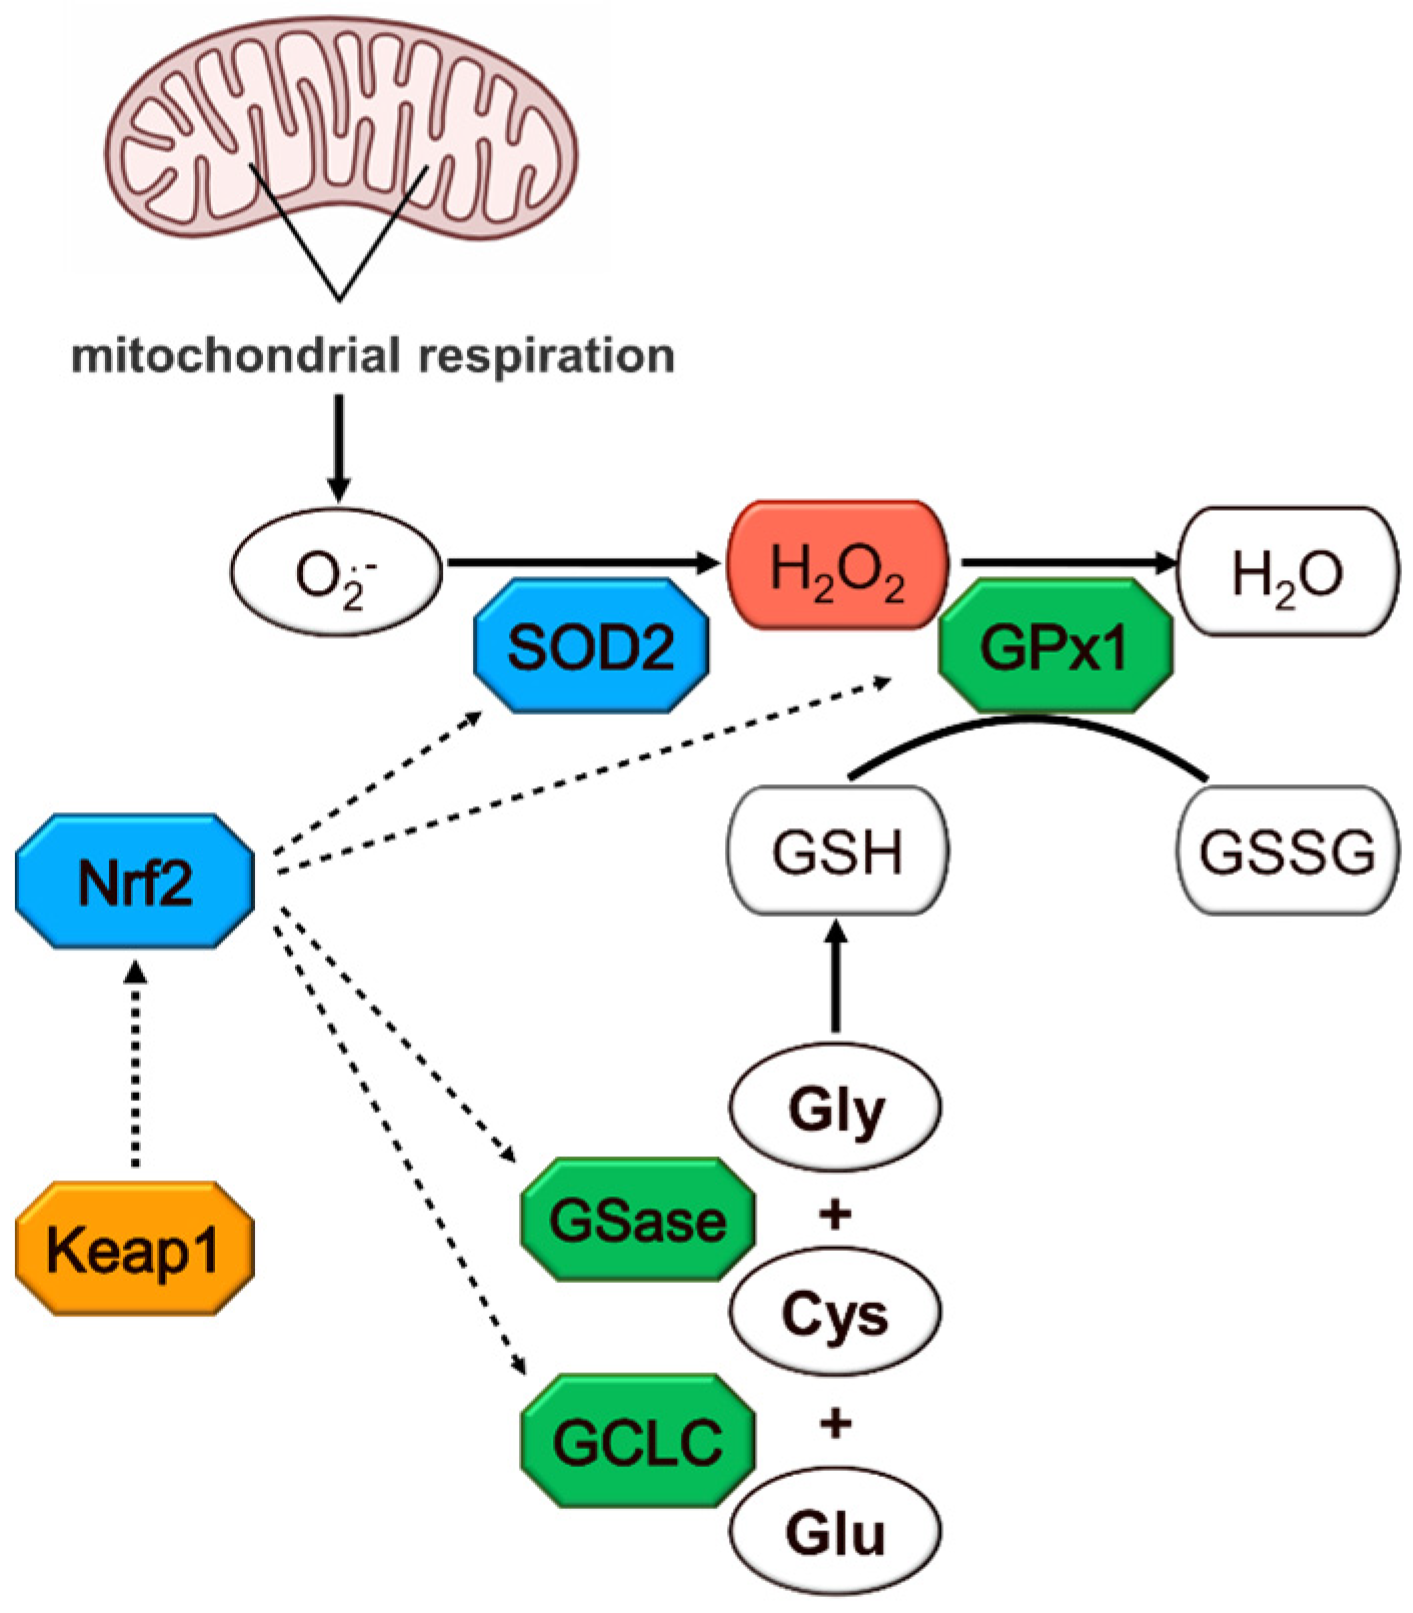
1. Introduction
2. Materials and Methods
2.1. Experimental Procedures
2.2. Biochemical Assessments
2.2.1. DNA and RNA Extraction
2.2.2. Methylation Analysis
Promoter Analysis and Primer Design
Immunoprecipitation of Genomic DNA
qPCR Analysis of Immunoprecipitated DNA
Gene Expression Analysis by RT-qPCR
2.3. Statistics
3. Results
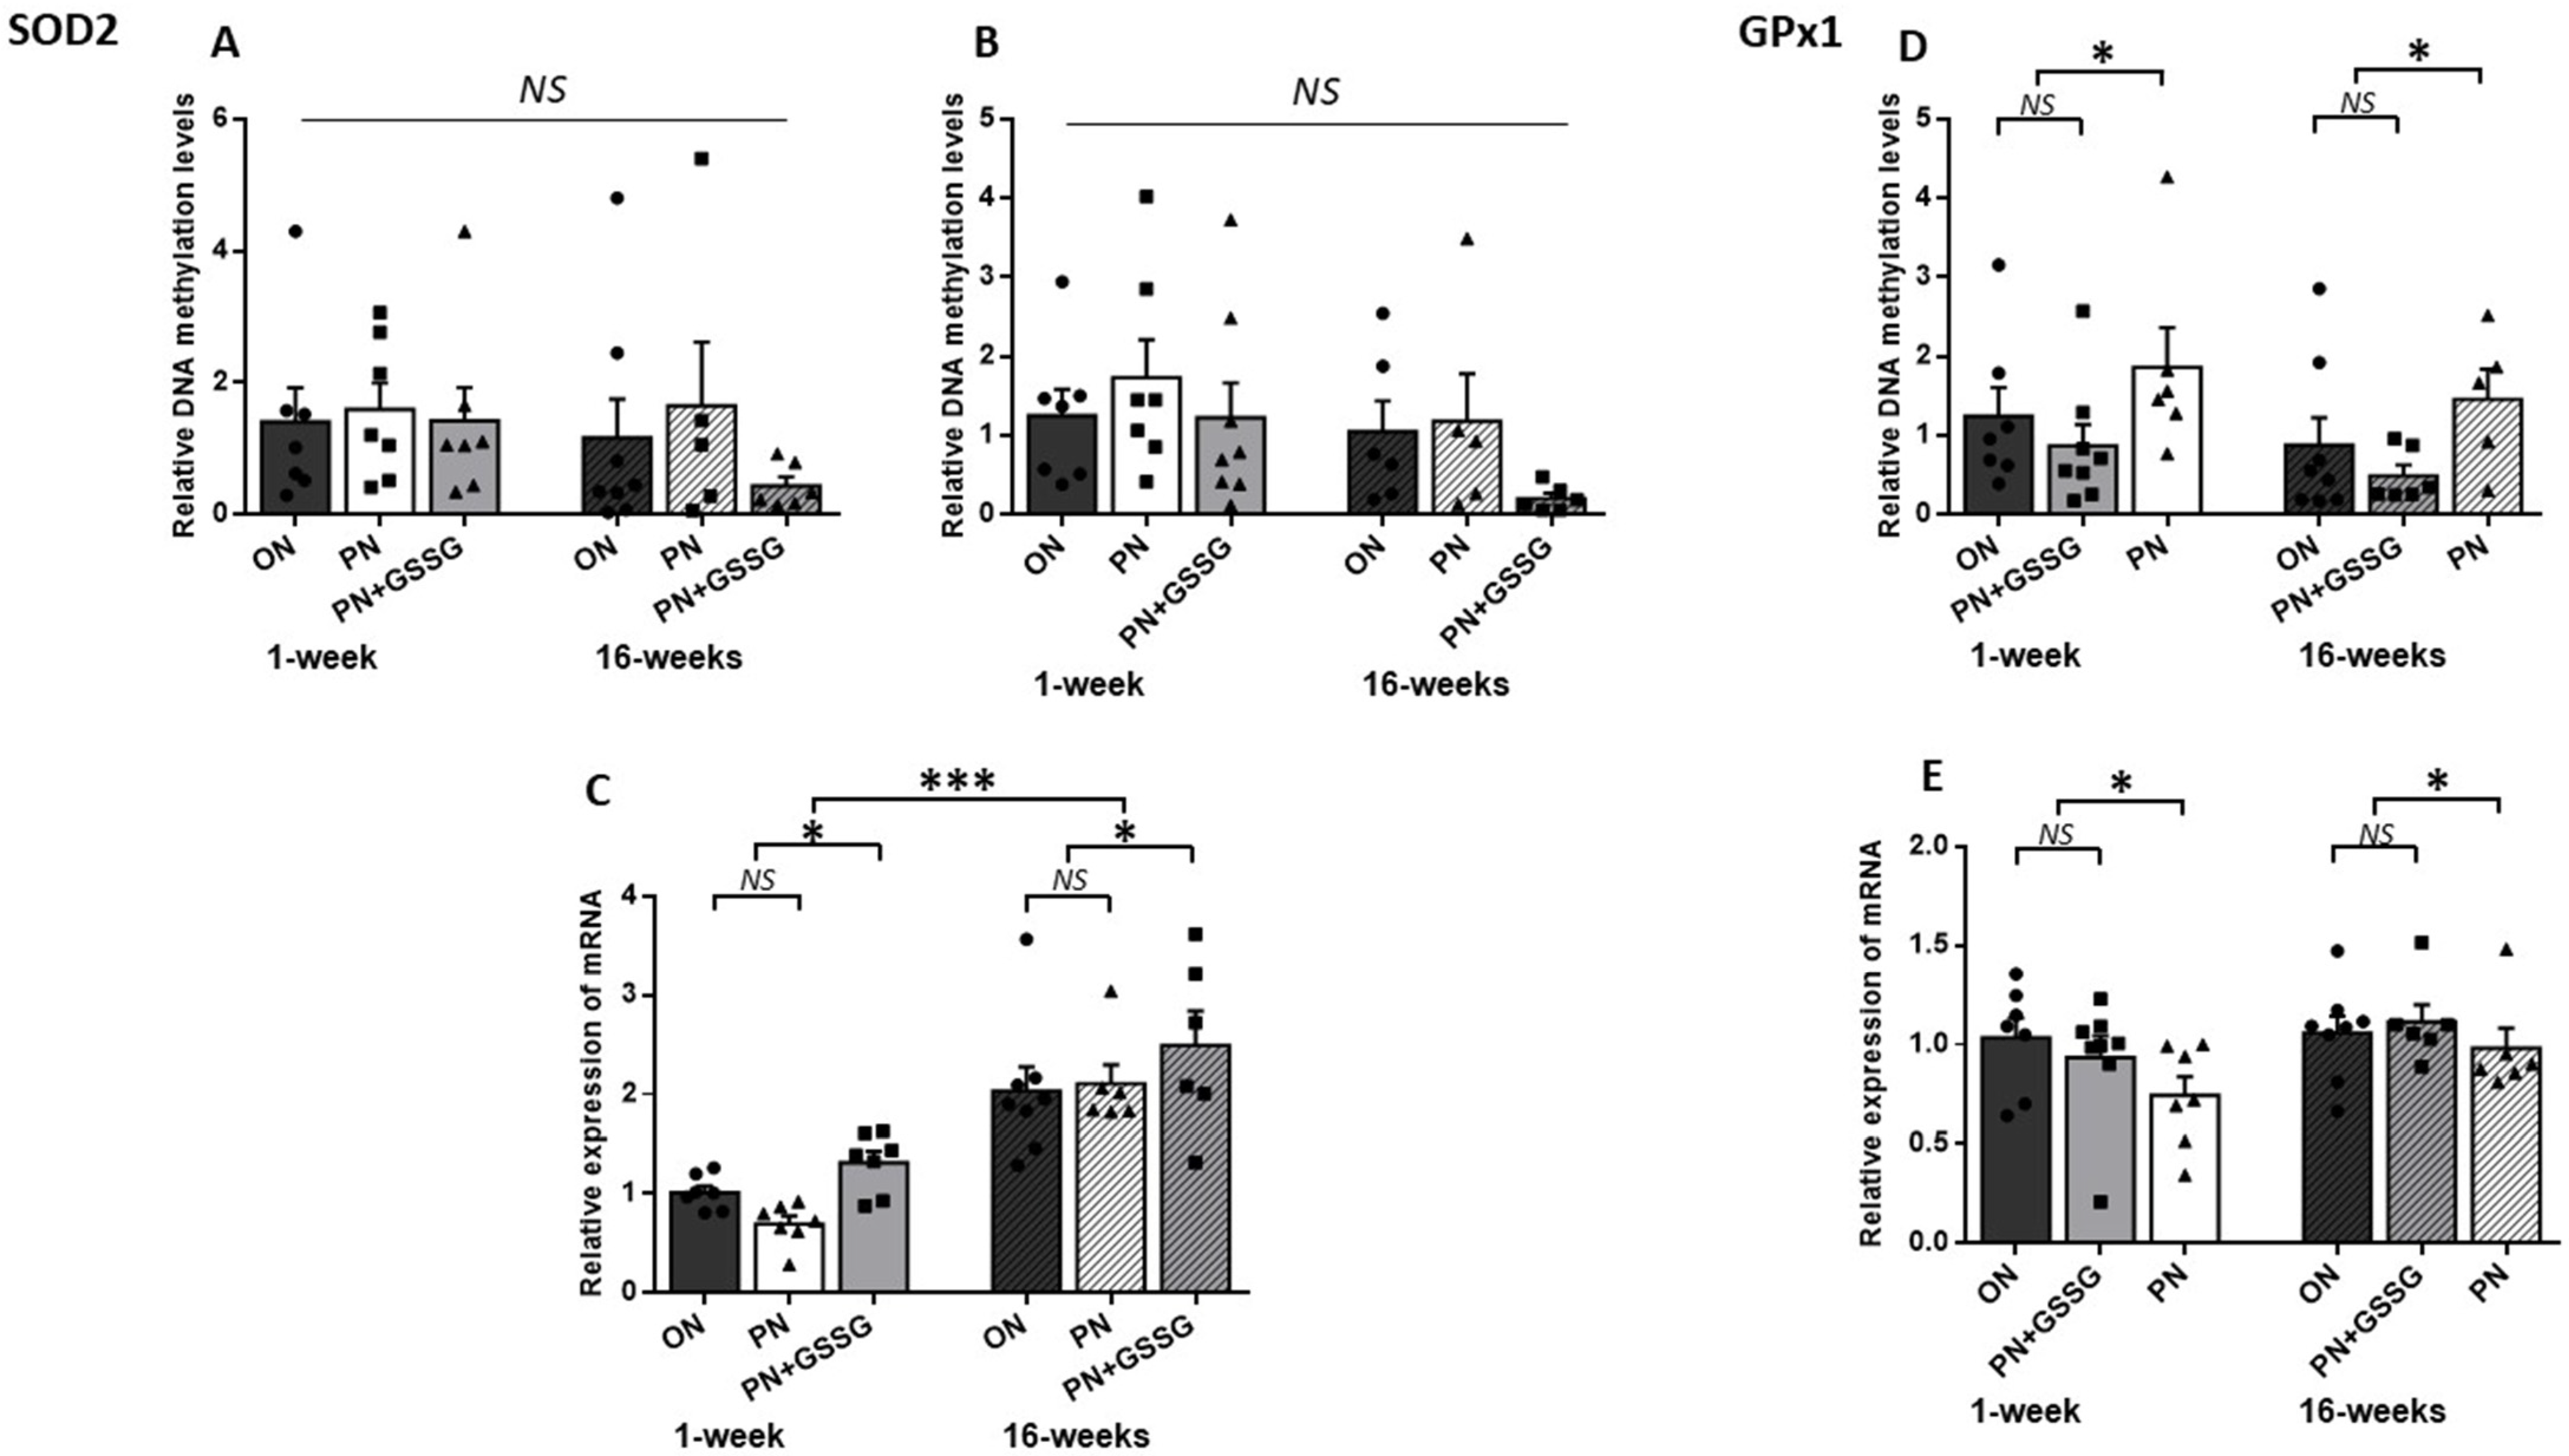
3.1. SOD2 and GPx1
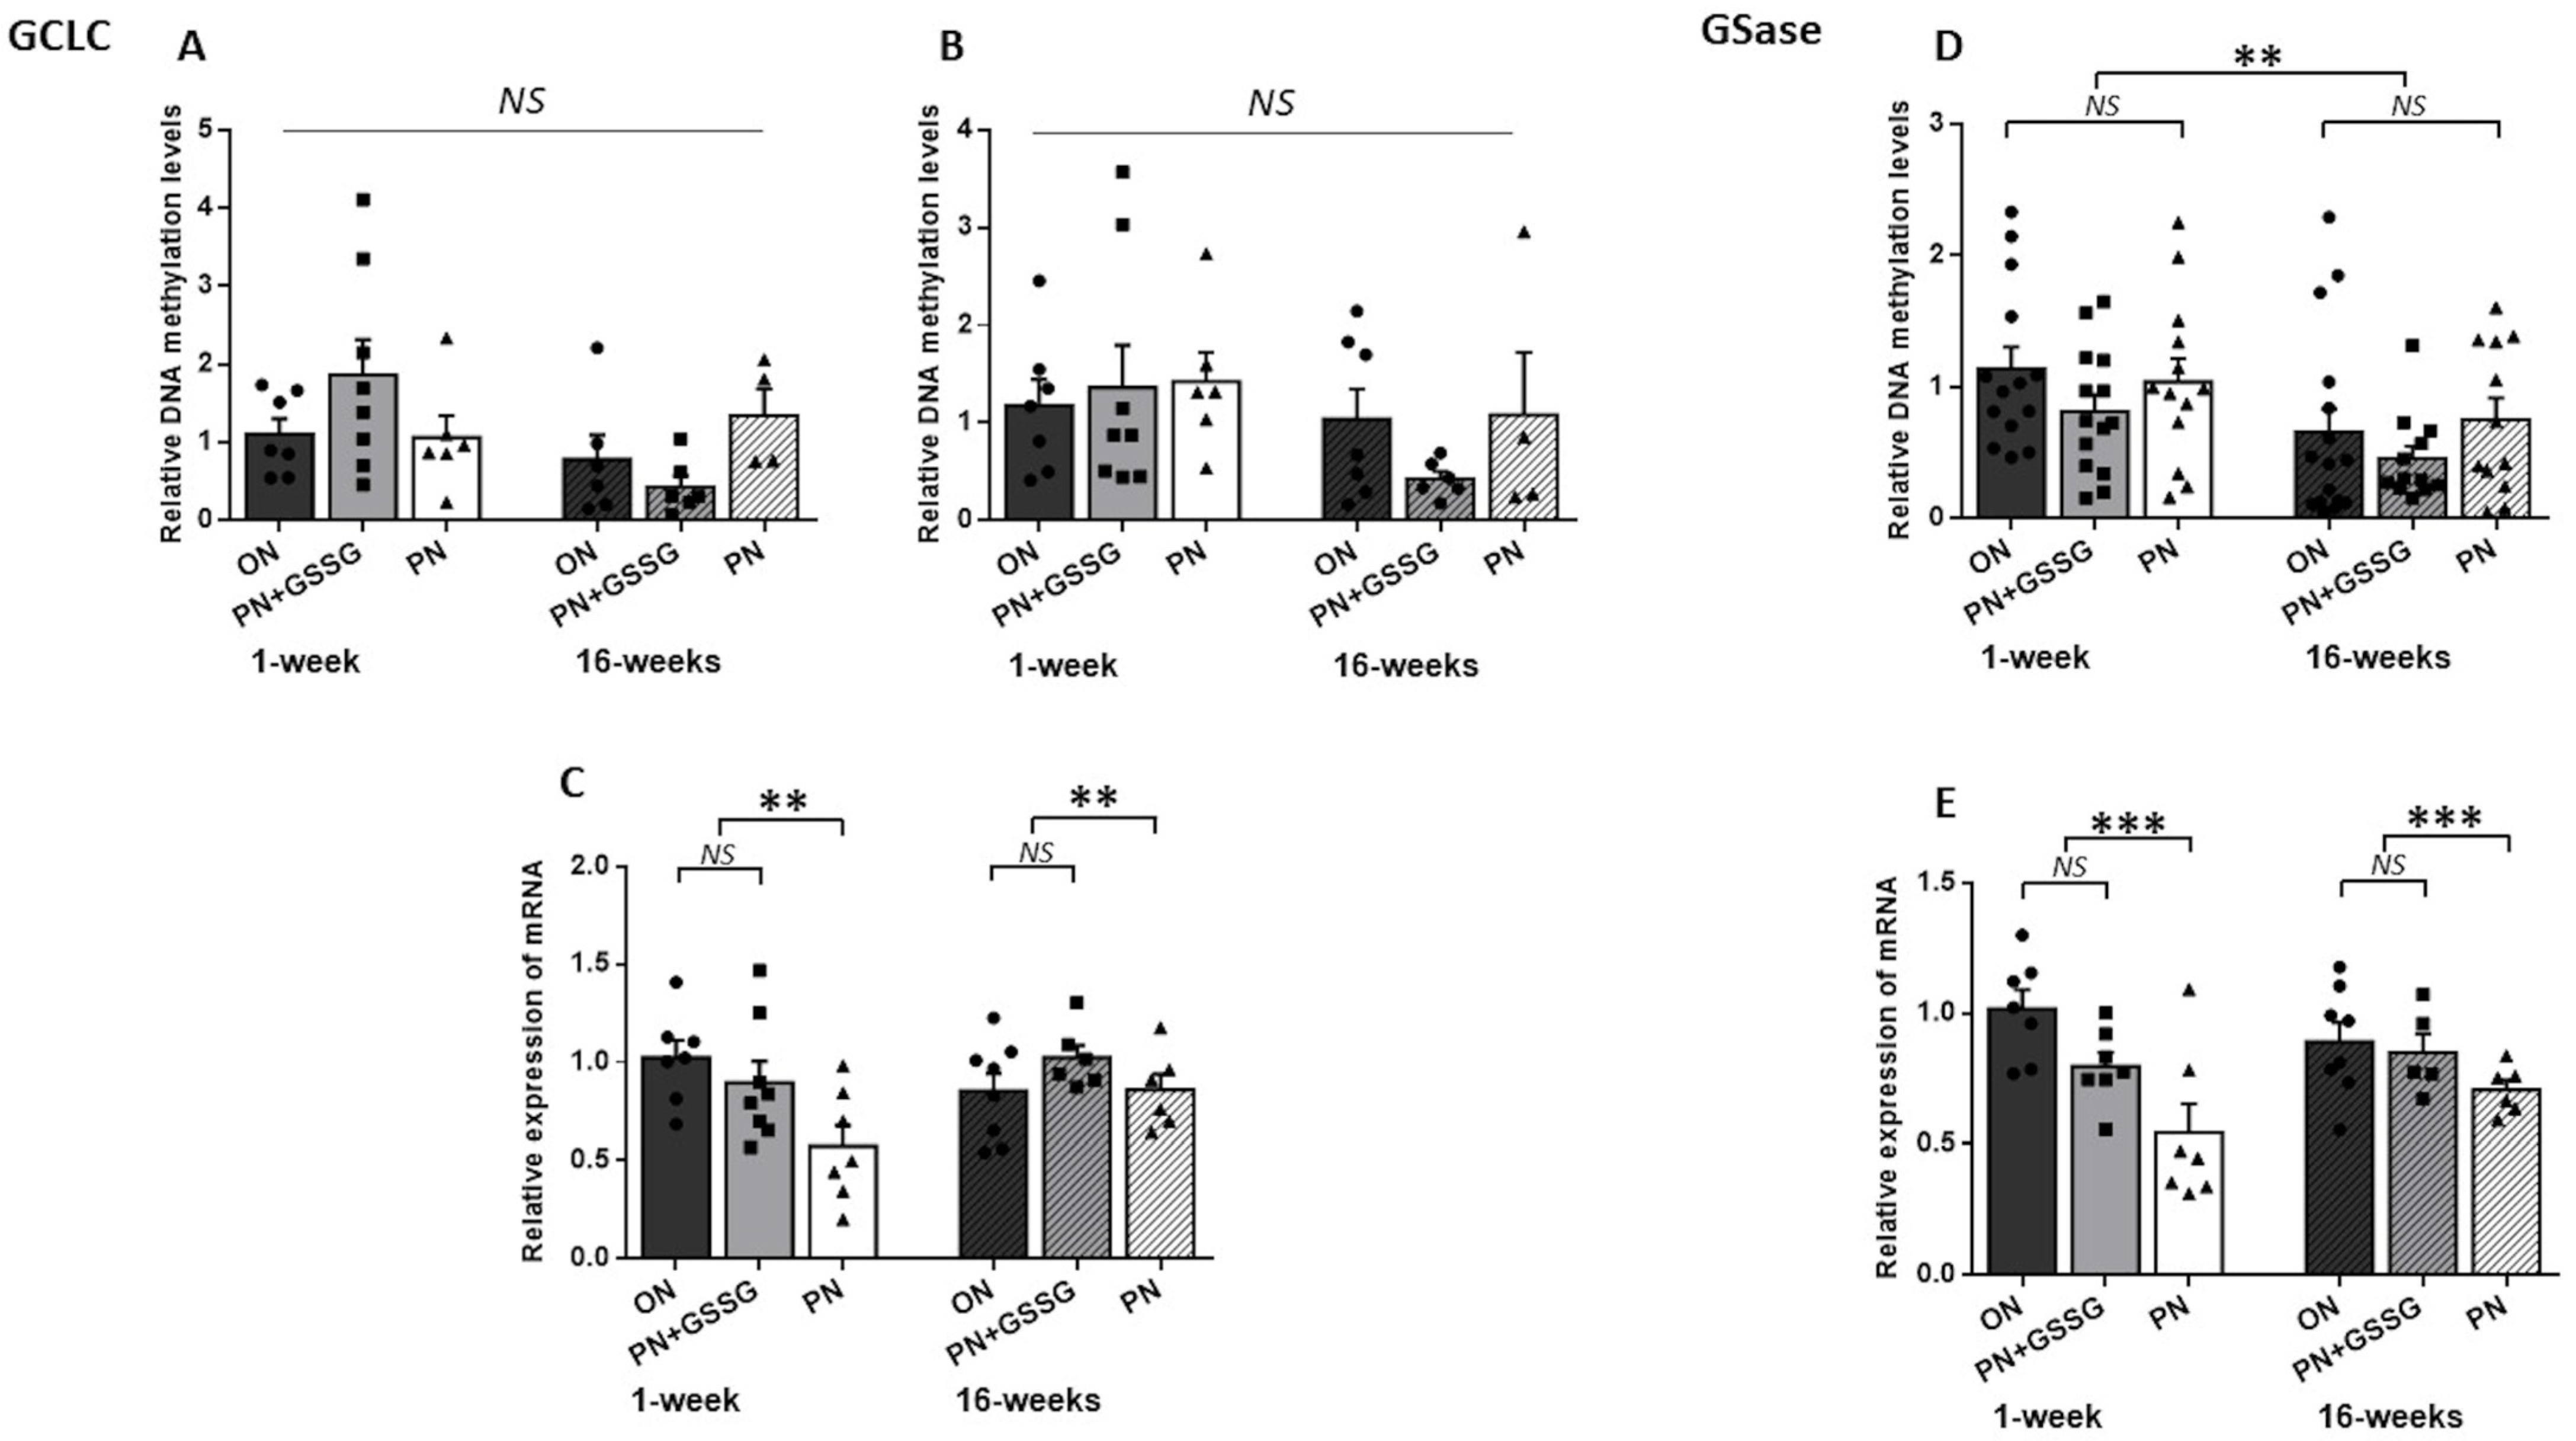
3.2. GCLC and GSase
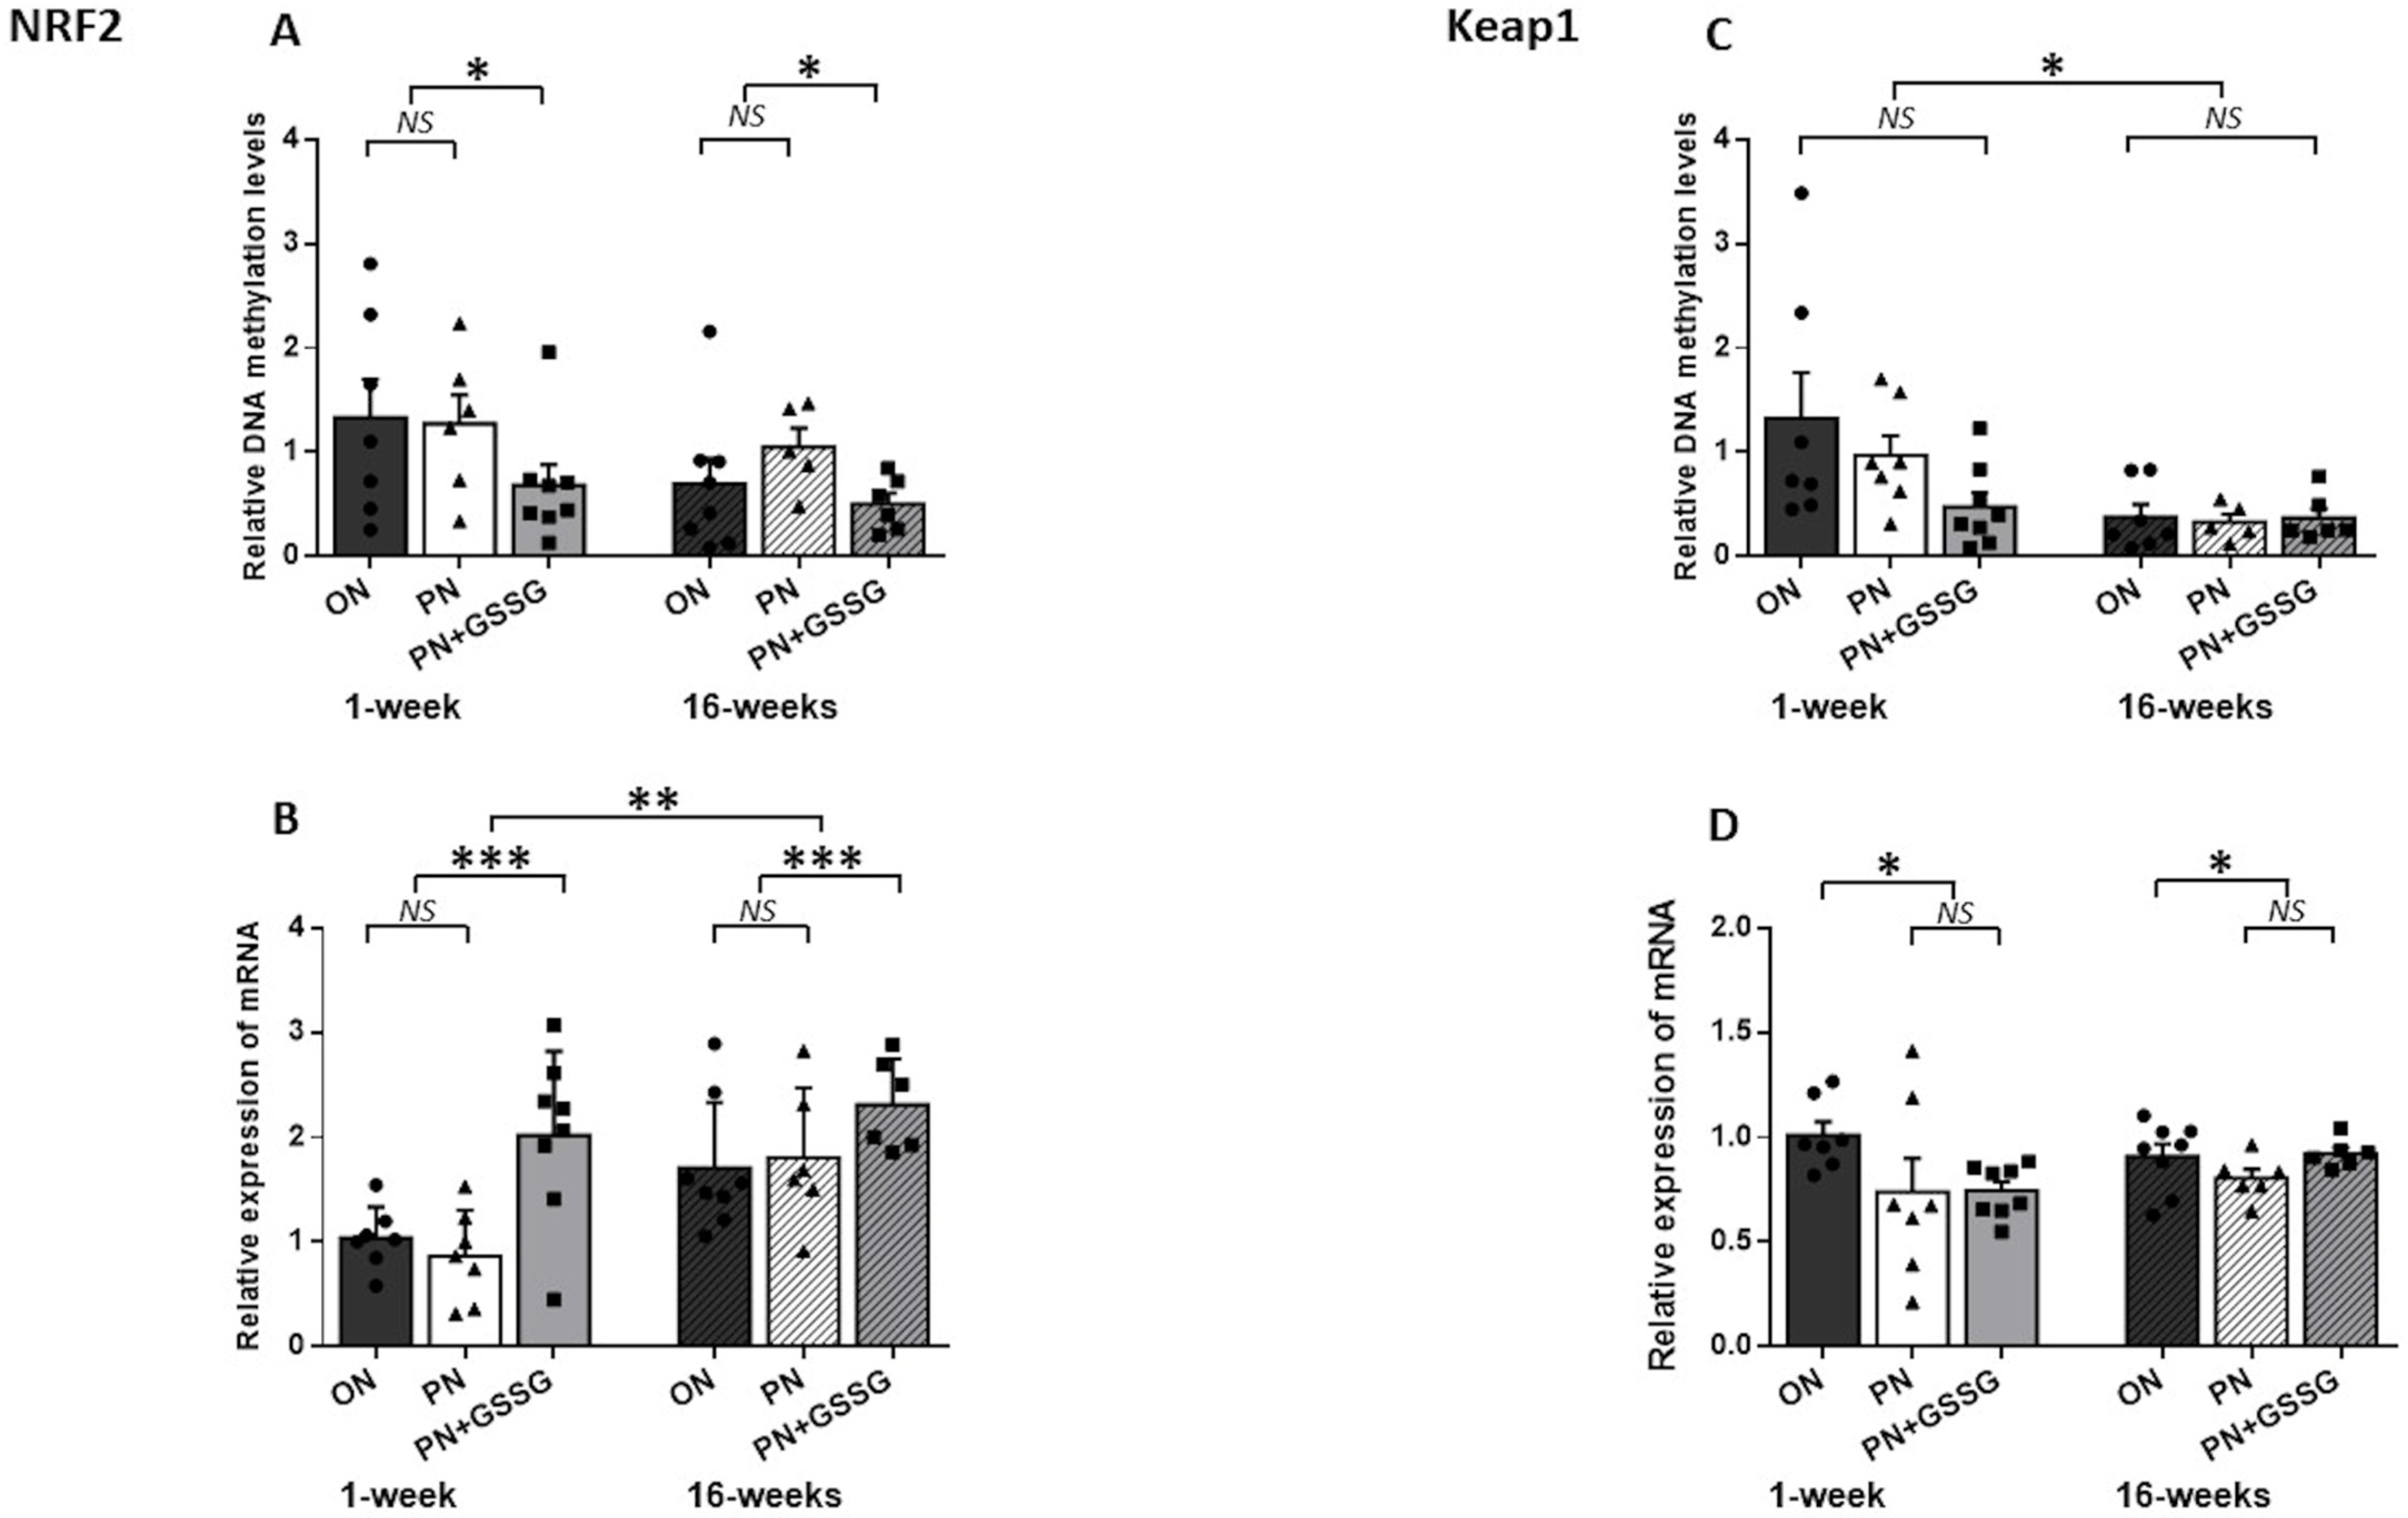
3.3. Nrf2 and Keap1
4. Discussion
5. Conclusions
Author Contributions
Funding
Institutional Review Board Statement
Informed Consent Statement
Data Availability Statement
Conflicts of Interest
References
- Barker, D.J. The effect of nutrition of the fetus and neonate on cardiovascular disease in adult life. Proc. Nutr. Soc. 1992, 51, 135–144. [Google Scholar] [CrossRef] [PubMed]
- Li, Y.; He, Y.; Qi, L.; Jaddoe, V.W.; Feskens, E.J.; Yang, X.; Ma, G.; Hu, F.B. Exposure to the Chinese famine in early life and the risk of hyperglycemia and type 2 diabetes in adulthood. Diabetes 2010, 59, 2400–2406. [Google Scholar] [CrossRef] [PubMed]
- Fall, C.H.D. Fetal programming and the risk of noncommunicable disease. India J. Pediatr. 2013, 80, S13–S20. [Google Scholar] [CrossRef] [PubMed]
- Kistner, A.; Celsi, G.; Vanpée, M.; Jacobson, S.H. Increased systolic daily ambulatory blood pressure in adult women born preterm. Pediatr. Nephrol. 2005, 20, 232–233. [Google Scholar] [CrossRef] [PubMed]
- Bonamy, A.K.; Kallen, K.; Norman, M. High blood pressure in 2.5-year-old children born extremely preterm. Pediatrics 2012, 129, e1199–e1204. [Google Scholar] [CrossRef] [PubMed]
- Vohr, B.R.; Heyne, R.; Bann, C.M.; Das, A.; Higgins, R.D.; Hintz, S.R.; Eunice Kennedy Shriver National Institute of Child Health; Development Neonatal Research Network. Extreme Preterm Infant Rates of Overweight and Obesity at School Age in the SUPPORT Neuroimaging and Neurodevelopmental Outcomes Cohort. J. Pediatr. 2018, 200, 132–139.e3. [Google Scholar] [CrossRef]
- Markopoulou, P.; Papanikolaou, E.; Analytis, A.; Zoumakis, E.; Siahanidou, T. Preterm Birth as a Risk Factor for Metabolic Syndrome and Cardiovascular Disease in Adult Life: A Systematic Review and Meta-Analysis. J. Pediatr. 2019, 210, 69–80.e5. [Google Scholar] [CrossRef]
- Lavoie, J.C.; Chessex, P. Parenteral nutrition and oxidant stress in the newborn: A narrative review. Free Radic. Biol. Med. 2019, 142, 155–167. [Google Scholar] [CrossRef]
- Karthigesu, K.; Bertolo, R.F.; Brown, R.J. Parenteral Nutrition and Oxidant Load in Neonates. Nutrients 2021, 13, 2631. [Google Scholar] [CrossRef]
- Buonocore, G.; Perrone, S.; Longini, M.; Vezzosi, P.; Marzocchi, B.; Paffetti, P.; Bracci, R. Oxidative stress in preterm neonates at birth and on the seventh day of life. Pediatr. Res. 2002, 52, 46–49. [Google Scholar] [CrossRef]
- Cipierre, C.; Haÿs, S.; Maucort-Boulch, D.; Steghens, J.; Picaud, J. Malondialdehyde adduct to hemoglobin: A new marker of oxidative stress suitable for full-term and preterm neonates. Oxidative Med. Cell. Longev. 2013, 2013, 694014. [Google Scholar] [CrossRef]
- Ochoa, J.J.; Ramirez-Tortosa, M.C.; Quiles, J.L.; Palomino, N.; Robles, R.; Mataix, J.; Huertas, J.R. Oxidative stress in erythrocytes from premature and full-term infants during their first 72h of life. Free Radic. Res. 2003, 37, 317–322. [Google Scholar] [CrossRef] [PubMed]
- Huang, J.Q.; Zhou, J.C.; Wu, Y.Y.; Ren, F.Z.; Lei, X.G. Role of glutathione peroxidase 1 in glucose and lipid metabolism-related diseases. Free Radic. Biol. Med. 2018, 127, 108–115. [Google Scholar] [CrossRef]
- Khashu, M.; Harrison, A.; Lalari, V.; Lavoie, J.C.; Chessex, P. Impact of shielding parenteral nutrition from light on routine monitoring of blood glucose and triglyceride levels in preterm neonates. Arch. Dis. Child. Fetal Neonatal Ed. 2009, 94, F111–F115. [Google Scholar] [CrossRef]
- Teixeira, V.; Guiraut, C.; Mohamed, I.; Lavoie, J.C. Neonatal parenteral nutrition affects the metabolic flow of glucose in newborn and adult male Hartley guinea pigs’ liver. J. Dev. Orig. Health Dis. 2021, 12, 484–495. [Google Scholar] [CrossRef]
- Verlinden, I.; Guiza, F.; Derese, I.; Wouters, P.J.; Joosten, K.; Verbruggen, S.C.; Van den Berghe, G.; Vanhorebeek, I. Time course of altered DNA methylation evoked by critical illness and by early administration of parenteral nutrition in the paediatric ICU. Clin. Epigenet. 2020, 12, 155. [Google Scholar] [CrossRef] [PubMed]
- Mungala Lengo, A.; Guiraut, C.; Mohamed, I.; Lavoie, J.C. Relationship between redox potential of glutathione and DNA methylation level in liver of newborn guinea pigs. Epigenetics 2020, 15, 1348–1360. [Google Scholar] [CrossRef] [PubMed]
- Mikhed, Y.; Görlach, A.; Knaus, U.G.; Daiber, A. Redox regulation of genome stability by effects on gene expression, epigenetic pathways and DNA damage/repair. Redox Biol. 2015, 5, 275–289. [Google Scholar] [CrossRef]
- Steinbrenner, H. Interference of selenium and selenoproteins with the insulin-regulated carbohydrate and lipid metabolism. Free Radic. Biol. Med. 2013, 65, 1538–1547. [Google Scholar] [CrossRef]
- Lennicke, C.; Cochemé, H.M. Redox metabolism: ROS as specific molecular regulators of cell signaling and function. Mol. Cell 2021, 81, 3691–3707. [Google Scholar] [CrossRef]
- Rook, D.; Te Braake, F.W.; Schierbeek, H.; Longini, M.; Buonocore, G.; Van Goudoever, J.B. Glutathione Synthesis Rates in Early Postnatal Life. Pediatr. Res. 2010, 67, 407–411. [Google Scholar] [CrossRef] [PubMed]
- Jain, A.; Mehta, T.; Auld, P.A.; Rodrigues, J.; Ward, R.F.; Schwartz, M.K.; Martensson, J. Glutathione metabolism in newborns: Evidence for glutathione deficiency in plasma, bronchoalveolar lavage fluid, and lymphocytes in prematures. Pediatr. Pulmonol. 1995, 20, 160–166. [Google Scholar] [CrossRef] [PubMed]
- Viña, J.; Vento, M.; Garcia-Sala, F.; Puertes, I.; Gasco, E.; Sastre, J.; Asensi, M.; Pallardo, F. L-cysteine and glutathione metabolism are impaired in premature infants due to cystathionase deficiency. Am. J. Clin. Nutr. 1995, 61, 1067–1069. [Google Scholar] [CrossRef]
- Lavoie, J.C.; Mohamed, I.; Teixeira, V. Dose-Response Effects of Glutathione Supplement in Parenteral Nutrition on Pulmonary Oxidative Stress and Alveolarization in Newborn Guinea Pig. Antioxidants 2022, 11, 1956. [Google Scholar] [CrossRef] [PubMed]
- Bachhawat, A.K.; Yadav, S. The glutathione cycle: Glutathione metabolism beyond the gamma-glutamyl cycle. IUBMB Life 2018, 70, 585–592. [Google Scholar] [CrossRef]
- Raichani, N.E.; Guiraut, C.; Morin, G.; Mohamed, I.; Lavoie, J.C. Stability of glutathione added as a supplement to parenteral nutrition. JPEN J. Parenter. Enter. Nutr. 2022, 46, 1080–1087. [Google Scholar] [CrossRef]
- Silvers, K.M.; Sluis, K.B.; Darlow, B.A.; McGill, F.; Stocker, R.; Winterbourn, C.C. Limiting light-induced lipid peroxidation and vitamin loss in infant parenteral nutrition by adding multivitamin preparations to Intralipid. Acta Paediatr. 2001, 90, 242–249. [Google Scholar]
- Karpova, N.N.; Umemori, J. Protocol for Methylated DNA Immunoprecipitation (MeDIP) Analysis. In Epigenetic Methods in Neuroscience Research; Neuromethods; Springer: New York, NY, USA, 2016; pp. 97–114. [Google Scholar]
- Schmittgen, T.D.; Livak, K.J. Analyzing real-time PCR data by the comparative C(T) method. Nat. Protoc. 2008, 3, 1101–1108. [Google Scholar] [CrossRef]
- Jones, P.A. Functions of DNA methylation: Islands, start sites, gene bodies and beyond. Nat. Rev. Genet. 2012, 13, 484–492. [Google Scholar] [CrossRef]
- Nguyen, A.; Duquette, N.; Mamarbachi, M.; Thorin, E. Epigenetic Regulatory Effect of Exercise on Glutathione Peroxidase 1 Expression in the Skeletal Muscle of Severely Dyslipidemic Mice. PLoS ONE 2016, 11, e0151526. [Google Scholar] [CrossRef]
- Yin, R.; Mao, S.Q.; Zhao, B.; Chong, Z.; Yang, Y.; Zhao, C.; Zhang, D.; Huang, H.; Gao, J.; Li, Z.; et al. Ascorbic acid enhances Tet-mediated 5-methylcytosine oxidation and promotes DNA demethylation in mammals. J. Am. Chem. Soc. 2013, 135, 10396–10403. [Google Scholar] [CrossRef]
- Blankenberg, S.; Rupprecht, H.J.; Bickel, C.; Torzewski, M.; Hafner, G.; Tiret, L.; Smieja, M.; Cambien, F.; Meyer, J.; Lackner, K.J.; et al. Glutathione peroxidase 1 activity and cardiovascular events in patients with coronary artery disease. N. Engl. J. Med. 2003, 349, 1605–1613. [Google Scholar] [CrossRef]
- Winter, J.P.; Gong, Y.; Grant, P.J.; Wild, C.P. Glutathione peroxidase 1 genotype is associated with an increased risk of coronary artery disease. Coron. Artery Dis. 2003, 14, 149–153. [Google Scholar] [CrossRef] [PubMed]
- Sadi, G.; Bozan, D.; Yildiz, H.B. Redox regulation of antioxidant enzymes: Post-translational modulation of catalase and glutathione peroxidase activity by resveratrol in diabetic rat liver. Mol. Cell. Biochem. 2014, 393, 111–122. [Google Scholar] [CrossRef]
- Kuzuya, M.; Ando, F.; Iguchi, A.; Shimokata, H. Glutathione peroxidase 1 Pro198Leu variant contributes to the metabolic syndrome in men in a large Japanese cohort. Am. J. Clin. Nutr. 2008, 87, 1939–1944. [Google Scholar] [CrossRef] [PubMed]
- Skinner, M.; Lumey, L.H.; Fleming, T.P.; Sapienza, C.; Hoyo, C.; Aronica, L.; Thompson, J.; Nichol, P.F. RW-2018-Research Workshop: The Effect of Nutrition on Epigenetic Status, Growth, and Health. JPEN J. Parenter. Enter. Nutr. 2019, 43, 627–637. [Google Scholar] [CrossRef] [PubMed]
- Silvers, A.; Darlow, B.A.; Winterbourn, C.C. Lipid Peroxide and Hydrogen Peroxide Formation in Parenteral Nutrition Solutions Containing Multivitamins. JPEN J. Parenter. Enteral. Nutr. 2001, 25, 14–17. [Google Scholar] [CrossRef]
- Neuzil, J.; Darlow, B.A.; Inder, T.E.; Sluis, K.B.; Winterbourn, C.C.; Stocker, R. Oxidation of parenteral lipid emulsion by ambient and phototherapy lights: Potential toxicity of routine parenteral feeding. J. Pediatr. 1995, 126, 785–790. [Google Scholar] [CrossRef]
- Chiurchiu, V.; Maccarrone, M. Chronic inflammatory disorders and their redox control: From molecular mechanisms to therapeutic opportunities. Antioxid. Redox Signal. 2011, 15, 2605–2641. [Google Scholar] [CrossRef]
- Kaneto, H.; Katakami, N.; Kawamori, D.; Miyatsuka, T.; Sakamoto, K.; Matsuoka, T.A.; Matsuhisa, M.; Yamasaki, Y. Involvement of oxidative stress in the pathogenesis of diabetes. Antioxid. Redox Signal 2007, 9, 355–366. [Google Scholar] [CrossRef]
- Maechler, P.; Jornot, L.; Wollheim, C.B. Hydrogen peroxide alters mitochondrial activation and insulin secretion in pancreatic beta cells. J. Biol. Chem. 1999, 274, 27905–27913. [Google Scholar] [CrossRef] [PubMed]

| Genes | Amplicon from TSS | IP-PCR Primers | Product (pb) | Concentration Used (nM) |
|---|---|---|---|---|
| Nrf2 | +417 to +637 | 5’-CGGACCACACTGAGGACTTG-3’ | 221 | 500 |
| 5’-CGCAACAGATCAACAGCTCC-3’ | ||||
| Keap1 | +1228 to +1478 | 5’-CTACAACCCCATGACCAACCAG-3’ | 250 | 400 |
| 5’-TGTCTCAAAACACCAAACTCAGC-3’ | ||||
| SOD2 | −158 to −5 | 5’-CAGTGGGATAAAGTGAGCCTGG-3’ | 153 | 450 |
| Amplicon 1 | 5’-AGCGTGTTAGTGGAGGGTTTC-3’ | |||
| SOD2 | −29 to +203 | 5’-CCCGAAACCCTCCACTAACAC-3’ | 233 | 700 |
| Amplicon 2 | 5’-CAGTTGGTATGGTCCGCAGC-3’ | |||
| GCLC | −366 to −212 | 5’-CCTCCGCTCCTTGGACCGTC-3’ | 154 | 700 |
| Amplicon 1 | 5’-CTACTTTGTGACGAGAAGGCTGC-3’ | |||
| GCLC | +25 to +139 | 5’-CGCTGAACTGGGAGGAGACC-3’ | 114 | 500 |
| Amplicon 2 | 5’-CACTTGAGCACGTCCTTCTGC-3’ | |||
| Gase | +307 to +508 | 5’-GCCCTACTTCTTAAACCCGCT-3’ | 201 | 500 |
| 5’-AGACCCCTCCCTCACATCTT-3’ | ||||
| GPx1 | +74 to +236 | 5’-GCTTTCGTCATGTGTGCTGC-3’ | 163 | 600 |
| 5’-GGACCGTGGTGCCTCAAAG-3’ |
| Genes | Primers Sequences | |
|---|---|---|
| Forward | Reverse | |
| Nrf2 | GCTAGATGAAGAGACAGGGGA | ACAAATGGGAATGTTTCTGCCA |
| Keap1 | TGCTACAACCCCATGACCAA | ACCAAGTGCCACTCGTCC |
| SOD2 | CTACGACTATGGGGCCCTAC | CACCGTTGAACTTCAGTGCA |
| GCLC | TGGGGAGAAGTACAACGACA | GGCATCATCCAGGTCGATCT |
| Gase | ACTGTGTTCCTGGGCTTGAA | CTTGGCAGCTTCTTCAGTCC |
| GPx1 | TTGAGAATGTGGCCTCCCTT | CGGACGTACTTGAGCGAATG |
| GAPDH | GATCCCGCCAACATCAAGTG | CACGCCCATCACGAACATAG |
Disclaimer/Publisher’s Note: The statements, opinions and data contained in all publications are solely those of the individual author(s) and contributor(s) and not of MDPI and/or the editor(s). MDPI and/or the editor(s) disclaim responsibility for any injury to people or property resulting from any ideas, methods, instructions or products referred to in the content. |
© 2024 by the authors. Licensee MDPI, Basel, Switzerland. This article is an open access article distributed under the terms and conditions of the Creative Commons Attribution (CC BY) license (https://creativecommons.org/licenses/by/4.0/).
Share and Cite
Mungala Lengo, A.; Mohamed, I.; Lavoie, J.-C. Glutathione Supplementation Prevents Neonatal Parenteral Nutrition-Induced Short- and Long-Term Epigenetic and Transcriptional Disruptions of Hepatic H2O2 Metabolism in Guinea Pigs. Nutrients 2024, 16, 849. https://doi.org/10.3390/nu16060849
Mungala Lengo A, Mohamed I, Lavoie J-C. Glutathione Supplementation Prevents Neonatal Parenteral Nutrition-Induced Short- and Long-Term Epigenetic and Transcriptional Disruptions of Hepatic H2O2 Metabolism in Guinea Pigs. Nutrients. 2024; 16(6):849. https://doi.org/10.3390/nu16060849
Chicago/Turabian StyleMungala Lengo, Angela, Ibrahim Mohamed, and Jean-Claude Lavoie. 2024. "Glutathione Supplementation Prevents Neonatal Parenteral Nutrition-Induced Short- and Long-Term Epigenetic and Transcriptional Disruptions of Hepatic H2O2 Metabolism in Guinea Pigs" Nutrients 16, no. 6: 849. https://doi.org/10.3390/nu16060849
APA StyleMungala Lengo, A., Mohamed, I., & Lavoie, J.-C. (2024). Glutathione Supplementation Prevents Neonatal Parenteral Nutrition-Induced Short- and Long-Term Epigenetic and Transcriptional Disruptions of Hepatic H2O2 Metabolism in Guinea Pigs. Nutrients, 16(6), 849. https://doi.org/10.3390/nu16060849