

Combined Influence of Eight Lifestyle Factors on Metabolic Syndrome Incidence: A Prospective Cohort Study from the MECH-HK Study


 ,
,  ,
,  and
and 
Abstract
1. Introduction
2. Materials and Methods
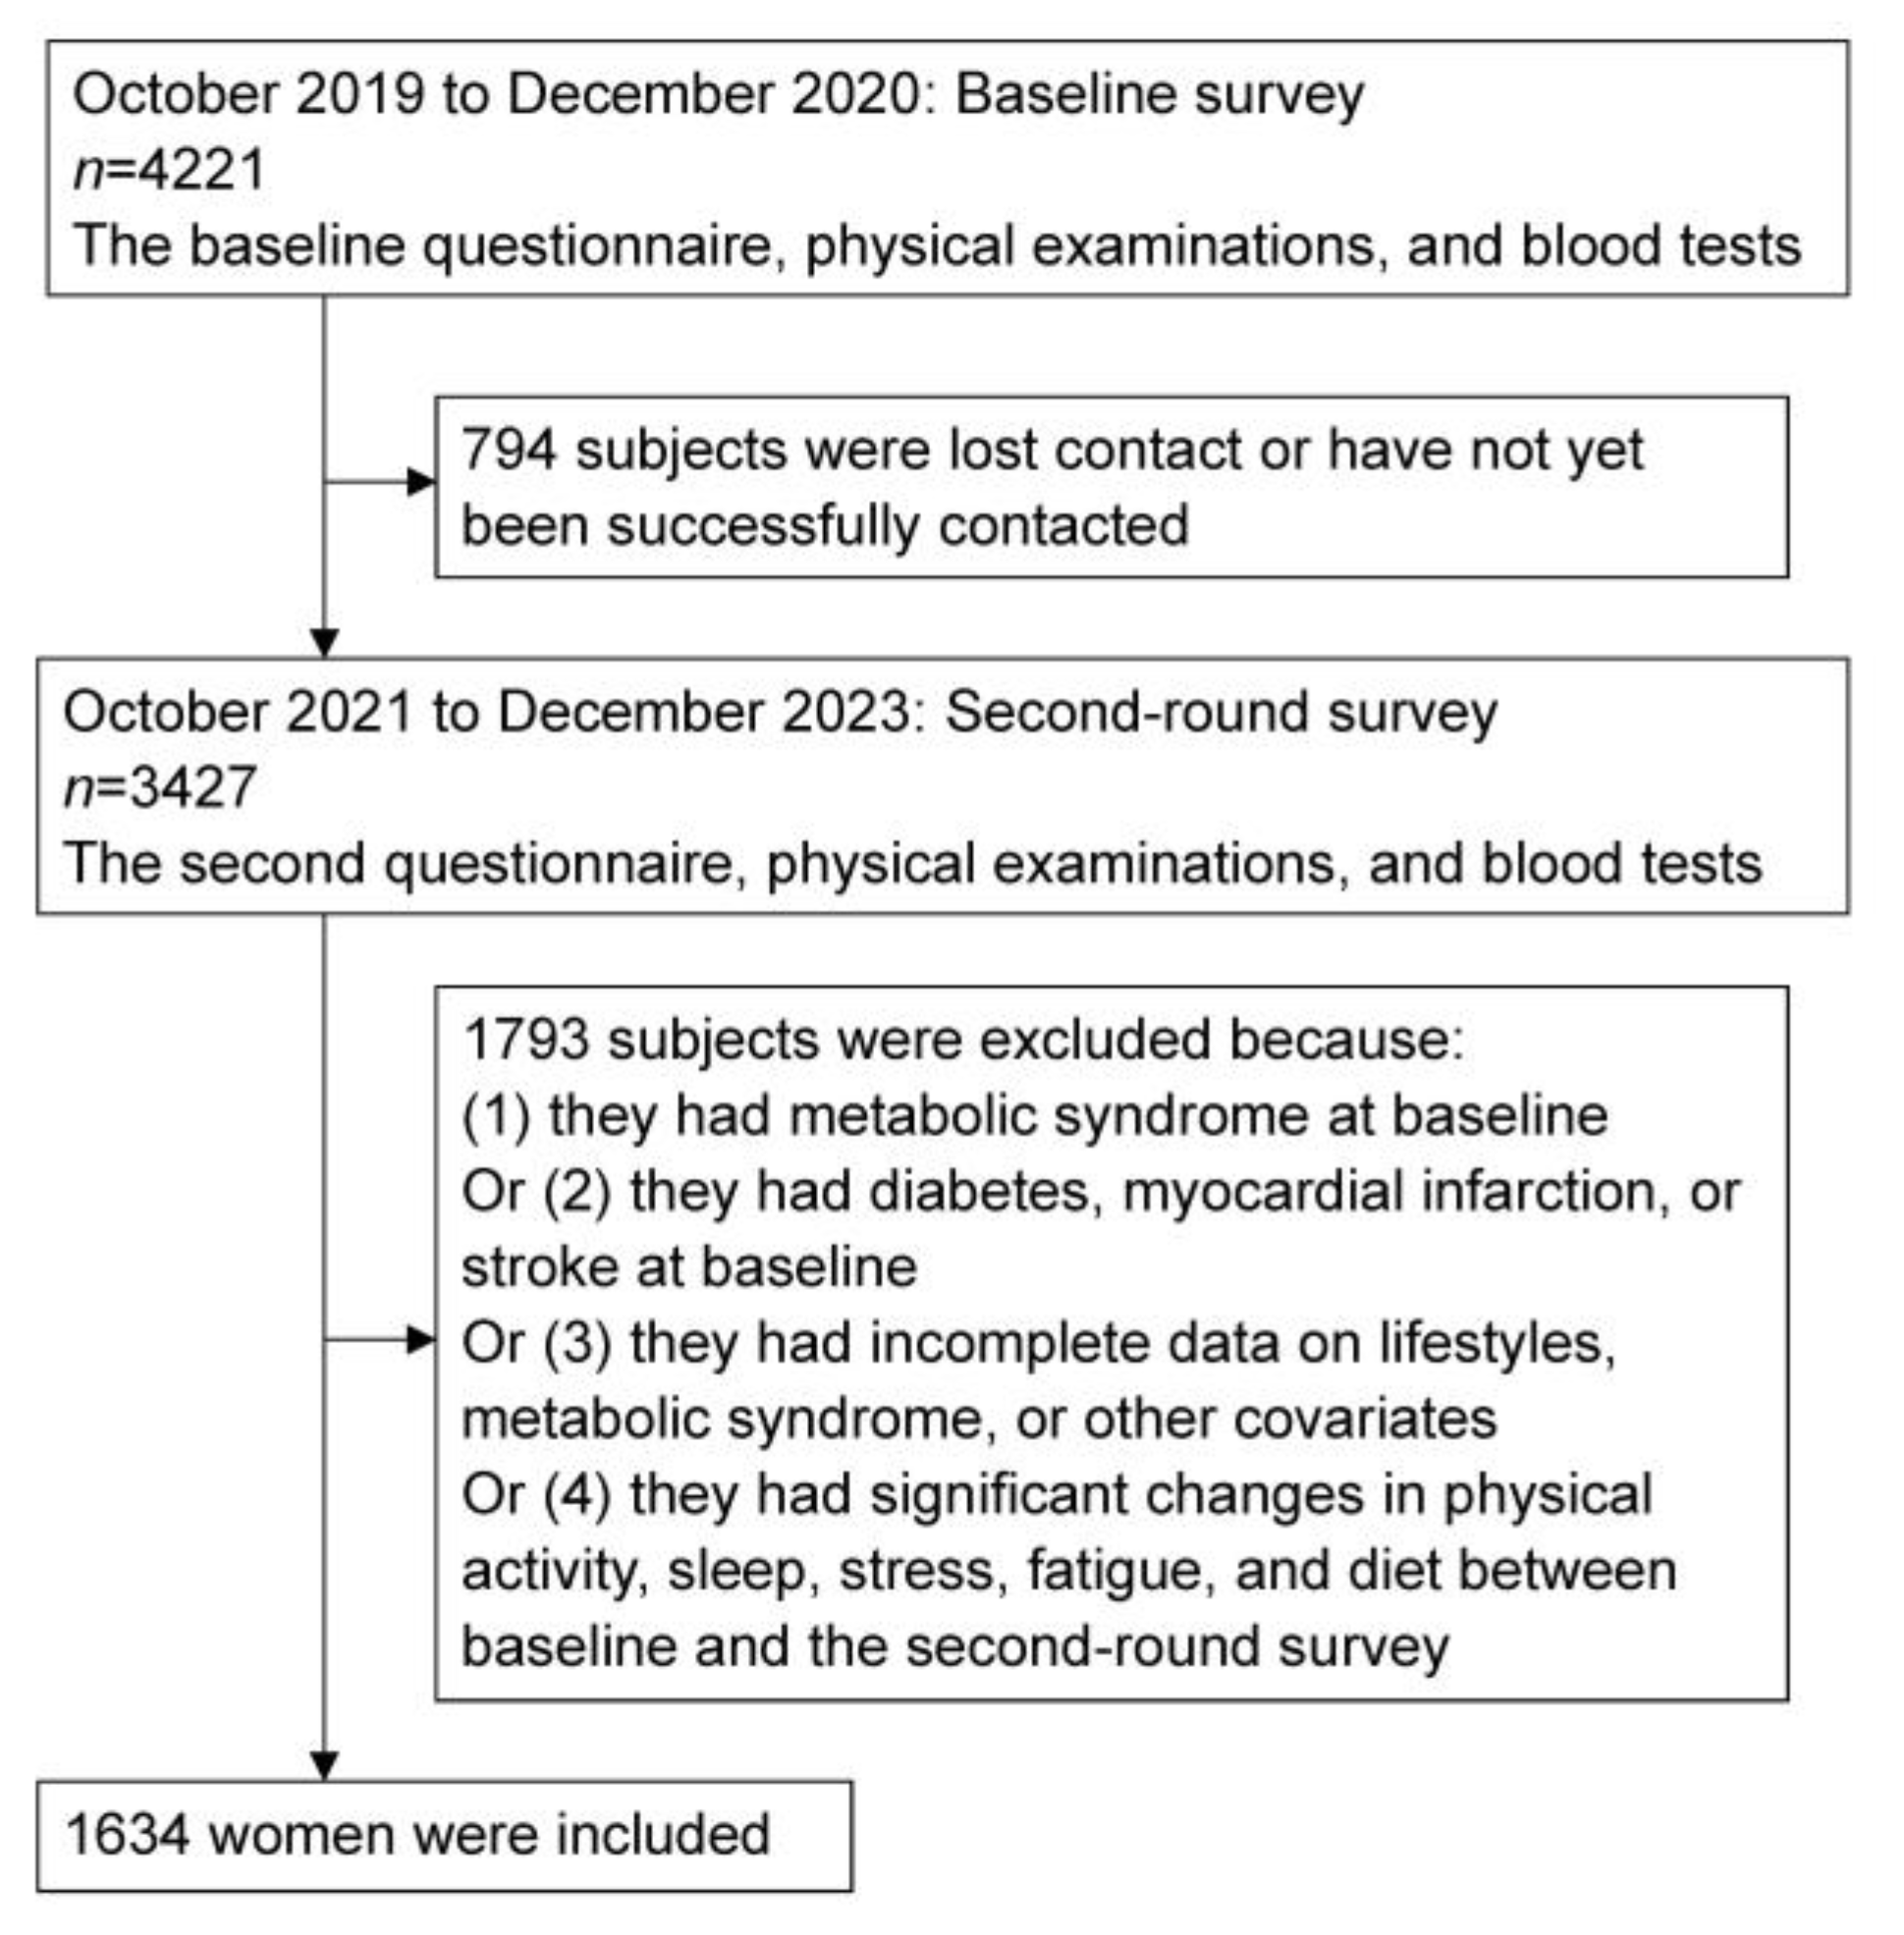
2.1. Study Population
2.2. Definition and Assessment of the Combined Lifestyle Score
2.3. Diagnosis of Metabolic Syndrome
2.4. Assessment of Covariates
2.5. Statistical Analysis
3. Results
3.1. Baseline Characteristics
3.2. Associations of Combined Lifestyle Score and Its Components with Metabolic Syndrome Incidence
3.3. Sensitivity Analysis
4. Discussion
4.1. Summary of Findings
4.2. Comparisons with Previous Studies and Explanations
4.3. Mechanism
4.4. Strengths and Limitations
5. Conclusions
Supplementary Materials
Author Contributions
Funding
Institutional Review Board Statement
Informed Consent Statement
Data Availability Statement
Acknowledgments
Conflicts of Interest
References
- Saklayen, M.G. The Global Epidemic of the Metabolic Syndrome. Curr. Hypertens. Rep. 2018, 20, 12. [Google Scholar] [CrossRef]
- Huang, P.L. A comprehensive definition for metabolic syndrome. Dis. Model. Mech. 2009, 2, 231–237. [Google Scholar] [CrossRef] [PubMed]
- Hirode, G.; Wong, R.J. Trends in the Prevalence of Metabolic Syndrome in the United States, 2011–2016. JAMA 2020, 323, 2526–2528. [Google Scholar] [CrossRef]
- Yao, F.; Bo, Y.; Zhao, L.; Li, Y.; Ju, L.; Fang, H.; Piao, W.; Yu, D.; Lao, X. Prevalence and Influencing Factors of Metabolic Syndrome among Adults in China from 2015 to 2017. Nutrients 2021, 13, 4475. [Google Scholar] [CrossRef] [PubMed]
- Sun, K.; Liu, J.; Ning, G. Active smoking and risk of metabolic syndrome: A meta-analysis of prospective studies. PLoS ONE 2012, 7, e47791. [Google Scholar] [CrossRef]
- Kim, J.H.; Kim, B.J.; Hyun, Y.Y.; Kang, J.H. Association between Secondhand Smoke Exposure and Metabolic Syndrome in 118,609 Korean Never Smokers Verified by Self-Reported Questionnaire and Urine Cotinine. Endocrinol. Metab. 2020, 35, 892–900. [Google Scholar] [CrossRef] [PubMed]
- Zhang, D.; Liu, X.; Liu, Y.; Sun, X.; Wang, B.; Ren, Y.; Zhao, Y.; Zhou, J.; Han, C.; Yin, L.; et al. Leisure-time physical activity and incident metabolic syndrome: A systematic review and dose-response meta-analysis of cohort studies. Metabolism 2017, 75, 36–44. [Google Scholar] [CrossRef]
- Xie, J.; Li, Y.; Zhang, Y.; Vgontzas, A.N.; Basta, M.; Chen, B.; Xu, C.; Tang, X. Sleep duration and metabolic syndrome: An updated systematic review and meta-analysis. Sleep Med. Rev. 2021, 59, 101451. [Google Scholar] [CrossRef]
- Zhang, Y.; Zhang, D.Z. Associations of vegetable and fruit consumption with metabolic syndrome. A meta-analysis of observational studies. Public Health Nutr. 2018, 21, 1693–1703. [Google Scholar] [CrossRef]
- Woo, H.W.; Kim, M.K.; Lee, Y.H.; Shin, D.H.; Shin, M.H.; Choi, B.Y. Habitual consumption of soy protein and isoflavones and risk of metabolic syndrome in adults ≥ 40 years old: A prospective analysis of the Korean Multi-Rural Communities Cohort Study (MRCohort). Eur. J. Nutr. 2019, 58, 2835–2850. [Google Scholar] [CrossRef]
- Jin, S.; Je, Y. Dairy Consumption and Risk of Metabolic Syndrome: Results from Korean Population and Meta-Analysis. Nutrients 2021, 13, 1574. [Google Scholar] [CrossRef] [PubMed]
- Hidayat, K.; Zhu, W.Z.; Peng, S.M.; Ren, J.J.; Lu, M.L.; Wang, H.P.; Xu, J.Y.; Zhou, H.; Yu, L.G.; Qin, L.Q. The association between meat consumption and the metabolic syndrome: A cross-sectional study and meta-analysis. Br. J. Nutr. 2022, 127, 1467–1481. [Google Scholar] [CrossRef] [PubMed]
- Ding, J.; Zhang, Y. Relationship between Egg Consumption and Metabolic Syndrome. A Meta-Analysis of Observational Studies. J. Nutr. Health Aging 2022, 26, 373–382. [Google Scholar] [CrossRef]
- Cai, Y.; Yang, X.; Chen, S.; Tian, K.; Xu, S.; Deng, R.; Chen, M.; Yang, Y.; Liu, T. Regular consumption of pickled vegetables and fermented bean curd reduces the risk of diabetes: A prospective cohort study. Front. Public Health 2023, 11, 1155989. [Google Scholar] [CrossRef] [PubMed]
- Kim, Y.; Je, Y. Meat Consumption and Risk of Metabolic Syndrome: Results from the Korean Population and a Meta-Analysis of Observational Studies. Nutrients 2018, 10, 390. [Google Scholar] [CrossRef]
- Wirfält, E.; Hedblad, B.; Gullberg, B.; Mattisson, I.; Andrén, C.; Rosander, U.; Janzon, L.; Berglund, G. Food patterns and components of the metabolic syndrome in men and women: A cross-sectional study within the Malmö Diet and Cancer cohort. Am. J. Epidemiol. 2001, 154, 1150–1159. [Google Scholar] [CrossRef]
- DiBello, J.R.; McGarvey, S.T.; Kraft, P.; Goldberg, R.; Campos, H.; Quested, C.; Laumoli, T.S.; Baylin, A. Dietary patterns are associated with metabolic syndrome in adult Samoans. J. Nutr. 2009, 139, 1933–1943. [Google Scholar] [CrossRef]
- Alkerwi, A.; Boutsen, M.; Vaillant, M.; Barre, J.; Lair, M.L.; Albert, A.; Guillaume, M.; Dramaix, M. Alcohol consumption and the prevalence of metabolic syndrome: A meta-analysis of observational studies. Atherosclerosis 2009, 204, 624–635. [Google Scholar] [CrossRef]
- Kuo, W.C.; Bratzke, L.C.; Oakley, L.D.; Kuo, F.; Wang, H.; Brown, R.L. The association between psychological stress and metabolic syndrome: A systematic review and meta-analysis. Obes. Rev. 2019, 20, 1651–1664. [Google Scholar] [CrossRef]
- Maloney, E.M.; Boneva, R.S.; Lin, J.M.; Reeves, W.C. Chronic fatigue syndrome is associated with metabolic syndrome: Results from a case-control study in Georgia. Metabolism 2010, 59, 1351–1357. [Google Scholar] [CrossRef] [PubMed]
- Barbaresko, J.; Rienks, J.; Nothlings, U. Lifestyle Indices and Cardiovascular Disease Risk: A Meta-analysis. Am. J. Prev. Med. 2018, 55, 555–564. [Google Scholar] [CrossRef]
- Zhang, Y.; Pan, X.F.; Chen, J.; Xia, L.; Cao, A.; Zhang, Y.; Wang, J.; Li, H.; Yang, K.; Guo, K.; et al. Combined lifestyle factors and risk of incident type 2 diabetes and prognosis among individuals with type 2 diabetes: A systematic review and meta-analysis of prospective cohort studies. Diabetologia 2020, 63, 21–33. [Google Scholar] [CrossRef]
- Zhang, Y.B.; Pan, X.F.; Chen, J.; Cao, A.; Zhang, Y.G.; Xia, L.; Wang, J.; Li, H.; Liu, G.; Pan, A. Combined lifestyle factors, incident cancer, and cancer mortality: A systematic review and meta-analysis of prospective cohort studies. Br. J. Cancer 2020, 122, 1085–1093. [Google Scholar] [CrossRef]
- Deng, Y.Y.; Liu, Y.P.; Ling, C.W.; Li, Y.H.; Wu, Y.Y.; Ke, Y.B.; Chen, Y.M. Higher healthy lifestyle scores are associated with greater bone mineral density in middle-aged and elderly Chinese adults. Arch. Osteoporos. 2020, 15, 129. [Google Scholar] [CrossRef]
- Deng, Y.Y.; Zhong, Q.W.; Zhong, H.L.; Xiong, F.; Ke, Y.B.; Chen, Y.M. Higher Healthy Lifestyle Score is associated with lower presence of non-alcoholic fatty liver disease in middle-aged and older Chinese adults: A community-based cross-sectional study. Public Health Nutr. 2021, 24, 5081–5089. [Google Scholar] [CrossRef] [PubMed]
- Yang, Q.; Zhang, Q.; Ngai, F.W.; Wang, S.; Zhang, D.; Gao, Y.; Hao, C.; Wang, H.H.; Nogueira, O.C.B.L.; Liu, M.; et al. The Multimorbidity and Lifestyle Correlates in Chinese Population Residing in Macau: Findings from a Community-Based Needs Assessment Study. Healthcare 2023, 11, 1906. [Google Scholar] [CrossRef] [PubMed]
- Yang, H.L.; Mo, B.R.; Molassiotis, A.; Wang, M.; He, G.L.; Xie, Y.J. Relationship between multimorbidity and composite lifestyle status in Shenzhen, China. J. Multimorb. Comorb. 2022, 12, 26335565221123990. [Google Scholar] [CrossRef] [PubMed]
- Garralda-Del-Villar, M.; Carlos-Chilleron, S.; Diaz-Gutierrez, J.; Ruiz-Canela, M.; Gea, A.; Martinez-Gonzalez, M.A.; Bes-Rastrollo, M.; Ruiz-Estigarribia, L.; Kales, S.N.; Fernández-Montero, A. Healthy lifestyle and incidence of metabolic syndrome in the SUN cohort. Nutrients 2019, 11, 65. [Google Scholar] [CrossRef] [PubMed]
- Mirmiran, P.; Farhadnejad, H.; Teymoori, F.; Parastouei, K.; Azizi, F. The higher adherence to healthy lifestyle factors is associated with a decreased risk of metabolic syndrome in Iranian adults. Nutr. Bull. 2022, 47, 57–67. [Google Scholar] [CrossRef] [PubMed]
- Craig, C.L.; Marshall, A.L.; Sjöström, M.; Bauman, A.E.; Booth, M.L.; Ainsworth, B.E.; Pratt, M.; Ekelund, U.; Yngve, A.; Sallis, J.F.; et al. International physical activity questionnaire: 12-country reliability and validity. Med. Sci. Sports Exerc. 2003, 35, 1381–1395. [Google Scholar] [CrossRef] [PubMed]
- Lee, P.H.; Yu, Y.Y.; McDowell, I.; Leung, G.M.; Lam, T.H.; Stewart, S.M. Performance of the international physical activity questionnaire (short form) in subgroups of the Hong Kong chinese population. Int. J. Behav. Nutr. Phys. Act. 2011, 8, 81. [Google Scholar] [CrossRef]
- Deng, H.B.; Macfarlane, D.J.; Thomas, G.N.; Lao, X.Q.; Jiang, C.Q.; Cheng, K.K.; Lam, T.H. Reliability and validity of the IPAQ-Chinese: The Guangzhou Biobank Cohort study. Med. Sci. Sports Exerc. 2008, 40, 303–307. [Google Scholar] [CrossRef]
- Ra, J.S.; Kim, H. Combined Effects of Unhealthy Lifestyle Behaviors on Metabolic Syndrome among Postmenopausal Women. Healthcare 2021, 9, 848. [Google Scholar] [CrossRef]
- Piercy, K.L.; Troiano, R.P.; Ballard, R.M.; Carlson, S.A.; Fulton, J.E.; Galuska, D.A.; George, S.M.; Olson, R.D. The Physical Activity Guidelines for Americans. JAMA 2018, 320, 2020–2028. [Google Scholar] [CrossRef] [PubMed]
- Wu, J.; Zhang, H.; Yang, L.; Shao, J.; Chen, D.; Cui, N.; Tang, L.; Fu, Y.; Xue, E.; Lai, C.; et al. Sedentary time and the risk of metabolic syndrome: A systematic review and dose-response meta-analysis. Obes. Rev. 2022, 23, e13510. [Google Scholar] [CrossRef] [PubMed]
- Buysse, D.J.; Reynolds, C.F.; Monk, T.H., 3rd; Berman, S.R.; Kupfer, D.J. The Pittsburgh Sleep Quality Index: A new instrument for psychiatric practice and research. Psychiatry Res. 1989, 28, 193–213. [Google Scholar] [CrossRef] [PubMed]
- Cohen, S.; Kamarck, T.; Mermelstein, R. A global measure of perceived stress. J. Health Soc. Behav. 1983, 24, 385–396. [Google Scholar] [CrossRef]
- Leng, M.; Wei, L.; Shi, X.; Cao, G.; Wei, Y.; Xu, H.; Zhang, X.; Zhang, W.; Xing, S.; Wei, H. Mental distress and influencing factors in nurses caring for patients with COVID-19. Nurs. Crit. Care 2021, 26, 94–101. [Google Scholar] [CrossRef]
- Centre for Health Protection of the Department of Health. Guideline on Meal Arrangement and Meal Provision. Available online: https://www.chp.gov.hk/files/pdf/gls_for_sectors_on_meal_provision_e.pdf. (accessed on 1 February 2024).
- Tsang, S.; Royse, C.F.; Terkawi, A.S. Guidelines for developing, translating, and validating a questionnaire in perioperative and pain medicine. Saudi J. Anaesth. 2017, 11 (Suppl. 1), S80–S89. [Google Scholar] [CrossRef]
- Tørris, C.; Molin, M.; Cvancarova Småstuen, M. Fish consumption and its possible preventive role on the development and prevalence of metabolic syndrome—A systematic review. Diabetol. Metab. Syndr. 2014, 6, 112. [Google Scholar] [CrossRef]
- Namazi, N.; Brett, N.R.; Bellissimo, N.; Larijani, B.; Heshmati, J.; Azadbakht, L. The association between types of seafood intake and the risk of type 2 diabetes: A systematic review and meta-analysis of prospective cohort studies. Health Promot. Perspect. 2019, 9, 164–173. [Google Scholar] [CrossRef]
- Ye, Y.; Zhou, Q.; Dai, W.; Peng, H.; Zhou, S.; Tian, H.; Shen, L.; Han, H. Gender differences in metabolic syndrome and its components in southern china using a healthy lifestyle index: A cross-sectional study. BMC Public Health 2023, 23, 686. [Google Scholar] [CrossRef] [PubMed]
- Alberti, K.G.; Eckel, R.H.; Grundy, S.M.; Zimmet, P.Z.; Cleeman, J.I.; Donato, K.A.; Fruchart, J.C.; James, W.P.; Loria, C.M.; Smith, S.C., Jr.; et al. Harmonizing the metabolic syndrome: A joint interim statement of the International Diabetes Federation Task Force on Epidemiology and Prevention; National Heart, Lung, and Blood Institute; American Heart Association; World Heart Federation; International Atherosclerosis Society; and International Association for the Study of Obesity. Circulation 2009, 120, 1640–1645. [Google Scholar] [PubMed]
- WHO/IASO/IOTF. The Asia-Pacific Perspective: Redefining Obesity and Its Treatment. Health Communications Australia Pty Limited. Available online: https://iris.who.int/bitstream/handle/10665/206936/0957708211_eng.pdf (accessed on 1 February 2024).
- Allison, P.D. Logistic Regression Using SAS: Theory and Application; SAS Institute: Carry, NC, USA, 2012. [Google Scholar]
- Romero-Cabrera, J.L.; Garcia-Rios, A.; Sotos-Prieto, M.; Quintana-Navarro, G.; Alcala-Diaz, J.F.; Martin-Piedra, L.; Torres-Peña, J.D.; Luque, R.M.; Yubero-Serrano, E.M.; Delgado-Lista, J.; et al. Adherence to a Mediterranean lifestyle improves metabolic status in coronary heart disease patients: A prospective analysis from the CORDIOPREV study. J. Intern. Med. 2023, 293, 574–588. [Google Scholar] [CrossRef] [PubMed]
- Census and Statistics Department Hong Kong Special Administrative Region. Thematic Household Survey Report No. 56. Available online: https://www.statistics.gov.hk/pub/B11302562015XXXXB0100.pdf (accessed on 1 February 2024).
- Tsitsimpikou, C.; Tsarouhas, K.; Vasilaki, F.; Papalexis, P.; Dryllis, G.; Choursalas, A.; Spandidos, D.A.; Tsatsakis, A.; Charvalos, E.; Bacopoulou, F. Health risk behaviors among high school and university adolescent students. Exp. Ther. Med. 2018, 16, 3433–3438. [Google Scholar] [CrossRef] [PubMed]
- Krishnamoorthy, Y.; Rajaa, S.; Murali, S.; Sahoo, J.; Kar, S.S. Association between behavioural risk factors and metabolic syndrome among adult population in India: A systematic review and meta-analysis of observational studies. Nutr. Metab. Cardiovasc. Dis. 2022, 32, 40–52. [Google Scholar] [CrossRef] [PubMed]
- Diaz, K.M.; Shimbo, D. Physical activity and the prevention of hypertension. Curr. Hypertens. Rep. 2013, 15, 659–668. [Google Scholar] [CrossRef] [PubMed]
- Hegde, S.M.; Solomon, S.D. Influence of Physical Activity on Hypertension and Cardiac Structure and Function. Curr. Hypertens. Rep. 2015, 17, 77. [Google Scholar] [CrossRef] [PubMed]
- Liang, Z.D.; Zhang, M.; Wang, C.Z.; Yuan, Y.; Liang, J.H. Association between sedentary behavior, physical activity, and cardiovascular disease-related outcomes in adults—A meta-analysis and systematic review. Front. Public Health 2022, 10, 1018460. [Google Scholar] [CrossRef]
- Wang, Y.; Mei, H.; Jiang, Y.R.; Sun, W.Q.; Song, Y.J.; Liu, S.J.; Jiang, F. Relationship between Duration of Sleep and Hypertension in Adults: A Meta-Analysis. J. Clin. Sleep. Med. 2015, 11, 1047–1056. [Google Scholar] [CrossRef]
- van den Berg, J.F.; Miedema, H.M.; Tulen, J.H.; Neven, A.K.; Hofman, A.; Witteman, J.C.; Tiemeier, H. Long sleep duration is associated with serum cholesterol in the elderly: The Rotterdam Study. Psychosom. Med. 2008, 70, 1005–1011. [Google Scholar] [CrossRef]
- Hu, J.; Zhu, X.; Yuan, D.; Ji, D.; Guo, H.; Li, Y.; He, Z.; Bai, H.; Zhu, Q.; Shen, C.; et al. Association of sleep duration and sleep quality with the risk of metabolic syndrome in adults: A systematic review and meta-analysis. Endokrynol. Pol. 2022, 73, 968–987. [Google Scholar] [CrossRef] [PubMed]
- Tenk, J.; Matrai, P.; Hegyi, P.; Rostas, I.; Garami, A.; Szabo, I.; Hartmann, P.; Pétervári, E.; Czopf, L.; Hussain, A.; et al. Perceived stress correlates with visceral obesity and lipid parameters of the metabolic syndrome: A systematic review and meta-analysis. Psychoneuroendocrinology 2018, 95, 63–73. [Google Scholar] [CrossRef] [PubMed]
- Godos, J.; Zappala, G.; Bernardini, S.; Giambini, I.; Bes-Rastrollo, M.; Martinez-Gonzalez, M. Adherence to the Mediterranean diet is inversely associated with metabolic syndrome occurrence: A meta-analysis of observational studies. Int. J. Food Sci. Nutr. 2017, 68, 138–148. [Google Scholar] [CrossRef]
- Tsitsimpikou, C.; Tsarouhas, K.; Kioukia-Fougia, N.; Skondra, C.; Fragkiadaki, P.; Papalexis, P.; Stamatopoulos, P.; Kaplanis, I.; Hayes, A.W.; Tsatsakis, A.; et al. Dietary supplementation with tomato-juice in patients with metabolic syndrome: A suggestion to alleviate detrimental clinical factors. Food Chem. Toxicol. 2014, 74, 9–13. [Google Scholar] [CrossRef] [PubMed]
- Bacopoulou, F.; Landis, G.N.; Pałasz, A.; Tsitsika, A.; Vlachakis, D.; Tsarouhas, K.; Tsitsimpikou, C.; Stefanaki, C.; Kouretas, D.; Efthymiou, V. Identifying early abdominal obesity risk in adolescents by telemedicine: A cross-sectional study in Greece. Food Chem. Toxicol. 2020, 144, 111532. [Google Scholar] [CrossRef]
- Rentoukas, E.; Tsarouhas, K.; Kaplanis, I.; Korou, E.; Nikolaou, M.; Marathonitis, G.; Kokkinou, S.; Haliassos, A.; Mamalaki, A.; Kouretas, D.; et al. Connection between telomerase activity in PBMC and markers of inflammation and endothelial dysfunction in patients with metabolic syndrome. PLoS ONE 2012, 7, e35739. [Google Scholar] [CrossRef]
- Kato, I.; Kiyohara, Y.; Kubo, M.; Tanizaki, Y.; Arima, H.; Iwamoto, H.; Shinohara, N.; Nakayama, K.; Fujishima, M. Insulin-mediated effects of alcohol intake on serum lipid levels in a general population: The Hisayama Study. J. Clin. Epidemiol. 2003, 56, 196–204. [Google Scholar] [CrossRef]
- Koppes, L.L.; Dekker, J.M.; Hendriks, H.F.; Bouter, L.M.; Heine, R.J. Moderate alcohol consumption lowers the risk of type 2 diabetes: A meta-analysis of prospective observational studies. Diabetes Care 2005, 28, 719–725. [Google Scholar] [CrossRef]
- Sun, K.; Ren, M.; Liu, D.; Wang, C.; Yang, C.; Yan, L. Alcohol consumption and risk of metabolic syndrome: A meta-analysis of prospective studies. Clin. Nutr. 2014, 33, 596–602. [Google Scholar] [CrossRef]

| Component | Score |
|---|---|
| Smoking | |
| Never smoked and individuals who were not exposed to secondhand smoke | 1 |
| Current or former smokers, or individuals who were exposed to secondhand smoke | 0 |
| Physical activity | |
| Moderate physical activity ≥ 150 min/week or vigorous physical activity ≥ 75 min/week | 1 |
| Moderate physical activity < 150 min/week and vigorous physical activity < 75 min/week | 0 |
| Sedentary time | |
| <4 h/day | 1 |
| ≥4 h/day | 0 |
| Sleep | |
| Pittsburgh Sleep Quality Index ≤ 5 | 1 |
| Pittsburgh Sleep Quality Index > 5 | 0 |
| Stress | |
| Perceived Stress Scale-14 < 25 | 1 |
| Perceived Stress Scale-14 ≥ 25 | 0 |
| Fatigue | |
| < the median of an 11-degree self-perceived fatigue scale | 1 |
| ≥ the median of an 11-degree self-perceived fatigue scale | 0 |
| Diet | |
| The top tertile of a healthy diet index | 1 |
| The first and second tertile of a healthy diet index | 0 |
| Alcohol | |
| >0 and <20 g/day | 1 |
| 0 or ≥20 g/day | 0 |
| Baseline Characteristics a | Total Subjects | Combined Lifestyle Score | p | |||
|---|---|---|---|---|---|---|
| 0–3 Points | 4 Points | 5 Points | 6–8 Points | |||
| N | 1634 | 618 | 366 | 309 | 341 | |
| Age, years | 55.9 ± 8.6 | 54.4 ± 9.0 | 55.4 ± 8.8 | 57.1 ± 8.0 * | 58.3 ± 7.5 * | <0.001 |
| Marital status | 0.087 | |||||
| Never married | 424 (25.9%) | 171 (27.7%) | 89 (24.3%) | 81 (26.2%) | 83 (24.3%) | |
| Divorce, separation, or widowhood | 193 (11.8%) | 61 (9.9%) | 47 (12.8%) | 50 (16.2%) | 35 (10.3%) | |
| Married or cohabiting | 1017 (62.2%) | 386 (62.5%) | 230 (62.8%) | 178 (57.6%) | 223 (65.4%) | |
| Living condition | 0.083 | |||||
| Living with spouse, parents, or children | 324 (19.8%) | 119 (19.3%) | 64 (17.5%) | 77 (24.9%) | 64 (18.8%) | |
| Others | 1310 (80.2%) | 499 (80.7%) | 302 (82.5%) | 232 (75.1%) | 277 (81.2%) | |
| Educational level | 0.152 | |||||
| Primary school or lower | 94 (5.8%) | 38 (6.1%) | 17 (4.6%) | 20 (6.5%) | 19 (5.6%) | |
| Secondary school or pre-college | 947 (58.0%) | 336 (54.4%) | 223 (60.9%) | 173 (56.0%) | 215 (63.0%) | |
| College or higher | 593 (36.3%) | 244 (39.5%) | 126 (34.4%) | 116 (37.5%) | 107 (31.4%) | |
| Family income, HKD/month | 0.001 | |||||
| ≤18,000 | 444 (27.2%) | 197 (31.9%) | 103 (28.1%) | 132 (42.7%) * | 114 (33.4%) * | |
| >18,000 and ≤40,000 | 608 (37.2%) | 272 (44.0%) | 155 (42.3%) | 97 (31.4%) * | 140 (41.1%) | |
| >40,000 | 582 (35.6%) | 149 (24.1%) | 108 (29.5%) | 80 (25.9%) | 87 (25.5%) | |
| Employed | 817 (50.0%) | 343 (55.5%) | 201 (54.9%) | 118 (38.2%) * | 155 (45.5%) * | <0.001 |
| Menstrual age, years | 12.9 ± 1.7 | 12.9 ± 1.7 | 12.7 ± 1.5 | 12.9 ± 1.8 | 12.9 ± 1.6 | 0.452 |
| Menolipsis | 1218 (74.5%) | 431 (69.7%) | 270 (73.8%) * | 250 (80.9%) * | 267 (78.3%) * | 0.001 |
| Hypertension | 117 (7.2%) | 49 (7.9%) | 26 (7.1%) | 20 (6.5%) | 22 (6.5%) | 0.641 |
| Hyperlipidemia | 302 (18.5%) | 118 (19.1%) | 59 (16.1%) | 57 (18.4%) | 68 (19.9%) | 0.574 |
| Cancer | 100 (6.1%) | 40 (6.5%) | 26 (7.1%) | 15 (4.9%) | 19 (5.6%) | 0.617 |
| Body mass index, kg/m2 | 22.2 ± 3.0 | 22.3 ± 3.1 | 22.2 ± 3.1 | 22.1 ± 2.8 | 21.9 ± 3.0 * | 0.035 |
| General obesity b | 243 (14.9%) | 108 (17.5%) | 57 (15.6%) | 44 (14.2%) * | 34 (10.0%) * | 0.031 |
| Combined lifestyle score component | ||||||
| Current or former smoker | 59 (3.6%) | 39 (6.3%) | 12 (3.3%) * | 5 (1.6%) * | 3 (0.9%) * | <0.001 |
| Secondhand smoker | 254 (15.5%) | 160 (25.9%) | 49 (13.4%) * | 31 (10.0%) * | 14 (4.1%) * | <0.001 |
| Moderate physical activity, min/week | 319.9 ± 315.3 | 254.2 ± 301.1 | 336.9 ± 317.2 * | 362.5 ± 326.0 * | 384.2 ± 306.1 * | <0.001 |
| Vigorous physical activity, min/week | 93.2 ± 156.5 | 56.3 ± 122.0 | 96.8 ± 153.9 * | 113.9 ± 172.1 * | 140.2 ± 184.0 * | <0.001 |
| Sedentary time, h/day | 8.0 ± 3.6 | 9.1 ± 3.4 | 8.2 ± 3.4 * | 7.4 ± 3.3 * | 6.3 ± 3.6 * | <0.001 |
| Pittsburgh Sleep Quality Index | 6.2 ± 3.4 | 8.0 ± 3.2 | 6.3 ± 3.3 * | 4.9 ± 2.9 * | 3.9 ± 2.6 * | <0.001 |
| Perceived Stress Scale-14 | 24.2 ± 5.8 | 27.4 ± 5.3 | 24.4 ± 4.9 * | 22.0 ± 5.2 * | 20.2 ± 4.9 * | <0.001 |
| No or low fatigue c | 809 (49.5%) | 100 (16.2%) | 174 (47.5%) * | 221 (71.5%) * | 314 (92.1%) * | <0.001 |
| Healthy diet index | 40.0 ± 3.7 | 37.3 ± 3.4 | 38.5 ± 3.3 * | 40.8 ± 3.5 * | 42.1 ± 3.6 * | <0.001 |
| Light alcohol intake d | 803 (49.1%) | 221 (35.8%) | 178 (48.6%) * | 161 (52.1%) * | 243 (71.3%) * | <0.001 |
| Metabolic syndrome criteria | ||||||
| Central obesity e | 643 (39.4%) | 272 (44.0%) | 137 (37.5%) | 113 (36.7%) * | 121 (35.5%) * | 0.025 |
| Waist circumference, cm | 78.3 ± 8.7 | 79.0 ± 8.5 | 78.5 ± 9.7 | 77.7 ± 7.9 * | 77.5 ± 8.3 * | 0.034 |
| Triglycerides, mg/dL | 136.0 ± 74.3 | 141.0 ± 81.6 | 134.6 ± 67.3 | 134.0 ± 68.7 | 129.8 ± 72.4 * | 0.045 |
| High-density lipoprotein cholesterol, mg/dL | 67.0 ± 15.2 | 65.9 ± 15.5 | 66.8 ± 14.8 | 67.0 ± 14.6 | 69.0 ± 15.3 * | 0.030 |
| Systolic blood pressure, mmHg | 118.2 ± 16.1 | 120.0 ± 15.9 | 119.0 ± 17.1 | 117.8 ± 16.1 | 117.2 ± 15.6 | 0.062 |
| Diastolic blood pressure, mmHg | 73.0 ± 9.8 | 73.4 ± 8.7 | 73.0 ± 10.1 | 72.9 ± 9.9 | 72.7 ± 10.0 | 0.806 |
| Fasting glucose, mg/dL | 5.50 ± 0.55 | 5.55 ± 0.56 | 5.49 ± 0.46 | 5.46 ± 0.63 | 5.43 ± 0.58 | 0.743 |
| Exposure | Ncase | Ntotal | Incidence | Model I a | Model II b | ||
|---|---|---|---|---|---|---|---|
| OR (95% CI) | p | OR (95% CI) | p | ||||
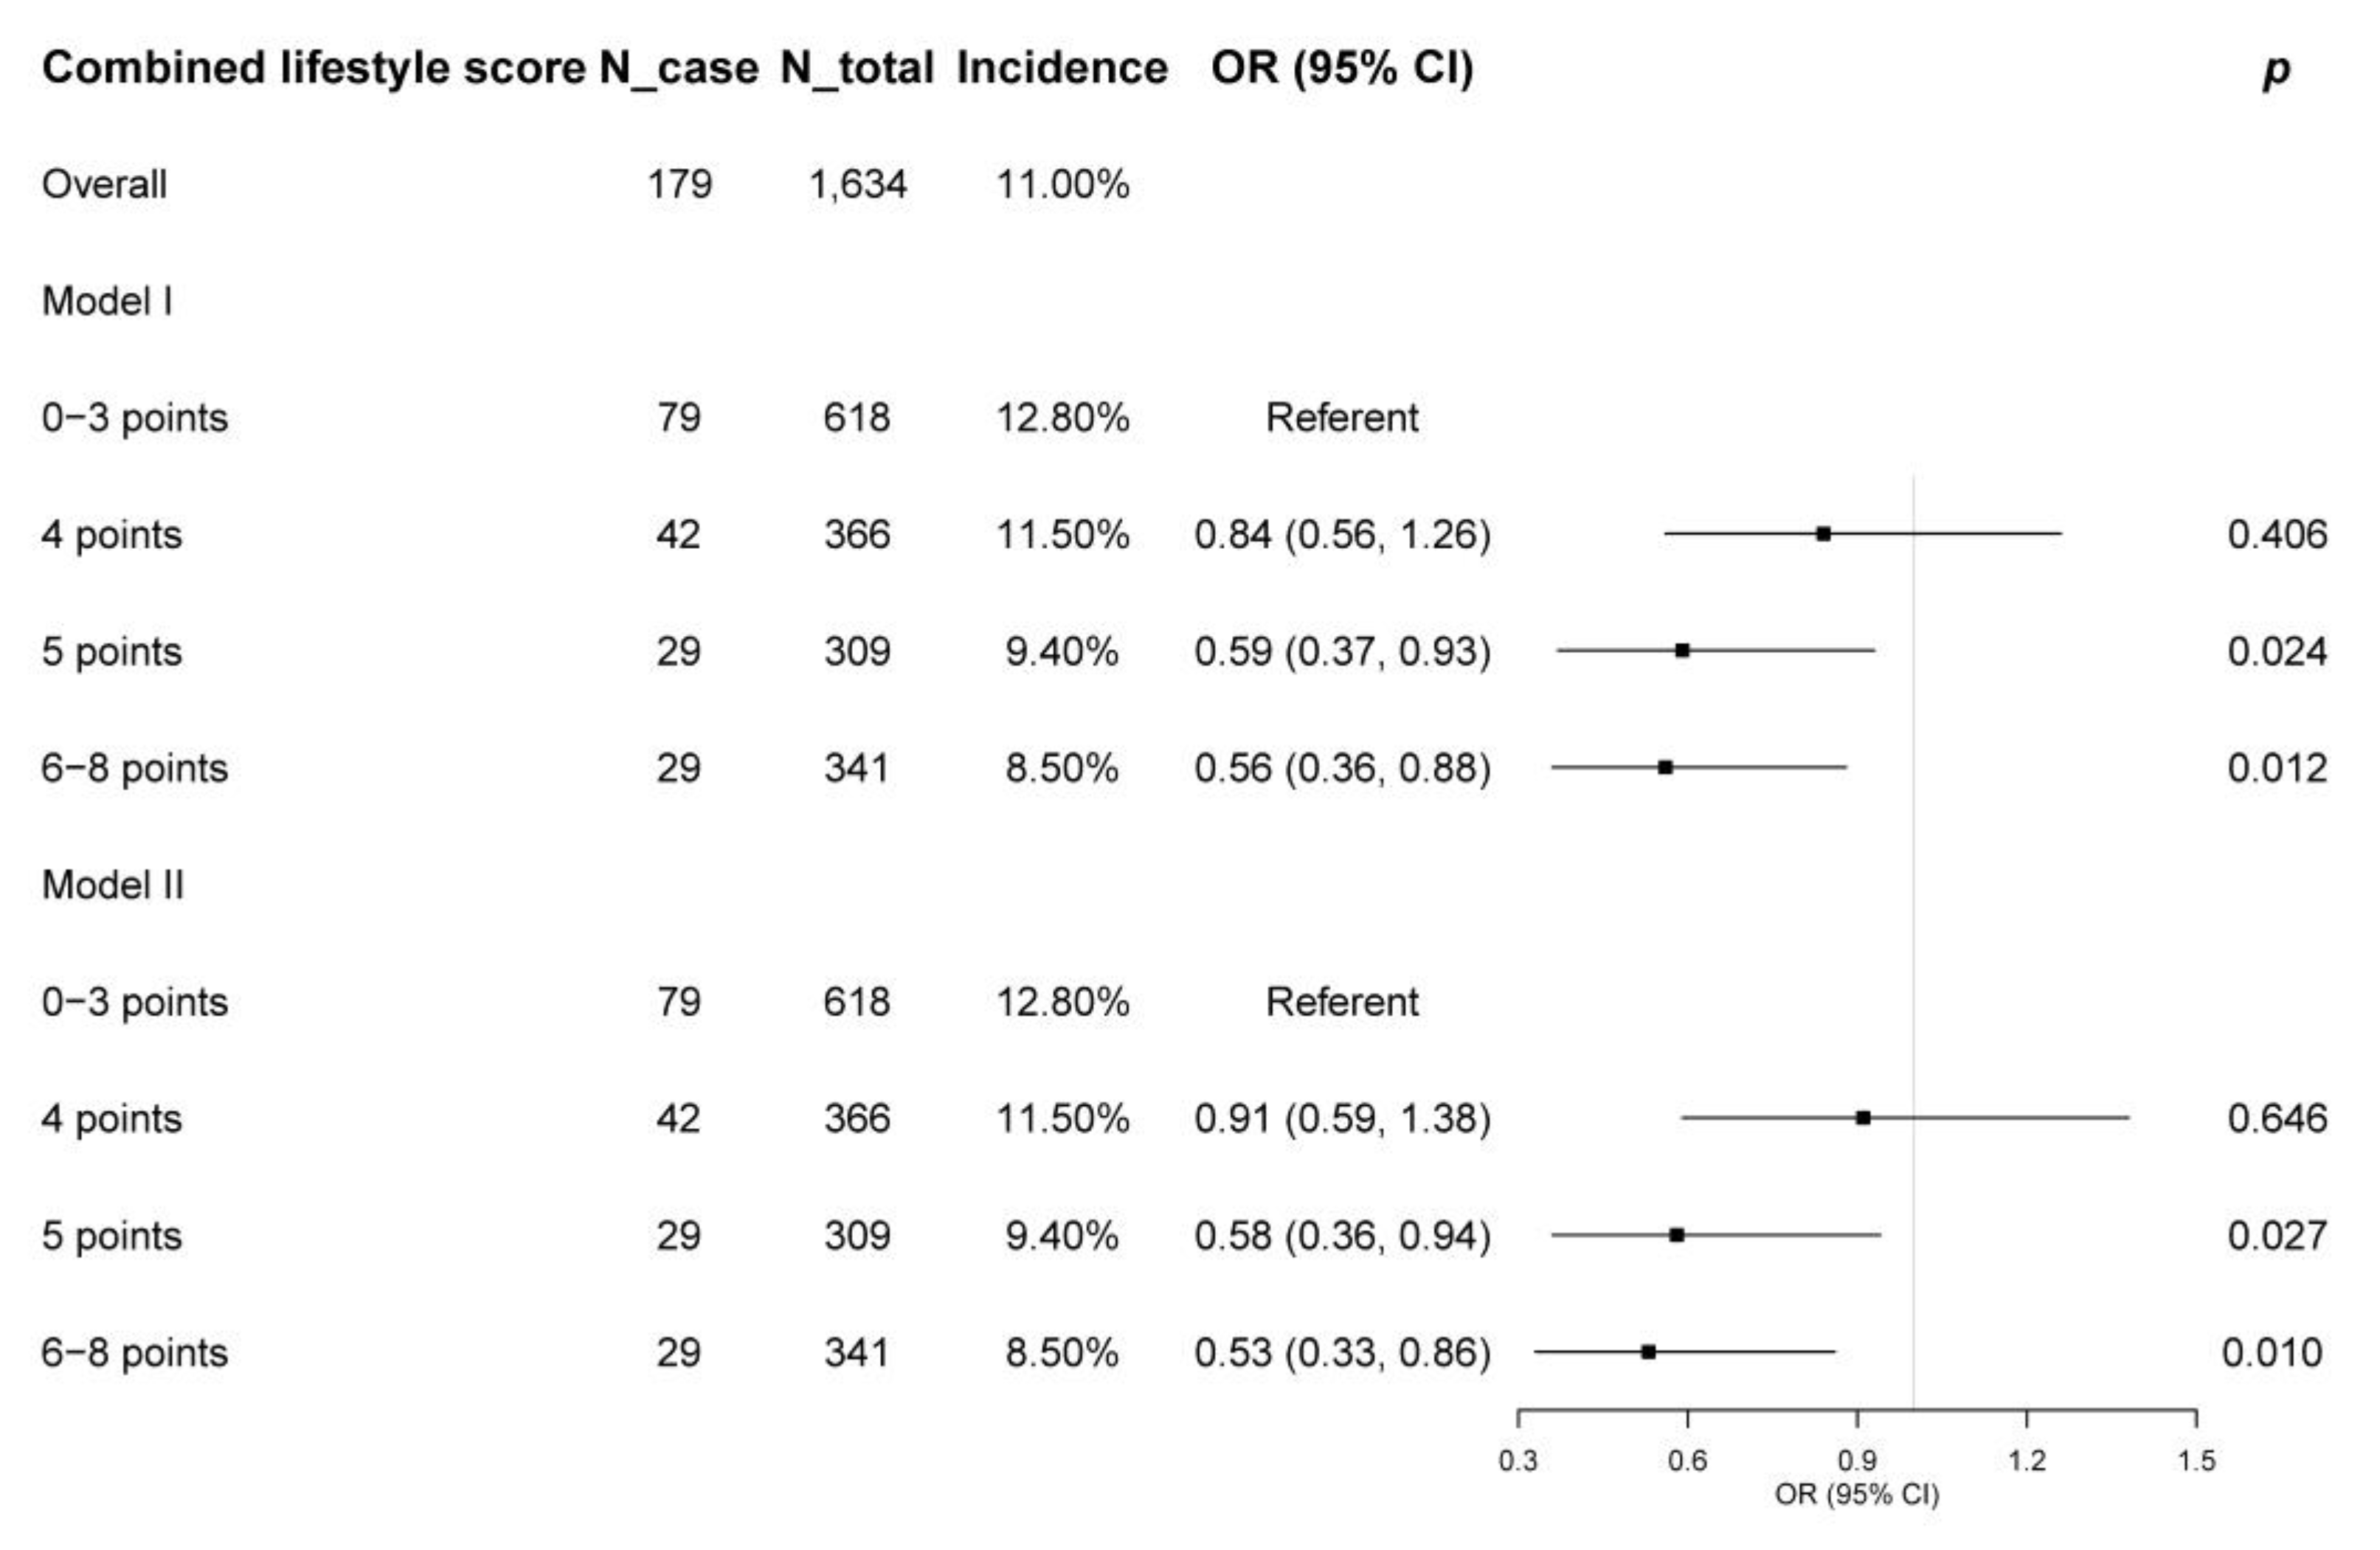
| Overall | 179 | 1634 | 11.0% | ||||
| Combined lifestyle score | |||||||
| 0–3 points | 79 | 618 | 12.8% | Referent | Referent | ||
| 4 points | 42 | 366 | 11.5% | 0.84 (0.56, 1.26) | 0.406 | 0.91 (0.59, 1.38) | 0.646 |
| 5 points | 29 | 309 | 9.4% | 0.59 (0.37, 0.93) | 0.024 | 0.58 (0.36, 0.94) | 0.027 |
| 6–8 points | 29 | 341 | 8.5% | 0.56 (0.36, 0.88) | 0.012 | 0.53 (0.33, 0.86) | 0.010 |
| Smoking | |||||||
| 0 point | 35 | 288 | 12.2% | Referent | Referent | ||
| 1 point | 144 | 1346 | 10.7% | 0.81 (0.54, 1.21) | 0.298 | 0.87 (0.57, 1.32) | 0.500 |
| Physical activity | |||||||
| 0 point | 40 | 399 | 10.0% | Referent | Referent | ||
| 1 point | 139 | 1235 | 11.3% | 0.94 (0.67, 1.31) | 0.713 | 0.92 (0.65, 1.32) | 0.659 |
| Sedentary time | |||||||
| 0 point | 147 | 1328 | 11.1% | Referent | Referent | ||
| 1 point | 32 | 306 | 10.5% | 0.83 (0.55, 1.25) | 0.364 | 0.79 (0.51, 1.24) | 0.307 |
| Sleep | |||||||
| 0 point | 100 | 879 | 11.4% | Referent | Referent | ||
| 1 point | 79 | 755 | 10.5% | 0.88 (0.63, 1.25) | 0.484 | 0.97 (0.67, 1.40) | 0.872 |
| Stress | |||||||
| 0 point | 86 | 742 | 11.6% | Referent | Referent | ||
| 1 point | 93 | 892 | 10.4% | 0.92 (0.66, 1.29) | 0.634 | 0.90 (0.63, 1.28) | 0.564 |
| Fatigue | |||||||
| 0 point | 102 | 825 | 12.4% | Referent | Referent | ||
| 1 point | 77 | 809 | 9.5% | 0.67 (0.47, 0.95) | 0.026 | 0.79 (0.55, 1.15) | 0.228 |
| Diet | |||||||
| 0 point | 122 | 1071 | 11.3% | Referent | Referent | ||
| 1 point | 57 | 563 | 10.1% | 0.99 (0.72, 1.37) | 0.959 | 0.99 (0.70, 1.39) | 0.950 |
| Alcohol | |||||||
| 0 point | 92 | 831 | 11.1% | Referent | Referent | ||
| 1 point | 87 | 803 | 10.8% | 0.99 (0.72, 1.35) | 0.935 | 0.99 (0.71, 1.38) | 0.950 |
Disclaimer/Publisher’s Note: The statements, opinions and data contained in all publications are solely those of the individual author(s) and contributor(s) and not of MDPI and/or the editor(s). MDPI and/or the editor(s) disclaim responsibility for any injury to people or property resulting from any ideas, methods, instructions or products referred to in the content. |
© 2024 by the authors. Licensee MDPI, Basel, Switzerland. This article is an open access article distributed under the terms and conditions of the Creative Commons Attribution (CC BY) license (https://creativecommons.org/licenses/by/4.0/).
Share and Cite
Deng, Y.-Y.; Ngai, F.-W.; Qin, J.; Yang, L.; Wong, K.-P.; Wang, H.-H.; Xie, Y.-J. Combined Influence of Eight Lifestyle Factors on Metabolic Syndrome Incidence: A Prospective Cohort Study from the MECH-HK Study. Nutrients 2024, 16, 547. https://doi.org/10.3390/nu16040547
Deng Y-Y, Ngai F-W, Qin J, Yang L, Wong K-P, Wang H-H, Xie Y-J. Combined Influence of Eight Lifestyle Factors on Metabolic Syndrome Incidence: A Prospective Cohort Study from the MECH-HK Study. Nutrients. 2024; 16(4):547. https://doi.org/10.3390/nu16040547
Chicago/Turabian StyleDeng, Yun-Yang, Fei-Wan Ngai, Jing Qin, Lin Yang, Ka-Po Wong, Harry-Haoxiang Wang, and Yao-Jie Xie. 2024. "Combined Influence of Eight Lifestyle Factors on Metabolic Syndrome Incidence: A Prospective Cohort Study from the MECH-HK Study" Nutrients 16, no. 4: 547. https://doi.org/10.3390/nu16040547
APA StyleDeng, Y.-Y., Ngai, F.-W., Qin, J., Yang, L., Wong, K.-P., Wang, H.-H., & Xie, Y.-J. (2024). Combined Influence of Eight Lifestyle Factors on Metabolic Syndrome Incidence: A Prospective Cohort Study from the MECH-HK Study. Nutrients, 16(4), 547. https://doi.org/10.3390/nu16040547