
Associations of Diet with Health Outcomes in the UK Biobank: A Systematic Review


Highlights
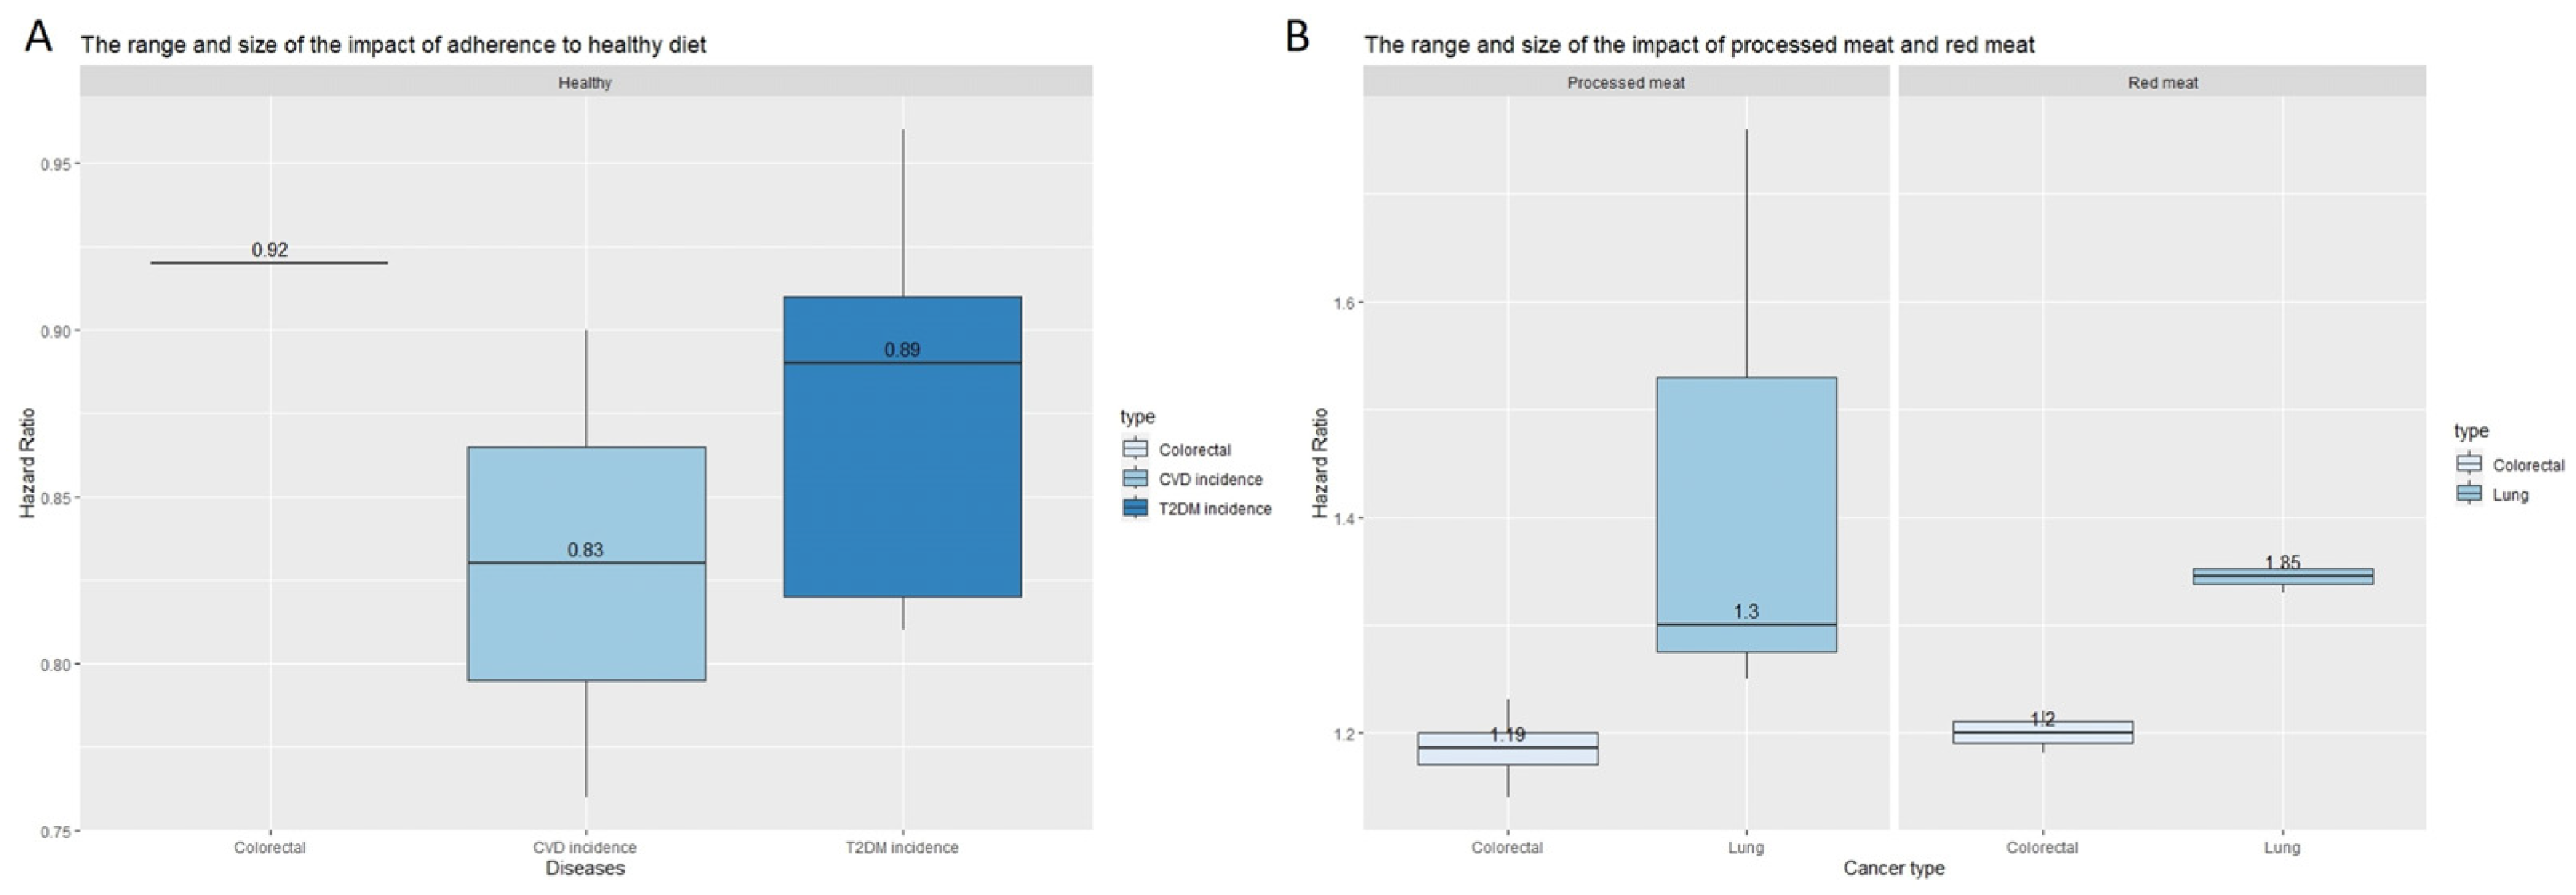
- Diet is a modifiable health risk factor; the UK Biobank, a huge epidemiological study, has enabled 36 studies on diet and health to be performed. Considering the findings of these studies, a conventionally “healthy” dietary pattern was found to have a considerable impact on the reduced risk of cardiovascular disease (CVD), colorectal cancer, and type 2 diabetes (T2DM).
- Considering all of the relevant studies in this meta-analysis, a cancer–diet association might only be present in certain cancer types.
- Focusing on dietary patterns that incorporate the analysis of various foods instead of a single food group/nutrient provides stronger data on so-called unhealthy diets and their correlation with CVD and T2DM.
- There is a clear message from the UK Biobank-based literature on T2DM and diet that agrees with the wider research findings that indicate that a healthy diet has the potential to reduce the risk of diabetes.
- More advanced analysis of the UK Biobank data (e.g., stratifying the population into groups based on food preferences or intake) will yield a richer analysis to inform future developments in health and diet management.
- Future research efforts could incorporate repeated dietary assessments to improve our understanding of diet–disease relationships by generating more consistent data.
- The UK Biobank study is an example of a major health-related prospective epidemiological study. Researchers have the opportunity to utilize the underused Food Preference Questionnaire to explore many unanswered diet/health-related questions.
- Emphasizing dietary patterns rather than individual food groups could offer better insights into how diet influences health outcomes.
Abstract
1. Introduction
2. Methods
2.1. Study Design and Setting
2.2. Search Strategy and Data Source
2.3. Data Extraction and Quality Assessment
2.4. Data Analysis and Presentation of Results
3. Results
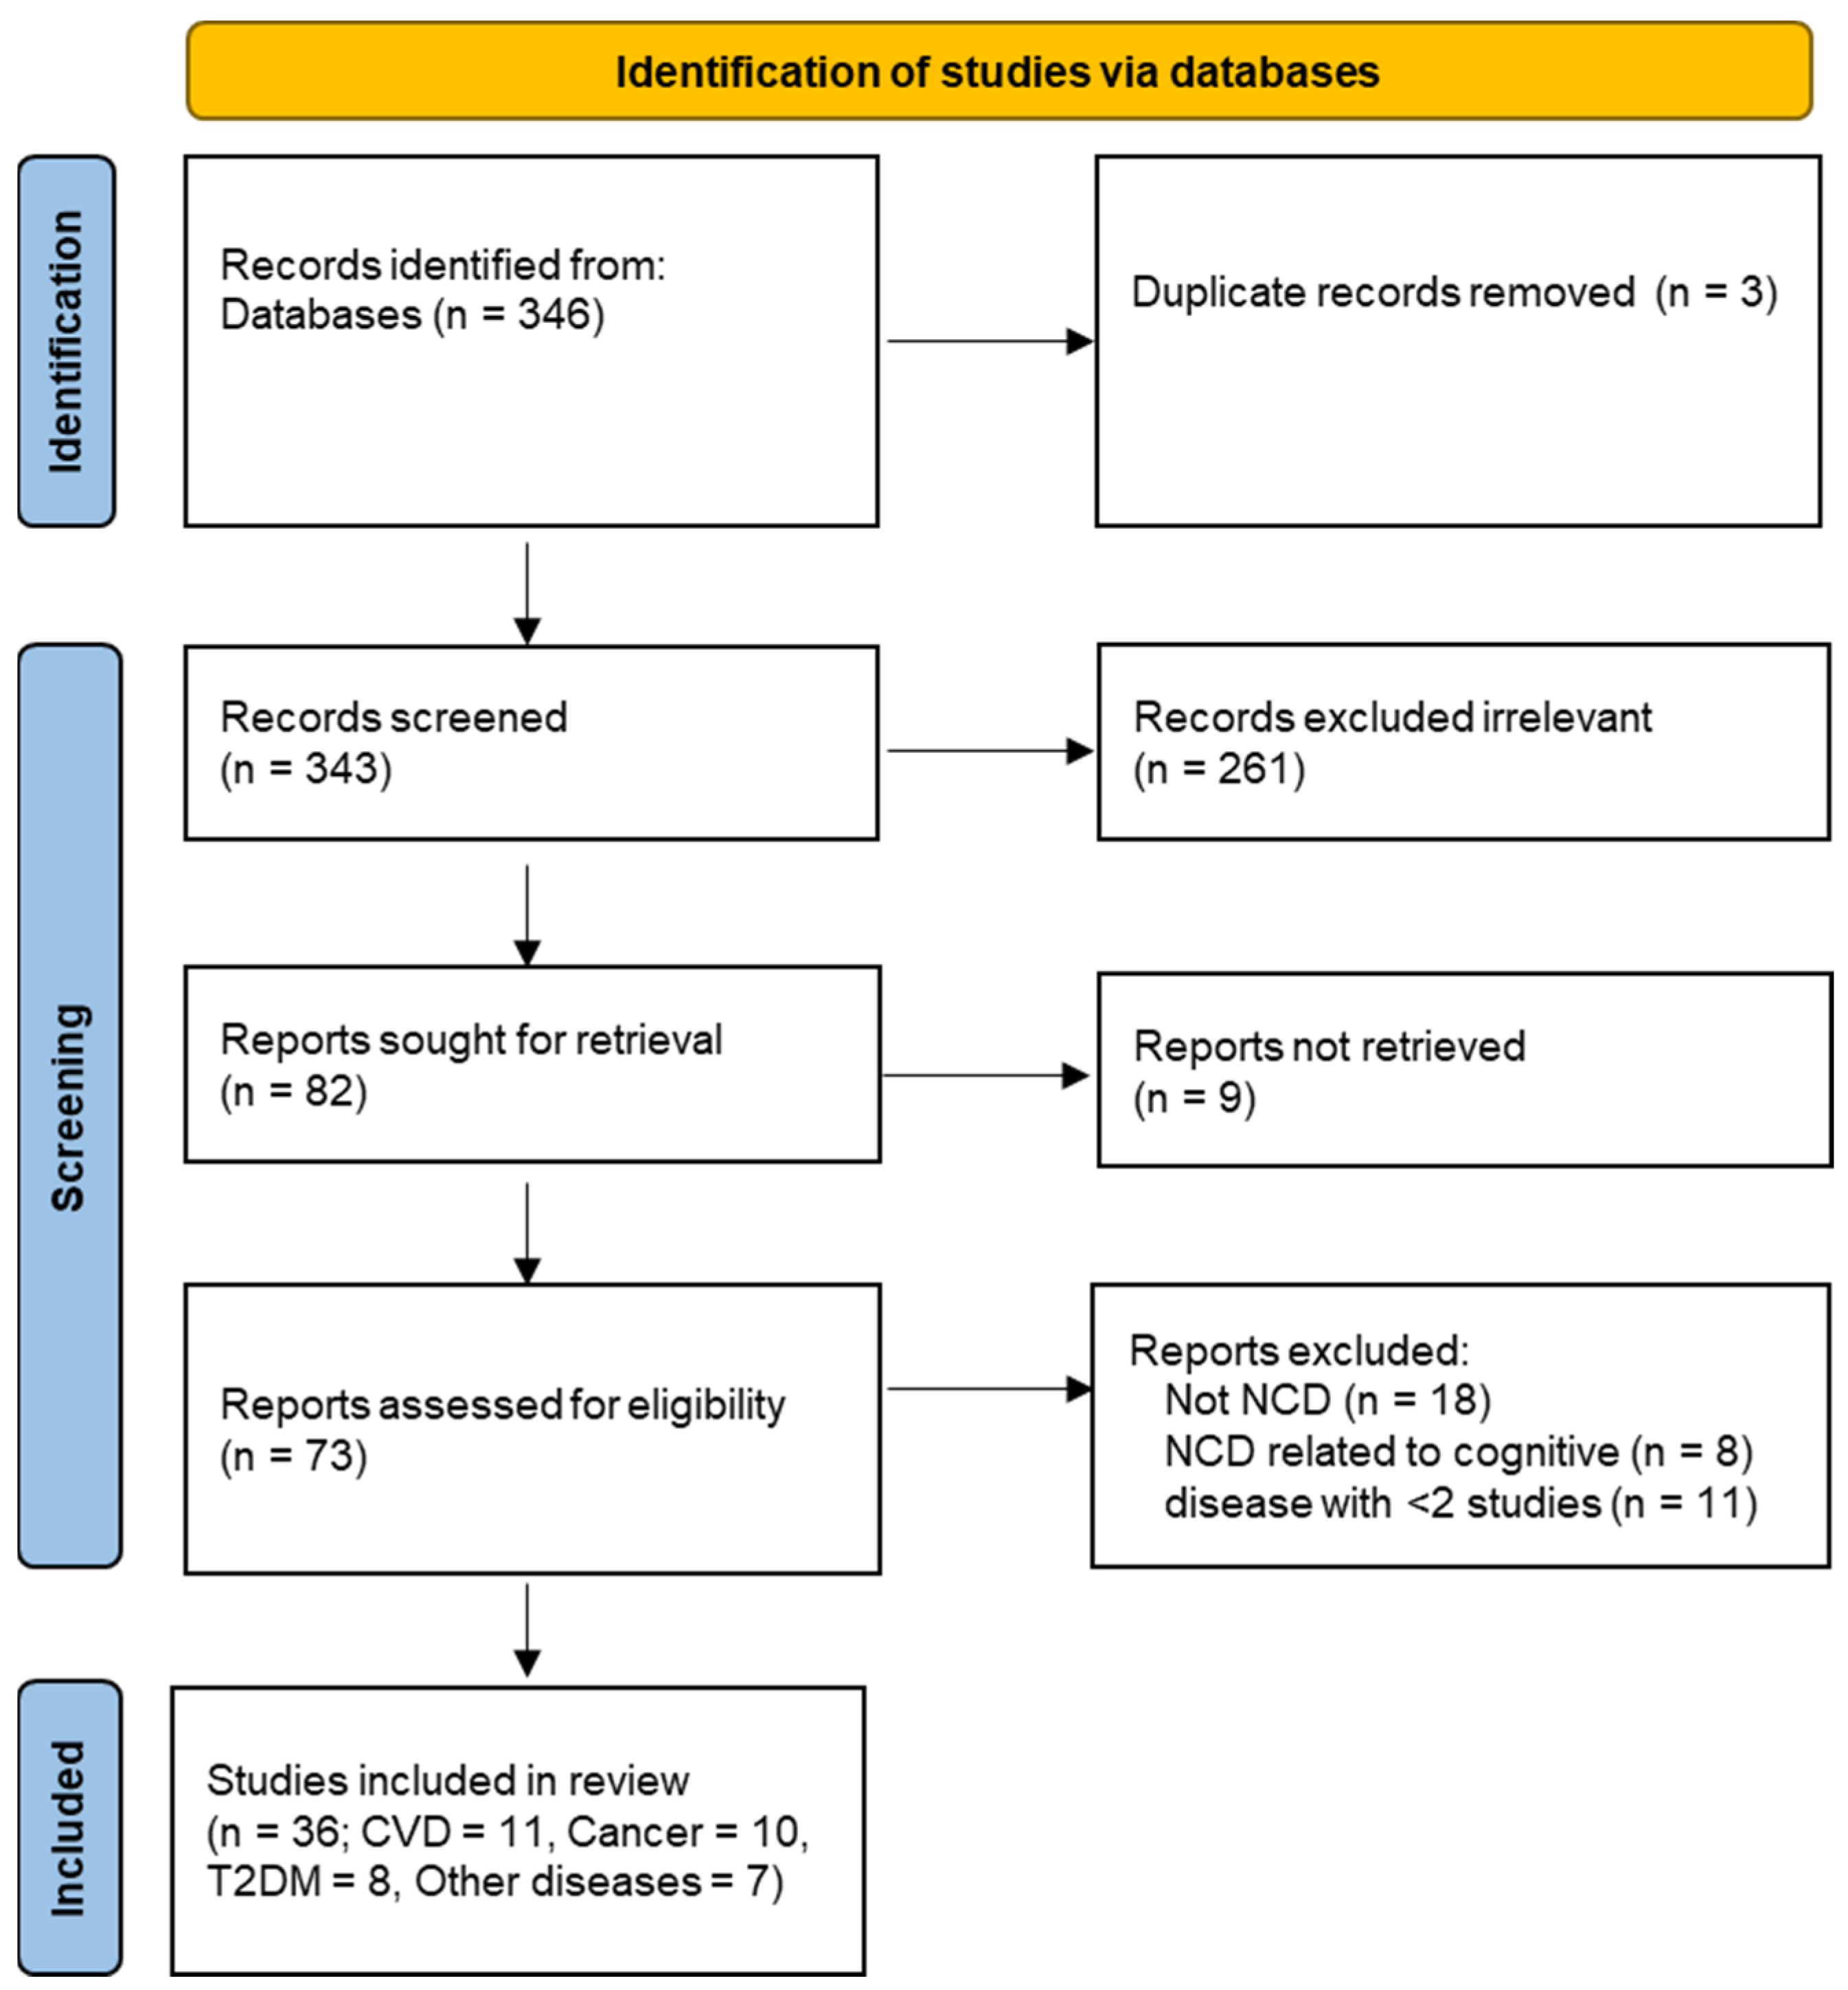
3.1. Dietary Studies Conducted on the UK Biobank
3.2. Dietary Assessments in the UK Biobank
3.3. Summary of the Effect Estimates of Diet on Health Outcomes in the UK Biobank
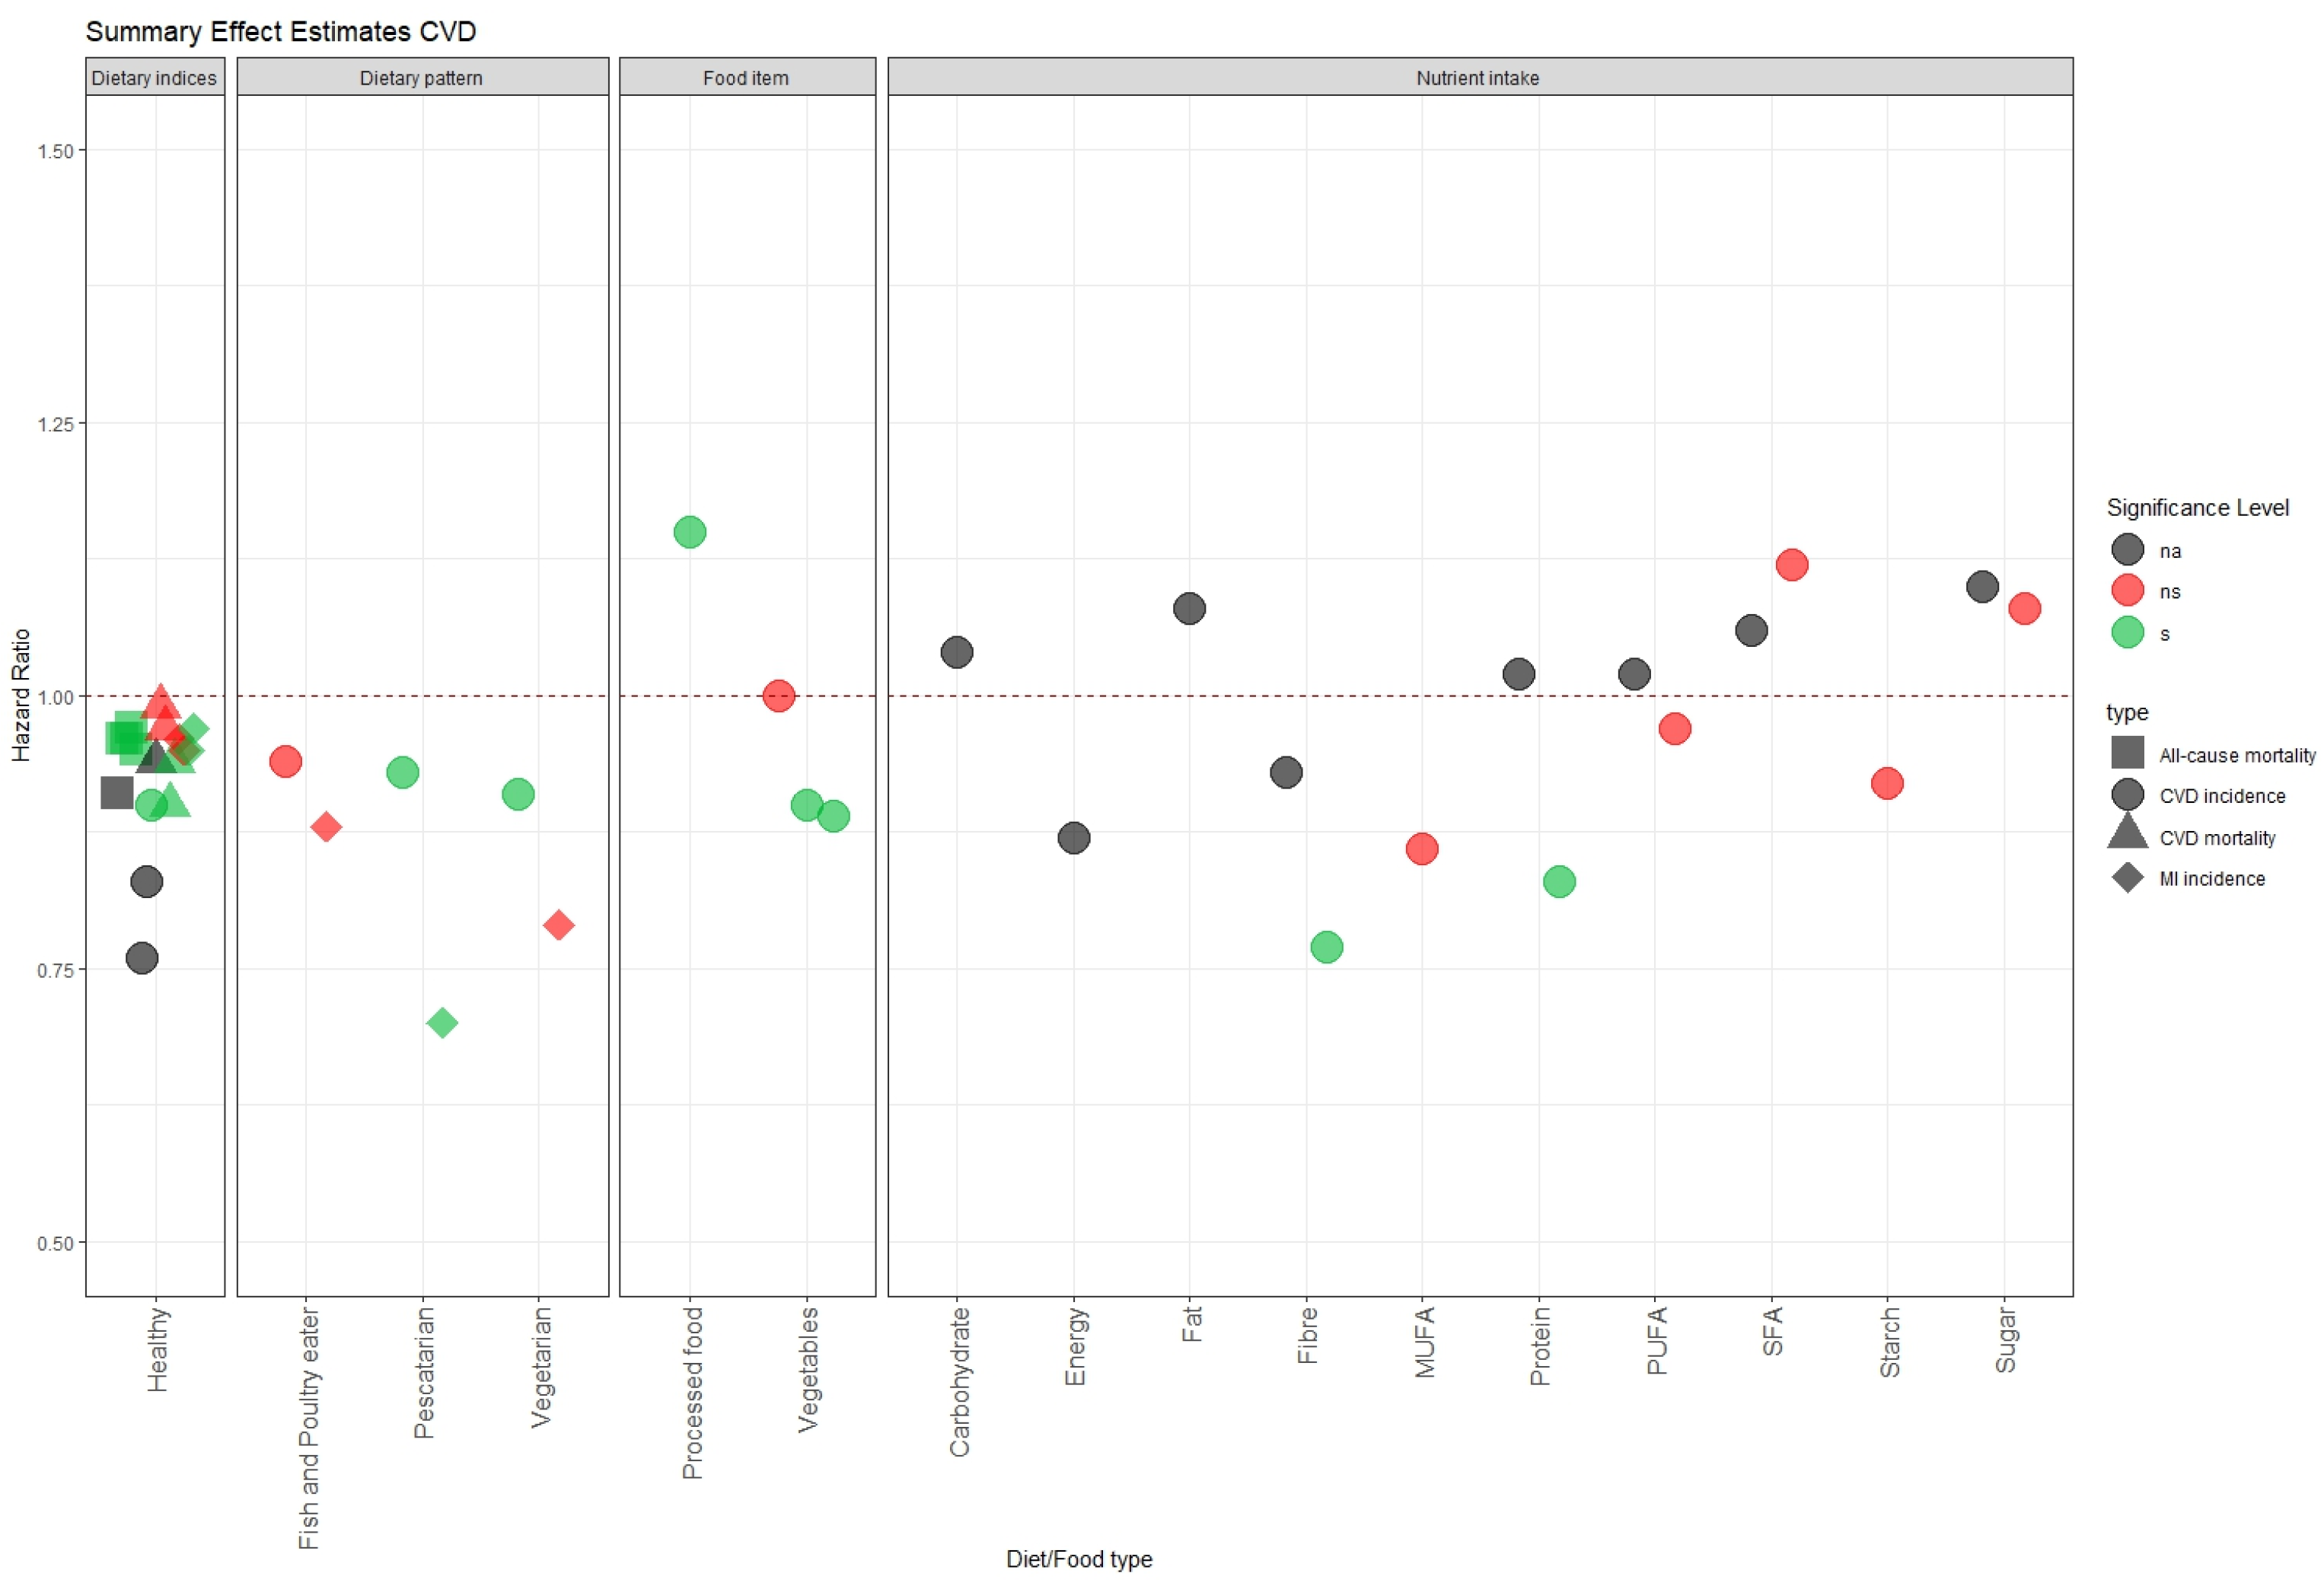
3.3.1. Cardiovascular Disease (CVD)
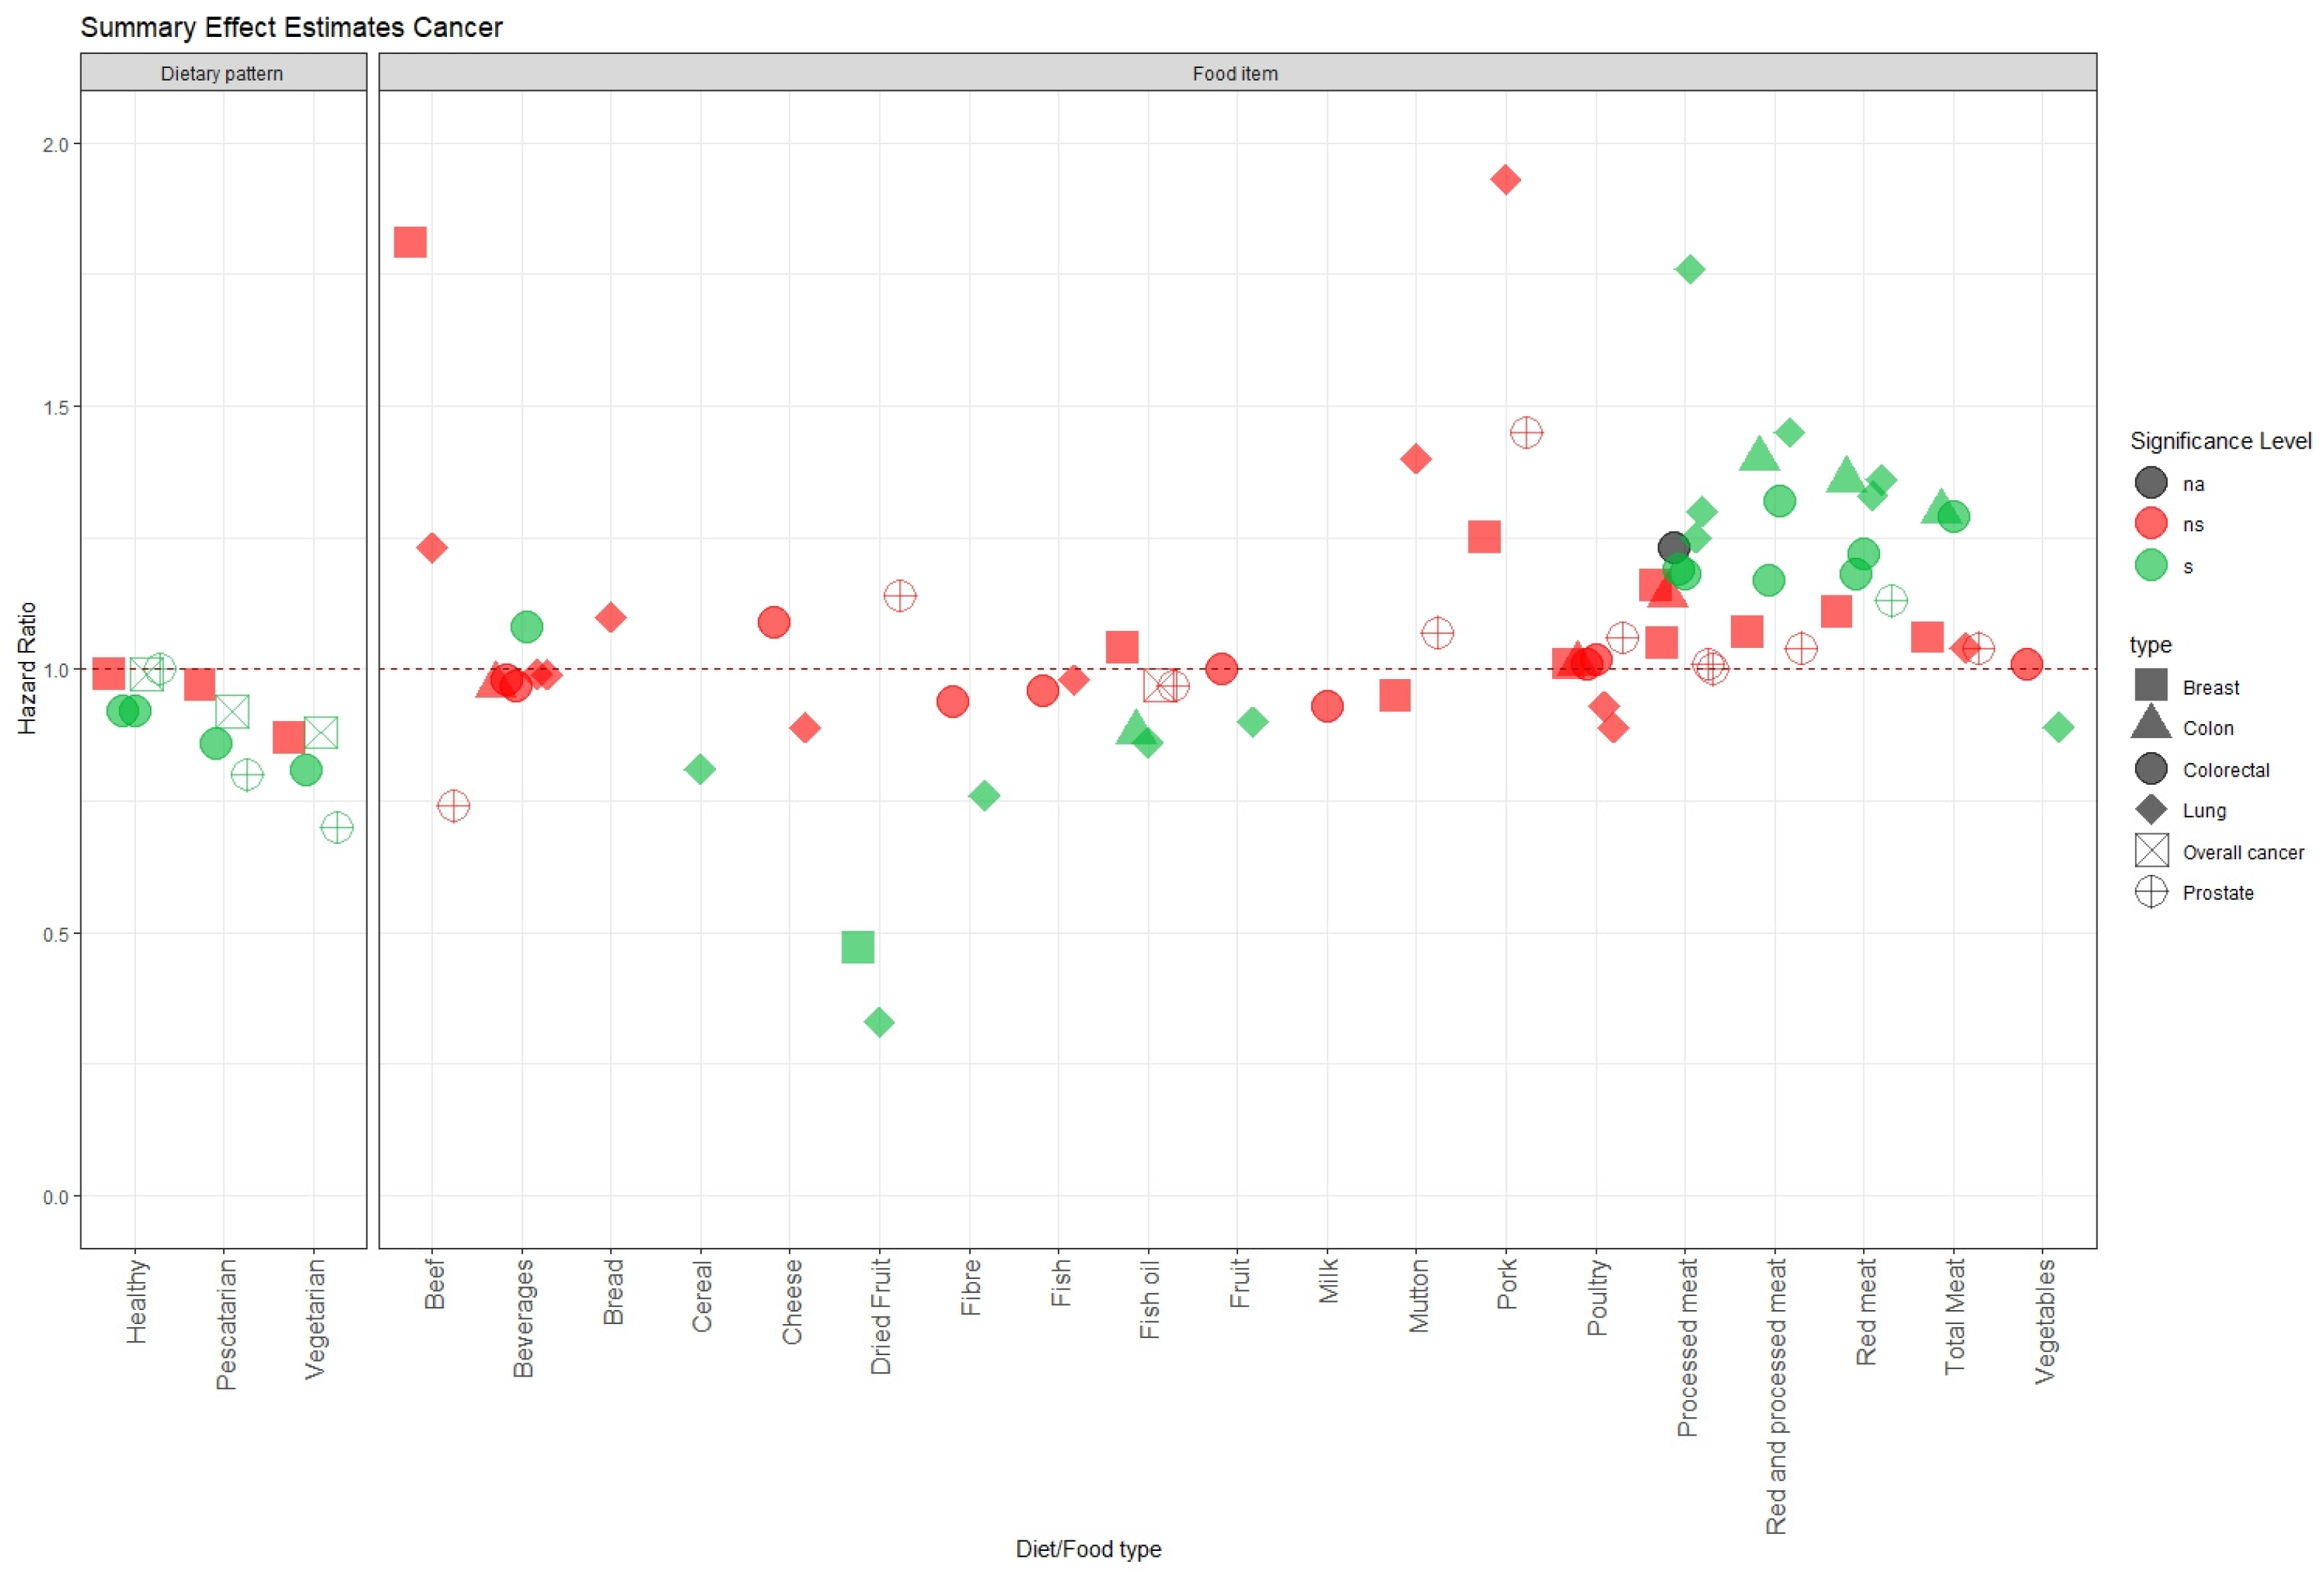
3.3.2. Cancer
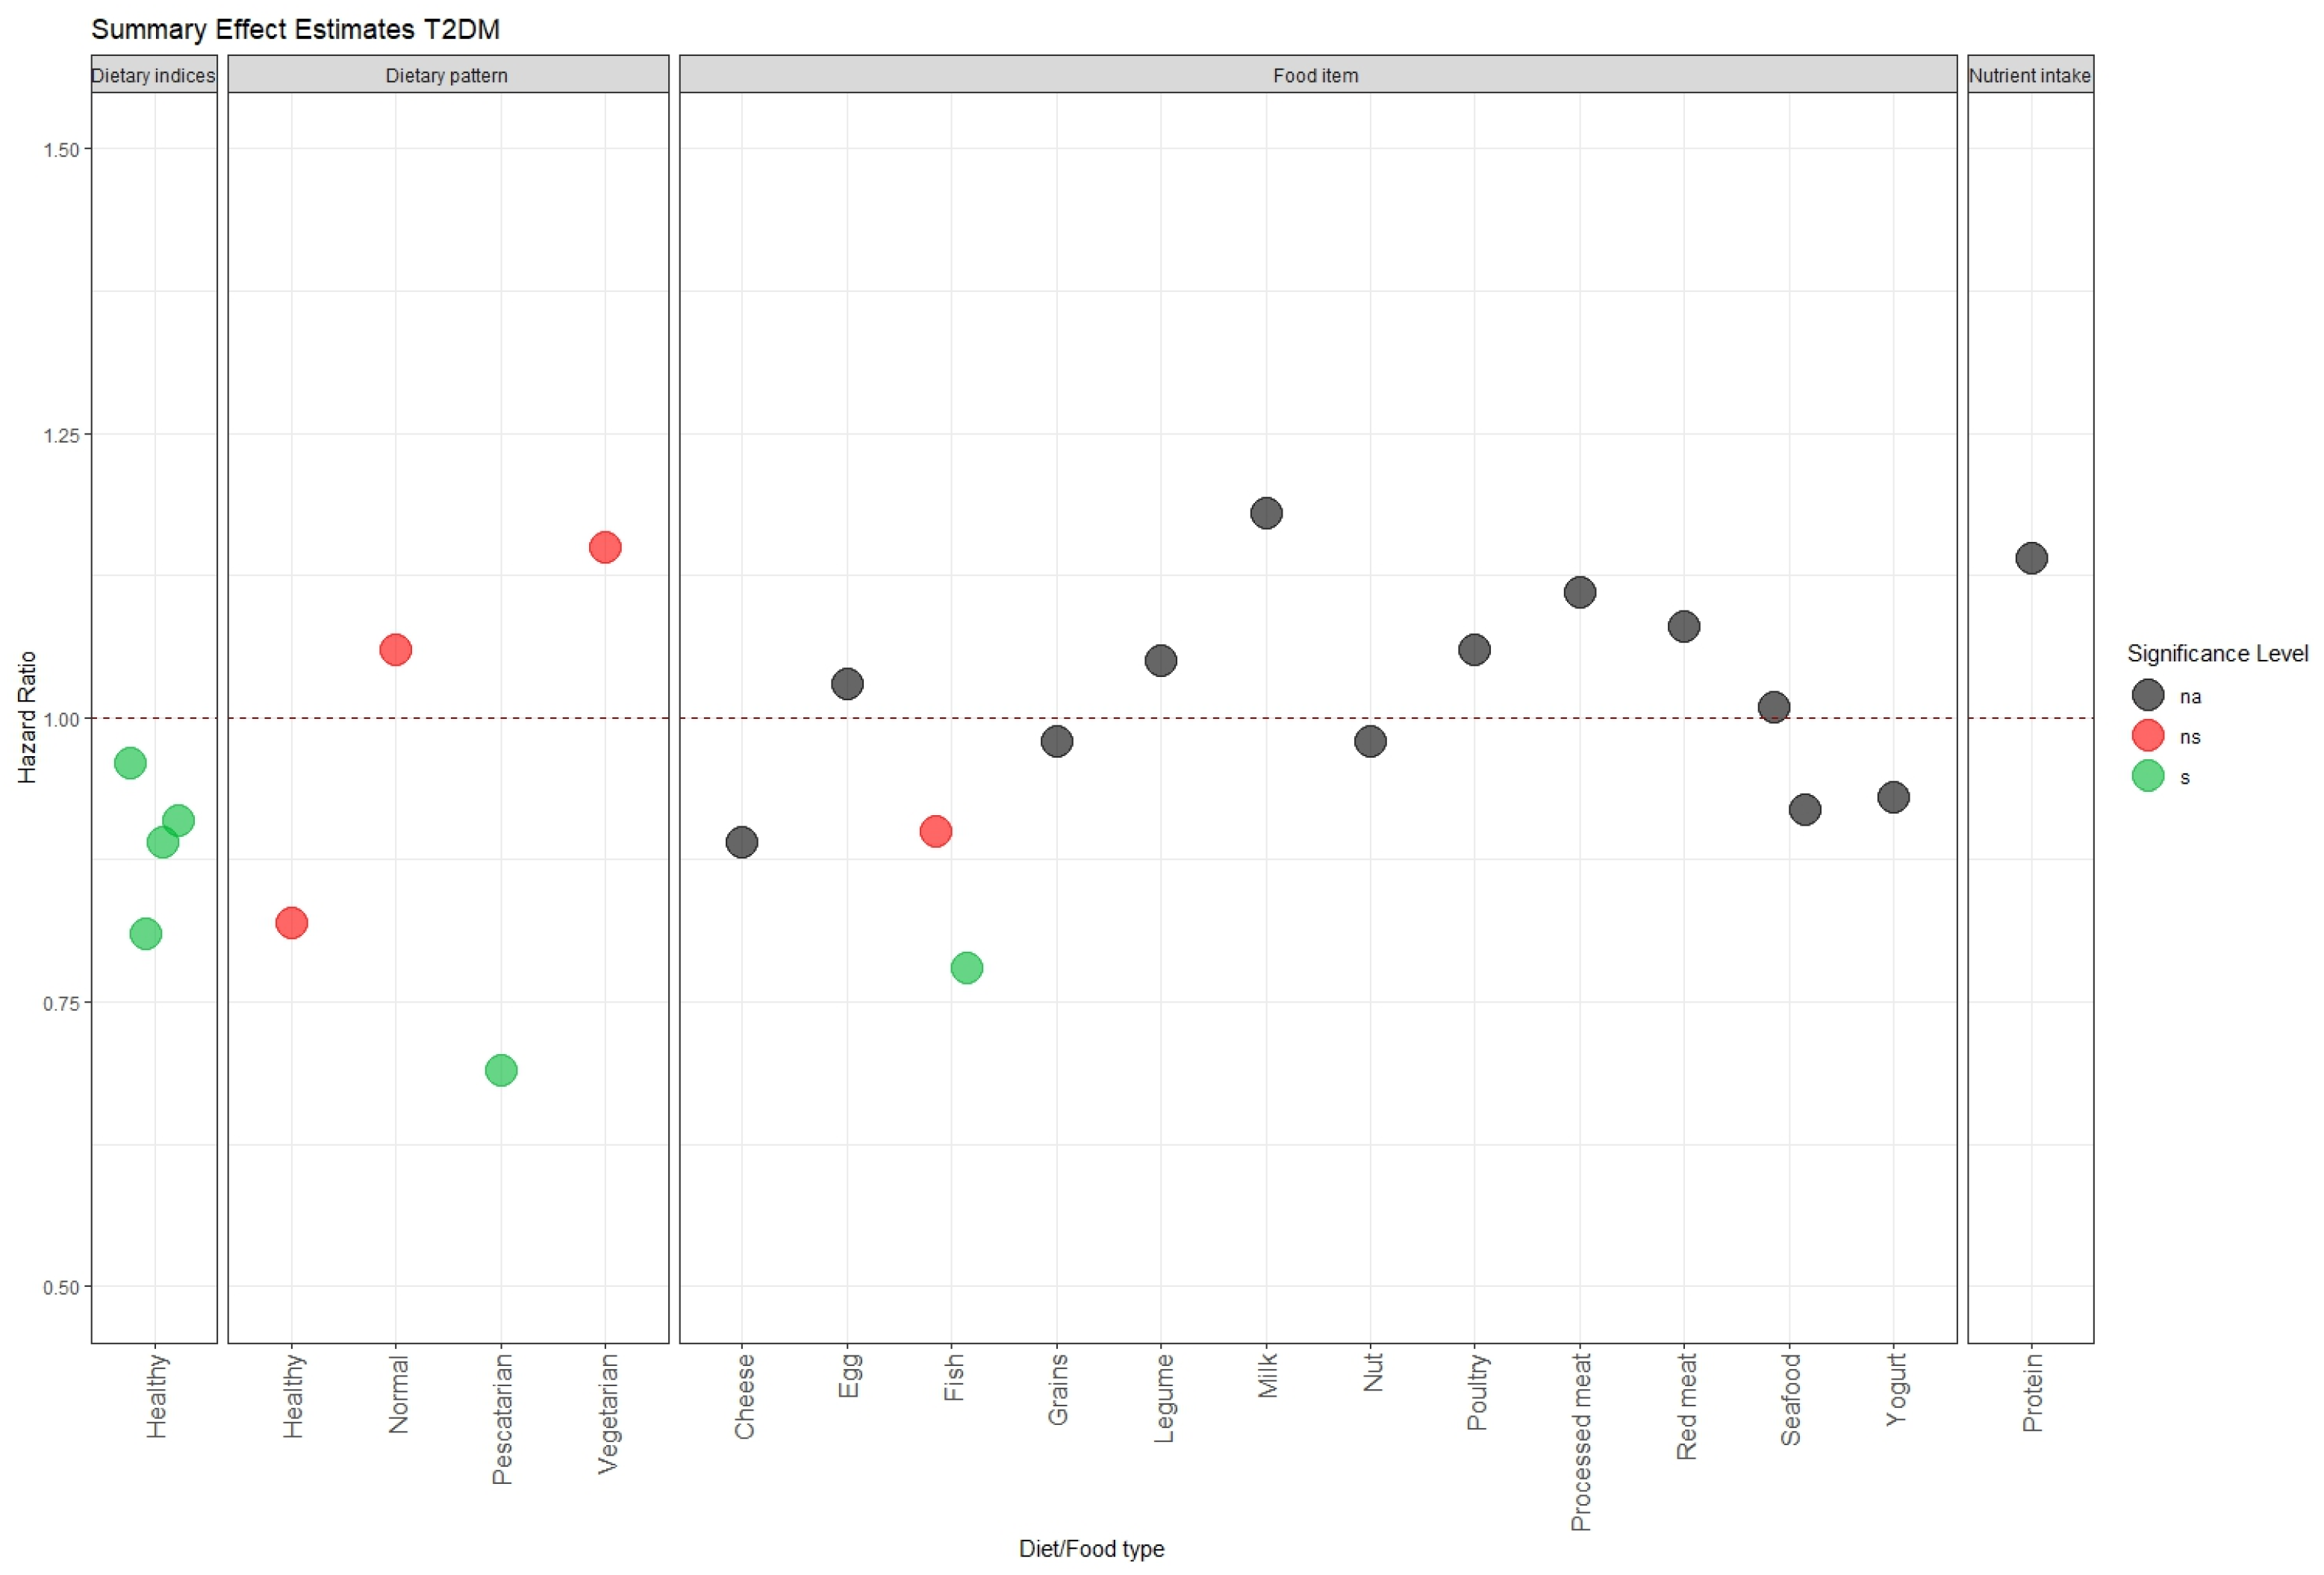
3.3.3. Type 2 Diabetes Mellitus (T2DM)
3.3.4. Range and Distribution of Healthy Diet, Red Meat, and Processed Meat
4. Discussion
Author Contributions
Funding
Institutional Review Board Statement
Informed Consent Statement
Data Availability Statement
Conflicts of Interest
References
- Steck, S.E.; Murphy, E.A. Dietary Patterns and Cancer Risk. Nat. Rev. Cancer 2020, 20, 125–138. [Google Scholar] [CrossRef]
- Georgousopoulou, E.N.; Pitsavos, C.; Yannakoulia, M.; Panagiotakos, D.B. The Role of Dietary Patterns’ Assessment in the Predictive Ability of Cardiovascular Disease Risk Estimation Models: A Review. Int. J. Food Sci. Nutr. 2014, 65, 3–8. [Google Scholar] [CrossRef] [PubMed]
- Allen, N.; Sudlow, C.; Downey, P.; Peakman, T.; Danesh, J.; Elliott, P.; Gallacher, J.; Green, J.; Matthews, P.; Pell, J.; et al. UK Biobank: Current Status and What It Means for Epidemiology. Health Policy Technol. 2012, 1, 123–126. [Google Scholar] [CrossRef]
- Jacobs, D.R.; Tapsell, L.C. Food, Not Nutrients, Is the Fundamental Unit in Nutrition. Nutr. Rev. 2008, 65, 439–450. [Google Scholar] [CrossRef] [PubMed]
- Schulze, M.B.; Martínez-González, M.A.; Fung, T.T.; Lichtenstein, A.H.; Forouhi, N.G. Food Based Dietary Patterns and Chronic Disease Prevention. BMJ 2018, 361, k2396. [Google Scholar] [CrossRef]
- Fry, A.; Littlejohns, T.J.; Sudlow, C.; Doherty, N.; Adamska, L.; Sprosen, T.; Collins, R.; Allen, N.E. Comparison of Sociodemographic and Health-Related Characteristics of UK Biobank Participants With Those of the General Population. Am. J. Epidemiol. 2017, 186, 1026–1034. [Google Scholar] [CrossRef] [PubMed]
- Sudlow, C.; Gallacher, J.; Allen, N.; Beral, V.; Burton, P.; Danesh, J.; Downey, P.; Elliott, P.; Green, J.; Landray, M.; et al. UK Biobank: An Open Access Resource for Identifying the Causes of a Wide Range of Complex Diseases of Middle and Old Age. PLoS Med. 2015, 12, e1001779. [Google Scholar] [CrossRef] [PubMed]
- Wells, G.A.; Shea, B.; O’Connell, D.; Peterson, J.; Welch, V.; Losos, M.; Tugwell, P. The Newcastle-Ottawa Scale (NOS) for Assessing the Quality of Nonrandomised Studies in Meta-Analyses. In 3rd Symposium on Systematic Reviews: Beyond the Basics; Cochrane: Oxford, UK, 2000. [Google Scholar]
- VanderWeele, T.J. Optimal Approximate Conversions of Odds Ratios and Hazard Ratios to Risk Ratios. Biometrics 2020, 76, 746–752. [Google Scholar] [CrossRef]
- McKenzie, B.L.; Harris, K.; Peters, S.A.E.; Webster, J.; Woodward, M. The Association of Energy and Macronutrient Intake with All-Cause, Cardiovascular Disease and Dementia: Findings from 120 963 and Men in the UK Biobank. Br. J. Nutr. 2022, 127, 1858–1867. [Google Scholar] [CrossRef]
- Heianza, Y.; Zhou, T.; Sun, D.; Hu, F.B.; Manson, J.E.; Qi, L. Genetic Susceptibility, Plant-Based Dietary Patterns, and Risk of cardiovascular Disease. Am. J. Clin. Nutr. 2020, 112, 220–228. [Google Scholar] [CrossRef]
- Brassard, D.; Manikpurage, H.D.; Theriault, S.; Arsenault, B.J.; Lamarche, B. Greater Adherence to the 2019 Canada’s Food Guide Recommendations on healthy Food Choices Reduces the Risk of Cardiovascular Disease in adults: A Prospective Analysis of UK Biobank Data. Am. J. Clin. Nutr. 2022, 116, 1748–1758. [Google Scholar] [CrossRef]
- Petermann-Rocha, F.; Parra-Soto, S.; Gray, S.; Anderson, J.; Welsh, P.; Gill, J.; Sattar, N.; Ho, F.K.; Celis-Morales, C.; Pell, J.P. Vegetarians, Fish, Poultry, and Meat-Eaters: Who Has Higher Risk of cardiovascular Disease Incidence and Mortality? A Prospective Study from UK Biobank. Eur. Heart J. 2021, 42, 1136–1143. [Google Scholar] [CrossRef]
- Chen, X.; Chu, J.; Hu, W.; Sun, N.; He, Q.; Liu, S.; Feng, Z.; Li, T.; Han, Q.; Shen, Y. Associations of Ultra-Processed Food Consumption with Cardiovascular and All-Cause Mortality: UK Biobank. Eur. J. Public Health 2022, 32, 779–785. [Google Scholar] [CrossRef]
- Heianza, Y.; Zhou, T.; Sun, D.; Hu, F.B.; Qi, L. Healthful Plant-Based Dietary Patterns, Genetic Risk of Obesity, and cardiovascular Risk in the UK Biobank Study. Clin. Nutr. 2021, 40, 4694–4701. [Google Scholar] [CrossRef] [PubMed]
- Ding, D.; Van Buskirk, J.; Nguyen, B.; Stamatakis, E.; Elbarbary, M.; Veronese, N.; Clare Philip, J.; Lee, I.-M.; Ekelund, U.; Fontana, L. Physical Activity, Diet Quality and All-Cause Cardiovascular Disease and cancer Mortality: A Prospective Study of 346 627 UK Biobank Participants. Br. J. Sports Med. 2022, 56, 1148–1156. [Google Scholar] [CrossRef] [PubMed]
- Zhang, Y.-B.; Chen, C.; Pan, X.-F.; Guo, J.; Li, Y.; Franco, O.H.; Liu, G.; Pan, A. Associations of Healthy Lifestyle and Socioeconomic Status with mortality and Incident Cardiovascular Disease: Two Prospective Cohort. BMJ-Br. Med. J. 2021, 372, n604. [Google Scholar] [CrossRef] [PubMed]
- Livingstone, K.M.; Abbott, G.; Bowe, S.J.; Ward, J.; Milte, C.; McNaughton, S.A. Diet Quality Indices, Genetic Risk and Risk of Cardiovascular disease and Mortality: A Longitudinal Analysis of 77 004 UK Biobank Participants. BMJ Open 2021, 11, e045362. [Google Scholar] [CrossRef] [PubMed]
- Feng, Q.; Kim, J.H.; Omiyale, W.; Besevic, J.; Conroy, M.; May, M.; Yang, Z.; Wong, S.Y.; Tsoi, K.K.; Allen, N.; et al. Raw and Cooked Vegetable Consumption and Risk of Cardiovascular Disease: A Study of 400,000 Adults in UK Biobank. Front. Nutr. 2022, 9, 831470. [Google Scholar] [CrossRef] [PubMed]
- Ho, F.K.; Gray, S.R.; Welsh, P.; Petermann-Rocha, F.; Foster, H.; Waddell, H.; Anderson, J.; Lyall, D.; Sattar, N.; Gill, J.M.R.; et al. Associations of Fat and Carbohydrate Intake with Cardiovascular disease and Mortality: Prospective Cohort Study of UK Biobank Participants. BMJ-Br. Med. J. 2020, 368, m688. [Google Scholar] [CrossRef] [PubMed]
- Wu, K.; Liu, L.; Shu, T.; Li, A.; Xia, D.; Sun, X. The Relationship between Processed Meat, Red Meat, and Risk of Types of cancer: A Mendelian Randomization Study. Front. Nutr. 2022, 9, 942155. [Google Scholar] [CrossRef]
- Wei, X.; Zhu, C.; Ji, M.; Fan, J.; Xie, J.; Huang, Y.; Jiang, X.; Xu, J.; Yin, R.; Du, L.; et al. Diet and Risk of Incident Lung Cancer: A Large Prospective Cohort Study in UK Biobank. Am. J. Clin. Nutr. 2021, 114, 2043–2051. [Google Scholar] [CrossRef] [PubMed]
- Knuppel, A.; Papier, K.; Fensom, G.K.; Appleby, P.N.; Schmidt, J.A.; Tong, T.Y.N.; Travis Ruth, C.; Key, T.J.; Perez-Cornago, A. Meat Intake and Cancer Risk: Prospective Analyses in UK Biobank. Int. J. Epidemiol. 2020, 49, 1540–1552. [Google Scholar] [CrossRef]
- Jin, C.; Li, R.; Deng, T.; Lin, Z.; Li, H.; Yang, Y.; Su, Q.; Wang, J.; Yang, Y.; Wang, J.; et al. Association between Dried Fruit Intake and Pan-Cancers Incidence Risk: A-Sample Mendelian Randomization Study. Front. Nutr. 2022, 9, 899137. [Google Scholar] [CrossRef]
- Liu, Z.; Luo, Y.; Ren, J.; Yang, L.; Li, J.; Wei, Z.; He, Y.; Wang, J.; Li, R.; He, L.; et al. Association between Fish Oil Supplementation and Cancer Risk according to Fatty Fish Consumption: A Large Prospective Population-Based Cohort Using UK Biobank. Int. J. Cancer 2022, 150, 562–571. [Google Scholar] [CrossRef] [PubMed]
- Tran, K.T.; Coleman, H.G.; McMenamin, U.C.; Cardwell, C.R. Coffee Consumption by Type and Risk of Digestive Cancer: A Large Cohort Study. Br. J. Cancer 2019, 120, 1059–1066. [Google Scholar] [CrossRef] [PubMed]
- Bradbury, K.E.; Murphy, N.; Key, T.J. Diet and Colorectal Cancer in UK Biobank: A Prospective Study. Int. J. Epidemiol. 2020, 49, 246–258. [Google Scholar] [CrossRef] [PubMed]
- Feng, Q.; Wong, S.H.; Zheng, J.; Yang, Q.; Sung, J.J.Y.; Tsoi, K.K.F. Intake of Processed Meat, but Not Sodium, Is Associated with Risk of colorectal Cancer: Evidence from a Large Prospective Cohort and two-Sample Mendelian Randomization. Clin. Nutr. 2021, 40, 4551–4559. [Google Scholar] [CrossRef] [PubMed]
- Watling, C.Z.; Schmidt, J.A.; Dunneram, Y.; Tong, T.Y.N.; Kelly, R.K.; Knuppel, A.; Travis Ruth, C.; Key, T.J.; Perez-Cornago, A. Risk of Cancer in Regular and Low Meat-Eaters, Fish-Eaters, and vegetarians: A Prospective Analysis of UK Biobank Participants. BMC Med. 2022, 20, 73. [Google Scholar] [CrossRef]
- Wu, E.; Ni, J.-T.; Chen, X.; Zhu, Z.-H.; Xu, H.-Q.; Tao, L.; Xie, T. Genetic Risk, Incident Colorectal Cancer, and the Benefits of adhering to a Healthy Lifestyle: A Prospective Study Using Data from UK Biobank and FinnGen. Front. Oncol. 2022, 12, 894086. [Google Scholar] [CrossRef]
- Boonpor, J.; Petermann-Rocha, F.; Parra-Soto, S.; Pell, J.P.; Gray, S.R.; Celis-Morales, C.; Ho, F.K. Types of Diet, Obesity, and Incident Type 2 Diabetes: Findings from the UK Biobank Prospective Cohort Study. Diabetes Obes. Metab. 2022, 24, 1351–1359. [Google Scholar] [CrossRef]
- Li, J.; Glenn, A.J.; Yang, Q.; Ding, D.; Zheng, L.; Bao, W.; Beasley, J.; LeBlanc, E.; Lo, K.; Manson, J.E.; et al. Dietary Protein Sources, Mediating Biomarkers, and Incidence of Type 2: Findings From the Women’s Health Initiative and the UK Biobank. Diabetes Care 2022, 45, 1742–1753. [Google Scholar] [CrossRef]
- Brayner, B.; Kaur, G.; Keske, M.A.; Perez-Cornago, A.; Piernas, C.; Livingstone, K.M. Dietary Patterns Characterized by Fat Type in Association with Obesity and Type 2 Diabetes: A Longitudinal Study of UK Biobank Participants. J. Nutr. 2021, 151, 3570–3578. [Google Scholar] [CrossRef]
- Andre, P.; Proctor, G.; Driollet, B.; Garcia-Esquinas, E.; Lopez-Garcia, E.; Gomez-Cabrero, D.; Neyraud, E.; Rodriguez-Artalejo, F.; Morzel, M.; Feart, C. The Role of Overweight in the Association between the Mediterranean diet and the Risk of Type 2 Diabetes Mellitus: A Mediation Analysis among 21 UK Biobank Participants. Int. J. Epidemiol. 2020, 49, 1582–1590. [Google Scholar] [CrossRef]
- Song, Z.; Yang, R.; Wang, W.; Huang, N.; Zhuang, Z.; Han, Y.; Qi, L.; Xu, M.; Tang, Y.; Huang, T. Association of Healthy Lifestyle Including a Healthy Sleep Pattern with incident Type 2 Diabetes Mellitus among Individuals with Hypertension. Cardiovasc. Diabetol. 2021, 20, 239. [Google Scholar] [CrossRef] [PubMed]
- Xu, C.; Cao, Z.; Yang, H.; Hou, Y.; Wang, X.; Wang, Y. Association Between the EAT-Lancet Diet Pattern and Risk of Type 2: A Prospective Cohort Study. Front. Nutr. 2022, 8, 784018. [Google Scholar] [CrossRef] [PubMed]
- Zhuang, P.; Liu, X.; Li, Y.; Wan, X.; Wu, Y.; Wu, F.; Zhang, Y.; Jiao, J. Effect of Diet Quality and Genetic Predisposition on Hemoglobin A(1c) and Type 2 Diabetes Risk: Gene-Diet Interaction Analysis of 357,419. Diabetes Care 2021, 44, 2470–2479. [Google Scholar] [CrossRef] [PubMed]
- Chen, G.-C.; Arthur, R.; Qin, L.-Q.; Chen, L.-H.; Mei, Z.; Zheng, Y.; Li, Y.; Wang, T.; Rohan, T.E.; Qi, Q. Association of Oily and Nonoily Fish Consumption and Fish Oil With Incident Type 2 Diabetes: A Large Population-Based Study. Diabetes Care 2021, 44, 672–680. [Google Scholar] [CrossRef] [PubMed]
- Hutton, J.; Fatima, T.; Major, T.J.; Topless, R.; Stamp, L.K.; Merriman, T.R.; Dalbeth, N. Mediation Analysis to Understand Genetic Relationships between Habitual Intake and Gout. Arthritis Res. Ther. 2018, 20, 135. [Google Scholar] [CrossRef]
- Zhang, Y.; Yang, R.; Dove, A.; Li, X.; Yang, H.; Li, S.; Wang, J.; Li, W.-D.; Zhao, H.; Xu, W.; et al. Healthy Lifestyle Counteracts the Risk Effect of Genetic Factors on incident Gout: A Large Population-Based Longitudinal Study. BMC Med. 2022, 20, 138. [Google Scholar] [CrossRef] [PubMed]
- Chen, H.; Fu, T.; Dan, L.; Chen, X.; Sun, Y.; Chen, J.; Wang, X.; Hesketh, T. Meat Consumption and All-Cause Mortality in 5763 Patients with inflammatory Bowel Disease: A Retrospective Cohort Study. EClinicalMedicine 2022, 47, 101406. [Google Scholar] [CrossRef]
- Huang, X.; Li, Y.; Zhuang, P.; Liu, X.; Zhang, Y.; Zhang, P.; Jiao, J. Habitual Fish Oil Supplementation and Risk of Incident Inflammatory Diseases: A Prospective Population-Based Study. Front. Nutr. 2022, 9, 905162. [Google Scholar] [CrossRef]
- Fu, T.; Ye, S.; Sun, Y.; Dan, L.; Wang, X.; Chen, J. Greater Adherence to Cardioprotective Diet Can Reduce Inflammatory Bowel Risk: A Longitudinal Cohort Study. Nutrients 2022, 14, 4058. [Google Scholar] [CrossRef]
- Mazzucca, C.B.; Scotti, L.; Cappellano, G.; Barone-Adesi, F.; Chiocchetti, A. Nutrition and Rheumatoid Arthritis Onset: A Prospective Analysis Using the UK Biobank. Nutrients 2022, 14, 1554. [Google Scholar] [CrossRef]
- Chen, W.; Liu, K.; Huang, L.; Mao, Y.; Wen, C.; Ye, D.; He, Z. Beef Intake and Risk of Rheumatoid Arthritis: Insights from a cross-Sectional Study and Two-Sample Mendelian Randomization. Front. Nutr. 2022, 9, 923472. [Google Scholar] [CrossRef]
- Greenwood, D.C.; Hardie, L.J.; Frost, G.S.; Alwan, N.A.; Bradbury, K.E.; Carter, M.; Elliott, P.; Evans, C.E.L.; Ford, H.E.; Hancock, N.; et al. Validation of the Oxford WebQ Online 24-Hour Dietary Questionnaire Using. Am. J. Epidemiol. 2019, 188, 1858–1867. [Google Scholar] [CrossRef]
- Liu, B.; Young, H.; Crowe, F.L.; Benson, V.S.; Spencer, E.A.; Key, T.J.; Appleby, P.N.; Beral, V. Development and Evaluation of the Oxford WebQ, a Low-Cost, Web-Based for Assessment of Previous 24 h Dietary Intakes in Large-Scale Studies. Public Health Nutr. 2011, 14, 1998–2005. [Google Scholar] [CrossRef]
- Galante, J.; Adamska, L.; Young, A.; Young, H.; Littlejohns, T.J.; Gallacher, J.; Allen, N. The Acceptability of Repeat Internet-Based Hybrid Diet Assessment of previous 24-h Dietary Intake: Administration of the Oxford WebQ in UK. Br. J. Nutr. 2016, 115, 681–686. [Google Scholar] [CrossRef]
- Darling, A.L.; Blackbourn, D.J.; Ahmadi, K.R.; Lanham-New, S.A. Vitamin D Supplement Use and Associated Demographic, Dietary and Lifestyle Factors in 8024 South Asians Aged 40–69 Years: Analysis of the UK Biobank Cohort. Public Health Nutr. 2018, 21, 2678–2688. [Google Scholar] [CrossRef] [PubMed]
- Holmes, B.; Dick, K.; Nelson, M. A Comparison of Four Dietary Assessment Methods in Materially Deprived Households in England. Public Health Nutr. 2008, 11, 444–456. [Google Scholar] [CrossRef] [PubMed]
- Jackson, K.A.; Byrne, N.M.; Magarey, A.M.; Hills, A.P. Minimizing Random Error in Dietary Intakes Assessed by 24-h Recall, in Overweight and Obese Adults. Eur. J. Clin. Nutr. 2008, 62, 537–543. [Google Scholar] [CrossRef] [PubMed]
- Stote, K.S.; Radecki, S.V.; Moshfegh, A.J.; Ingwersen, L.A.; Baer, D.J. The Number of 24 h Dietary Recalls Using the US Department of Agriculture’s Automated Multiple-Pass Method Required to Estimate Nutrient Intake in Overweight and Obese Adults. Public Health Nutr. 2011, 14, 1736–1742. [Google Scholar] [CrossRef]
- Carter, J.L.; Lewington, S.; Piernas, C.; Bradbury, K.; Key, T.J.; Jebb, S.A.; Arnold, M.; Bennett, D.; Clarke, R. Reproducibility of Dietary Intakes of Macronutrients, Specific Food, and Dietary Patterns in 211 050 Adults in the UK Biobank Study. J. Nutr. Sci. 2019, 8, e34. [Google Scholar] [CrossRef] [PubMed]
- Kristal, A.R.; Peters, U.; Potter, J.D. Is It Time to Abandon the Food Frequency Questionnaire? Cancer Epidemiol. Biomark. Prev. 2005, 14, 2826–2828. [Google Scholar] [CrossRef] [PubMed]
- Ubago-Guisado, E.; Rodríguez-Barranco, M.; Ching-López, A.; Petrova, D.; Molina-Montes, E.; Amiano, P.; Barricarte-Gurrea, A.; Chirlaque, M.-D.; Agudo, A.; Sánchez, M.-J. Evidence Update on the Relationship between Diet and the Most Common Cancers from the European Prospective Investigation into Cancer and Nutrition (EPIC) Study: A Systematic Review. Nutrients 2021, 13, 3582. [Google Scholar] [CrossRef] [PubMed]
- Whiteley, C.; Benton, F.; Matwiejczyk, L.; Luscombe-Marsh, N. Determining Dietary Patterns to Recommend for Type 2 Diabetes: An Umbrella Review. Nutrients 2023, 15, 861. [Google Scholar] [CrossRef] [PubMed]
- Jannasch, F.; Kröger, J.; Schulze, M.B. Dietary Patterns and Type 2 Diabetes: A Systematic Literature Review and Meta-Analysis of Prospective Studies. J. Nutr. 2017, 147, 1174–1182. [Google Scholar] [CrossRef] [PubMed]
- Tong, T.Y.N.; Appleby, P.N.; Bradbury, K.E.; Perez-Cornago, A.; Travis, R.C.; Clarke, R.; Key, T.J. Risks of Ischaemic Heart Disease and Stroke in Meat Eaters, Fish Eaters, and Vegetarians over 18 Years of Follow-up: Results from the Prospective EPIC-Oxford Study. BMJ 2019, 366, l4897. [Google Scholar] [CrossRef] [PubMed]
- Appleby, P.N.; Crowe, F.L.; Bradbury, K.E.; Travis, R.C.; Key, T.J. Mortality in Vegetarians and Comparable Nonvegetarians in the United Kingdom. Am. J. Clin. Nutr. 2016, 103, 218–230. [Google Scholar] [CrossRef] [PubMed]
- May-Wilson, S.; Matoba, N.; Wade, K.H.; Hottenga, J.-J.; Concas, M.P.; Mangino, M.; Grzeszkowiak, E.J.; Menni, C.; Gasparini, P.; Timpson, N.J.; et al. Large-Scale GWAS of Food Liking Reveals Genetic Determinants and Genetic Correlations with Distinct Neurophysiological Traits. Nat. Commun. 2022, 13, 2743. [Google Scholar] [CrossRef]
- Rodríguez-Monforte, M.; Flores-Mateo, G.; Sánchez, E. Dietary Patterns and CVD: A Systematic Review and Meta-Analysis of Observational Studies. Br. J. Nutr. 2015, 114, 1341–1359. [Google Scholar] [CrossRef]
- Grosso, G.; Marventano, S.; Yang, J.; Micek, A.; Pajak, A.; Scalfi, L.; Galvano, F.; Kales, S.N. A Comprehensive Meta-Analysis on Evidence of Mediterranean Diet and Cardiovascular Disease: Are Individual Components Equal? Crit. Rev. Food Sci. Nutr. 2017, 57, 3218–3232. [Google Scholar] [CrossRef] [PubMed]
- Magalhães, B.; Peleteiro, B.; Lunet, N. Dietary Patterns and Colorectal Cancer. Eur. J. Cancer Prev. 2012, 21, 15–23. [Google Scholar] [CrossRef] [PubMed]
- Papadimitriou, N.; Markozannes, G.; Kanellopoulou, A.; Critselis, E.; Alhardan, S.; Karafousia, V.; Kasimis, J.C.; Katsaraki, C.; Papadopoulou, A.; Zografou, M.; et al. An Umbrella Review of the Evidence Associating Diet and Cancer Risk at 11 Anatomical Sites. Nat. Commun. 2021, 12, 4579. [Google Scholar] [CrossRef] [PubMed]
- Grosso, G.; Bella, F.; Godos, J.; Sciacca, S.; Del Rio, D.; Ray, S.; Galvano, F.; Giovannucci, E.L. Possible Role of Diet in Cancer: Systematic Review and Multiple Meta-Analyses of Dietary Patterns, Lifestyle Factors, and Cancer Risk. Nutr. Rev. 2017, 75, 405–419. [Google Scholar] [CrossRef] [PubMed]
- Esposito, K.; Chiodini, P.; Maiorino, M.I.; Bellastella, G.; Panagiotakos, D.; Giugliano, D. Which Diet for Prevention of Type 2 Diabetes? A Meta-Analysis of Prospective Studies. Endocrine 2014, 47, 107–116. [Google Scholar] [CrossRef]
- Walker, M.E.; Song, R.J.; Xu, X.; Gerszten, R.E.; Ngo, D.; Clish, C.B.; Corlin, L.; Ma, J.; Xanthakis, V.; Jacques, P.F.; et al. Proteomic and Metabolomic Correlates of Healthy Dietary Patterns: The Framingham Heart Study. Nutrients 2020, 12, 1476. [Google Scholar] [CrossRef]
- Akbaraly, T.; Würtz, P.; Singh-Manoux, A.; Shipley, M.J.; Haapakoski, R.; Lehto, M.; Desrumaux, C.; Kähönen, M.; Lehtimäki, T.; Mikkilä, V.; et al. Association of Circulating Metabolites with Healthy Diet and Risk of Cardiovascular Disease: Analysis of Two Cohort Studies. Sci. Rep. 2018, 8, 8620. [Google Scholar] [CrossRef]
- Yu, E.Y.-W.; Ren, Z.; Mehrkanoon, S.; Stehouwer, C.D.A.; van Greevenbroek, M.M.J.; Eussen, S.J.P.M.; Zeegers, M.P.; Wesselius, A. Plasma Metabolomic Profiling of Dietary Patterns Associated with Glucose Metabolism Status: The Maastricht Study. BMC Med. 2022, 20, 450. [Google Scholar] [CrossRef]


| Author | Year | Number of Participants | FFQ | 24 h Recall | Number of Repeated 24 h Recall | Dietary Focus |
|---|---|---|---|---|---|---|
| Cardiovascular Diseases | ||||||
| McKenzie et al. [10] | 2022 | 120,963 | no | yes | 2–5 | Nutrient intake |
| Heianza et al. [11] a | 2020 | 156,148 | no | yes | 1–5 | Dietary indices (healthy plant-based dietary patterns) |
| Brassard et al. [12] a | 2022 | 136,698 | no | yes | 1–5 | Dietary indices (healthy eating food index recommended by CFG) |
| Petermann-Rocha et al. [13] | 2021 | 422,791 | yes | no | N/A | Dietary pattern |
| Chen, X. et al. [14] | 2022 | 60,298 | no | yes | 1 | The proportion of UPFs energy to total energy |
| Heianza et al. [15] a | 2021 | 121,799 | no | yes | 1–5 | Dietary indices (healthy plant-based dietary patterns) |
| Ding et al. [16] a | 2022 | 346,627 | yes | no | N/A | Dietary indices (diet quality index recommended by AHA) |
| Zhang, Y.B. et al. [17] a,b | 2021 | 399,537 | yes | no | N/A | Diet indices (healthy eating index) |
| Livingstone et al. [18] a | 2021 | 77,004 | no | yes | 2–4 | Dietary indices (healthy diet index recommended by WHO) |
| Feng et al. [19] | 2022 | 399,586 | yes | no | N/A | Vegetable intake |
| Ho et al. [20] | 2020 | 195,658 | no | yes | 1–5 | Nutrient intake |
| Cancer | ||||||
| Wu, K. et al. [21] a | 2022 | 461,981 | yes | no | N/A | Meat and processed meat intake |
| Wei et al. [22] a | 2021 | 416,588 | yes | yes | 1–5 | Food group intake |
| Knuppel et al. [23] a | 2020 | 474,996 | yes | yes | 3–5 | Total meat intake |
| Jin et al. [24] b | 2022 | 421,764 | yes | no | N/A | Dried fruit intake |
| Liu, Z. et al. [25] | 2022 | 470,804 | yes | yes | 1 | Fish oil intake |
| Tran et al. [26] | 2019 | 471,779 | yes | no | N/A | Coffee intake |
| Bradbury et al. [27] a | 2020 | 475,581 | yes | yes | 1–5 | Food group intake |
| Feng et al. [28] a | 2021 | 415,524 | yes | no | N/A | Processed meat intake |
| Watling et al. [29] a | 2022 | 472,377 | yes | no | N/A | Dietary pattern |
| Wu, E. et al. [30] a,b | 2022 | 390,365 | yes | no | N/A | Dietary indices (diet quality index recommended by ACS) |
| Type 2 Diabetes Mellitus | ||||||
| Boonpor et al. [31] | 2022 | 203,790 | yes | no | N/A | Dietary pattern |
| Li et al. [32] b | 2022 | 34,616 | no | yes | 4–5 | Dietary protein group intake |
| Brayner et al. [33] | 2021 | 16,523 | no | yes | 2–5 | Dietary pattern |
| Andre et al. [34] a | 2020 | 21,585 | no | yes | 1–5 | Dietary indices (adherence to a Mediterranean-style diet) |
| Song et al. [35] a | 2021 | 430,971 | yes | no | N/A | Dietary indices (healthy diet index recommended by ADA) |
| Xu, C. et al. [36] a | 2022 | 59,849 | no | yes | 1 | Dietary indices (EAT-LDP score) |
| Zhuang et al. [37] a | 2021 | 357,419 | yes | no | N/A | Dietary indices (predefined diet quality score) |
| Chen, G.C. et al. [38] | 2021 | 392,287 | yes | yes | 1–5 | Fish intake |
| Gout | ||||||
| Hutton et al. [39] | 2018 | 130,966 | yes | no | N/A | Coffee intake |
| Zhang, Y. et al. [40] | 2022 | 416,481 | yes | no | N/A | Dietary quality |
| Inflammatory bowel disease | ||||||
| Chen, H. et al. [41] | 2022 | 5763 | yes | no | N/A | Meat intake |
| Huang et al. [42] | 2022 | 447,890 | yes | no | N/A | Fish oil intake |
| Fu et al. [43] | 2022 | 121,490 | no | yes | 1–5 | Sugar-sweetened beverage intake |
| Rheumatoid arthritis | ||||||
| Mazzucca et al. [44] | 2022 | 479,494 | yes | no | N/A | Food and beverage group intake |
| Chen, W. et al. [45] | 2022 | 335,576 | no | yes | 2 | Beef intake |
Disclaimer/Publisher’s Note: The statements, opinions and data contained in all publications are solely those of the individual author(s) and contributor(s) and not of MDPI and/or the editor(s). MDPI and/or the editor(s) disclaim responsibility for any injury to people or property resulting from any ideas, methods, instructions or products referred to in the content. |
© 2024 by the authors. Licensee MDPI, Basel, Switzerland. This article is an open access article distributed under the terms and conditions of the Creative Commons Attribution (CC BY) license (https://creativecommons.org/licenses/by/4.0/).
Share and Cite
Navratilova, H.F.; Lanham-New, S.; Whetton, A.D.; Geifman, N. Associations of Diet with Health Outcomes in the UK Biobank: A Systematic Review. Nutrients 2024, 16, 523. https://doi.org/10.3390/nu16040523
Navratilova HF, Lanham-New S, Whetton AD, Geifman N. Associations of Diet with Health Outcomes in the UK Biobank: A Systematic Review. Nutrients. 2024; 16(4):523. https://doi.org/10.3390/nu16040523
Chicago/Turabian StyleNavratilova, Hana F., Susan Lanham-New, Anthony D. Whetton, and Nophar Geifman. 2024. "Associations of Diet with Health Outcomes in the UK Biobank: A Systematic Review" Nutrients 16, no. 4: 523. https://doi.org/10.3390/nu16040523
APA StyleNavratilova, H. F., Lanham-New, S., Whetton, A. D., & Geifman, N. (2024). Associations of Diet with Health Outcomes in the UK Biobank: A Systematic Review. Nutrients, 16(4), 523. https://doi.org/10.3390/nu16040523