
Non-Interventional Weight Changes Are Associated with Alterations in Lipid Profiles and in the Triglyceride-to-HDL Cholesterol Ratio

 ,
, 

Abstract

1. Introduction
2. Materials and Methods
2.1. Study Population
2.2. Inclusion and Exclusion Criteria
2.3. Definitions and Outcome
2.4. Statistical Analysis
3. Results
4. Discussion
5. Conclusions
Supplementary Materials
Author Contributions
Funding
Institutional Review Board Statement
Informed Consent Statement
Data Availability Statement
Acknowledgments
Conflicts of Interest
References
- Piché, M.E.; Tchernof, A.; Després, J.P. Obesity Phenotypes, Diabetes, and Cardiovascular Diseases. Circ. Res. 2020, 126, 1477–1500. [Google Scholar] [CrossRef] [PubMed]
- Leggio, M.; Lombardi, M.; Caldarone, E.; Severi, P.; D’emidio, S.; Armeni, M.; Bravi, V.; Bendini, M.G.; Mazza, A. The relationship between obesity and hypertension: An updated comprehensive overview on vicious twins. Hypertens. Res. 2017, 40, 947–963. [Google Scholar] [CrossRef] [PubMed]
- Wormser, D.; Kaptoge, S.; Di Angelantonio, E.; Wood, A.M.; Pennells, L.; Thompson, A.; Sarwar, N.; Kizer, J.R.; Lawlor, D.A.; Nordestgaard, B.G.; et al. Separate and combined associations of body-mass index and abdominal adiposity with cardiovascular disease: Collaborative analysis of 58 prospective studies. Lancet 2011, 377, 1085–1095. [Google Scholar] [CrossRef] [PubMed]
- Hsu, C.Y.; McCulloch, C.E.; Iribarren, C.; Darbinian, J.; Go, A.S. Body mass index and risk for end-stage renal disease. Ann. Intern. Med. 2006, 144, 21–28. [Google Scholar] [CrossRef] [PubMed]
- Al Rifai, M.; Silverman, M.G.; Nasir, K.; Budoff, M.J.; Blankstein, R.; Szklo, M.; Katz, R.; Blumenthal, R.S.; Blaha, M.J. The association of nonalcoholic fatty liver disease, obesity, and metabolic syndrome, with systemic inflammation and subclinical atherosclerosis: The Multi-Ethnic Study of Atherosclerosis (MESA). Atherosclerosis 2015, 239, 629–633. [Google Scholar] [CrossRef]
- Koenen, M.; Hill, M.A.; Cohen, P.; Sowers, J.R. Obesity, Adipose Tissue and Vascular Dysfunction. Circ. Res. 2021, 128, 951–968. [Google Scholar] [CrossRef]
- Navar-Boggan, A.M.; Peterson, E.D.; D’Agostino, R.B.; Neely, B.; Sniderman, A.D.; Pencina, M.J. Hyperlipidemia in early adulthood increases long-term risk of coronary heart disease. Circulation 2015, 131, 451–458. [Google Scholar] [CrossRef]
- Kaneko, H.; Itoh, H.; Kiriyama, H.; Kamon, T.; Fujiu, K.; Morita, K.; Michihata, N.; Jo, T.; Takeda, N.; Morita, H.; et al. Lipid Profile and Subsequent Cardiovascular Disease among Young Adults Aged <50 Years. Am. J. Cardiol. 2021, 142, 59–65. [Google Scholar] [CrossRef]
- Jiménez, J.-M.; Carbajo, M.-A.; López, M.; Cao, M.-J.; Rúiz-Tovar, J.; García, S.; Castro, M.-J. Changes in Lipid Profile, Body Weight Variables and Cardiovascular Risk in Obese Patients Undergoing One-Anastomosis Gastric Bypass. Int. J. Environ. Res. Public Health 2020, 17, 5858. [Google Scholar] [CrossRef]
- Noakes, M.; Clifton, P.M. Weight loss and plasma lipids. Curr. Opin. Lipidol. 2000, 11, 65–70. [Google Scholar] [CrossRef]
- Grundy, S.M. Metabolic syndrome update. Trends Cardiovasc. Med. 2016, 26, 364–373. [Google Scholar] [CrossRef]
- Hasan, B.; Nayfeh, T.; Alzuabi, M.; Wang, Z.; Kuchkuntla, A.R.; Prokop, L.J.; Newman, C.B.; Murad, M.H.; Rajjo, T.I. Weight Loss and Serum Lipids in Overweight and Obese Adults: A Systematic Review and Meta-Analysis. J. Clin. Endocrinol. Metab. 2020, 105, 3695–3703. [Google Scholar] [CrossRef]
- Welty, F.K. How Do Elevated Triglycerides and Low HDL-Cholesterol Affect Inflammation and Atherothrombosis? Curr. Cardiol. Rep. 2013, 15, 400. [Google Scholar] [CrossRef]
- Kosmas, C.E.; Bousvarou, M.D.; Kostara, C.E.; Papakonstantinou, E.J.; Salamou, E.; Guzman, E. Insulin resistance and cardiovascular disease. J. Int. Med. Res. 2023, 51, 3000605231164548. [Google Scholar] [CrossRef]
- Wong, N.D.; Sattar, N. Cardiovascular risk in diabetes mellitus: Epidemiology, assessment and prevention. Nat. Rev. Cardiol. 2023, 20, 685–695. [Google Scholar] [CrossRef]
- Ormazabal, V.; Nair, S.; Elfeky, O.; Aguayo, C.; Salomon, C.; Zuñiga, F.A. Association between insulin resistance and the development of cardiovascular disease. Cardiovasc. Diabetol. 2018, 17, 122. [Google Scholar] [CrossRef]
- Grundy, S.M. Hypertriglyceridemia, insulin resistance, and the metabolic syndrome. Am. J. Cardiol. 1999, 83, 25F–29F. [Google Scholar] [CrossRef] [PubMed]
- Abbasi, F.; Kohli, P.; Reaven, G.M.; Knowles, J.W. Hypertriglyceridemia: A simple approach to identify insulin resistance and enhanced cardio-metabolic risk in patients with prediabetes. Diabetes Res. Clin. Pract. 2016, 120, 156–161. [Google Scholar] [CrossRef]
- Kraegen, E.W.; Cooney, G.J.; Ye, J.; Thompson, A.L. Triglycerides, fatty acids and insulin resistance–hyperinsulinemia. Exp. Clin. Endocrinol. Diabetes 2001, 109, S516–S526. [Google Scholar] [CrossRef] [PubMed]
- McLaughlin, T.; Abbasi, F.; Cheal, K.; Chu, J.; Lamendola, C.; Reaven, G. Use of metabolic markers to identify overweight individuals who are insulin resistant. Ann. Intern. Med. 2003, 139, 802–809. [Google Scholar] [CrossRef] [PubMed]
- Abbasian, M.; Delvarianzadeh, M.; Ebrahimi, H.; Khosravi, F. Lipid ratio as a suitable tool to identify individuals with MetS risk: A case- control study. Diabetes Metab. Syndr. 2017, 11 (Suppl. S1), S15–S19. [Google Scholar] [CrossRef]
- Shao, Q.-Y.; Ma, X.-T.; Yang, Z.-Q.; Li, Q.-X.; Wang, Y.-F.; Liang, J.; Shen, H.; Liu, X.-L.; Zhou, Y.-J.; Shi, D.-M.; et al. Prognostic significance of multiple triglycerides-derived metabolic indices in patients with acute coronary syndrome. J. Geriatr. Cardiol. 2022, 19, 456–468. [Google Scholar] [CrossRef] [PubMed]
- Wang, B.; Hua, J.; Ma, L. Triglyceride to High-Density Lipoprotein Ratio can predict coronary artery calcification. Pakistan J. Med. Sci. 2022, 38, 624–631. [Google Scholar] [CrossRef] [PubMed]
- Sato, F.; Nakamura, Y.; Kayaba, K.; Ishikawa, S. TG/HDL-C ratio as a predictor of stroke in the population with healthy BMI: The Jichi Medical School Cohort Study. Nutr. Metab. Cardiovasc. Dis. 2022, 32, 1872–1879. [Google Scholar] [CrossRef] [PubMed]
- Kosmas, C.E.; Rodriguez Polanco, S.; Bousvarou, M.D.; Papakonstantinou, E.J.; Peña Genao, E.; Guzman, E.; Kostara, C.E. The Triglyceride/High-Density Lipoprotein Cholesterol (TG/HDL-C) Ratio as a Risk Marker for Metabolic Syndrome and Cardiovascular Disease. Diagnostics 2023, 13, 929. [Google Scholar] [CrossRef] [PubMed]
- Zhao, Z.; Wang, H.; Hou, Q.; Zhou, Y.; Zhang, Y. Non-traditional lipid parameters as potential predictors of carotid plaque vulnerability and stenosis in patients with acute ischemic stroke. Neurol. Sci. 2023, 44, 835–843. [Google Scholar] [CrossRef] [PubMed]
- Nguyen, H.H.; Tran, H.H.; Nguyen, L.T.; Nguyen, T.; Nguyen, N.A.; Vi, M.T.; Nguyen, K.T. TG/HDL-C Ratio Is a Risk Factor Associated with CKD: Use in Assessing the Risk of Progression of CKD. Pathophysiology 2022, 29, 374–382. [Google Scholar] [CrossRef] [PubMed]
- Sultani, R.; Tong, D.C.; Peverelle, M.; Lee, Y.S.; Baradi, A.; Wilson, A.M. Elevated Triglycerides to High-Density Lipoprotein Cholesterol (TG/HDL-C) Ratio Predicts Long-Term Mortality in High-Risk Patients. Heart. Lung Circ. 2020, 29, 414–421. [Google Scholar] [CrossRef] [PubMed]
- Fechner, E.; Smeets, E.T.H.C.; Schrauwen, P.; Mensink, R.P. The Effects of Different Degrees of Carbohydrate Restriction and Carbohydrate Replacement on Cardiometabolic Risk Markers in Humans-A Systematic Review and Meta-Analysis. Nutrients 2020, 12, 991. [Google Scholar] [CrossRef]
- Song, S.; Lee, J.E. Dietary Patterns Related to Triglyceride and High-Density Lipoprotein Cholesterol and the Incidence of Type 2 Diabetes in Korean Men and Women. Nutrients 2018, 11, 8. [Google Scholar] [CrossRef]
- Ushula, T.W.; Mamun, A.; Darssan, D.; Wang, W.Y.S.; Williams, G.M.; Whiting, S.J.; Najman, J.M. Dietary patterns and the risk of abnormal blood lipids among young adults: A prospective cohort study. Nutr. Metab. Cardiovasc. Dis. 2022, 32, 1165–1174. [Google Scholar] [CrossRef]
- Zibaeenezhad, M.J.; Ghavipisheh, M.; Attar, A.; Aslani, A. Comparison of the effect of omega-3 supplements and fresh fish on lipid profile: A randomized, open-labeled trial. Nutr. Diabetes 2017, 7, 1. [Google Scholar] [CrossRef]
- Sacks, F.M.; Bray, G.A.; Carey, V.J.; Smith, S.R.; Ryan, D.H.; Anton, S.D.; McManus, K.; Champagne, C.M.; Bishop, L.M.; Laranjo, N.; et al. Comparison of weight-loss diets with different compositions of fat, protein, and carbohydrates. N. Engl. J. Med. 2009, 360, 859–873. [Google Scholar] [CrossRef]
- Kikuchi, T.; Kushiyama, A.; Yanai, M.; Kashiwado, C.; Seto, T.; Kasuga, M. Comparison of Weight Reduction, Change in Parameters and Safety of a Very Low Carbohydrate Diet in Comparison to a Low Carbohydrate Diet in Obese Japanese Subjects with Metabolic Disorders. Nutrients 2023, 15, 1342. [Google Scholar] [CrossRef]
- Ma, C.; Avenell, A.; Bolland, M.; Hudson, J.; Stewart, F.; Robertson, C.; Sharma, P.; Fraser, C.; MacLennan, G. Effects of weight loss interventions for adults who are obese on mortality, cardiovascular disease, and cancer: Systematic review and meta-analysis. BMJ 2017, 359, j4849. [Google Scholar] [CrossRef]
- Santos, J.; Salgado, P.; Santos, C.; Mendes, P.; Saavedra, J.; Baldaque, P.; Monteiro, L.; Costa, E. Effect of bariatric surgery on weight loss, inflammation, iron metabolism, and lipid profile. Scand. J. Surg. 2014, 103, 21–25. [Google Scholar] [CrossRef]
- Wang, W.; Fann, C.S.J.; Yang, S.-H.; Chen, H.-H.; Chen, C.-Y. Weight loss and metabolic improvements in obese patients undergoing gastric banding and gastric banded plication: A comparison. Nutrition 2019, 57, 290–299. [Google Scholar] [CrossRef] [PubMed]
- Unick, J.L.; Beavers, D.; Jakicic, J.M.; Kitabchi, A.E.; Knowler, W.C.; Wadden, T.A.; Wing, R.R.; Look AHEAD Research Group. Effectiveness of lifestyle interventions for individuals with severe obesity and type 2 diabetes: Results from the Look AHEAD trial. Diabetes Care 2011, 34, 2152–2157. [Google Scholar] [CrossRef] [PubMed]
- Ayisi Addo, S.; Nti, C.; Vuvor, F.; Adjimani, J.; Steiner-Asiedu, M. Impact of Successful Weight Loss Maintenance on Serum Lipids and Glucose Concentrations of Previous Participants of a Weight Loss Programme in Accra, Ghana. J. Nutr. Metab. 2019, 2019, 4729040. [Google Scholar] [CrossRef] [PubMed]
- R Core Team. R: A Language and Environment for Statistical Computing; R Foundation for Statistical Computing: Vienna, Austria, 2022. [Google Scholar]
- Kiriyama, H.; Kaneko, H.; Itoh, H.; Kamon, T.; Mizuno, Y.; Fujiu, K.; Morita, H.; Yamamichi, N.; Komuro, I. Association between changes in body weight and lipid profile in the general population: A community-based cohort study. Eur. Heart J. Qual. Care Clin. Outcomes 2021, 7, 109–110. [Google Scholar] [CrossRef]
- Park, B.; Jung, D.H.; Lee, H.S.; Lee, Y.J. Triglyceride to HDL-Cholesterol Ratio and the Incident Risk of Ischemic Heart Disease Among Koreans Without Diabetes: A Longitudinal Study Using National Health Insurance Data. Front. Cardiovasc. Med. 2021, 8, 716698. [Google Scholar] [CrossRef] [PubMed]
- Martínez-Marroquín, Y.; Meaney, A.; Samaniego-Méndez, V.; Nájera, N.; Ceballos, G.; Fernández-Barros, C.; Meaney, E. The TG/HDL-c Lipid Ratio as a Cardiovascular Risk Marker in a Mexican Urban Middle-Class Population: Do We Need a Risk Score Tailored for Mexicans? J. Clin. Med. 2023, 12, 6005. [Google Scholar] [CrossRef] [PubMed]
- Mesut, E.; Cihan, A.; Orhan, G. Is it possible to predict the complexity of peripheral artery disease with atherogenic index? Vascular 2020, 28, 513–519. [Google Scholar] [CrossRef] [PubMed]
- Gu, X.; Li, Y.; Chen, S.; Yang, X.; Liu, F.; Li, Y.; Li, J.; Cao, J.; Liu, X.; Chen, J.; et al. Association of Lipids with Ischemic and Hemorrhagic Stroke: A Prospective Cohort Study among 267,500 Chinese. Stroke 2019, 50, 3376–3384. [Google Scholar] [CrossRef] [PubMed]
- Baba, M.; Maris, M.; Jianu, D.; Luca, C.T.; Stoian, D.; Mozos, I. The Impact of the Blood Lipids Levels on Arterial Stiffness. J. Cardiovasc. Dev. Dis. 2023, 10, 127. [Google Scholar] [CrossRef] [PubMed]
- Edwards, M.K.; Blaha, M.J.; Loprinzi, P.D. Atherogenic Index of Plasma and Triglyceride/High-Density Lipoprotein Cholesterol Ratio Predict Mortality Risk Better than Individual Cholesterol Risk Factors, among an Older Adult Population. Mayo Clin. Proc. 2017, 92, 680–681. [Google Scholar] [CrossRef] [PubMed]
- da Luz, P.L.; Favarato, D.; Faria-Neto, J.R.; Lemos, P.; Chagas, A.C.P. High ratio of triglycerides to HDL-cholesterol predicts extensive coronary disease. Clinics 2008, 63, 427–432. [Google Scholar] [CrossRef]
- Dhindsa, D.S.; Sandesara, P.B.; Shapiro, M.D.; Wong, N.D. The Evolving Understanding and Approach to Residual Cardiovascular Risk Management. Front. Cardiovasc. Med. 2020, 7, 88. [Google Scholar] [CrossRef]
- Borrayo, G.; Basurto, L.; González-Escudero, E.; Diaz, A.; Vázquez, A.; Sánchez, L.; Hernández-González, G.O.; Barrera, S.; Degollado, J.A.; Córdova, N.; et al. Tg/Hdl-C Ratio as Cardio-Metabolic Biomarker even in Normal Weight Women. Acta Endocrinol. 2018, 14, 261–267. [Google Scholar] [CrossRef]
- McLaughlin, T.; Reaven, G.; Abbasi, F.; Lamendola, C.; Saad, M.; Waters, D.; Simon, J.; Krauss, R.M. Is there a simple way to identify insulin-resistant individuals at increased risk of cardiovascular disease? Am. J. Cardiol. 2005, 96, 399–404. [Google Scholar] [CrossRef]
- Salazar, M.R.; Carbajal, H.A.; Espeche, W.G.; Leiva Sisnieguez, C.E.; Balbín, E.; Dulbecco, C.A.; Aizpurúa, M.; Marillet, A.G.; Reaven, G.M. Relation among the plasma triglyceride/high-density lipoprotein cholesterol concentration ratio, insulin resistance, and associated cardio-metabolic risk factors in men and women. Am. J. Cardiol. 2012, 109, 1749–1753. [Google Scholar] [CrossRef] [PubMed]
- Li, C.; Ford, E.S.; Meng, Y.-X.; Mokdad, A.H.; Reaven, G.M. Does the association of the triglyceride to high-density lipoprotein cholesterol ratio with fasting serum insulin differ by race/ethnicity? Cardiovasc. Diabetol. 2008, 7, 4. [Google Scholar] [CrossRef] [PubMed]
- Vega, G.L.; Barlow, C.E.; Grundy, S.M.; Leonard, D.; DeFina, L.F. Triglyceride-to-high-density-lipoprotein-cholesterol ratio is an index of heart disease mortality and of incidence of type 2 diabetes mellitus in men. J. Investig. Med. 2014, 62, 345–349. [Google Scholar] [CrossRef] [PubMed]
- Hansen, C.D.; Gram-Kampmann, E.-M.; Hansen, J.K.; Hugger, M.B.; Madsen, B.S.; Jensen, J.M.; Olesen, S.; Torp, N.; Rasmussen, D.N.; Kjærgaard, M.; et al. Effect of Calorie-Unrestricted Low-Carbohydrate, High-Fat Diet Versus High-Carbohydrate, Low-Fat Diet on Type 2 Diabetes and Nonalcoholic Fatty Liver Disease: A Randomized Controlled Trial. Ann. Intern. Med. 2023, 176, 10–21. [Google Scholar] [CrossRef]


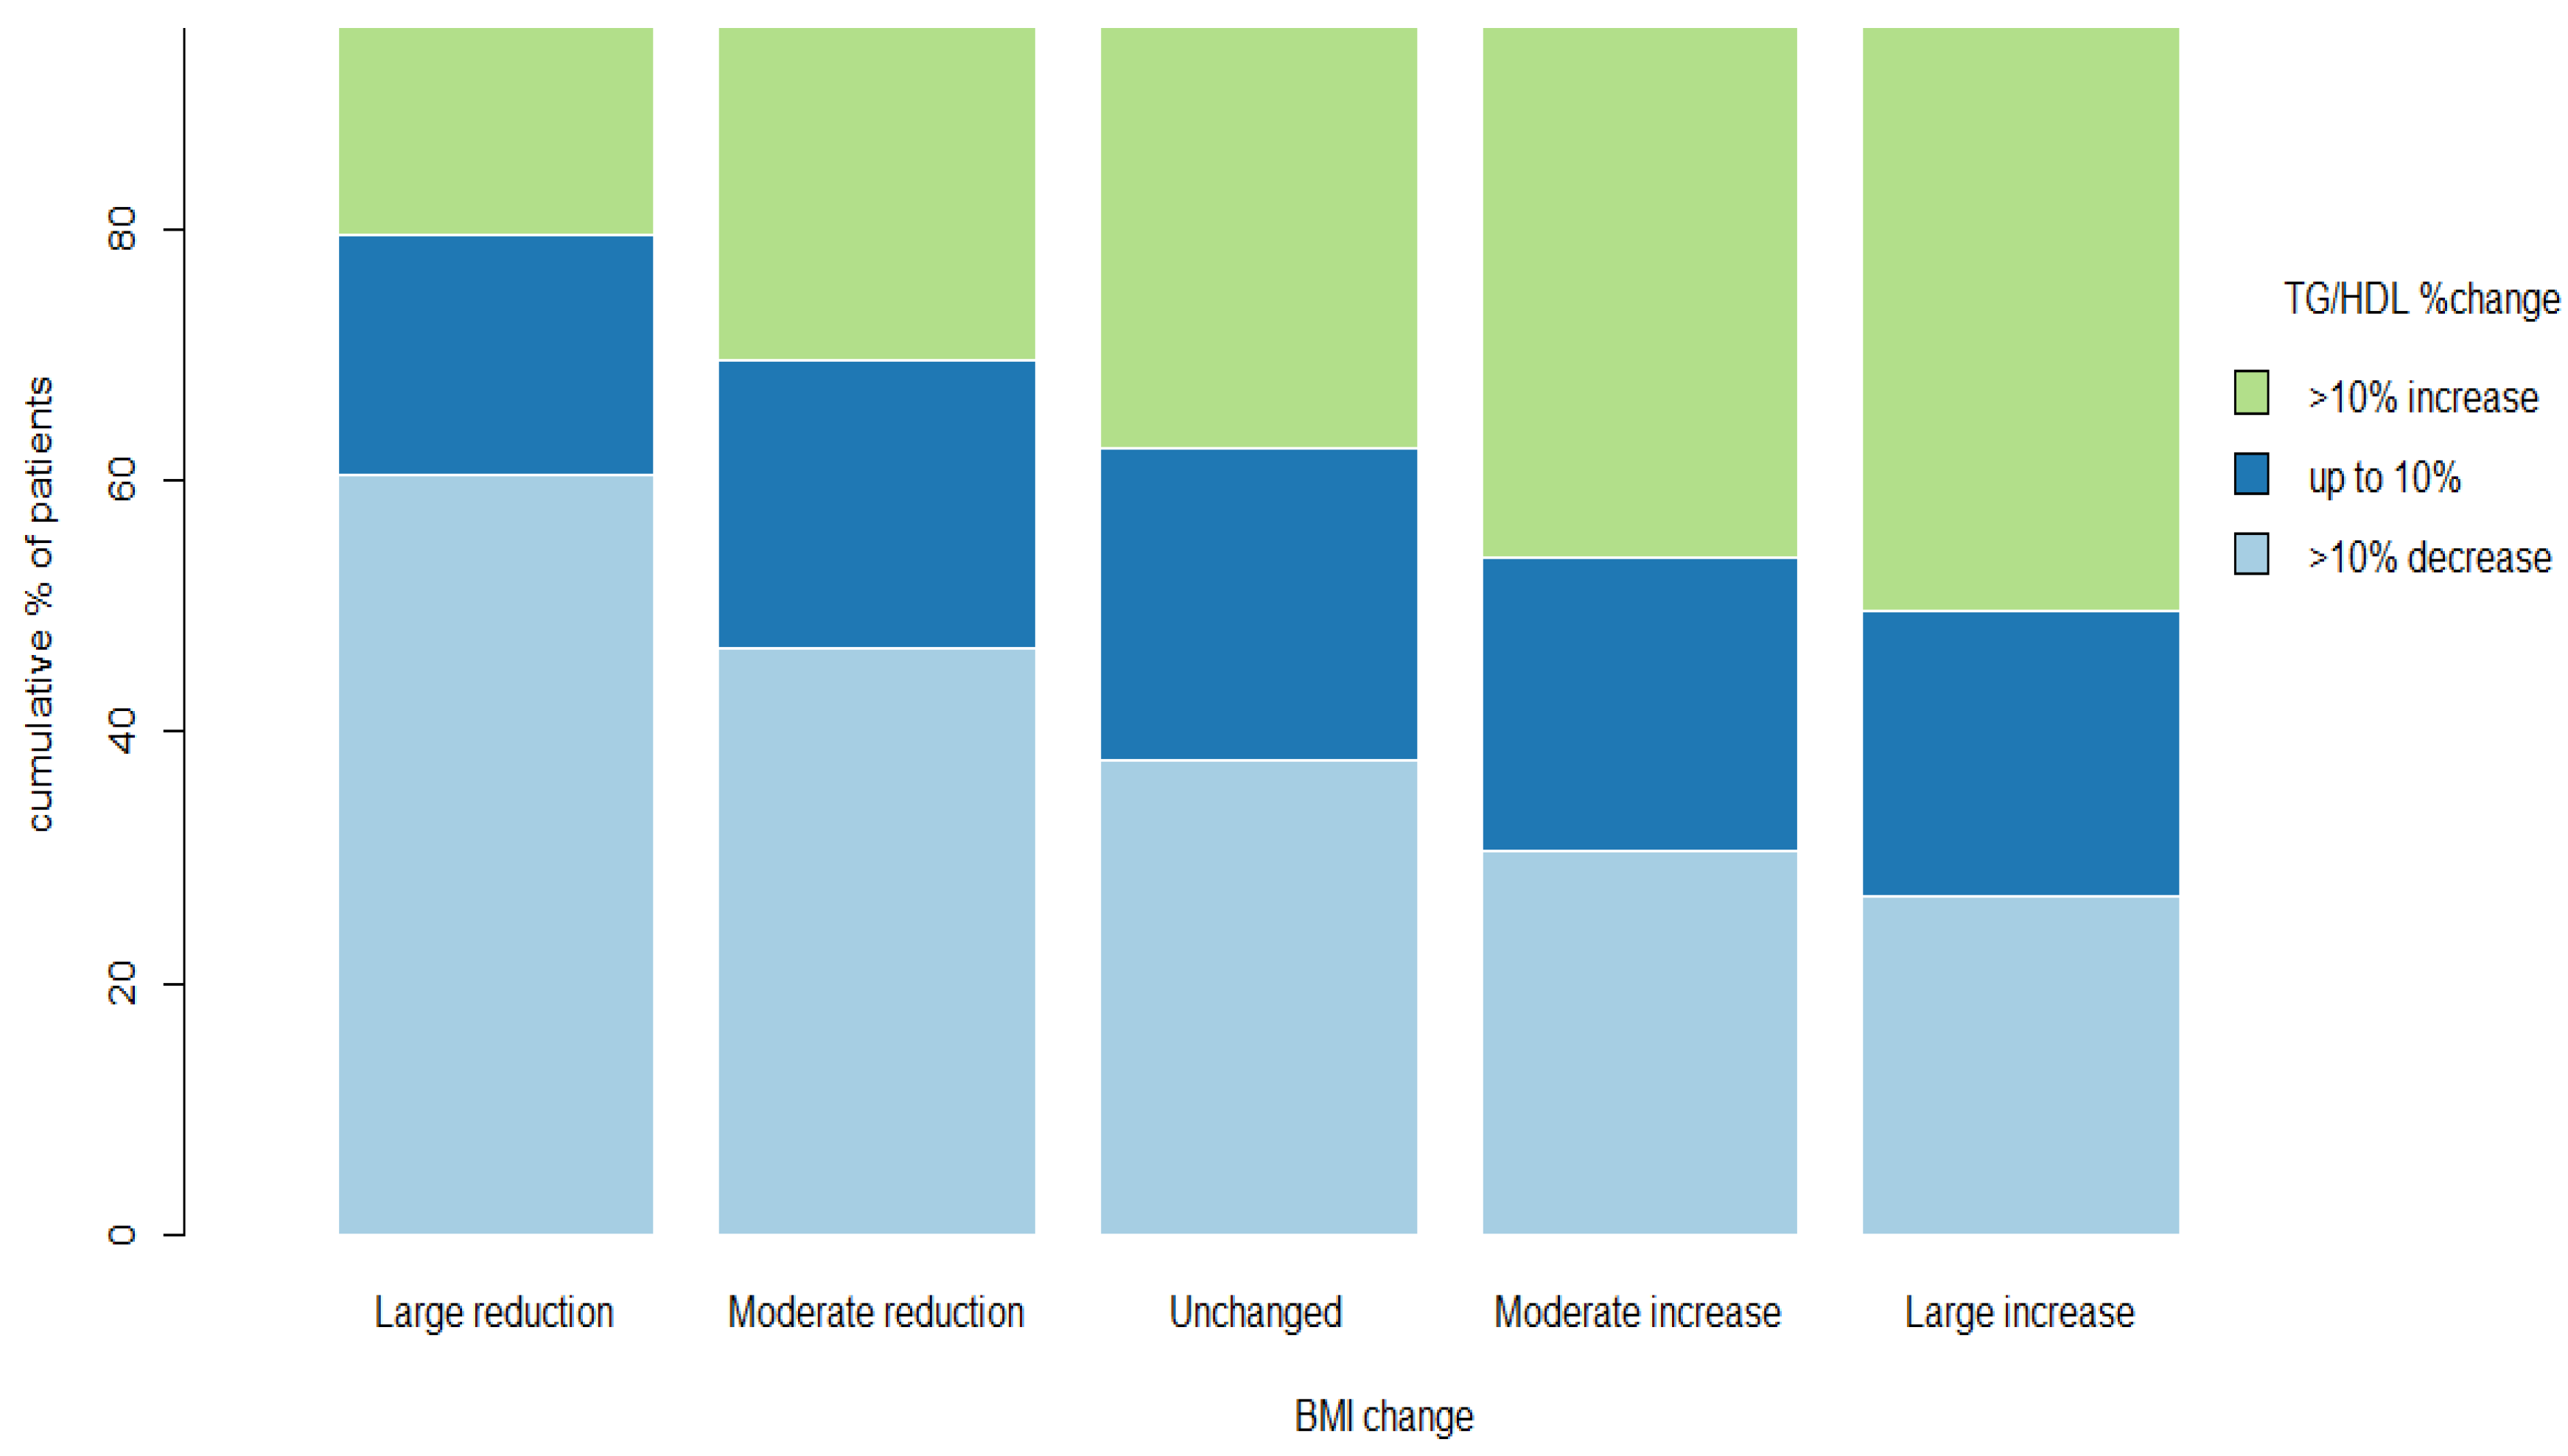
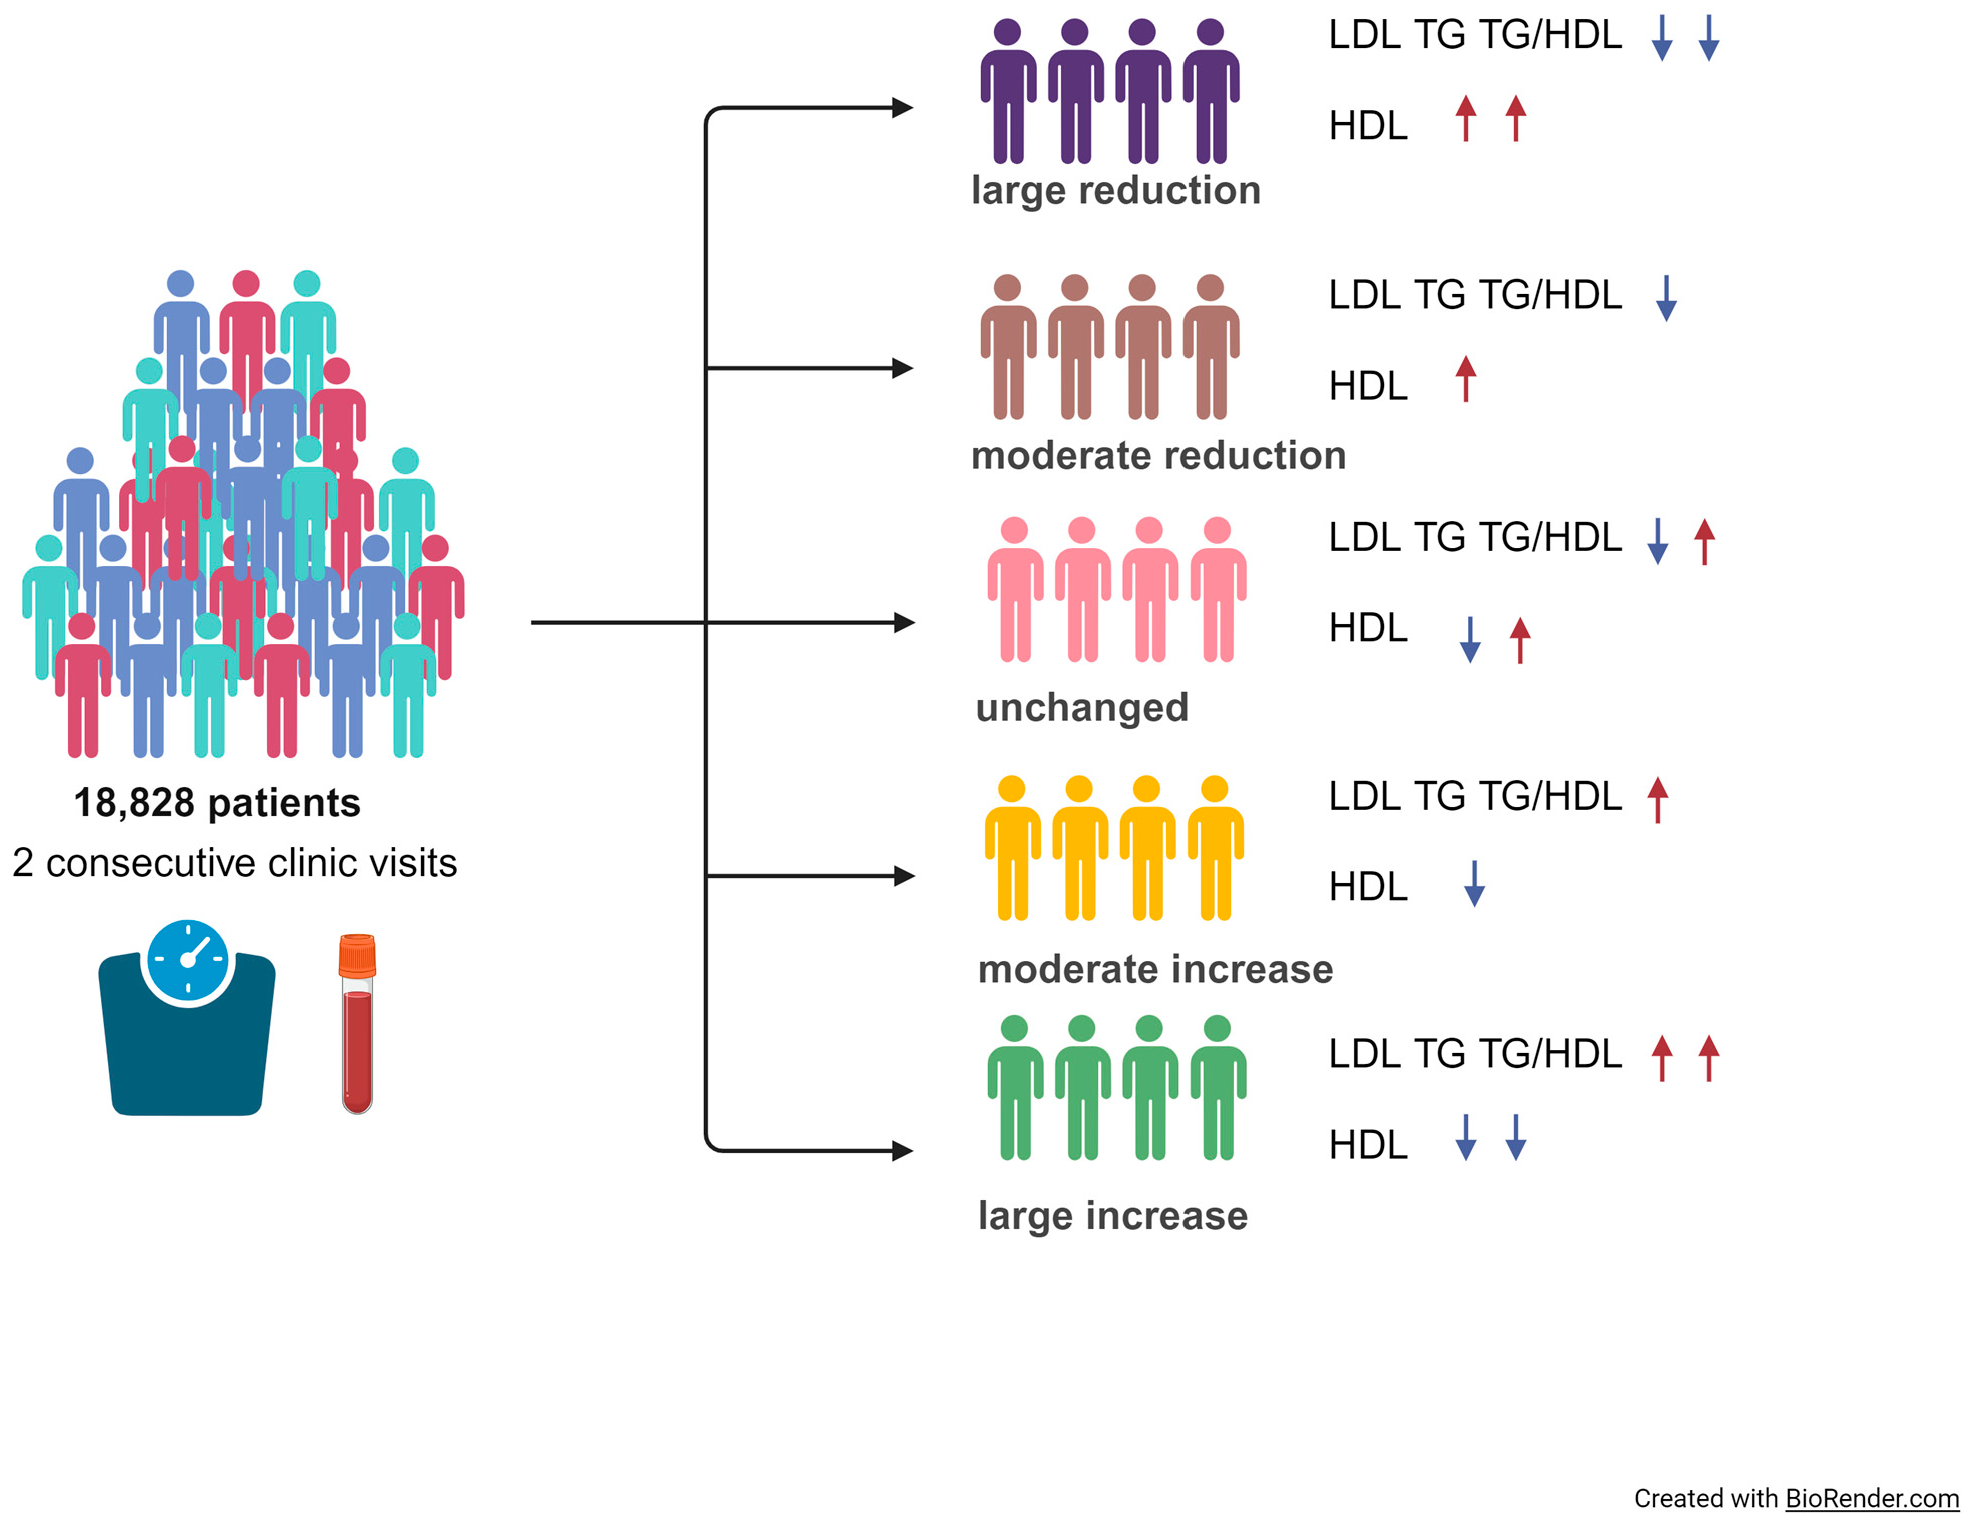
| Large Reduction | Moderate Reduction | Unchanged | Moderate Increase | Large Increase | Total | p Value | |
|---|---|---|---|---|---|---|---|
| (N = 1754) | (N = 2163) | (N = 10,524) | (N = 2664) | (N = 1723) | (N = 18,828) | ||
| Gender | <0.001 | ||||||
| Males | 1169 (67%) | 1592 (74%) | 7852 (75%) | 1944 (73%) | 1075 (62%) | 13,632 (72%) | |
| Females | 585 (33%) | 571 (26%) | 2672 (25%) | 720 (27%) | 648 (38%) | 5196 (28%) | |
| Age (years) | <0.001 | ||||||
| Mean (SD) | 48.9 (±10.3) | 50.4 (±10.7) | 50.0 (±10.3) | 49.2 (±10.4) | 48.1 (±9.9) | 49.7 (±10.4) | |
| 1st visit BMI (kg/m2) | <0.001 | ||||||
| Mean (SD) | 27.9 (±4.5) | 26.4 (±3.6) | 25.8 (±3.7) | 25.6 (±3.8) | 25.3 (±4.0) | 26.0 (±3.8) | |
| BMI categories | <0.001 | ||||||
| <18.5 | 5 (0%) | 9 (0%) | 109 (1%) | 19 (1%) | 30 (2%) | 172 (1%) | |
| 18.5–25 | 452 (26%) | 788 (36%) | 4547 (43%) | 1308 (49%) | 843 (49%) | 7938 (42%) | |
| 25–30 | 832 (47%) | 1045 (48%) | 4633 (44%) | 1020 (38%) | 653 (38%) | 8183 (43%) | |
| >30 | 465 (27%) | 321 (15%) | 1235 (12%) | 317 (12%) | 197 (11%) | 2535 (13%) | |
| IHD | 200 (11%) | 266 (12%) | 1251 (12%) | 285 (11%) | 166 (10%) | 2168 (12%) | 0.0331 |
| SBP (mm Hg) | <0.001 | ||||||
| Mean (SD) | 125.9 (±18.4) | 124.7 (±17.7) | 124.2 (±17.3) | 122.9 (±16.7) | 121.4 (±16.6) | 124.0 (±17.3) | |
| DBP (mm Hg) | <0.001 | ||||||
| Mean (SD) | 79.1 (±11.1) | 78.1 (±10.4) | 77.7 (±10.4) | 77.3 (±10.2) | 76.3 (±10.5) | 77.7 (±10.5) | |
| HTN | 501 (29%) | 667 (31%) | 3048 (29%) | 725 (27%) | 489 (28%) | 5430 (29%) | 0.0934 |
| DM | 182 (10%) | 220 (10%) | 981 (9%) | 256 (10%) | 150 (9%) | 1789 (10%) | 0.356 |
| Large Reduction | Moderate Reduction | Unchanged | Moderate Increase | Large Increase | Total | p Value | |
|---|---|---|---|---|---|---|---|
| (N = 1754) | (N = 2163) | (N = 10,524) | (N = 2664) | (N = 1723) | (N = 18,828) | ||
| 1st visit BMI (kg/m2) | <0.001 | ||||||
| Mean (SD) | 27.9 (±4.5) | 26.4 (±3.6) | 25.8 (±3.7) | 25.5 (±3.8) | 25.3 (±4.0) | 26.0 (±3.8) | |
| 2nd visit BMI (kg/m2) | <0.001 | ||||||
| Mean (SD) | 25.4 (±3.8) | 25.4 (±3.5) | 25.8 (±3.7) | 26.5 (±3.9) | 27.3 (±4.4) | 25.9 (±3.8) | |
| %BMI change | <0.001 | ||||||
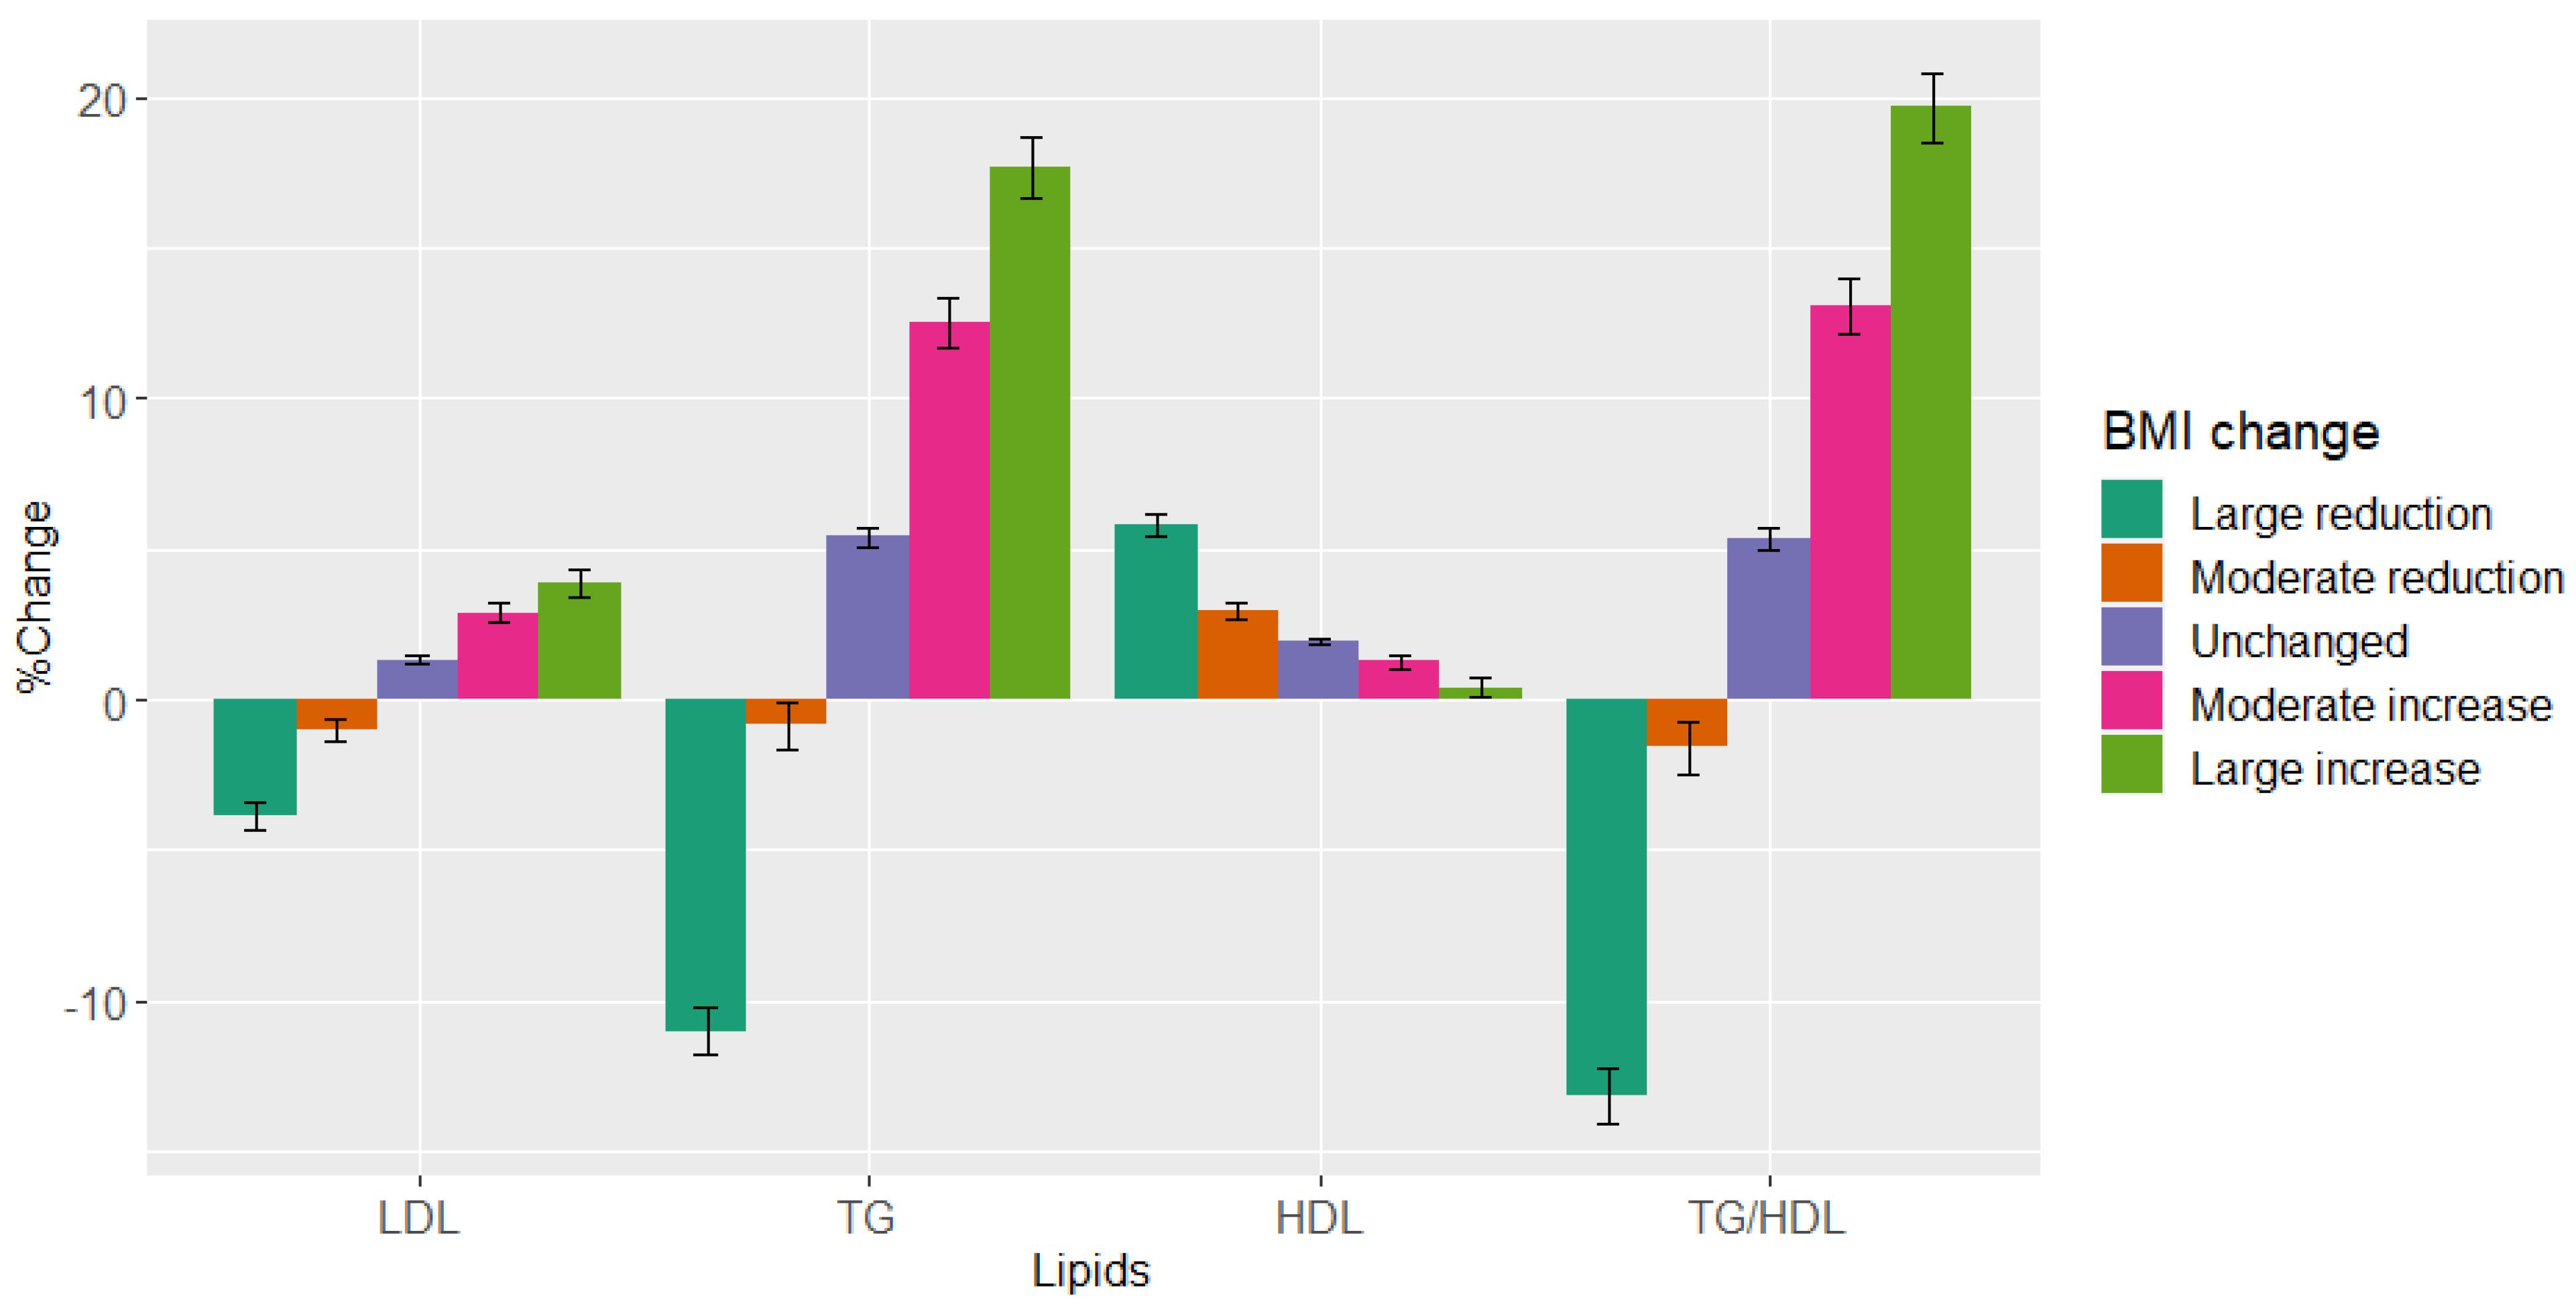
| Mean (SD) | −8.6 (±4.2) | −3.6 (±0.7) | 0.1 (±1.3) | 3.6 (±0.7) | 8.0 (±4.7) | 0.1 (±4.5) | |
| 1st visit LDL (mg/dL) | <0.001 | ||||||
| Mean (SD) | 123.5 (±30.0) | 122.4 (±28.2) | 121.5 (±28.2) | 120.0 (±27.1) | 120.4 (±29.4) | 121.5 (±28.4) | |
| 2nd visit LDL (mg/dL) | <0.001 | ||||||
| Mean (SD) | 116.5 (±28.8) | 119.4 (±28.1) | 121.3 (±28.0) | 121.7 (±27.2) | 122.8 (±29.1) | 120.8 (±28.1) | |
| %LDL change | <0.001 | ||||||
| Mean (SD) | −3.8 (±20.1) | −1.0 (±17.3) | 1.3 (±17.4) | 2.9 (±17.0) | 3.9 (±18.6) | 1.0 (±17.8) | |
| 1st visit HDL (mg/dL) | <0.001 | ||||||
| Mean (SD) | 47.1 (±12.3) | 47.3 (±12.0) | 48.2 (±12.5) | 48.3 (±12.0) | 49.9 (±13.4) | 48.2 (±12.4) | |
| 2nd visit HDL (mg/dL) | 0.0046 | ||||||
| Mean (SD) | 49.3 (±12.6) | 48.3 (±11.9) | 48.7 (±12.3) | 48.5 (±11.8) | 49.6 (±13.0) | 48.8 (±12.3) | |
| %HDL change | <0.001 | ||||||
| Mean (SD) | 5.8 (±15.4) | 3.0 (±12.8) | 1.9 (±12.3) | 1.3 (±12.3) | 0.4 (±13.2) | 2.2 (±12.8) | |
| 1st visit TG (mg/dL) | <0.001 | ||||||
| Mean (SD) | 135.1 (±71.1) | 130.0 (±67.5) | 124.3 (±62.9) | 118.9 (±59.4) | 115.8 (±59.4) | 124.4 (±63.7) | |
| 2nd visit TG (mg/dL) | <0.001 | ||||||
| Mean (SD) | 111.0 (±57.0) | 120.3 (±60.1) | 124.9 (±63.3) | 127.6 (±65.4) | 129.9 (±68.5) | 123.9 (±63.4) | |
| %TG change | <0.001 | ||||||
| Mean (SD) | −11.0 (±32.6) | −0.8 (±36.6) | 5.4 (±33.7) | 12.5 (±44.2) | 17.7 (±42.7) | 5.3 (±37.2) | |
| 1st visit TG/HDL-C ratio | <0.001 | ||||||
| Mean (SD) | 3.2 (±2.2) | 3.1 (±2.1) | 2.9 (±1.9) | 2.7 (±1.8) | 2.6 (±1.8) | 2.9 (±2.0) | |
| 2nd visit TG/HDL-C ratio | <0.001 | ||||||
| Mean (SD) | 2.5 (±1.7) | 2.8 (±1.8) | 2.9 (±1.9) | 2.9 (±1.9) | 2.9 (±2.0) | 2.8 (±1.9) | |
| TG_HDL_ratio_change | <0.001 | ||||||
| Mean (SD) | −13.2 (±37.8) | −1.6 (±40.5) | 5.3 (±37.9) | 13.0 (±47.8) | 19.7 (±47.9) | 5.2 (±41.5) |
Disclaimer/Publisher’s Note: The statements, opinions and data contained in all publications are solely those of the individual author(s) and contributor(s) and not of MDPI and/or the editor(s). MDPI and/or the editor(s) disclaim responsibility for any injury to people or property resulting from any ideas, methods, instructions or products referred to in the content. |
© 2024 by the authors. Licensee MDPI, Basel, Switzerland. This article is an open access article distributed under the terms and conditions of the Creative Commons Attribution (CC BY) license (https://creativecommons.org/licenses/by/4.0/).
Share and Cite
Weinstein, S.; Maor, E.; Kaplan, A.; Hod, T.; Leibowitz, A.; Grossman, E.; Shlomai, G. Non-Interventional Weight Changes Are Associated with Alterations in Lipid Profiles and in the Triglyceride-to-HDL Cholesterol Ratio. Nutrients 2024, 16, 486. https://doi.org/10.3390/nu16040486
Weinstein S, Maor E, Kaplan A, Hod T, Leibowitz A, Grossman E, Shlomai G. Non-Interventional Weight Changes Are Associated with Alterations in Lipid Profiles and in the Triglyceride-to-HDL Cholesterol Ratio. Nutrients. 2024; 16(4):486. https://doi.org/10.3390/nu16040486
Chicago/Turabian StyleWeinstein, Shiri, Elad Maor, Alon Kaplan, Tammy Hod, Avshalom Leibowitz, Ehud Grossman, and Gadi Shlomai. 2024. "Non-Interventional Weight Changes Are Associated with Alterations in Lipid Profiles and in the Triglyceride-to-HDL Cholesterol Ratio" Nutrients 16, no. 4: 486. https://doi.org/10.3390/nu16040486
APA StyleWeinstein, S., Maor, E., Kaplan, A., Hod, T., Leibowitz, A., Grossman, E., & Shlomai, G. (2024). Non-Interventional Weight Changes Are Associated with Alterations in Lipid Profiles and in the Triglyceride-to-HDL Cholesterol Ratio. Nutrients, 16(4), 486. https://doi.org/10.3390/nu16040486