
Factors Associated with Anemia and Iron Deficiency during Pregnancy: A Prospective Observational Study in Japan

 , , , , ,
Abstract
1. Introduction
2. Materials and Methods
2.1. Study Design and Study Population
2.2. Definition of Categories
2.2.1. Categories of Serum Iron Status
2.2.2. Prescription of Iron Supplements and Dietary Iron Supplements Use
2.3. Data Collection
2.3.1. Participants’ Characteristics and Neonatal Outcomes
2.3.2. Blood Sampling and Biomarkers
2.3.3. Nutrient Intake
2.4. Statistical Analysis
3. Results
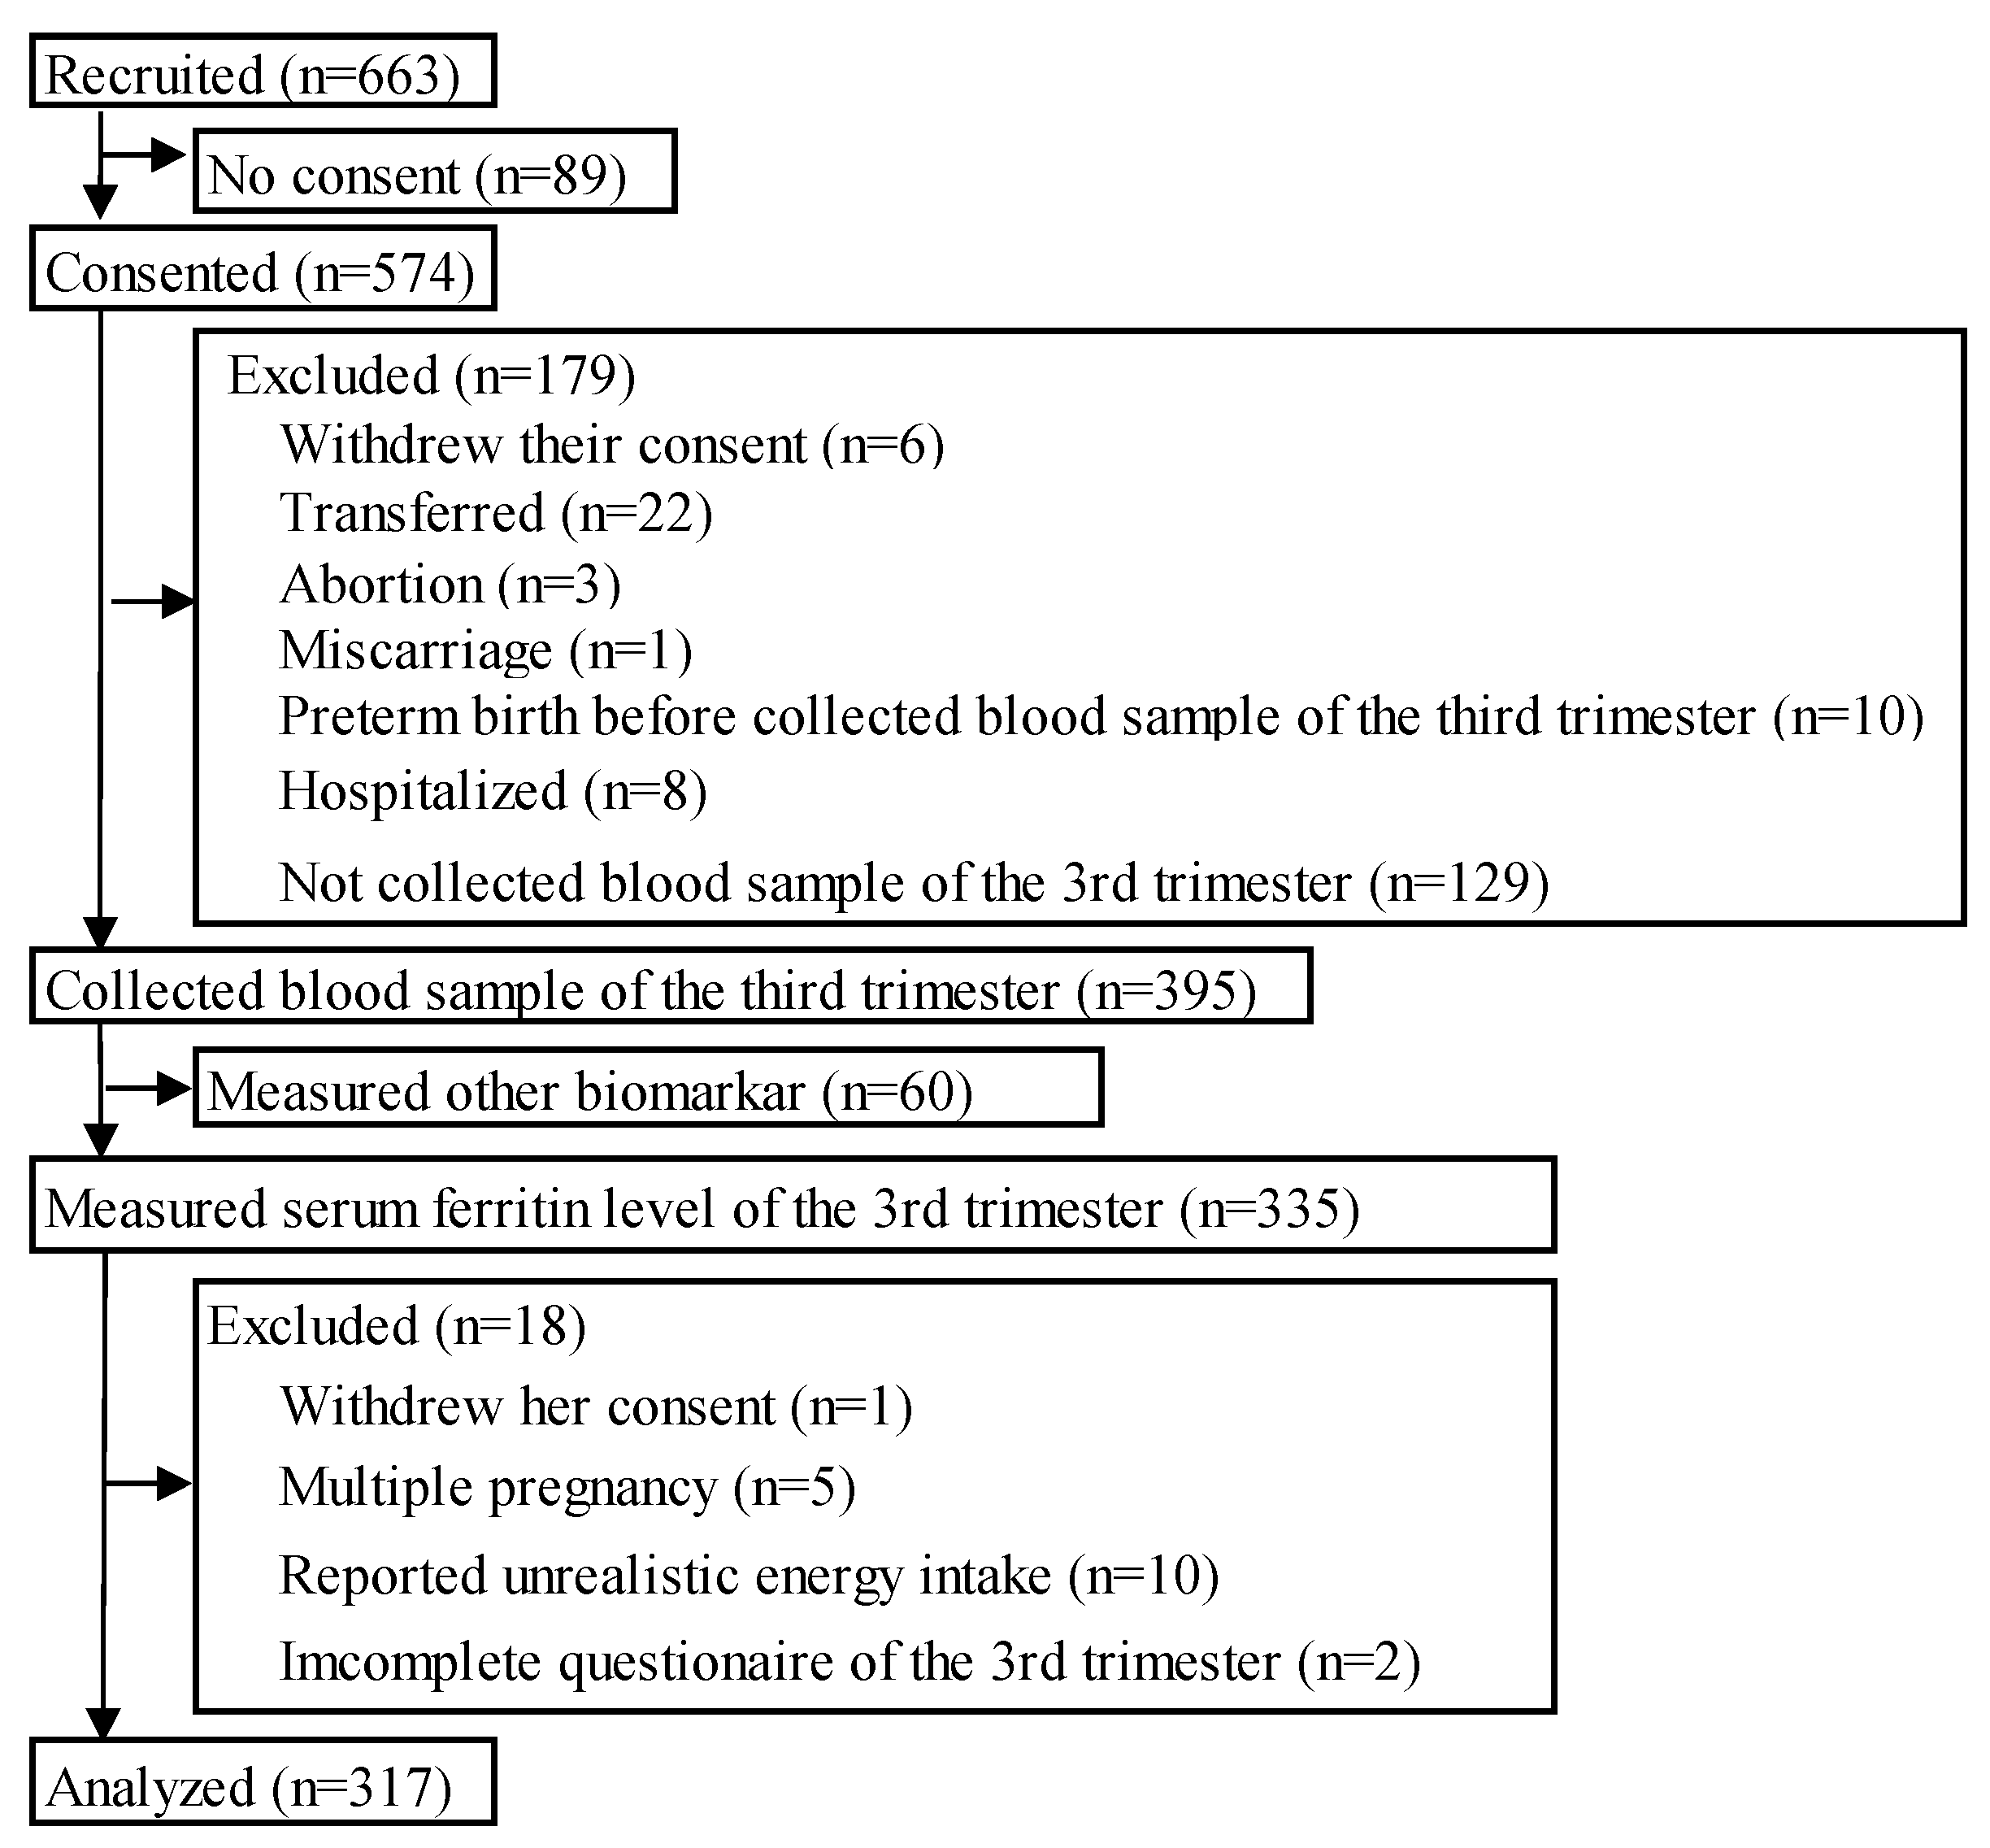
3.1. Participants
3.2. Biomarkers of the Participants
3.3. Characteristics of the Participants
3.4. Prescribed Iron Supplements and Dietary Supplements Use
3.5. Neonatal Outcomes
3.6. Nutrient Intake among the GA, NAID, and Normal Groups
3.7. Nutrient Intake of Primipara and Multipara among the GA, NAID, and Normal Groups
4. Discussion
4.1. Key Results
4.2. Maternal Characteristics and Neonatal Outcomes
4.3. Prescribed/Dietary Iron Supplements Use and Biomarkers
4.4. Nutrient Intake and Biomarkers
4.5. Limitations and Strengths
5. Conclusions
Author Contributions
Funding
Institutional Review Board Statement
Informed Consent Statement
Data Availability Statement
Acknowledgments
Conflicts of Interest
References
- World Health Organization. Prevalence of Anemia in Pregnant Women. Available online: https://www.who.int/data/gho/data/indicators/indicator-details/GHO/prevalence-of-anaemia-in-pregnant-women-(-) (accessed on 22 December 2023).
- Young, M.F.; Oaks, B.M.; Rogers, H.P.; Tandon, S.; Martorell, R.; Dewey, K.G.; Wendt, A.S. Maternal Low and High Hemoglobin Concentrations and Associations with Adverse Maternal and Infant Health Outcomes: An Updated Global Systematic Review and Meta-Analysis. BMC Pregnancy Childbirth 2023, 23, 264. [Google Scholar] [CrossRef]
- Kang, S.Y.; Kim, H.B.; Sunwoo, S. Association between Anemia and Maternal Depression: A Systematic Review and Meta-Analysis. J. Psychiatr. Res. 2020, 122, 88–96. [Google Scholar] [CrossRef] [PubMed]
- Benson, A.E.; Shatzel, J.J.; Ryan, K.S.; Hedges, M.A.; Martens, K.; Aslan, J.E.; Lo, J.O. The Incidence, Complications, and Treatment of Iron Deficiency in Pregnancy. Eur. J. Haematol. 2022, 109, 633–642. [Google Scholar] [CrossRef]
- Daru, J.; Allotey, J.; Peña-Rosas, J.P.; Khan, K.S. Serum Ferritin Thresholds for the Diagnosis of Iron Deficiency in Pregnancy: A Systematic Review. Transfus. Med. 2017, 27, 167–174. [Google Scholar] [CrossRef] [PubMed]
- Pratt, J.J.; Khan, K.S. Non-Anaemic Iron Deficiency—A Disease Looking for Recognition of Diagnosis: A Systematic Review. Eur. J. Haematol. 2016, 96, 618–628. [Google Scholar] [CrossRef]
- The Japanese BioIron Society Guidelines for the Treatment of Anemia with Appropriate Use of Iron Drugs, Revised, 3rd Ed. Available online: https://jbis.bio/wp-content/uploads/pdf/zyouzaiv3.pdf (accessed on 22 December 2023).
- Peña-Rosas, J.P.; De-Regil, L.M.; Malave, H.G.; Flores-Urrutia, M.C.; Dowswell, T. Intermittent Oral Iron Supplementation during Pregnancy. Cochrane Database Syst. Rev. 2015, 2015, CD009997. [Google Scholar] [CrossRef]
- The Japanese Society of Obstetrics and Gynecology; The Japanese Society of Obstetricians and Gynecologists. Guidelines for Obstetrics and Gynecology; The Japanese Society of Obstetrics and Gynecology: Tokyo, Japan; The Japanese Society of Obstetricians and Gynecologists: Tokyo, Japan, 2023. [Google Scholar]
- Kangalgil, M.; Sahinler, A.; Kırkbir, I.B.; Ozcelik, A.O. Associations of Maternal Characteristics and Dietary Factors with Anemia and Iron-Deficiency in Pregnancy. J. Gynecol. Obstet. Hum. Reprod. 2021, 50, 102137. [Google Scholar] [CrossRef]
- Akase, T.; Hihara, E.; Uematsu, K.; Kodaka, M.; Akase, T.; Tashiro, S. Single Center Survey of the Relationship between Pregnancy Anemia and Prepregnancy Lifestyle. J. Pharm. Soc. Jpn. 2008, 128, 1081–1086. [Google Scholar] [CrossRef] [PubMed][Green Version]
- Zimmermann, M.B.; Hurrell, R.F. Nutritional Iron Deficiency. Lancet 2007, 370, 511–520. [Google Scholar] [CrossRef]
- Mayasari, N.R.; Bai, C.H.; Chao, J.C.J.; Chen, Y.C.; Huang, Y.L.; Wang, F.F.; Wiratama, B.S.; Chang, J.S. Relationships between Dietary Patterns and Erythropoiesis-Associated Micronutrient Deficiencies (Iron, Folate, and Vitamin B12) among Pregnant Women in Taiwan. Nutrients 2023, 15, 2311. [Google Scholar] [CrossRef]
- Ministry of Health, Labour and Welfare. National Health and Nutrition Survey. Available online: https://www.mhlw.go.jp/stf/seisakunitsuite/bunya/kenkou_iryou/kenkou/eiyou/r1-houkoku_00002.html (accessed on 22 December 2023).
- National Institute of Health and Nutrition. The Current State of National Nutrition. Available online: https://www.nibiohn.go.jp/eiken/chosa/kokumin_eiyou/ (accessed on 22 December 2023).
- Di Maso, M.; Eussen, S.R.B.M.; Bravi, F.; Moro, G.E.; Agostoni, C.; Tonetto, P.; Quitadamo, P.A.; Salvatori, G.; Profeti, C.; Kazmierska, I.; et al. Dietary Intake of Breastfeeding Mothers in Developed Countries: A Systematic Review and Results of the MEDIDIET Study. J. Nutr. 2021, 151, 3459–3482. [Google Scholar] [CrossRef]
- Crozier, S.R.; Inskip, H.M.; Godfrey, K.M.; Robinson, S.M. Dietary Patterns in Pregnant Women: A Comparison of Food-Frequency Questionnaires and 4d Prospective Diaries. Br. J. Nutr. 2008, 99, 869–875. [Google Scholar] [CrossRef] [PubMed]
- World Health Organization. Prevalence of Anaemia in Women of Reproductive Age (Aged 15–49) (%). Available online: https://www.who.int/data/gho/data/indicators/indicator-details/GHO/prevalence-of-anaemia-in-women-of-reproductive-age-(-) (accessed on 18 January 2024).
- Birth Cohorts Japan J-Peach Study: The Japan, Pregnancy, Eating, and Activity, Cohort Study. Available online: https://j-birthcohorts.net/cohorts/jpeach-study/ (accessed on 22 December 2023).
- Matsuzaki, M.; Haruna, M.; Ota, E.; Yeo, S.; Murayama, R.; Murashima, S. Translation and cross-cultural adaptation of the Pregnancy Physical Activity Questionnaire (PPAQ) to Japanese. Biosci. Trends 2010, 4, 170–177. [Google Scholar]
- Chasan-Taber, L.; Schmidt, M.D.; Roberts, D.E.; Hosmer, D.; Markenson, G.; Freedson, P.S. Development and Validation of a Pregnancy Physical Activity Questionnaire. Med. Sci. Sports Exerc. 2004, 36, 1750–1760. [Google Scholar] [CrossRef] [PubMed]
- Chasan-Taber, L.; Park, S.; Marcotte, R.T.; Staudenmayer, J.; Strath, S.; Freedson, P. Update and Novel Validation of a Pregnancy Physical Activity Questionnaire. Am. J. Epidemiol. 2023, 192, 1743–1753. [Google Scholar] [CrossRef]
- Matsuzaki, M.; Haruna, M.; Nakayama, K.; Shiraishi, M.; Ota, E.; Murayama, R.; Murashima, S.; Yeo, S. Adapting the Pregnancy Physical Activity Questionnaire for Japanese Pregnant Women. JOGNN J. Obstet. Gynecol. Neonatal Nurs. 2014, 43, 107–116. [Google Scholar] [CrossRef]
- Shiraishi, M.; Haruna, M.; Matsuzaki, M.; Murayama, R.; Sasaki, S.; Murashima, S. Validity and reproducibility of folate and vitamin B(12) intakes estimated from a self-administered diet history questionnaire in Japanese pregnant women. Nutr. J. 2012, 11, 15. [Google Scholar] [CrossRef]
- Japan Ministry of Education, Culture, Sports, Science and Technology. (MEXT) STANDARD TABLES OF FOOD COMPOSITION IN JAPAN (Seventh Revision). Available online: https://www.mext.go.jp/en/policy/science_technology/policy/title01/detail01/1374030.htm (accessed on 22 December 2023).
- Kurokawa, H.; Kurokawa, M. Mikiko Ito Effects of Iron Intake and Hemoglobin Concentration on Pregnant Women on Birth Weight of Infants. Trace Nutr. Res. 2020, 37, 12–18. [Google Scholar]
- Ministry of Health, Labor and Welfare. Dietary Reference Intakes for Japanese (2020). Available online: https://www.mhlw.go.jp/stf/newpage_08517.html (accessed on 27 November 2023).
- Kikuchi-Noguchi, H.; Shiraishi, M.; Matsuzaki, M.; Haruna, M. Physical Activity Levels in the Second Trimester of Pregnancy and Related Demographic Factors: A Cross-Sectional Secondary Data Analysis. Cogent Med. 2019, 6, 1704607. [Google Scholar] [CrossRef]
- Stråvik, M.; Jonsson, K.; Hartvigsson, O.; Sandin, A.; Wold, A.E.; Sandberg, A.S.; Barman, M. Food and Nutrient Intake during Pregnancy in Relation to Maternal Characteristics: Results from the Nice Birth Cohort in Northern Sweden. Nutrients 2019, 11, 1680. [Google Scholar] [CrossRef]
- Faul, F.; Erdfelder, E.; Lang, A.G.; Buchner, A. G*Power 3: A Flexible Statistical Power Analysis Program for the Social, Behavioral, and Biomedical Sciences. Behav. Res. Methods 2007, 39, 175–191. [Google Scholar] [CrossRef]
- Baraka, M.A.; Steurbaut, S.; Laubach, M.; Coomans, D.; Dupont, A.G. Iron Status, Iron Supplementation and Anemia in Pregnancy: Ethnic Differences. J. Matern.-Fetal Neonatal Med. 2012, 25, 1305–1310. [Google Scholar] [CrossRef]
- Ministry of Health, Labor and Welfare. National Survey of Living Standards. Available online: https://www.mhlw.go.jp/toukei/list/20-21.html (accessed on 19 January 2024).
- Vanié, S.C.; Edjème-Aké, A.; Kouassi, K.N.; Gbogouri, G.A.; Djaman, A.J. Nutritional and Obstetric Determinant of Iron Deficiency Anemia among Pregnant Women Attending Antenatal Care Services in Public Health Hospitals in Abidjan (Côte d’Ivoire): A Cross-Sectional Study. Ecol. Food Nutr. 2022, 61, 250–270. [Google Scholar] [CrossRef] [PubMed]
- Lin, L.; Wei, Y.; Zhu, W.; Wang, C.; Su, R.; Feng, H.; Yang, H. Prevalence, Risk Factors and Associated Adverse Pregnancy Outcomes of Anaemia in Chinese Pregnant Women: A Multicentre Retrospective Study. BMC Pregnancy Childbirth 2018, 18, 111. [Google Scholar] [CrossRef] [PubMed]
- Zhang, J.; Li, Q.; Song, Y.; Fang, L.; Huang, L.; Sun, Y. Nutritional Factors for Anemia in Pregnancy: A Systematic Review with Meta-Analysis. Front. Public Health 2022, 10, 1041136. [Google Scholar] [CrossRef] [PubMed]
- Mitsuda, N.; JP, N.A.; Eitoku, M.; Maeda, N.; Fujieda, M.; Suganuma, N.; Kamijima, M.; Yamazaki, S.; Kishi, R.; Yaegashi, N.; et al. Association between Maternal Hemoglobin Concentration and Placental Weight to Birthweight Ratio: The Japan Environment and Children’s Study (JECS). Placenta 2020, 101, 132–138. [Google Scholar] [CrossRef] [PubMed]
- Young, M.F.; Oaks, B.M.; Tandon, S.; Martorell, R.; Dewey, K.G.; Wendt, A.S. Maternal Hemoglobin Concentrations across Pregnancy and Maternal and Child Health: A Systematic Review and Meta-Analysis. Ann. N. Y. Acad. Sci. 2019, 1450, 47–68. [Google Scholar] [CrossRef] [PubMed]
- Steer, P.; Alam, M.A.; Wadsworth, J.; Welch, A. Relation between maternal haemoglobin concentration and birth weight in different ethnic groups. BMJ 1995, 310, 489–491. [Google Scholar] [CrossRef]
- Toshimitsu, M.; Ueki, N.; Hara, K.; Takeda, J.; Makino, S.; Kato, K.; Kumasawa, K.; Iriyama, T.; Nagamatsu, T.; Osuga, Y. Gestational Stage-Specific Association of Hemoglobin Concentration with the Risk of Preterm Birth and Small for Gestational Age. Hypertens. Res. Pregnancy 2023, 11, 25–35. [Google Scholar] [CrossRef]
- Gallo, L.A.; Steane, S.E.; Young, S.L.; de Jersey, S.; Schoenaker, D.A.J.M.; Borg, D.J.; Lockett, J.; Collins, C.E.; Perkins, A.V.; Kumar, S.; et al. Dietary Supplements, Guideline Alignment and Biochemical Nutrient Status in Pregnancy: Findings from the Queensland Family Cohort Pilot Study. Matern. Child. Nutr. 2023, 20, e13589. [Google Scholar] [CrossRef]
- Shand, A.W.; Walls, M.; Chatterjee, R.; Nassar, N.; Khambalia, A.Z. Dietary Vitamin, Mineral and Herbal Supplement Use: A Cross-Sectional Survey of before and during Pregnancy Use in Sydney, Australia. Aust. N. Z. J. Obstet. Gynaecol. 2016, 56, 154–161. [Google Scholar] [CrossRef]
- Caspersen, I.H.; Iglesias-Vázquez, L.; Abel, M.H.; Brantsæter, A.L.; Arija, V.; Erlund, I.; Meltzer, H.M. Iron Status in Mid-Pregnancy and Associations with Interpregnancy Interval, Hormonal Contraceptives, Dietary Factors and Supplement Use. Br. J. Nutr. 2021, 126, 1270–1280. [Google Scholar] [CrossRef]
- Keats, E.C.; Haider, B.A.; Tam, E.; Bhutta, Z.A. Multiple-Micronutrient Supplementation for Women during Pregnancy. Cochrane Database Syst. Rev. 2019, 3, CD004905. [Google Scholar] [CrossRef] [PubMed]
- Pavord, S.; Daru, J.; Prasannan, N.; Robinson, S.; Stanworth, S.; Girling, J. UK Guidelines on the Management of Iron Deficiency in Pregnancy. Br. J. Haematol. 2020, 188, 819–830. [Google Scholar] [CrossRef] [PubMed]
- Makama, M.; Earnest, A.; Lim, S.; Skouteris, H.; Hill, B.; Teede, H.; Boyle, J.A.; Brown, W.J.; Hodge, A.M.; Moran, L.J. Assessing Patterns of Change in Lifestyle Behaviours by Parity: A Longitudinal Cohort Study. Int. J. Epidemiol. 2023, 52, 589–599. [Google Scholar] [CrossRef] [PubMed]
- Jurj, A.L.; Wen, W.; Gao, Y.T.; Matthews, C.E.; Yang, G.; Li, H.L.; Zheng, W.; Shu, X.O. Patterns and Correlates of Physical Activity: A Cross-Sectional Study in Urban Chinese Women. BMC Public Health 2007, 7, 213. [Google Scholar] [CrossRef]
- Blumfield, M.L.; Hure, A.J.; MacDonald-Wicks, L.; Smith, R.; Collins, C.E. A Systematic Review and Meta-Analysis of Micronutrient Intakes during Pregnancy in Developed Countries. Nutr. Rev. 2013, 71, 118–132. [Google Scholar] [CrossRef]
- Lipoeto, N.I.; Masrul; Nindrea, R.D. Nutritional Contributors to Maternal Anemia in Indonesia: Chronic Energy Deficiency and Micronutrients. Asia Pac. J. Clin. Nutr. 2020, 29, 9–17. [Google Scholar] [CrossRef]
- Wijaya-Erhardt, M.; Muslimatun, S.; Erhardt, J.G. Fermented Soyabean and Vitamin C-Rich Fruit: A Possibility to Circumvent the Further Decrease of Iron Status among Iron-Deficient Pregnant Women in Indonesia. Public Health Nutr. 2011, 14, 2185–2196. [Google Scholar] [CrossRef]
- Asakura, K.; Sasaki, S.; Murakami, K.; Takahashi, Y.; Uenishi, K.; Yamakawa, M.; Nishiwaki, Y.; Kikuchi, Y.; Takebayashi, T.; Yamasaki, M.; et al. Iron Intake Does Not Significantly Correlate with Iron Deficiency among Young Japanese Women: A Cross-Sectional Study. Public Health Nutr. 2009, 12, 1373–1383. [Google Scholar] [CrossRef]


| Gestational Anemia | Non-Anemic Iron Deficiency | Normal | |||
|---|---|---|---|---|---|
| n = 110 (34.7%) | n = 151 (47.6%) | n = 56 (17.7%) | |||
| Mean ± SD or n (%) | Mean ± SD or n (%) | Mean ± SD or n (%) | p | ||
| Maternal biomarker | |||||
| T1 | Hb (g/dL) (n = 156) | 13.3 ± 4.9 | 13.1 ± 0.8 | 13.7 ± 4.3 | 0.776 |
| T2 | Hb (g/dL) (n = 227) | 11.3 ± 0.8 | 11.9 ± 0.8 | 11.7 ± 1.0 | <0.001 |
| T3 | Hb (g/dL) | 10.3 ± 0.5 | 11.8 ± 0.7 | 12.3 ± 0.9 | <0.001 |
| T3 | Ferritin (ng/L) | 8.2 ± 8.0 | 7.1 ± 2.0 | 20.6 ± 13.9 | <0.001 |
| T3 | Hct (%) | 32.1 ± 1.4 | 35.8 ± 1.9 | 36.4 ± 4.1 | <0.001 |
| T3 | MCV (fL) | 88.7 ± 5.7 | 91.5 ± 4.5 | 94.2 ± 4.6 | <0.001 |
| T3 | MCH (pg) | 28.6 ± 2.4 | 30.2 ± 1.8 | 31.3 ± 1.9 | <0.001 |
| T3 | MCHC (%) (n = 316) | 32.2 ± 0.9 | 33.0 ± 0.8 | 33.2 ± 0.8 | <0.001 |
| T3 | RDW (fL) (n = 297) | 13.7 ± 1.7 | 13.0 ± 1.1 | 13.4 ± 1.2 | <0.001 |
| Maternal characteristics | |||||
| Parity | Primipara | 55 (28.5) | 93 (48.2) | 45 (23.3) | <0.001 † |
| Multipara | 55 (44.4) | 58 (46.8) | 11 (8.8) | ||
| Maternal age | 35.1 ± 4.0 | 35.1 ± 4.2 | 34.9 ± 4.6 | 0.921 | |
| Pre-pregnancy BMI | 21.2 ± 3.0 | 21.4 ± 3.8 | 20.6 ± 2.8 | 0.284 | |
| GWG | 9.1 ± 3.7 | 8.6 ± 3.5 | 7.8 ± 2.7 | 0.060 | |
| EPDS score | ≥9 points | 16 (29.1) | 29 (52.7) | 10 (18.2) | 0.614 † |
| <9 points | 94 (35.9) | 122 (46.6) | 46 (17.5) | ||
| History of drinking (n = 309) | |||||
| No | 32 (33.0) | 47 (48.5) | 18 (18.5) | 0.899 † | |
| Yes | 75 (35.4) | 101 (40.1) | 36 (24.5) | ||
| Smoking status | No | 103 (36.4) | 127 (44.9) | 53 (18.7) | 0.018 † |
| Yes | 7 (20.6) | 24 (70.6) | 3 (8.8) | ||
| Marital status (n = 309) | Married | 104 (34.1) | 148 (48.5) | 53 (17.4) | 0.137 † |
| Not married | 3 (75.0) | 0 (0.0) | 1 (25.0) | ||
| Education (n = 304) | <University | 20 (29.4) | 36 (52.9) | 12 (17.7) | 0.588 † |
| ≥University | 85 (36.0) | 111 (47.0) | 40 (17.0) | ||
| Working status | Employed | 10 (40.0) | 12 (48.0) | 3 (12.0) | 0.700 † |
| Not-working/Unemployed | 100 (34.2) | 139 (47.6) | 53 (18.2) | ||
| Family income (n = 308) | <5 million | 12 (38.7) | 15 (48.4) | 4 (12.9) | 0.738 † |
| (Japanese yen/year) | ≥5 million | 94 (33.9) | 133 (48.0) | 50 (18.1) | |
| Prescribed iron supplements | T1 | 1 (100) | 0 (0.0) | 0 (0.0) | 0.389 † |
| T2 | 13 (59.1) | 5 (22.7) | 4 (18.2) | 0.028 † | |
| Taking any type of iron supplements during T3 | 0.043 † | ||||
| Prescribed iron supplements | 12 (29.3) | 18 (43.9) | 11 (26.8) | ||
| Only dietary iron supplements | 48 (30.8) | 75 (48.1) | 33 (21.1) | ||
| Not taking either | 50 (41.7) | 58 (48.3) | 12 (10.0) | ||
| Neonatal outcomes | |||||
| Preterm birth (<37 weeks) | 4 (36.4) | 2 (18.2) | 5 (45.4) | 0.029 † | |
| Low birthweight (<2500 g) | 3 (8.3) | 14 (38.9) | 19 (52.8) | 0.004 † | |
| Birthweight (g) | 3090 ± 354 | 2984 ± 369 | 2962 ± 471 | 0.041 | |
| Small for gestational age | 1 (7.1) | 7 (50.0) | 6 (42.9) | 0.014 | |
| Birth height (cm) | 49.3 ± 1.8 | 48.9 ± 2.0 | 48.9 ± 2.5 | 0.208 | |
| Head/Chest ratio | 1.0 ± 0.1 | 1.1 ± 0.0 | 1.1 ± 0.0 | 0.062 | |
| Sex | Male | 51 (31.1) | 84 (51.2) | 29 (17.7) | 0.335 † |
| Female | 59 (38.6) | 67 (43.8) | 27 (17.6) | ||
| All | Gestational Anemia | Non-Anemic Iron Deficiency | Normal | p | ||||||
|---|---|---|---|---|---|---|---|---|---|---|
| n = 317 | n = 110 | n = 151 | n = 56 | |||||||
| Median | (IQR) | Median | (IQR) | Median | (IQR) | Median | (IQR) | |||
| Energy | (kcal/day) | 1518 | (1298–1749) | 1581 | (1353–1880) | 1524 | (1280–1730) | 1404 | (1287–1640) | 0.047 |
| Iron | (mg/1000 kcal) | 4.0 | (3.6–4.6) | 3.9 | (3.6–4.7) | 4.1 | (3.6–4.6) | 4.0 | (3.4–4.6) | 0.819 |
| Folic acid | (µg/1000 kcal) | 164 | (135–205) | 165 | (130–207) | 163 | (135–204) | 163 | (135–204) | 0.989 |
| Vitamin K | (µg/1000 kcal) | 173 | (127–241) | 172 | (120–248) | 179 | (132–233) | 167 | (125–251) | 0.934 |
| Vitamin B12 | (µg/1000 kcal) | 3.3 | (2.4–4.7) | 3.4 | (2.5–4.7) | 3.2 | (2.4–4.5) | 3.7 | (2.1–5.3) | 0.917 |
| Vitamin D | (µg/1000 kcal) | 4.8 | (3.1–6.9) | 4.8 | (3.3–6.9) | 4.9 | (3.2–6.7) | 4.4 | (2.8–7.0) | 0.634 |
| Vitamin B1 | (mg/1000 kcal) | 0.4 | (0.4–0.5) | 0.4 | (0.4–0.5) | 0.4 | (0.4–0.5) | 0.4 | (0.4–0.5) | 0.922 |
| Vitamin B2 | (mg/1000 kcal) | 0.7 | (0.6–0.8) | 0.7 | (0.6–0.8) | 0.7 | (0.6–0.8) | 0.7 | (0.6–0.8) | 0.874 |
| Vitamin B6 | (mg/1000 kcal) | 0.7 | (0.6–0.7) | 0.6 | (0.6–0.7) | 0.6 | (0.6–0.7) | 0.7 | (0.5–0.8) | 0.831 |
| Zinc | (mg/1000 kcal) | 4.5 | (4.2–5.0) | 0.4 | (0.4–0.5) | 0.5 | (0.4–0.5) | 0.4 | (0.4–0.5) | 0.632 |
| Vitamin C | (mg/1000 kcal) | 56.8 | (43.6–76.0) | 56.5 | (43.6–75.3) | 55.0 | (43.6–76.0) | 60.8 | (42.3–76.4) | 0.875 |
| Calcium | (mg/1000 kcal) | 317 | (263–383) | 320 | (259–390) | 316 | (270–374) | 315 | (254–395) | 0.898 |
| Dietary fiber | (g/1000 kcal) | 6.7 | (5.9–8.0) | 6.8 | (6.0–8.1) | 6.7 | (6.0–8.1) | 6.5 | (5.8–8.1) | 0.730 |
| Protain | (% energy) | 14.6 | (13.0–16.3) | 14.5 | (12.9–16.1) | 14.7 | (13.0–16.3) | 14.8 | (13.0–16.5) | 0.532 |
| Fat | (% energy) | 30.1 | (26.6–33.6) | 29.2 | (26.1–34.1) | 30.0 | (26.8–33.0) | 31.1 | (28.0–34.7) | 0.286 |
| Carbohydrate | (% energy) | 54.0 | (49.5–58.4) | 54.4 | (49.9–58.6) | 54.2 | (49.6–54.2) | 52.1 | (48.2–58.0) | 0.264 |
| All | Gestational Anemia | Non-Anemic Iron Deficiency | Normal | p | ||||||
|---|---|---|---|---|---|---|---|---|---|---|
| n = 193 | n = 55 | n = 93 | n = 45 | |||||||
| Median | (IQR) | Median | (IQR) | Median | (IQR) | Median | (IQR) | |||
| Energy | (kcal/day) | 1478 | (1286–1721) | 1540 | (1354–1780) | 1465 | (1279–1708) | 1375 | (1256–1639) | 0.106 |
| Iron | (mg/1000 kcal) | 4.1 | (3.6–4.7) | 4.0 | (3.7–4.9) | 4.3 | (3.6–4.7) | 4.0 | (3.4–4.6) | 0.512 |
| Folic acid | (µg/1000 kcal) | 171 | (138–212) | 174 | (142–221) | 175 | (137–209) | 164 | (135–213) | 0.805 |
| Vitamin K | (µg/1000 kcal) | 179 | (136–247) | 178 | (145–256) | 187 | (135–242) | 172 | (131–257) | 0.894 |
| Vitamin B12 | (µg/1000 kcal) | 3.2 | (2.4–4.6) | 3.0 | (2.2–4.7) | 3.3 | (2.4–4.5) | 3.2 | (2.0–4.9) | 0.563 |
| Vitamin D | (µg/1000 kcal) | 4.4 | (3.0–6.3) | 4.2 | (2.9–6.7) | 5.0 | (3.3–6.5) | 3.9 | (2.7–5.9) | 0.110 |
| Vitamin B1 | (mg/1000 kcal) | 0.5 | (0.4–0.5) | 0.5 | (0.4–0.5) | 0.5 | (0.4–0.5) | 0.4 | (0.4–0.5) | 0.922 |
| Vitamin B2 | (mg/1000 kcal) | 0.7 | (0.6–0.8) | 0.7 | (0.6–0.9) | 0.7 | (0.6–0.8) | 0.7 | (0.6–0.8) | 0.969 |
| Vitamin B6 | (mg/1000 kcal) | 0.7 | (0.6–0.7) | 0.7 | (0.6–0.7) | 0.7 | (0.6–0.7) | 0.6 | (0.5–0.8) | 0.903 |
| Zinc | (mg/1000 kcal) | 4.5 | (4.2–5.0) | 4.5 | (4.1–5.0) | 4.6 | (4.2–5.0) | 4.1 | (4.1–5.0) | 0.770 |
| Vitamin C | (mg/1000 kcal) | 59.1 | (44.6–78.7) | 59.8 | (45.7–81.6) | 58.3 | (44.4–79.6) | 59.1 | (42.5–77.0) | 0.927 |
| Calcium | (mg/1000 kcal) | 321 | (276–392) | 331 | (278–415) | 314 | (288–375) | 324 | (254–423) | 0.626 |
| Dietary fiber | (g/1000 kcal) | 6.7 | (6.0–8.1) | 7.0 | (5.9–8.1) | 6.7 | (6.1–8.2) | 6.5 | (5.8–8.0) | 0.586 |
| Protain | (% energy) | 14.7 | (13.1–16.5) | 14.6 | (13.0–16.0) | 14.8 | (13.3–16.7) | 14.1 | (12.8–16.4) | 0.595 |
| Fat | (% energy) | 30.6 | (27.6–33.7) | 29.3 | (27.7–34.8) | 30.9 | (27.7–33.3) | 30.3 | (26.6–34.6) | 0.983 |
| Carbohydrate | (% energy) | 53.5 | (49.3–58.0) | 54.2 | (49.8–58.0) | 53.2 | (49.2–57.1) | 53.5 | (47.6–59.5) | 0.837 |
| All | Gestational Anemia | Non-Anemic Iron Deficiency | Normal | p | ||||||
|---|---|---|---|---|---|---|---|---|---|---|
| n = 124 | n = 55 | n = 58 | n = 11 | |||||||
| Median | (IQR) | Median | (IQR) | Median | (IQR) | Median | (IQR) | |||
| Energy | (kcal/day) | 1557 | (1314–1893) | 1594 | (1339–1933) | 1551 | (1294–1747) | 1450 | (1330–2101) | 0.715 |
| Iron | (mg/1000 kcal) | 3.9 | (3.5–4.4) | 3.8 | (3.5–4.7) | 4.0 | (3.5–4.3) | 4.1 | (3.8–4.7) | 0.598 |
| Folic acid | (µg/1000 kcal) | 156 | (128–193) | 161 | (122–196) | 152 | (135–188) | 157 | (137–197) | 0.920 |
| Vitamin K | (µg/1000 kcal) | 158 | (117–221) | 156.2 | (110–236) | 161 | (126–210) | 154 | (116–252) | 0.768 |
| Vitamin B12 | (µg/1000 kcal) | 3.5 | (2.5–4.7) | 3.8 | (2.8–4.7) | 3.2 | (2.2–4.6) | 5.4 | (3.4–6.4) | 0.043 |
| Vitamin D | (µg/1000 kcal) | 5.3 | (3.4–7.4) | 5.6 | (3.7–7.3) | 4.8 | (3.1–7.0) | 7.1 | (5.1–10.6) | 0.105 |
| Vitamin B1 | (mg/1000 kcal) | 0.4 | (0.4–0.5) | 0.4 | (0.4–0.5) | 0.4 | (0.4–0.5) | 0.4 | (0.4–0.5) | 0.875 |
| Vitamin B2 | (mg/1000 kcal) | 0.7 | (0.6–0.8) | 0.7 | (0.6–0.8) | 0.7 | (0.6–0.8) | 0.7 | (0.6–0.8) | 0.979 |
| Vitamin B6 | (mg/1000 kcal) | 0.6 | (0.6–0.7) | 0.6 | (0.5–0.7) | 0.6 | (0.6–0.7) | 0.7 | (0.6–0.8) | 0.469 |
| Zinc | (mg/1000 kcal) | 4.4 | (4.1–4.8) | 4.4 | (4.0–4.8) | 4.4 | (4.2–4.9) | 4.5 | (4.2–5.0) | 0.821 |
| Vitamin C | (mg/1000 kcal) | 51.3 | (42.6–67.9) | 51.7 | (42.9–62.7) | 50.6 | (41.7–66.8) | 64.0 | (40.8–76.5) | 0.912 |
| Calcium | (mg/1000 kcal) | 311 | (256–370) | 309 | (244–367) | 323 | (258–374) | 297 | (243–330) | 0.495 |
| Dietary fiber | (g/1000 kcal) | 6.6 | (5.7–7.8) | 6.6 | (5.8–7.8) | 6.7 | (5.7–7.8) | 6.6 | (5.1–8.3) | 0.938 |
| Protain | (% energy) | 14.6 | (12.8–16.2) | 14.4 | (12.8–16.5) | 14.7 | (12.8–16.0) | 16.0 | (14.3–17.1) | 0.120 |
| Fat | (% energy) | 28.9 | (25.3–33.3) | 28.5 | (23.9–33.9) | 28.2 | (25.3–32.4) | 32.0 | (30.5–35.4) | 0.042 |
| Carbohydrate | (% energy) | 54.6 | (50.0–59.7) | 55.6 | (49.9–61.9) | 55.7 | (51.2–59.6) | 50.3 | (49.5–52.1) | 0.026 |
Disclaimer/Publisher’s Note: The statements, opinions and data contained in all publications are solely those of the individual author(s) and contributor(s) and not of MDPI and/or the editor(s). MDPI and/or the editor(s) disclaim responsibility for any injury to people or property resulting from any ideas, methods, instructions or products referred to in the content. |
© 2024 by the authors. Licensee MDPI, Basel, Switzerland. This article is an open access article distributed under the terms and conditions of the Creative Commons Attribution (CC BY) license (https://creativecommons.org/licenses/by/4.0/).
Share and Cite
Habe, S.; Haruna, M.; Yonezawa, K.; Usui, Y.; Sasaki, S.; Nagamatsu, T.; Fujita, M.; Suetsugu, Y.; Ohori, R.; Tanaka, M.; et al. Factors Associated with Anemia and Iron Deficiency during Pregnancy: A Prospective Observational Study in Japan. Nutrients 2024, 16, 418. https://doi.org/10.3390/nu16030418
Habe S, Haruna M, Yonezawa K, Usui Y, Sasaki S, Nagamatsu T, Fujita M, Suetsugu Y, Ohori R, Tanaka M, et al. Factors Associated with Anemia and Iron Deficiency during Pregnancy: A Prospective Observational Study in Japan. Nutrients. 2024; 16(3):418. https://doi.org/10.3390/nu16030418
Chicago/Turabian StyleHabe, Sarasa, Megumi Haruna, Kaori Yonezawa, Yuriko Usui, Satoshi Sasaki, Takeshi Nagamatsu, Megumi Fujita, Yoshiko Suetsugu, Riko Ohori, Moeko Tanaka, and et al. 2024. "Factors Associated with Anemia and Iron Deficiency during Pregnancy: A Prospective Observational Study in Japan" Nutrients 16, no. 3: 418. https://doi.org/10.3390/nu16030418
APA StyleHabe, S., Haruna, M., Yonezawa, K., Usui, Y., Sasaki, S., Nagamatsu, T., Fujita, M., Suetsugu, Y., Ohori, R., Tanaka, M., & Aoyama, S. (2024). Factors Associated with Anemia and Iron Deficiency during Pregnancy: A Prospective Observational Study in Japan. Nutrients, 16(3), 418. https://doi.org/10.3390/nu16030418