
The Relationship of Pork Meat Consumption with Nutrient Intakes, Diet Quality, and Biomarkers of Health Status in Korean Older Adults

 ,
,  ,
,  and
and 
Highlights
- In older Korean adults, pork meat consumption was associated with improved diet quality and a higher intake of vegetables.
- Pork meat consumers had higher intakes of all nutrients, except for vitamin B6 in both genders and retinol, omega-3 fatty acids, and zinc in males.
- Pork meat consumers had better hand-grip strength, a useful indicator of muscle strength/function and general health status in older adults.
Abstract
1. Introduction
2. Methods
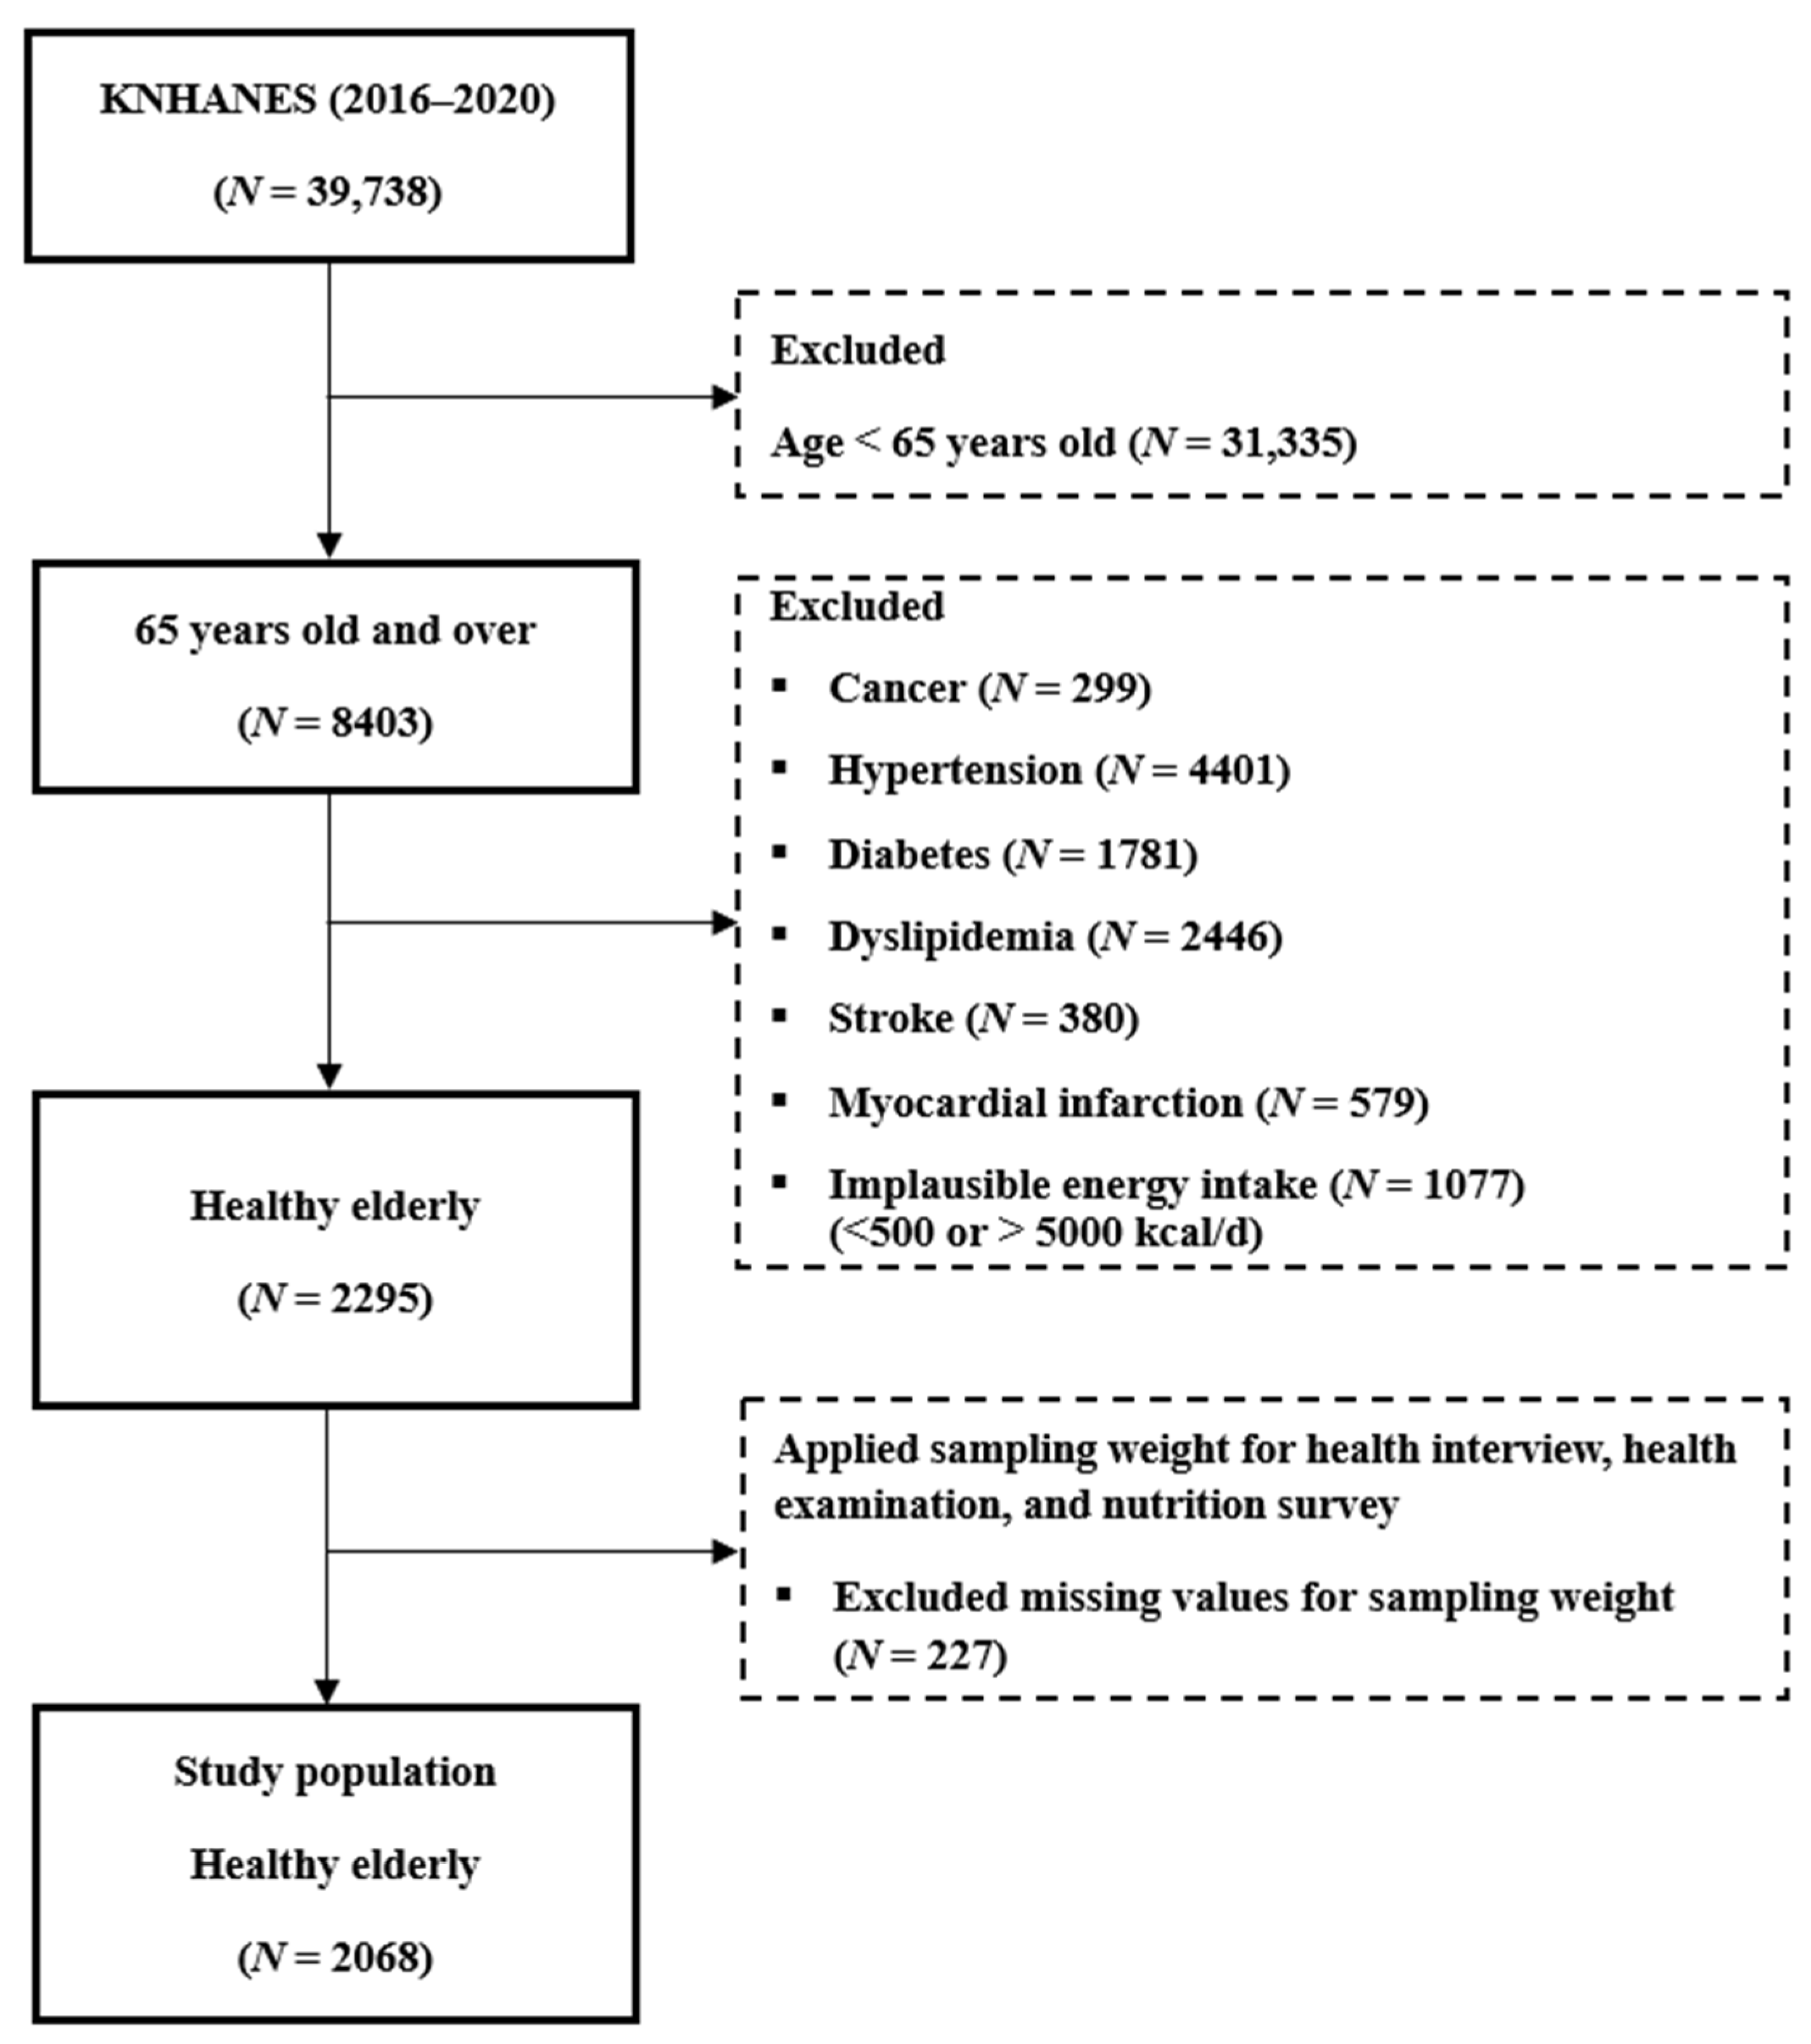
2.1. Study Design and Population
2.2. Development of a Vitamin B6, Vitamin B12, Magnesium, Zinc, and Selenium Database
- Foods with the same description (exact same names [common or academic names] and same condition);
- Foods with the same name but different water content (dried, raw, and boiled) or different manufacturer;
- Substituting similar foods while considering major nutrients (specifically, carbohydrate, protein, and fat content).
2.3. Estimation of Total Energy and Nutrient Intake
2.4. Classification of Pork Consumers and Non-Consumers
2.5. Korean Healthy Eating Index Score
2.6. Anthropometric, Blood Pressure, and Biochemical Measurements
2.7. Regular Physical Activity
2.8. Handgrip Strength Measurements
2.9. Statistical Analyses
3. Results
3.1. Characteristics of Study Participants
3.2. Proportion of Pork Intake
3.3. Total Energy and Nutrient Intake
3.4. Diet Quality
3.5. Biomarkers of Health Status
3.6. Handgrip Strength, Anthropometric Measures, and Blood Pressure
4. Discussion
5. Conclusions
Supplementary Materials
Author Contributions
Funding
Institutional Review Board Statement
Informed Consent Statement
Data Availability Statement
Acknowledgments
Conflicts of Interest
References
- Yu, W.; Jensen, J.D. Sustainability implications of rising global pork demand. Anim. Front. 2022, 12, 56–60. [Google Scholar] [CrossRef] [PubMed]
- Organization for Economic Cooperation and Development. OECD-FAO Agricultural Outlook 2022–2031. Available online: https://www.oecd.org/en/publications/oecd-fao-agricultural-outlook-2022-2031_f1b0b29c-en.html (accessed on 12 November 2024).
- Penkert, L.P.; Li, R.; Huang, J.; Gurcan, A.; Chung, M.C.; Wallace, T.C.; Chung, M. Pork consumption and its relationship to human nutrition and health: A scoping review. Meat Muscle Biol. 2021, 5, 1–22. [Google Scholar] [CrossRef]
- Willett, W.; Rockström, J.; Loken, B.; Springmann, M.; Lang, T.; Vermeulen, S.; Garnett, T.; Tilman, D.; DeClerck, F.; Wood, A.; et al. Food in the Anthropocene: The EAT–Lancet Commission on healthy diets from sustainable food systems. Lancet 2019, 393, 447–492. [Google Scholar] [CrossRef]
- Wen, S.; Zhou, G.; Song, S.; Xu, X.; Voglmeir, J.; Liu, L.; Zhao, F.; Li, M.; Li, L.; Yu, X.; et al. Discrimination of in vitro and in vivo digestion products of meat proteins from pork, beef, chicken, and fish. Proteomics 2015, 15, 3688–3698. [Google Scholar] [CrossRef] [PubMed]
- Datlow, L.Y.; Leventhal, M.; King, J.; Wallace, T.C. Consumption patterns and the nutritional contribution of total, processed, fresh, and fresh-lean pork to the U.S. diet. Nutrients 2023, 15, 2595. [Google Scholar] [CrossRef]
- Global Nutrition Report. The State of Global Nutrition. Available online: https://globalnutritionreport.org/reports/2021-global-nutrition-report/ (accessed on 12 November 2024).
- Jun, S.; Ha, K.; Chung, S.; Joung, H. Meat and milk intake in the rice-based Korean diet: Impact on cancer and metabolic syndrome. Proc. Nutr. Soc. 2016, 75, 374–384. [Google Scholar] [CrossRef] [PubMed]
- Lee, M.-J.; Popkin, B.M.; Kim, S. The unique aspects of the nutrition transition in South Korea: The retention of healthful elements in their traditional diet. Public Health Nutr. 2002, 5, 197–203. [Google Scholar] [CrossRef]
- Oh, S.H.; See, M.T. Pork preference for consumers in China, Japan and South Korea. Asian-Australas. J. Anim. Sci. 2012, 25, 143–150. [Google Scholar] [CrossRef]
- KREI. Annual per Capita Consumption of Pork in South Korea from 2015 to 2022 (in Kilograms). Available online: https://www.statista.com/statistics/1036394/south-korea-per-capita-pork-consumption/ (accessed on 12 November 2024).
- Vicente, F.; Pereira, P.C. Pork meat composition and health: A review of the evidence. Foods 2024, 13, 1905. [Google Scholar] [CrossRef]
- Rural Development Administration. Korean Food Composition Database. Available online: https://koreanfood.rda.go.kr/kfi/fct/fctIntro/list?menuId=PS03562# (accessed on 12 November 2024).
- Kityo, A.; Lee, S.-A.; Kang, D. Total and cause-specific mortality associated with meat intake in a large cohort study in Korea. Front. Nutr. 2023, 10, 1138102. [Google Scholar] [CrossRef]
- Kim, S.-A.; Shin, S. Red meat and processed meat consumption and the risk of dyslipidemia in Korean adults: A prospective cohort study based on the Health Examinees (HEXA) study. Nutr. Metab. Cardiovasc. Dis. 2021, 31, 1714–1727. [Google Scholar] [CrossRef]
- Kim, H.N.; Choi, I.-C. The economic impact of government policy on market prices of low-fat pork in South Korea: A quasi-experimental hedonic price approach. Sustainability 2018, 10, 892. [Google Scholar] [CrossRef]
- Baek, J.Y.; Lee, E.; Jung, H.W.; Jang, I.Y. Geriatrics Fact Sheet in Korea 2021. Ann. Geriatr. Med. Res. 2021, 25, 65–71. [Google Scholar] [CrossRef] [PubMed]
- KOSIS. Population Projections for Korea (2020–2070). Available online: https://kosis.kr (accessed on 12 November 2024).
- Kim, I. Contributions of the life expectancy gap reduction between urban and rural areas to the increase in overall life expectancy in South Korea from 2000 to 2019. Int. J. Equity Health 2023, 22, 141. [Google Scholar] [CrossRef] [PubMed]
- Korea Institute for Health and Social Affairs. Survey of the Elderly. Available online: https://www.mohw.go.kr/board.es?mid=a10107010100&bid=0040&act=view&list_no=374195&tag=&cg_code=&list_depth=1 (accessed on 12 November 2024).
- Ham, H.; Ha, K. Trends in dietary protein intake and its adequacy among Korean adults: Data from the 2010~2019 Korea National Health and Nutrition Examination Survey (KNHANES). Korean J. Community Nutr. 2022, 27, 47–60. [Google Scholar] [CrossRef]
- Ministry of Health and Welfare; The Korean Nutrition Society. Application of Dietary Reference Intakes for Koreans 2020; Ministry of Health and Welfare: Sejong, Republic of Korea, 2021. [Google Scholar]
- Park, H.A. Adequacy of protein intake among Korean elderly: An analysis of the 2013–2014 Korea National Health and Nutrition Examination Survey data. Korean J. Fam. Med. 2018, 39, 130. [Google Scholar] [CrossRef]
- Ministry of Health and Welfare. Dietary Guidelines for Korean Elderly; Ministry of Health and Welfare: Sejong, Republic of Korea, 2013. [Google Scholar]
- Yuan, M.; Pickering, R.T.; Bradlee, M.L.; Mustafa, J.; Singer, M.R.; Moore, L.L. Animal protein intake reduces risk of functional impairment and strength loss in older adults. Clin. Nutr. 2021, 40, 919–927. [Google Scholar] [CrossRef]
- Landi, F.; Calvani, R.; Tosato, M.; Martone, A.M.; Picca, A.; Ortolani, E.; Savera, G.; Salini, S.; Ramaschi, M.; Bernabei, R. Animal-derived protein consumption is associated with muscle mass and strength in community-dwellers: Results from the Milan Expo survey. J. Nutr. Health Aging 2017, 21, 1050–1056. [Google Scholar] [CrossRef]
- An, R.; Nickols-Richardson, S.M.; Alston, R.J.; Shen, S.; Clarke, C. Fresh- and lean-pork intake in relation to functional limitations among US older adults, 2005–2016. Nutr. Health 2020, 26, 295–301. [Google Scholar] [CrossRef]
- Yun, S.; Oh, K. The Korea national health and nutrition examination survey data linked cause of death data. Epidemiol. Health 2022, 44, e2022021. [Google Scholar] [CrossRef]
- Oh, K.; Kim, Y.; Kweon, S.; Kim, S.; Yun, S.; Park, S.; Lee, Y.-K.; Kim, Y.; Park, O.; Jeong, E.K. Korea National Health and Nutrition Examination Survey, 20th anniversary: Accomplishments and future directions. Epidemiol. Health 2021, 43, e2021025. [Google Scholar] [CrossRef] [PubMed]
- Korea Disease Control and Prevention Agency. Korea Health Statistics 2019: Korea National Health and Nutrition Examination Survey (KNHANES VII-3). Available online: https://knhanes.kdca.go.kr/knhanes/sub04/sub04_04_01.do (accessed on 12 November 2024).
- Korea Disease Control and Prevention Agency. Guidebook for Korea National Health and Nutrition Examination Survey Database. Available online: https://knhanes.kdca.go.kr/knhanes/sub03/sub03_02_05.do (accessed on 12 November 2024).
- Rural Development Administration. Korean Food Composition Table, 10th Revised Edition. Available online: https://koreanfood.rda.go.kr/eng/fctFoodSrchEng/main (accessed on 12 November 2024).
- Ministry of Food and Drug Safety. Food and Nutrient Composition Database. Available online: https://www.mfds.go.kr/eng/index.do (accessed on 12 November 2024).
- Korean Nutrition Society. CAN Pro 5.0; Korean Nutrition Society: Seoul, Republic of Korea, 2023. [Google Scholar]
- Watanabe, T.; Kawai, R. Advances in food composition tables in Japan-Standard Tables of Food Composition in Japan, 2015 (Seventh Revised Edition). Food Chem. 2018, 238, 16–21. [Google Scholar] [CrossRef]
- Rhodes, D.G.; Morton, S.; Myrowitz, R.; Moshfegh, A.J. Food and Nutrient Database for Dietary Studies 2019–2020: An application database for national dietary surveillance. J. Food Compos. Anal. 2023, 123, 105547. [Google Scholar] [CrossRef]
- Yook, S.-M.; Park, S.; Moon, H.-K.; Kim, K.; Shim, J.E.; Hwang, J.-Y. Development of Korean Healthy Eating Index for adults using the Korea National Health and Nutrition Examination Survey data. J. Nutr. Health 2015, 48, 419–428. [Google Scholar] [CrossRef]
- Yoon, Y.S.; Oh, S.W. Association between diet quality and type of meal companion: The 2013–2015 Korea National Health and Nutrition Examination Survey (KNHANES). Nutr. Res. Pract. 2023, 17, 553–564. [Google Scholar] [CrossRef]
- Jang, W.; Ryu, H.K. Association of low hand grip strength with protein intake in Korean female elderly: Based on the Seventh Korea National Health and Nutrition Examination Survey (KNHANES VII), 2016–2018. Korean J. Community Nutr. 2020, 25, 226–235. [Google Scholar] [CrossRef]
- Bohannon, R.W.; Wang, Y.-C.; Yen, S.-C.; Grogan, K.A. Handgrip strength: A comparison of values obtained from the NHANES and NIH Toolbox studies. Am. J. Occup. Ther. 2019, 73, 7302205080p1–7302205080p9. [Google Scholar] [CrossRef]
- Centers for Disease Control and Prevention. National Health and Nutrition Examination Survey (NHANES) Muscle Strength Procedures Manual. Available online: https://wwwn.cdc.gov/nchs/data/nhanes/2013-2014/manuals/muscle_strength_2013.pdf (accessed on 12 November 2024).
- Chen, L.-K.; Woo, J.; Assantachai, P.; Auyeung, T.-W.; Chou, M.-Y.; Iijima, K.; Jang, H.C.; Kang, L.; Kim, M.; Kim, S. Asian Working Group for Sarcopenia: 2019 consensus update on sarcopenia diagnosis and treatment. J. Am. Med. Dir. Assoc. 2020, 21, 300–307.e2. [Google Scholar] [CrossRef]
- An, R.; Nickols-Richardson, S.M.; Alston, R.; Clarke, C. Fresh and lean pork consumption in relation to nutrient intakes and diet quality among US adults, NHANES 2005–2016. Health Behav. Policy Rev. 2019, 6, 570–581. [Google Scholar] [CrossRef]
- Murphy, K.J.; Parker, B.; Dyer, K.A.; Davis, C.R.; Coates, A.M.; Buckley, J.D.; Howe, P.R. A comparison of regular consumption of fresh lean pork, beef and chicken on body composition: A randomized cross-over trial. Nutrients 2014, 6, 682–696. [Google Scholar] [CrossRef]
- Gerber, N.; Scheeder, M.; Wenk, C. The influence of cooking and fat trimming on the actual nutrient intake from meat. Meat Sci. 2009, 81, 148–154. [Google Scholar] [CrossRef] [PubMed]
- Cho, Y.-O.; Kim, B.-Y. Vitamin B6 intake by Koreans should be based on sufficient amount and a variety of food sources. Nutrition 2005, 21, 1113–1119. [Google Scholar] [CrossRef] [PubMed]
- Da Silva, V.; Russell, K.; Gregory, J. Vitamin B6. In Present Knowledge in Nutrition, 10th ed.; Erdman, J., Macdonald, I., Zeisel, S., Eds.; John Wiley & Sons, Ltd.: Ames, IA, USA, 2012; Volume 3, pp. 307–320. [Google Scholar]
- Morris, M.S.; Picciano, M.F.; Jacques, P.F.; Selhub, J. Plasma pyridoxal 5′-phosphate in the US population: The National Health and Nutrition Examination Survey, 2003–2004. Am. J. Clin. Nutr. 2008, 87, 1446–1454. [Google Scholar] [CrossRef]
- Lee, Y.-S.; Lee, Y.N. Comparison of the nutrient intake and health status of elderly Koreans according to their BMI status: Focus on the underweight elderly population. Korean J. Community Nutr. 2022, 27, 422–434. [Google Scholar] [CrossRef]
- Yoon, Y.S.; Oh, S.W. Relationship between psychological distress and the adherence to the Korean Healthy Eating Index (KHEI): The Korea National Health and Nutrition Examination Survey (KNHANES) 2013 and 2015. Nutr. Res. Pract. 2021, 15, 516–527. [Google Scholar] [CrossRef] [PubMed]
- Frankenfeld, C.L.; Wallace, T.C. Dietary patterns and nutritional status in relation to consumption of chickpeas and hummus in the U.S. population. Appl. Sci. 2020, 10, 7341. [Google Scholar] [CrossRef]
- Brennan, L.; Gibbons, H. Sex matters: A focus on the impact of biological sex on metabolomic profiles and dietary interventions. Proc. Nutr. Soc. 2020, 79, 205–209. [Google Scholar] [CrossRef]
- Campesi, I.; Ruoppolo, M.; Franconi, F.; Caterino, M.; Costanzo, M. Sex-gender-based differences in metabolic diseases. Handb. Exp. Pharm. 2023, 282, 241–257. [Google Scholar] [CrossRef]
- Kim, H.; Kwon, O. Higher diet quality is associated with lower odds of low hand grip strength in the Korean elderly population. Nutrients 2019, 11, 1487. [Google Scholar] [CrossRef]
- van Vliet, S.; Burd, N.A.; van Loon, L.J.C. The skeletal muscle anabolic response to plant- versus animal-based protein consumption. J. Nutr. 2015, 145, 1981–1991. [Google Scholar] [CrossRef]
- Pikosky, M.A.; Cifelli, C.J.; Agarwal, S.; Fulgoni, V.L. Association of dietary protein intake and grip strength among adults aged 19+ years: NHANES 2011–2014 analysis. Front. Nutr. 2022, 9, 873512. [Google Scholar] [CrossRef] [PubMed]
- McLean, R.R.; Mangano, K.M.; Hannan, M.T.; Kiel, D.P.; Sahni, S. Dietary protein intake is protective against loss of grip strength among older adults in the Framingham Offspring Cohort. J. Gerontol. A Biol. Sci. Med. Sci. 2015, 71, 356–361. [Google Scholar] [CrossRef] [PubMed]
- Mishra, S.; Goldman, J.D.; Sahyoun, N.R.; Moshfegh, A.J. Association between dietary protein intake and grip strength among adults aged 51 years and over: What We Eat in America, National Health and Nutrition Examination Survey 2011–2014. PLoS ONE 2018, 13, e0191368. [Google Scholar] [CrossRef] [PubMed]
- Subar, A.F.; Freedman, L.S.; Tooze, J.A.; Kirkpatrick, S.I.; Boushey, C.; Neuhouser, M.L.; Thompson, F.E.; Potischman, N.; Guenther, P.M.; Tarasuk, V. Addressing current criticism regarding the value of self-report dietary data. J. Nutr. 2015, 145, 2639–2645. [Google Scholar] [CrossRef] [PubMed]

| Characteristic | All (n = 2068) | Men | Women | ||
|---|---|---|---|---|---|
| Consumers (n = 372) | Non-Consumers (n = 618) | Consumers (n = 359) | Non-Consumers (n = 719) | ||
| Age (y) | 72.28 ± 0.13 | 71.65 ± 0.32 | 73.35 ± 0.23 **** | 71.15 ± 0.32 | 72.26 ± 0.23 ** |
| Education | |||||
| Elementary school | 1013 (50.39) | 119 (32.20) | 251 (42.14) ** | 194 (52.05) | 449 (66.88) ** |
| Middle school | 253 (14.29) | 38 (11.41) | 82 (15.8) | 56 (18.54) | 77 (12.27) |
| High school | 353 (20.33) | 89 (27.81) | 120 (22.02) | 51 (18.93) | 93 (15.45) |
| College | 251 (14.99) | 92 (28.57) | 97 (20.04) | 29 (10.48) | 33 (5.40) |
| Residence | |||||
| Urban | 1484 (77.09) | 289 (83.30) | 433 (74.93) * | 275 (81.35) | 487 (73.25) * |
| Rural | 584 (22.91) | 83 (16.70) | 185 (25.07) | 84 (18.65) | 232 (26.75) |
| Household income | |||||
| Low | 910 (42.71) | 117 (31.89) | 268 (42.67) ** | 151 (41.32) | 374 (49.64) |
| Middle-low | 607 (28.70) | 119 (30.79) | 188 (29.68) | 115 (30.73) | 185 (25.51) |
| Middle-high | 311 (16.42) | 74 (20.04) | 101 (17.62) | 46 (14.63) | 90 (14.24) |
| High | 228 (12.17) | 60 (17.29) | 58 (10.04) | 45 (13.33) | 65 (10.61) |
| Marital status | |||||
| Married | 2060 (99.62) | 370 (99.48) | 617 (99.9) | 357 (99.45) | 716 (99.53) |
| Single | 8 (0.38) | 2 (0.52) | 1 (0.10) | 2 (0.55) | 3 (0.47) |
| Alcohol consumer | |||||
| No | 1278 (59.96) | 142 (36.31) | 296 (47.66) ** | 279 (75.52) | 561 (76.35) |
| Yes | 748 (37.96) | 226 (62.44) | 312 (50.73) | 72 (21.95) | 138 (20.91) |
| No response | 42 (2.08) | 4 (1.25) | 10 (1.61) | 8 (2.53) | 20 (2.75) |
| Smoking status | |||||
| Current smoker | 214 (10.78) | 84 (22.32) | 100 (15.71) | 9 (3.30) | 21 (3.71) |
| Ex-smoker | 599 (29.81) | 203 (55.14) | 360 (58.00) | 11 (3.80) | 25 (3.42) |
| Non-smoker | 1212 (57.26) | 81 (21.30) | 147 (24.48) | 331 (90.37) | 653 (90.08) |
| No response | 43 (2.16) | 4 (1.25) | 11 (1.81) | 8 (2.53) | 20 (2.79) |
| Regular physical activity | |||||
| No | 1223 (64.29) | 206 (57.98) | 347 (61.86) | 217 (64.27) | 453 (69.94) |
| Yes | 637 (35.71) | 129 (42.02) | 200 (38.14) | 113 (35.73) | 195 (30.06) |
| Characteristic | n | Intake, Mean ± SE (g/d) | ||
|---|---|---|---|---|
| Total Pork | Fresh Pork | Processed Pork | ||
| Total population | 731 | 63.11 ± 3.16 | 60.46 ± 3.19 | 2.65 ± 0.36 |
| Gender | ||||
| Men | 372 | 79.11 ± 5.17 | 75.99 ± 5.24 | 3.12 ± 0.64 |
| Women | 359 | 46.30 ± 2.87 | 44.15 ± 2.91 | 2.15 ± 0.32 |
| BMI (kg/m2) | ||||
| Underweight (<18.5) | 37 | 50.42 ± 9.84 | 48.03 ± 9.91 | 2.39 ± 1.61 |
| Healthy weight (18.5 to <25.0) | 351 | 59.41 ± 4.24 | 56.92 ± 4.29 | 2.50 ± 0.50 |
| Overweight (25 to <30.0) | 195 | 63.85 ± 5.70 | 60.88 ± 5.80 | 2.97 ± 0.67 |
| Obese (≥30.0) | 138 | 74.64 ± 9.06 | 71.88 ± 9.14 | 2.75 ± 1.02 |
| Nutrient | All (n = 2068) | Men | Women | ||||
|---|---|---|---|---|---|---|---|
| Consumers (n = 372) | Non-Consumers (n = 618) | p-Value | Consumers (n = 359) | Non-Consumers (n = 719) | p-Value | ||
| Energy (kcal) | 1706.45 ± 17.16 | 2080.79 ± 43.18 | 1816.08 ± 30.37 | <0.0001 | 1601.93 ± 35.11 | 1449.33 ± 23.48 | <0.0001 |
| Carbohydrate (g) | 290.59 ± 2.92 | 327.06 ± 7.30 | 312.37 ± 5.31 | 0.0011 | 267.70 ± 6.02 | 262.14 ± 4.56 | 0.0053 |
| Protein (g) | 57.75 ± 0.73 | 74.49 ± 1.80 | 61.37 ± 1.33 | <0.0001 | 56.15 ± 1.29 | 45.77 ± 0.90 | <0.0001 |
| Fat (g) | 29.73 ± 0.62 | 40.27 ± 1.53 | 28.88 ± 0.96 | <0.0001 | 32.63 ± 1.43 | 22.98 ± 0.77 | <0.0001 |
| SFA (g) | 9.11 ± 0.21 | 12.43 ± 0.46 | 8.68 ± 0.32 | <0.0001 | 10.15 ± 0.55 | 7.06 ± 0.26 | <0.0001 |
| ω3 fatty acids (g) | 1.67 ± 0.06 | 1.95 ± 0.14 | 1.80 ± 0.09 | 0.1025 | 1.86 ± 0.17 | 1.29 ± 0.06 | <0.0001 |
| ω6 fatty acids (g) | 6.89 ± 0.15 | 9.12 ± 0.40 | 6.69 ± 0.22 | <0.0001 | 7.53 ± 0.35 | 5.46 ± 0.21 | <0.0001 |
| Cholesterol (mg) | 160.54 ± 4.43 | 212.45 ± 10.65 | 166.30 ± 7.87 | <0.0001 | 160.70 ± 8.32 | 125.70 ± 6.52 | <0.0001 |
| Sugar (g) | 53.95 ± 1.12 | 59.53 ± 2.40 | 54.54 ± 1.98 | <0.0001 | 56.51 ± 2.59 | 48.85 ± 1.78 | <0.0001 |
| Calcium (mg) | 469.92 ± 8.11 | 517.55 ± 14.84 | 515.27 ± 15.03 | 0.0030 | 454.96 ± 15.80 | 409.07 ± 11.82 | <0.0001 |
| Phosphorus (mg) | 946.25 ± 11.21 | 1142.27 ± 24.86 | 1019.79 ± 20.56 | <0.0001 | 913.27 ± 21.04 | 784.94 ± 14.76 | <0.0001 |
| Iron (mg) | 10.46 ± 0.17 | 12.36 ± 0.49 | 11.30 ± 0.33 | 0.0005 | 9.77 ± 0.32 | 8.97 ± 0.22 | 0.0008 |
| Sodium (mg) | 2936.37 ± 47.90 | 3611.58 ± 114.99 | 3234.82 ± 92.63 | 0.0028 | 2685.48 ± 77.24 | 2413.14 ± 74.46 | <0.0001 |
| Potassium (mg) | 2709.23 ± 38.61 | 3136.77 ± 79.96 | 2859.60 ± 68.05 | <0.0001 | 2673.37 ± 77.82 | 2347.22 ± 57.35 | <0.0001 |
| Vitamin A (µg RAE) | 335.50 ± 11.16 | 406.76 ± 42.80 | 322.47 ± 13.26 | 0.0252 | 365.13 ± 22.44 | 291.14 ± 12.93 | 0.0001 |
| Carotene (μg) | 2898.12 ± 85.02 | 3215.74 ± 190.08 | 2920.45 ± 147.59 | 0.0012 | 3156.32 ± 204.43 | 2558.07 ± 128.67 | 0.0456 |
| Retinol (μg) | 93.95 ± 8.28 | 138.81 ± 39.67 | 79.09 ± 4.80 | 0.1213 | 102.11 ± 10.69 | 77.85 ± 6.88 | 0.0244 |
| Thiamin(mg) | 1.11 ± 0.01 | 1.46 ± 0.04 | 1.09 ± 0.02 | <0.0001 | 1.15 ± 0.03 | 0.92 ± 0.02 | <0.0001 |
| Riboflavin(mg) | 1.24 ± 0.02 | 1.51 ± 0.05 | 1.29 ± 0.03 | <0.0001 | 1.25 ± 0.04 | 1.03 ± 0.03 | <0.0001 |
| Niacin (mg) | 10.53 ± 0.14 | 13.39 ± 0.34 | 11.13 ± 0.28 | <0.0001 | 10.15 ± 0.26 | 8.55 ± 0.19 | <0.0001 |
| Folate (μg DFE) | 326.25 ± 4.87 | 369.18 ± 9.48 | 355.38 ± 9.37 | 0.0008 | 312.43 ± 9.54 | 282.44 ± 6.51 | <0.0001 |
| Vitamin C (mg) | 63.51 ± 1.96 | 69.02 ± 4.63 | 61.66 ± 2.71 | 0.0007 | 70.33 ± 4.94 | 58.43 ± 3.36 | 0.0004 |
| Vitamin B6 (mg) | 0.92 ± 0.04 | 1.13 ± 0.09 | 1.03 ± 0.07 | 0.5481 | 0.83 ± 0.06 | 0.76 ± 0.06 | 0.0689 |
| Vitamin B12 (μg) | 4.58 ± 0.18 | 4.88 ± 0.31 | 5.56 ± 0.37 | 0.0085 | 4.29 ± 0.45 | 3.67 ± 0.22 | 0.0010 |
| Magnesium (mg) | 301.26 ± 3.78 | 345.58 ± 8.69 | 329.88 ± 7.11 | <0.0001 | 285.81 ± 7.51 | 258.04 ± 5.16 | <0.0001 |
| Zinc (mg) | 11.59 ± 0.21 | 13.10 ± 0.37 | 12.54 ± 0.42 | 0.1170 | 11.06 ± 0.38 | 10.15 ± 0.30 | 0.0006 |
| Selenium (μg) | 67.52 ± 1.48 | 89.59 ± 3.40 | 66.65 ± 2.09 | <0.0001 | 70.26 ± 2.82 | 54.35 ± 2.42 | <0.0001 |
| Fiber (g) | 27.31 ± 0.45 | 30.11 ± 0.86 | 29.25 ± 0.79 | 0.0084 | 26.69 ± 0.83 | 24.26 ± 0.65 | <0.0001 |
| KHEI Score and Components | All (n = 1254) | Men | Women | ||||
|---|---|---|---|---|---|---|---|
| Consumers (n = 235) | Non-Consumers (n = 363) | p- Value | Consumers (n = 207) | Non-Consumers (n = 449) | p- Value | ||
| KHEI score | 67.46 ± 0.46 | 67.91 ± 0.93 | 65.74 ± 0.74 | 0.0308 | 70.88 ± 0.96 | 67.00 ± 0.73 | <0.0001 |
| KHEI component | |||||||
| Meat, fish, egg, and bean intake (serving/day) | 6.78 ± 0.12 | 7.58 ± 0.22 | 6.49 ± 0.20 | <0.0001 | 7.93 ± 0.22 | 6.03 ± 0.19 | <0.0001 |
| Have breakfast (times/week) | 9.43 ± 0.08 | 9.51 ± 0.15 | 9.59 ± 0.11 | 0.0117 | 9.53 ± 0.19 | 9.20 ± 0.14 | 0.0281 |
| Mixed grains intake (serving/day) | 2.50 ± 0.08 | 2.42 ± 0.17 | 2.61 ± 0.13 | 0.2554 | 2.50 ± 0.17 | 2.45 ± 0.13 | 0.4235 |
| Total fruit intake (serving/day) | 2.80 ± 0.09 | 2.57 ± 0.18 | 2.43 ± 0.15 | 0.1579 | 3.21 ± 0.18 | 3.04 ± 0.16 | <0.0001 |
| Fresh fruit intake (serving/day) | 2.89 ± 0.09 | 2.68 ± 0.19 | 2.62 ± 0.16 | 0.6017 | 3.29 ± 0.18 | 3.05 ± 0.16 | 0.001 |
| Total vegetable intake (serving/day) | 3.74 ± 0.05 | 4.07 ± 0.09 | 3.61 ± 0.09 | 0.0003 | 3.86 ± 0.10 | 3.59 ± 0.09 | <0.0001 |
| Vegetable intake excluding Kimchi and pickled vegetable intake (serving/day) | 3.32 ± 0.06 | 3.31 ± 0.12 | 3.02 ± 0.09 | 0.011 | 3.72 ± 0.13 | 3.37 ± 0.09 | <0.0001 |
| Milk and milk products intake (serving/day) | 2.62 ± 0.15 | 2.49 ± 0.34 | 2.15 ± 0.23 | 0.2861 | 2.76 ± 0.33 | 3.02 ± 0.26 | 0.0220 |
| Percent energy from SFA (% of total energy intake) | 9.04 ± 0.08 | 8.88 ± 0.18 | 9.26 ± 0.12 | 0.2728 | 8.36 ± 0.27 | 9.26 ± 0.11 | 0.0155 |
| Sodium intake (mg/day) | 7.66 ± 0.10 | 6.44 ± 0.25 | 7.25 ± 0.17 | 0.0051 | 7.96 ± 0.20 | 8.52 ± 0.14 | <0.0001 |
| Percent energy from sweets and beverages (% of total energy intake) | 9.36 ± 0.07 | 9.33 ± 0.15 | 9.23 ± 0.15 | 0.4244 | 9.52 ± 0.13 | 9.40 ± 0.12 | 0.6741 |
| Percent energy from carbohydrate (% of total energy intake) | 1.63 ± 0.07 | 2.21 ± 0.16 | 1.60 ± 0.11 | 0.0028 | 2.16 ± 0.18 | 1.09 ± 0.09 | <0.0001 |
| Percent energy intake from fat (% of total energy intake) | 2.46 ± 0.08 | 3.20 ± 0.16 | 2.39 ± 0.13 | 0.0004 | 2.99 ± 0.20 | 1.86 ± 0.12 | <0.0001 |
| Energy intake (% of the EER) | 3.24 ± 0.07 | 3.22 ± 0.18 | 3.49 ± 0.12 | 0.4786 | 3.09 ± 0.18 | 3.12 ± 0.11 | 0.6345 |
| Blood Biomarkers | All | Men | Women | ||||
|---|---|---|---|---|---|---|---|
| Consumers | Non-Consumers | p-Value | Consumers | Non-Consumers | p-Value | ||
| Hemoglobin (g/dL) | n = 1966 | n = 358 | n = 588 | n = 343 | n = 677 | ||
| 13.81 ± 0.04 | 14.69 ± 0.08 | 14.50 ± 0.07 | <0.0001 | 13.04 ± 0.07 | 13.09 ± 0.04 | 0.0003 | |
| Hematocrit (%) | n = 1966 | n = 358 | n = 588 | n = 343 | n = 677 | ||
| 42.07 ± 0.12 | 44.44 ± 0.24 | 43.92 ± 0.22 | <0.0001 | 39.95 ± 0.21 | 40.14 ± 0.13 | 0.0031 | |
| FBG (mg/dL) | n = 1971 | n = 359 | n = 588 | n = 346 | n = 678 | ||
| 100.05 ± 0.44 | 100.74 ± 1.02 | 102.15 ± 0.87 | 0.3373 | 99.13 ± 0.99 | 98.20 ± 0.68 | 0.0957 | |
| HbA1c (%) | n = 1966 | n = 358 | n = 588 | n = 343 | n = 677 | ||
| 5.74 ± 0.01 | 5.72 ± 0.04 | 5.76 ± 0.03 | 0.6393 | 5.76 ± 0.04 | 5.72 ± 0.02 | 0.4849 | |
| hs-CRP (mg/L) | n = 1159 | n = 221 | n = 336 | n = 199 | n = 403 | ||
| 1.45 ± 0.10 | 1.55 ± 0.23 | 1.73 ± 0.20 ** | 0.0252 | 1.04 ± 0.08 | 1.37 ± 0.18 | 0.135 | |
| Creatinine (mg/dL) | n = 1971 | n = 359 | n = 588 | n = 346 | n = 678 | ||
| 0.82 ± 0.01 | 0.94 ± 0.01 | 0.93 ± 0.01 | 0.0011 | 0.69 ± 0.01 | 0.71 ± 0.01 | <.0001 | |
| BUN (mg/dL) | n = 1971 | n = 359 | n = 588 | n = 346 | n = 678 | ||
| 16.69 ± 0.14 | 17.17 ± 0.27 | 17.13 ± 0.32 | 0.1566 | 16.37 ± 0.26 | 16.18 ± 0.21 | 0.0379 | |
| TC (mg/dL) | n = 1971 | n = 359 | n = 588 | n = 346 | n = 678 | ||
| 200.23 ± 0.94 | 193.43 ± 1.96 | 190.50 ± 1.67 | 0.0057 | 211.87 ± 2.14 | 206.79 ± 1.65 | 0.0011 | |
| HDL-c (mg/dL) | n = 1971 | n = 359 | n = 588 | n = 346 | n = 678 | ||
| 49.78 ± 0.33 | 48.38 ± 0.73 | 47.77 ± 0.57 | 0.2112 | 53.10 ± 0.77 | 50.60 ± 0.56 | 0.0399 | |
| LDL-c (mg/dL) | n = 1971 | n = 359 | n = 588 | n = 346 | n = 678 | ||
| 125.54 ± 0.82 | 119.29 ± 1.67 | 118.33 ± 1.41 | 0.0371 | 134.12 ± 1.98 | 131.12 ±1.47 | 0.0006 | |
| TG (mg/dL) | n = 1971 | n = 359 | n = 588 | n = 346 | n = 678 | ||
| 124.59 ± 1.88 | 128.79 ± 4.40 | 122.02 ± 3.15 | 0.1005 | 123.20 ± 3.78 | 125.30 ± 3.49 | 0.2649 | |
| Measurement | All | Men | Women | ||||
|---|---|---|---|---|---|---|---|
| Consumers | Non-Consumers | p-Value | Consumers | Non-Consumers | p-Value | ||
| Hand grip strength (kg) | n = 1600 | n = 290 | n = 477 | n = 271 | n = 562 | ||
| 26.32 ± 0.26 | 33.84 ± 0.52 | 31.91 ± 0.40 | <0.0001 | 20.76 ± 0.34 | 19.99 ± 0.22 | <0.0001 | |
| BMI (kg/m2) | n = 2041 | n = 367 | n = 612 | n = 354 | n = 708 | ||
| 23.01 ± 0.08 | 22.95 ± 0.18 | 22.57 ± 0.14 | 0.0004 | 23.24 ± 0.18 | 23.34 ± 0.15 | 0.0108 | |
| Waist circumference (cm) | n = 2062 | n = 371 | n = 617 | n = 358 | n = 716 | ||
| 83.06 ± 0.24 | 85.31 ± 0.53 | 84.06 ± 0.42 | 0.2621 | 81.47 ± 0.51 | 81.71 ± 0.43 | 0.8723 | |
| Blood pressure | n = 2059 | n = 370 | n = 618 | n = 358 | n = 713 | ||
| SBP (mm Hg) | 126.84 ± 0.50 | 126.27 ± 0.98 | 126.05 ± 0.83 | <0.0001 | 122.28 ± 0.22 | 128.18 ± 0.87 | <0.0001 |
| DBP (mm Hg) | 73.62 ± 0.27 | 73.50 ± 0.66 | 73.15 ± 0.45 | <0.0001 | 72.48 ± 0.14 | 73.45 ± 0.46 | 0.0029 |
Disclaimer/Publisher’s Note: The statements, opinions and data contained in all publications are solely those of the individual author(s) and contributor(s) and not of MDPI and/or the editor(s). MDPI and/or the editor(s) disclaim responsibility for any injury to people or property resulting from any ideas, methods, instructions or products referred to in the content. |
© 2024 by the authors. Licensee MDPI, Basel, Switzerland. This article is an open access article distributed under the terms and conditions of the Creative Commons Attribution (CC BY) license (https://creativecommons.org/licenses/by/4.0/).
Share and Cite
Jung, A.-J.; Sharma, A.; Chung, M.; Wallace, T.C.; Lee, H.-J. The Relationship of Pork Meat Consumption with Nutrient Intakes, Diet Quality, and Biomarkers of Health Status in Korean Older Adults. Nutrients 2024, 16, 4188. https://doi.org/10.3390/nu16234188
Jung A-J, Sharma A, Chung M, Wallace TC, Lee H-J. The Relationship of Pork Meat Consumption with Nutrient Intakes, Diet Quality, and Biomarkers of Health Status in Korean Older Adults. Nutrients. 2024; 16(23):4188. https://doi.org/10.3390/nu16234188
Chicago/Turabian StyleJung, Ah-Jin, Anshul Sharma, Mei Chung, Taylor C. Wallace, and Hae-Jeung Lee. 2024. "The Relationship of Pork Meat Consumption with Nutrient Intakes, Diet Quality, and Biomarkers of Health Status in Korean Older Adults" Nutrients 16, no. 23: 4188. https://doi.org/10.3390/nu16234188
APA StyleJung, A.-J., Sharma, A., Chung, M., Wallace, T. C., & Lee, H.-J. (2024). The Relationship of Pork Meat Consumption with Nutrient Intakes, Diet Quality, and Biomarkers of Health Status in Korean Older Adults. Nutrients, 16(23), 4188. https://doi.org/10.3390/nu16234188