Influence of Socioeconomic Status on the Retail Food Environment in Alicante

 , , ,
, , ,
Abstract

1. Introduction
2. Materials and Methods
2.1. Study Design and Sample
2.2. Data Collection
2.3. Measures
2.4. Data Analysis
3. Results
3.1. Descriptive Data
3.2. Food Availability and Price
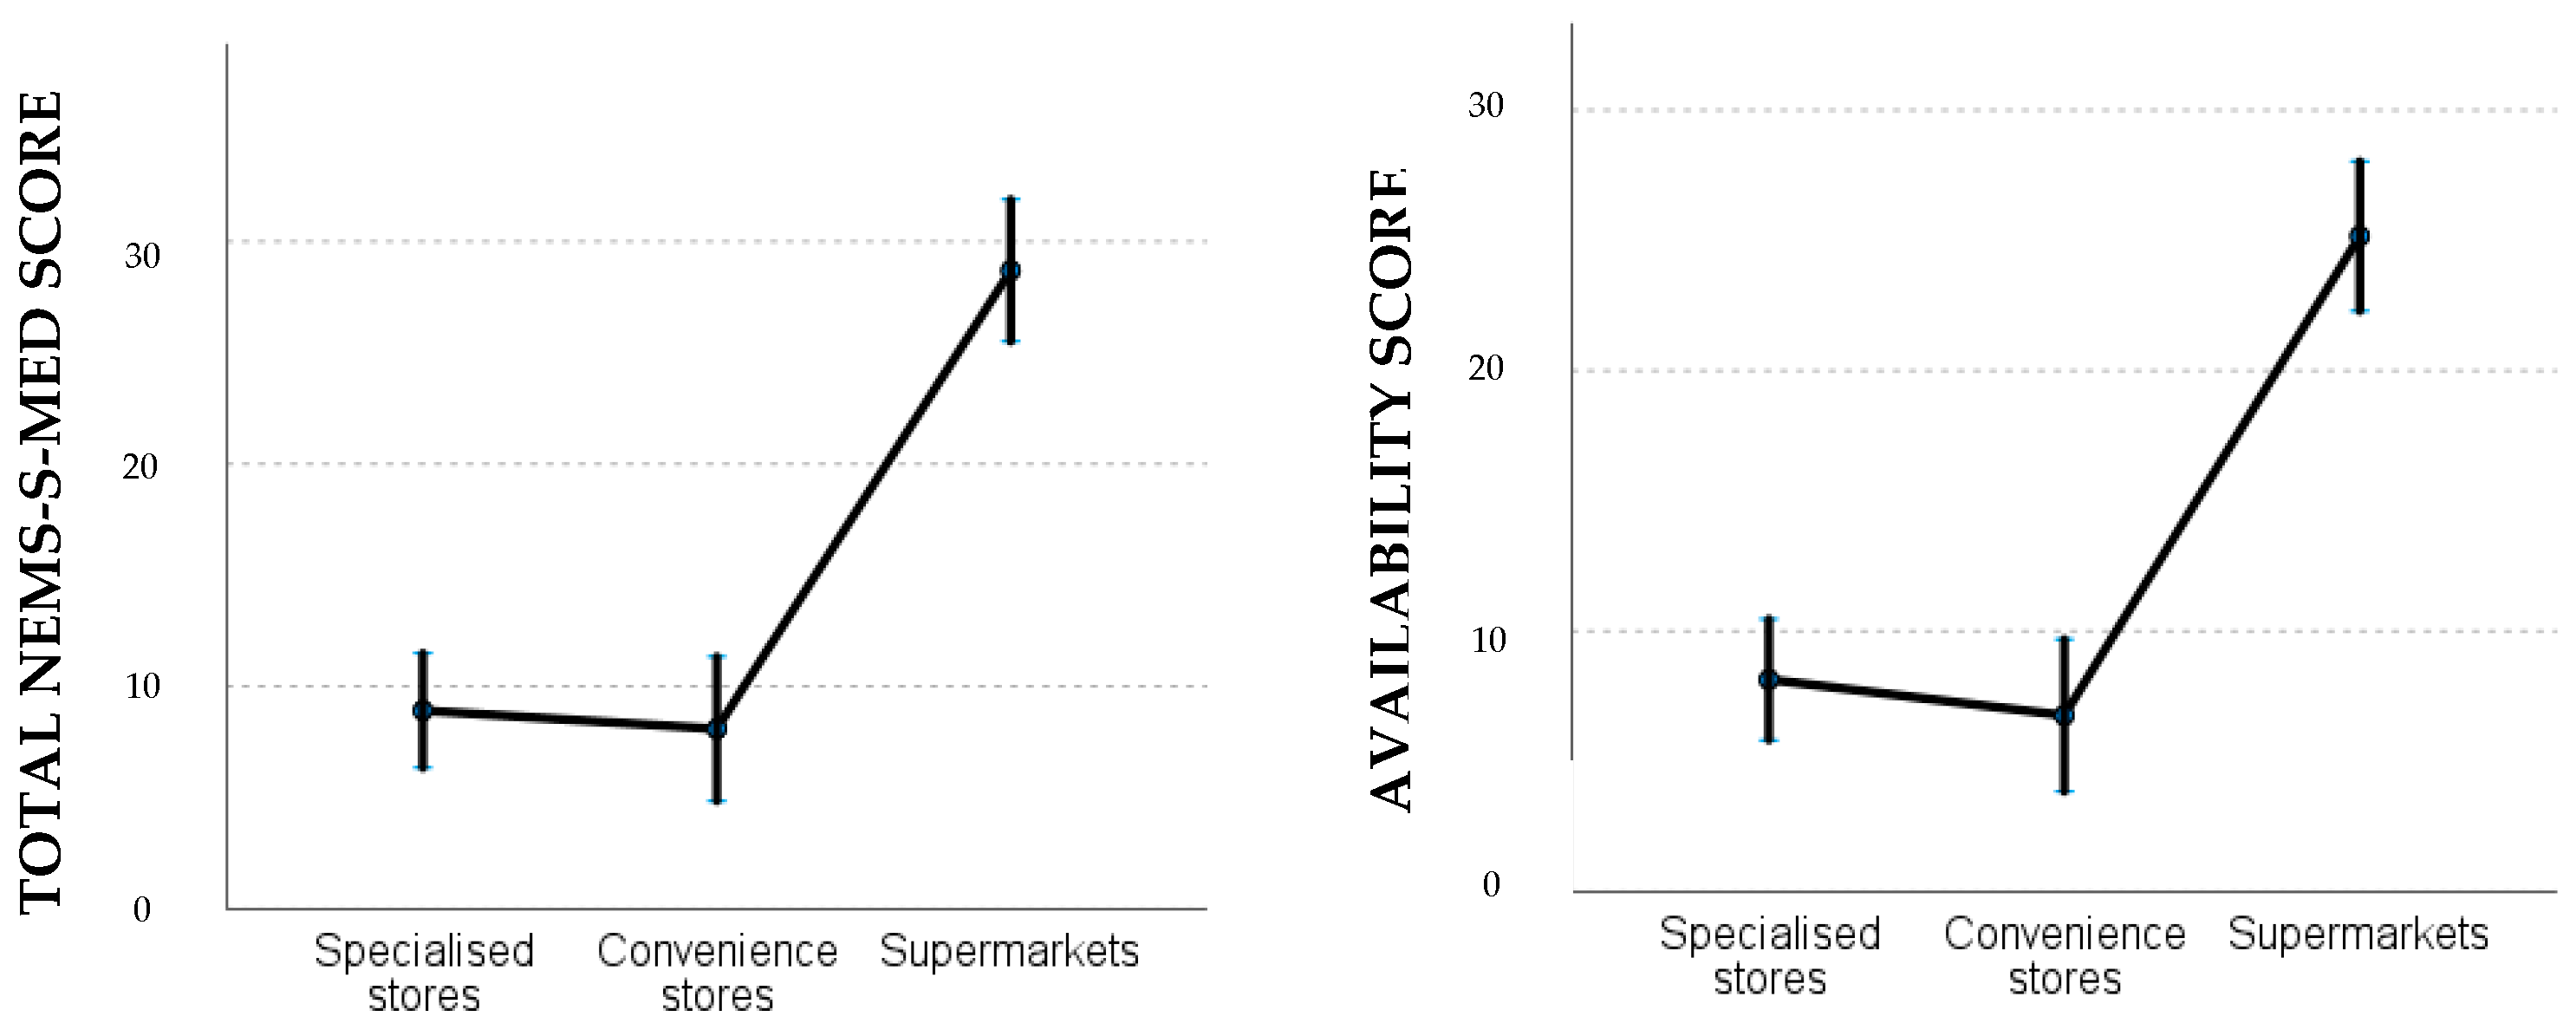
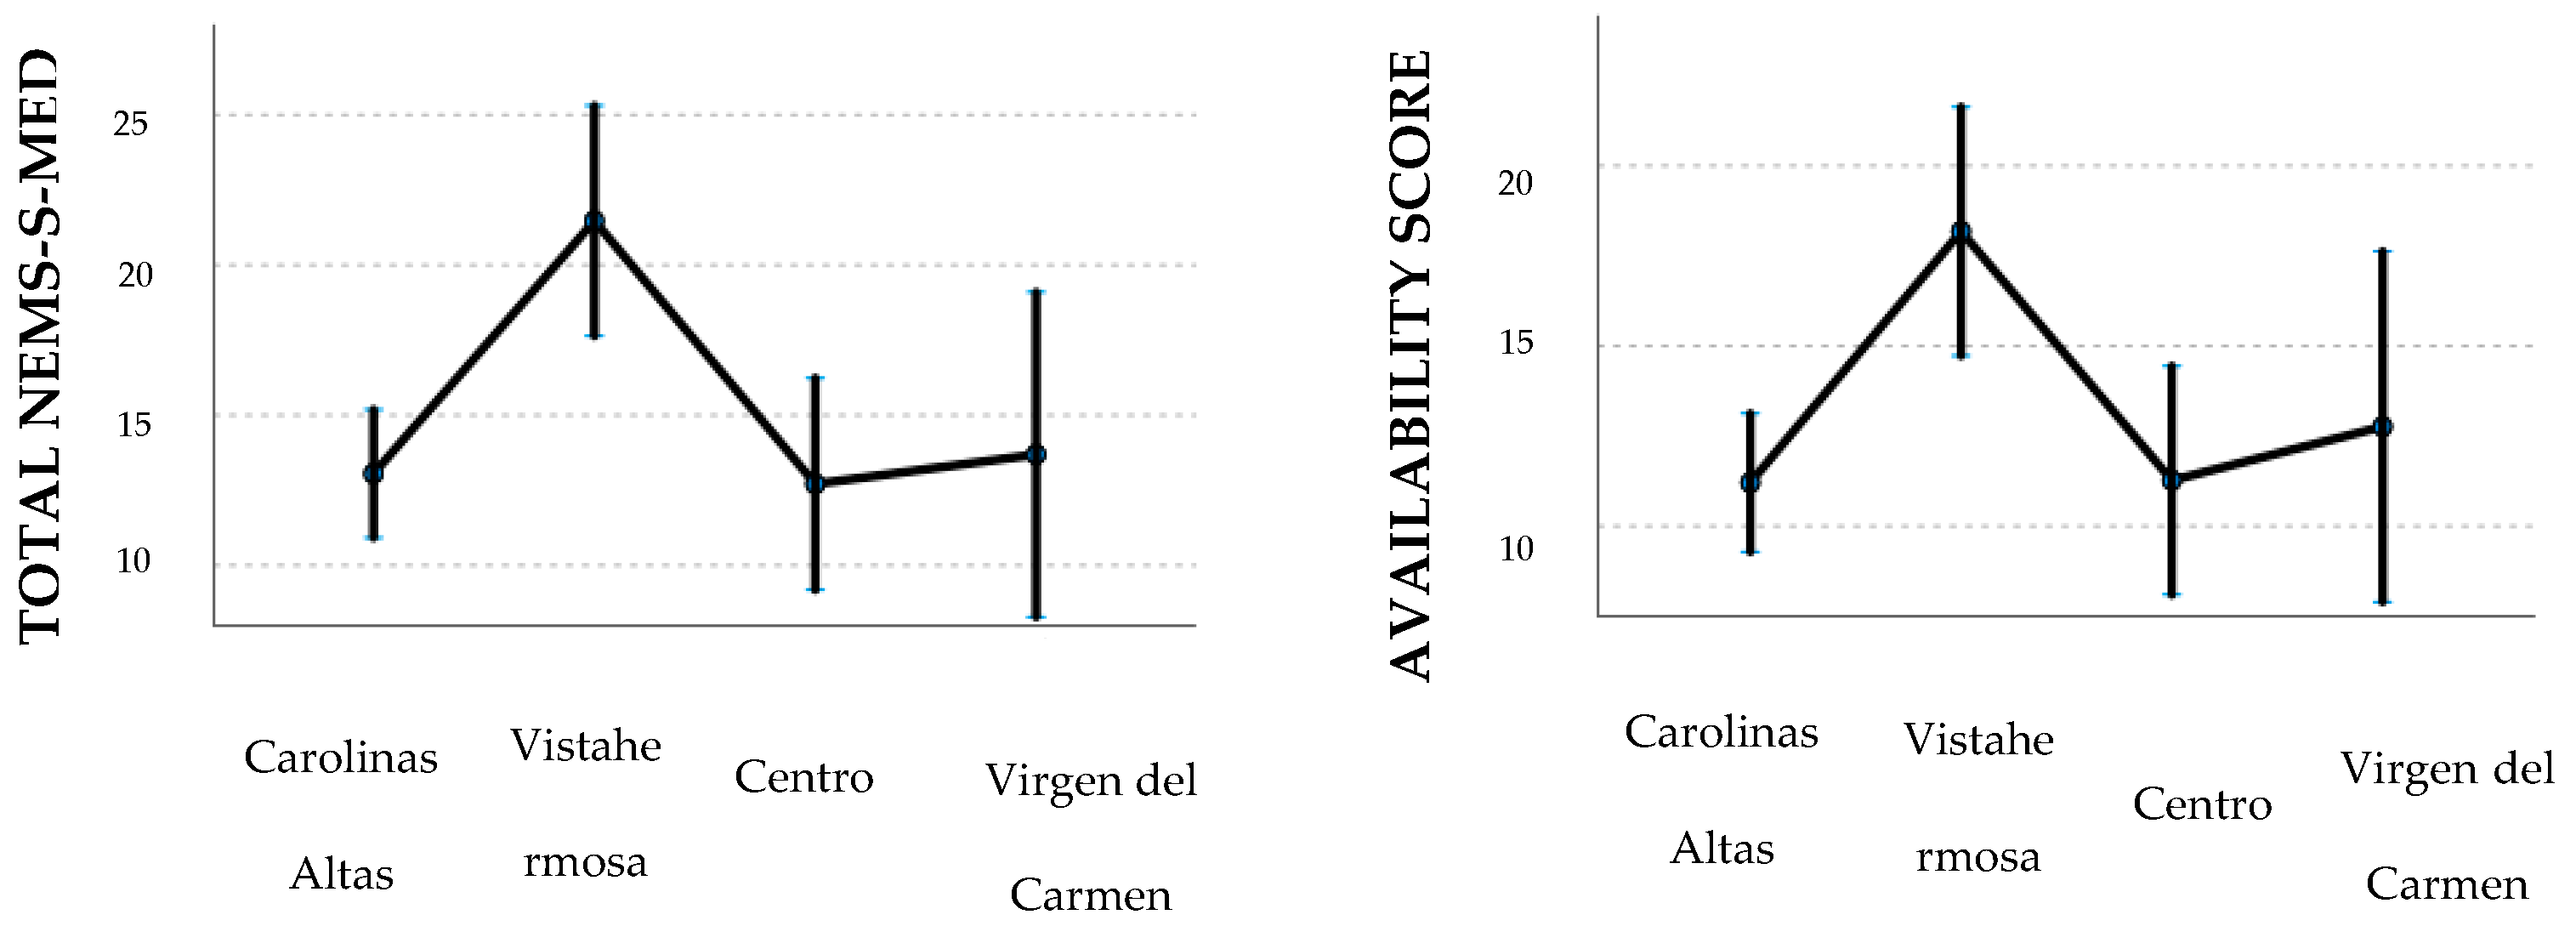
3.3. NEMS-S-MED Score
4. Discussion
Limitations and Strengths
5. Conclusions
Supplementary Materials
Author Contributions
Funding
Institutional Review Board Statement
Informed Consent Statement
Data Availability Statement
Conflicts of Interest
References
- Abarca-Gómez, L.; Abdeen, Z.; Hamid, Z.A.; Abu-Rmeileh, N.; Acosta-Cazares, B.; Acuin, C.; Adams, R.; Aekplakorn, W.; Afsana, K.; Aguilar-Salinas, C.; et al. Worldwide trends in body-mass index, underweight, overweight, and obesity from 1975 to 2016: A pooled analysis of 2416 population-based measurement studies in 128·9 million children, adolescents, and adults. Lancet 2017, 390, 2627–2642. [Google Scholar] [CrossRef] [PubMed]
- World Health Organization: WHO. (1 March 2024). Fact Sheets. Obesity and Overweight. [Internet]. Available online: https://www.who.int/es/news-room/fact-sheets/detail/obesity-and-overweight (accessed on 1 March 2024).
- Ministerio de Sanidad, Consumo y Bienestar Social—Portal Estadístico del SNS—Encuesta Nacional de Salud de España 2017. (s. f.). Available online: https://www.mscbs.gob.es/estadEstudios/estadisticas/encuestaNacional/encuesta2017.htm (accessed on 1 March 2024).
- Kent, S.; Fusco, F.; Gray, A.; Jebb, S.A.; Cairns, B.J.; Mihaylova, B. Body mass index and healthcare costs: A systematic literature review of individual participant data studies. Obes. Rev. 2017, 18, 869–879. [Google Scholar] [CrossRef] [PubMed]
- Afshin, A.; Sur, P.J.; Fay, K.A.; Cornaby, L.; Ferrara, G.; Salama, J.S.; Mullany, E.C.; Abate, K.H.; Abbafati, C.; Abebe, Z.; et al. Health effects of dietary risks in 195 countries, 1990–2017: A systematic analysis for the Global Burden of Disease Study 2017. Lancet 2019, 393, 1958–1972. [Google Scholar] [CrossRef] [PubMed]
- Lake, A.; Townshend, T. Obesogenic environments: Exploring the built and food environments. J. R. Soc. Promot. Health 2006, 126, 262–267. [Google Scholar] [CrossRef] [PubMed]
- Townshend, T.; Lake, A. Obesogenic environments: Current evidence of the built and food environments. Perspect. Public Health 2017, 137, 38–44. [Google Scholar] [CrossRef] [PubMed]
- Friel, S.; Hattersley, L.; Ford, L.; O’Rourke, K. Addressing inequities in healthy eating. Health Promot. Int. 2015, 30 (Suppl. S2), ii77–ii88. [Google Scholar] [CrossRef] [PubMed]
- Black, C.; Moon, G.; Baird, J. Dietary inequalities: What is the evidence for the effect of the neighbourhood food environment? Health Place 2014, 27, 229–242. [Google Scholar] [CrossRef]
- Gustafson, A.; Hankins, S.; Jilcott, S. Measures of the consumer food store environment: A systematic review of the evidence 2000–2011. J. Community Health 2012, 37, 897–911. [Google Scholar] [CrossRef]
- Caspi, C.E.; Sorensen, G.; Subramanian, S.; Kawachi, I. The local food environment and diet: A systematic review. Health Place 2012, 18, 1172–1187. [Google Scholar] [CrossRef]
- Fernández-Escobar, C.; Díez, J.; Martínez-García, A.; Bilal, U.; O’Flaherty, M.; Franco, M. Food availability and affordability in a Mediterranean urban context: Associations by store type and area-level socio-economic status. Public Health Nutr. 2023, 26, 446–454. [Google Scholar] [CrossRef]
- Díez, J.; Bilal, U.; Cebrecos, A.; Buczynski, A.; Lawrence, R.S.; Glass, T.; Escobar, F.; Gittelsohn, J.; Franco, M. Understanding differences in the local food environment across countries: A case study in Madrid (Spain) and Baltimore (USA). Prev. Med. 2016, 89, 237–244. [Google Scholar] [CrossRef] [PubMed]
- INE—Instituto Nacional de Estadística. Indicadores de Renta Media y Mediana (30833). INE 2019. Available online: https://www.ine.es/jaxiT3/Tabla.htm?t=30833 (accessed on 13 February 2024).
- Bilal, U.; Díez, J.; Alfayate, S.; Gullón, P.; Del Cura, I.; Escobar, F.; Sandín, M.; Franco, M. Population cardiovascular health and urban environments: The Heart Healthy Hoods exploratory study in Madrid, Spain. BMC Med. Res. Methodol. 2016, 16, 104. [Google Scholar] [CrossRef]
- Martínez-García, A.; Díez, J.; Fernández-Escobar, C.; Trescastro-López, E.M.; Pereyra-Zamora, P.; Ariza, C.; Bilal, U.; Franco, M. Adaptation and Evaluation of the Nutrition Environment Measures Survey in Stores to Assess Mediterranean Food Environments (NEMS-S-MED). Int. J. Environ. Res. Public Health 2020, 17, 7031. [Google Scholar] [CrossRef] [PubMed]
- Díez, J.; Bilal, U.; Franco, M. Unique features of the Mediterranean food environment: Implications for the prevention of chronic diseases Rh: Mediterranean food environments. Eur. J. Clin. Nutr. 2018, 72, 71–75. [Google Scholar] [CrossRef]
- Cauchi, D.; Pliakas, T.; Knai, C. Food environments in Malta: Associations with store size and area-level deprivation. Food Policy 2017, 71, 39–47. [Google Scholar] [CrossRef]
- Harmer, G.; Jebb, S.A.; Ntani, G.; Vogel, C.; Piernas, C. Capturing the Healthfulness of the In-store Environments of United Kingdom Supermarket Stores Over 5 Months (January–May 2019). Am. J. Prev. Med. 2021, 61, e171–e179. [Google Scholar] [CrossRef]
- Millichamp, A.; Gallegos, D. Comparing the availability, price, variety and quality of fruits and vegetables across retail outlets and by area-level socio-economic position. Public Health Nutr. 2012, 16, 171–178. [Google Scholar] [CrossRef]
- Stroebele-Benschop, N.; Wolf, K.; Palmer, K.; Kelley, C.J.; Pitts, S.B.J. Comparison of food and beverage products’ availability, variety, price and quality in German and US supermarkets. Public Health Nutr. 2020, 23, 3387–3393. [Google Scholar] [CrossRef]
- Liu, Y.; Song, S.; Gittelsohn, J.; Jiang, N.; Hu, J.; Ma, Y.; Wen, D. Adaptation and Validation of the Chinese Version of the Nutrition Environment Measurement Tool for Stores. Int. J. Environ. Res. Public Health 2019, 16, 782. [Google Scholar] [CrossRef]
- Londoño-Cañola, C.; Serral, G.; Díez, J.; Martínez-García, A.; Franco, M.; Artazcoz, L.; Ariza, C. Retail Food Environment around Schools in Barcelona by Neighborhood Socioeconomic Status: Implications for Local Food Policy. Int. J. Environ. Res. Public Health 2022, 20, 649. [Google Scholar] [CrossRef]
- Hawkes, C. Dietary Implications of Supermarket Development: A Global Perspective. Dev. Policy Rev. 2008, 26, 657–692. [Google Scholar] [CrossRef]
- Martínez-García, A.; Trescastro-López, E.M.; Galiana-Sánchez, M.E.; Llorens-Ivorra, C.; Pereyra-Zamora, P. Cultural Adaptation and Evaluation of the Perceived Nutrition Environment Measures Survey to the Mediterranean Spanish Context (NEMS-P-MED). Nutrients 2020, 12, 3257. [Google Scholar] [CrossRef]
- Bilal, U.; Jones-Smith, J.; Diez, J.; Lawrence, R.S.; Celentano, D.D.; Franco, M. Neighborhood social and economic change and retail food environment change in Madrid (Spain): The heart healthy hoods study. Health Place 2018, 51, 107–117. [Google Scholar] [CrossRef]
- Achón, M.; Serrano, M.; García-González, Á.; Alonso-Aperte, E.; Varela-Moreiras, G. Present Food Shopping Habits in the Spanish Adult Population: A Cross-Sectional Study. Nutrients 2017, 9, 508. [Google Scholar] [CrossRef]
- Shaw, S.C.; Ntani, G.; Baird, J.; A Vogel, C. A systematic review of the influences of food store product placement on dietary related outcomes. Nutr. Rev. 2020, 78, 1030–1045. [Google Scholar] [CrossRef]
- Bodor, J.N.; Rose, D.; Farley, T.A.; Swalm, C.; Scott, S.K. Neighbourhood fruit and vegetable availability and consumption: The role of small food stores in an urban environment. Public Health Nutr. 2008, 11, 413–420. [Google Scholar] [CrossRef]
- Black, C.; Ntani, G.; Inskip, H.; Cooper, C.; Cummins, S.; Moon, G.; Baird, J. Measuring the healthfulness of food retail stores: Variations by store type and neighbourhood deprivation. Int. J. Behav. Nutr. Phys. Act. 2014, 11, 69. [Google Scholar] [CrossRef]
- Goossensen, M.; Garcia, X.; Garcia-Sierra, M.; Calvet-Mir, L.; Domene, E. The role of convenience stores in healthy food environments: The case of Barcelona (Spain). Cities 2023, 133, 104118. [Google Scholar] [CrossRef]
- Pechey, R.; Monsivais, P. Supermarket Choice, Shopping Behavior, Socioeconomic Status, and Food Purchases. Am. J. Prev. Med. 2015, 49, 868–877. [Google Scholar] [CrossRef] [PubMed] [PubMed Central]
- Fernqvist, F.; Spendrup, S.; Tellström, R. Understanding food choice: A systematic review of reviews. Heliyon 2024, 10, e32492. [Google Scholar] [CrossRef]
- Thow, A.M.; Downs, S.M.; Mayes, C.; Trevena, H.; Waqanivalu, T.; Cawley, J. Fiscal policy to improve diets and prevent noncommunicable diseases: From recommendations to action. Bull. World Health Organ. 2018, 96, 201–210. [Google Scholar] [CrossRef] [PubMed]
- Gomes, C.S.; Silveira, E.A.; Velasquez-Melendez, G. Neighborhood environment is associated with unhealthy food intake in a Brazilian urban area. Appetite 2022, 172, 105972. [Google Scholar] [CrossRef]

| Type of Food Store | Total | Neighborhood | ||||||||
|---|---|---|---|---|---|---|---|---|---|---|
| High Economic Level | Low Economic Level | |||||||||
| Vistahermosa | Centro | Carolinas Altas | Virgen del Carmen | |||||||
| n | % | n | % | n | % | n | % | n | % | |
| Supermarkets | 16 | 25.4 | 4 | 40.0 | 5 | 41.7 | 6 | 16.7 | 1 | 20.0 |
| Convenience stores | 16 | 25.4 | 2 | 20.0 | 2 | 16.7 | 10 | 27.8 | 2 | 40.0 |
| Specialized stores | 31 | 49.3 | 4 | 40.0 | 5 | 41.7 | 20 | 55.6 | 2 | 40.0 |
| Total | 63 | 100 | 10 | 100 | 12 | 100 | 36 | 5 | 100 | |
| Food Item | Type of Food Store | Neighborhood | |||||||||
|---|---|---|---|---|---|---|---|---|---|---|---|
| Supermarket | Convenience Stores | Specialized Stores | Total | Sig | Vistahermosa | Centro | Carolinas Altas | Virgen del Carmen | Total | Sig (b) | |
| Fresh fruit | 93.8% | 18.8% | 35.5% | 46.0% | <0.001 (a) | 70.0% | 66.7% | 30.6% | 60% | 46.0% | 0.037 |
| Fresh vegetables | 93.8% | 18.8% | 38.7% | 47.6% | <0.001 (a) | 70.0% | 66.7% | 33.3% | 60% | 47.6% | 0.067 |
| Potatoes | 93.8% | 12.5% | 41.9% | 47.6% | <0.001 (a) | 60.0% | 66.7% | 36.1% | 60% | 47.6% | 0.204 |
| Frozen vegetables | 75.0% | 18.8% | 9.7% | 28.6% | <0.001 (b) | 60.0% | 33.3% | 19.4% | 20% | 28.6% | 0.093 |
| Unprocessed nuts | 87.5% | 25.0% | 32.3% | 44.4% | <0.001 (a) | 80.0% | 33.3% | 41.7% | 20% | 44.4% | 0.079 |
| Salty nuts | 81.3% | 93.8% | 29.0% | 58.7% | <0.001 (a) | 80.0% | 41.7% | 58.3% | 60% | 58.7% | 0.353 |
| Light cola drink | 93.8% | 93.8% | 54.8% | 74.6% | 0.002 (b) | 70.0% | 66.7% | 80.6% | 60% | 74.6% | 0.553 |
| Regular cola drink | 93.8% | 93.8% | 61.3% | 77.8% | 0.012 (b) | 70.0% | 66.7% | 86.1% | 60% | 77.8% | 0.236 |
| Juice 100% | 68.8% | 12.5% | 9.7% | 25.4% | <0.001 (b) | 50.0% | 41.7% | 11.1% | 40% | 25.4% | 0.012 |
| Not-100% juice | 87.5% | 75.0% | 48.4% | 65.1% | 0.018 (a) | 70.0% | 33.3% | 77.8% | 40% | 65.1% | 0.041 |
| Whole bread | 81.3% | 25.0% | 35.5% | 44.4% | 0.002 (a) | 90.0% | 50.0% | 33.3% | 20% | 44.4% | 0.006 |
| Low sugar cereals | 56.3% | -- | 19.4% | 23.8% | <0.001 (b) | 30.0% | 41.7% | 19.4% | 0% | 23.8% | 0.270 |
| Regular cereals | 93.8% | 37.5% | 9.7% | 38.1% | <0.001 (a) | 60.0% | 50.0% | 30.6% | 20% | 38.1% | 0.248 |
| Confectionery | 93.8% | 100.0% | 54.8% | 76.2% | <0.001 (b) | 80.0% | 58.3% | 80.6% | 80% | 76.2% | 0.453 |
| Skimmed milk | 100.0% | 37.5% | 22.6% | 46.0% | <0.001 (a) | 70.0% | 58.3% | 38.9% | 20% | 46.0% | 0.185 |
| Semi-skimmed milk | 100.0% | 56.3% | 25.8% | 52.4% | <0.001 (a) | 70.0% | 66.7% | 47.2% | 20% | 52.4% | 0.210 |
| Whole milk | 100.0% | 75.0% | 29.0% | 58.7% | <0.001 (a) | 80.0% | 66.7% | 50.0% | 60% | 58.7% | 0.359 |
| Skimmed yogurt | 68.8% | -- | 3.2% | 19.0% | <0.001 (b) | 30.0% | 33.3% | 13.9% | 0% | 19.0% | 0.277 |
| Semi-hard cheese | 100.0% | 37.5% | 19.4% | 44.4% | <0.001 (a) | 70.0% | 50.0% | 33.3% | 60% | 44.4% | 0.156 |
| Fresh cheese | 100.0% | 31.3% | 22.6% | 44.4% | <0.001 (a) | 70.0% | 41.7% | 36.1% | 60% | 44.4% | 0.255 |
| Eggs | 100.0% | 62.5% | 77.4% | 79.4% | 0.018 (b) | 100.0% | 75.0% | 72.2% | 100% | 79.4% | 0.181 |
| Olive oil | 93.8% | 43.8% | 25.8% | 47.6% | <0.001 (a) | 80.0% | 41.7% | 38.9% | 60% | 47.6% | 0.124 |
| Sunflower oil | 75.0% | 37.5% | 19.4% | 38.1% | <0.001 (a) | 40.0% | 41.7% | 33.3% | 60% | 38.1% | 0.639 |
| Salt-free butter | 87.5% | 12.5% | 9.7% | 30.2% | <0.001 (b) | 40.0% | 41.7% | 25.0% | 20% | 30.2% | 0.605 |
| Regular butter | 93.8% | 50.0% | 12.9% | 42.9% | <0.001 (a) | 50.0% | 50.0% | 33.3% | 80% | 42.9% | 0.210 |
| Whole rice | 75.0% | 6.3% | 3.2% | 22.2% | <0.001 (b) | 40.0% | 33.3% | 11.1% | 40% | 22.2% | 0.054 |
| White rice | 100.0% | 75.0% | 29.0% | 58.7% | <0.001 (a) | 70.0% | 50.0% | 58.3% | 60% | 58.7% | 0.854 |
| Legumes | 100.0% | 75.0% | 41.9% | 65.1% | <0.001 (a) | 90.0% | 75.0% | 55.6% | 60% | 65.1% | 0.182 |
| Beef | 62.5% | -- | 29.0% | 30.2% | <0.001 (b) | 50.0% | 16.7% | 27.8% | 40% | 30.2% | 0.345 |
| Chicken | 75.0% | -- | 29.0% | 33.3% | <0.001 (a) | 50.0% | 25.0% | 30.6% | 40% | 33.3% | 0.628 |
| Sausage | 93.8% | 56.3% | 29.0% | 52.4% | <0.001 (a) | 70.0% | 58.3% | 41.7% | 80% | 52.4% | 0.225 |
| Fresh fish | 37.5% | -- | -- | 9.5% | <0.001 (b) | 20.0% | 8.3% | 8.3% | 0% | 9.5% | 0.640 |
| Unprocessed frozen fish | 68.8% | 6.3% | -- | 19.0% | <0.001 (b) | 50% | 25.0% | 8.3% | 20% | 19% | 0.018 |
| Processed frozen fish | 68.8% | 6.3% | 3.2% | 20.6% | <0.001 (b) | 50% | 25.0% | 11.1% | 20% | 20.6% | 0.045 |
| Canned tuna | 87.5% | 62.5% | 29.0% | 52.4% | <0.001 (a) | 80% | 50.0% | 44.4% | 60% | 52.4% | 0.242 |
| Plant-based beverage with added sugar | 87.5% | 18.8% | 3.2% | 28.6% | <0.001 (b) | 20% | 41.7% | 60% | 16.7% | 28.6% | 0.030 |
| Plant-based beverage without added sugar | 75.0% | 12.5% | 3.2% | 23.8% | <0.001 (b) | 20% | 33.3% | 50% | 13.9% | 23.8% | 0.074 |
| Yogurts without sugar/sweetener | 81.3% | 0% | 3.2% | 22.2% | <0.001 (b) | 40% | 41.7% | 13.9% | 0% | 22.2% | 0.061 |
| Yogurts with sugar | 87.5% | 31.3% | 16.1% | 38.1% | <0.001 (a) | 60% | 33.3% | 36.1% | 20% | 38.1% | 0.461 |
| Availability | Price | |||||||
|---|---|---|---|---|---|---|---|---|
| Less FSS (1) | High FSS (1) | Difference | p-Value (2) | Less FSS (1) | High FSS (1) | Difference | p-Value (2) | |
| Nuts (unprocessed vs. salty) | 44.44% | 58.73% | −14.29% | 0.049 | - | - | - | - |
| Juice (100% vs. not 100%) | 25.40% | 65.08% | −39.68% | <0.001 | 2.32 (1.34) | 1.92 (0.94) | 0.40 | 0.037 |
| Cola (light vs. regular) | 74.60% | 77.8% | −3.17% | 0.500 | 2.06 (0.87) | 2.21 (0.99) | −0.15 | 0.317 |
| Milk (Skimmed vs. whole) | 46.03% | 58.73% | −12.70% | 0.021 | 1 (0.00) | 1.14 (0.55) | −0.14 | 1.000 |
| Cheese (Fresh vs. semi-hard) | 44.44% | 44.44% | 0.00% | 1 | - | - | - | - |
| Oil (olive vs. sunflower) | 47.62% | 38.10% | 9.52% | 0.146 | 5.36 (1.36) | 3.75 (1.59) | 1.61 | 0.000 |
| Rice (whole vs. white) | 22.22% | 58.73% | −36.51% | <0.001 | 2.11 (1.23) | 1.51 (0.77) | 0.60 | 0.004 |
| Meat (chicken vs. beef) | 33.33% | 30.16% | 3.17% | 0.5 | 6.60 (1.74) | 12.76 (2.73) | −6.16 | 0.000 |
| Frozen fish (unprocessed vs. processed) | 19.05% | 20.63% | −1.59% | 1 | - | - | - | |
| Cereals (Low sugar vs. regular) | 15.87% | 38.10% | −22.22% | 0.001 | - | - | - | |
| Yogurts (without sugar/sweetener vs. with sugar) | 22.22% | 38.10% | −15.87% | 0.006 | 3.60 (3.66) | 2.95 (1.91) | 0.65 | 0.092 |
| Plant-based beverage (without added sugar vs. with added sugar) | 23.81% | 28.57% | −4.76% | 0.25 | 1.62 (0.53) | 1.41 (0.54) | 0.21 | 0.209 |
| Parameter | NEMS-S-MED Total | NEMS-S-MED Availability | ||
|---|---|---|---|---|
| Fixed Effects | Estimate | 95%CI | Estimate | 95%CI |
| Type of food retailer (a) | ||||
| Supermarket (Base) | ||||
| Convenience store | −20.615 (a) | −24.996, −16.235 | −18.401 (a) | −22.347, −14.455 |
| Specialized stores | −19.792 (a) | −23.608, −15.976 | −17.025 (a) | −20.462, −13.588 |
| Neighborhood by economic level (a) | ||||
| Low—Virgen del Carmen (Base) | ||||
| Low—Carolinas altas | −0.635 | −6.401, 5.130 | −1.556 | −6.750, 3.637 |
| High—Vistahermosa | 7.777 (b) | 1.128, 14.426 | 5.420 | −0.569, 11.409 |
| High—Centro | −0.980 | −7.461, 5.500 | −1.493 | −7.330, 4.344 |
Disclaimer/Publisher’s Note: The statements, opinions and data contained in all publications are solely those of the individual author(s) and contributor(s) and not of MDPI and/or the editor(s). MDPI and/or the editor(s) disclaim responsibility for any injury to people or property resulting from any ideas, methods, instructions or products referred to in the content. |
© 2024 by the authors. Licensee MDPI, Basel, Switzerland. This article is an open access article distributed under the terms and conditions of the Creative Commons Attribution (CC BY) license (https://creativecommons.org/licenses/by/4.0/).
Share and Cite
Hernández-Caravaca, I.; Martínez-García, A.; Trescastro-López, E.M.; Plaza-Gavaldón, Á.; Martí-Cremades, J.; Moncho, J. Influence of Socioeconomic Status on the Retail Food Environment in Alicante. Nutrients 2024, 16, 4127. https://doi.org/10.3390/nu16234127
Hernández-Caravaca I, Martínez-García A, Trescastro-López EM, Plaza-Gavaldón Á, Martí-Cremades J, Moncho J. Influence of Socioeconomic Status on the Retail Food Environment in Alicante. Nutrients. 2024; 16(23):4127. https://doi.org/10.3390/nu16234127
Chicago/Turabian StyleHernández-Caravaca, Iván, Alba Martínez-García, Eva María Trescastro-López, Ángel Plaza-Gavaldón, Julio Martí-Cremades, and Joaquín Moncho. 2024. "Influence of Socioeconomic Status on the Retail Food Environment in Alicante" Nutrients 16, no. 23: 4127. https://doi.org/10.3390/nu16234127
APA StyleHernández-Caravaca, I., Martínez-García, A., Trescastro-López, E. M., Plaza-Gavaldón, Á., Martí-Cremades, J., & Moncho, J. (2024). Influence of Socioeconomic Status on the Retail Food Environment in Alicante. Nutrients, 16(23), 4127. https://doi.org/10.3390/nu16234127