
Maternal BMI During Lactation Is Associated with Major Protein Compositions in Early Mature Milk


Highlights
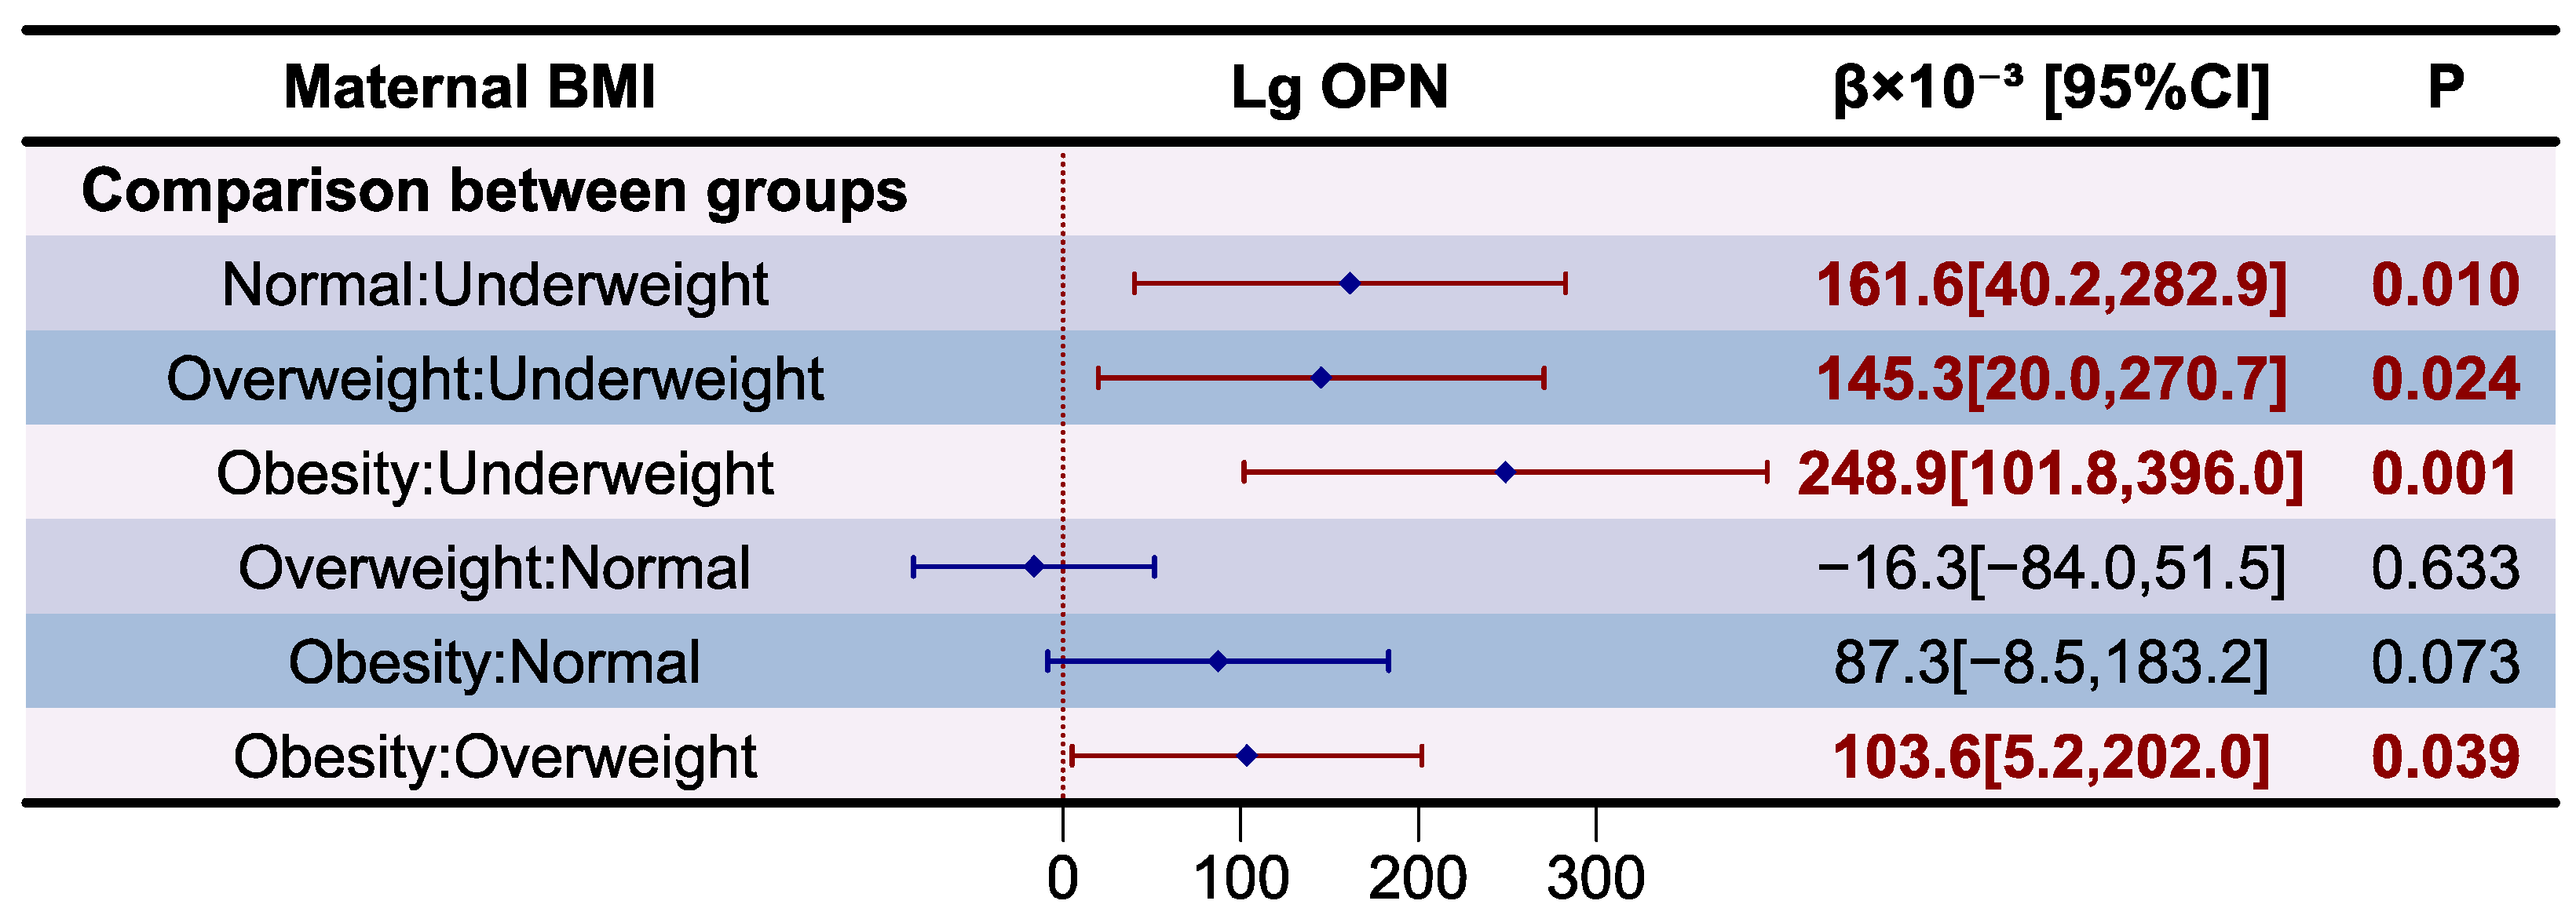
- Higher maternal BMI was associated with increased levels of several key proteins in early mature milk (e.g., total protein, α-lactalbumin, lactoferrin, and osteopontin).
- Underweight mothers had lower concentrations of certain proteins compared with normal weight or obese mothers.
- Maternal BMI was related with milk protein composition, which may affect infant nutrition.
- Promoting healthy BMI in mothers could help maintain favorable milk protein profiles.
Abstract
1. Introduction
2. Materials and Methods
2.1. Study Population
2.2. Basic Information Collection and Anthropometric Measurements
2.3. Sample Collection and Preservation
2.4. Measurements of Human Milk Protein Concentration
2.5. Statistical Analysis
3. Results
3.1. Subject Characteristics
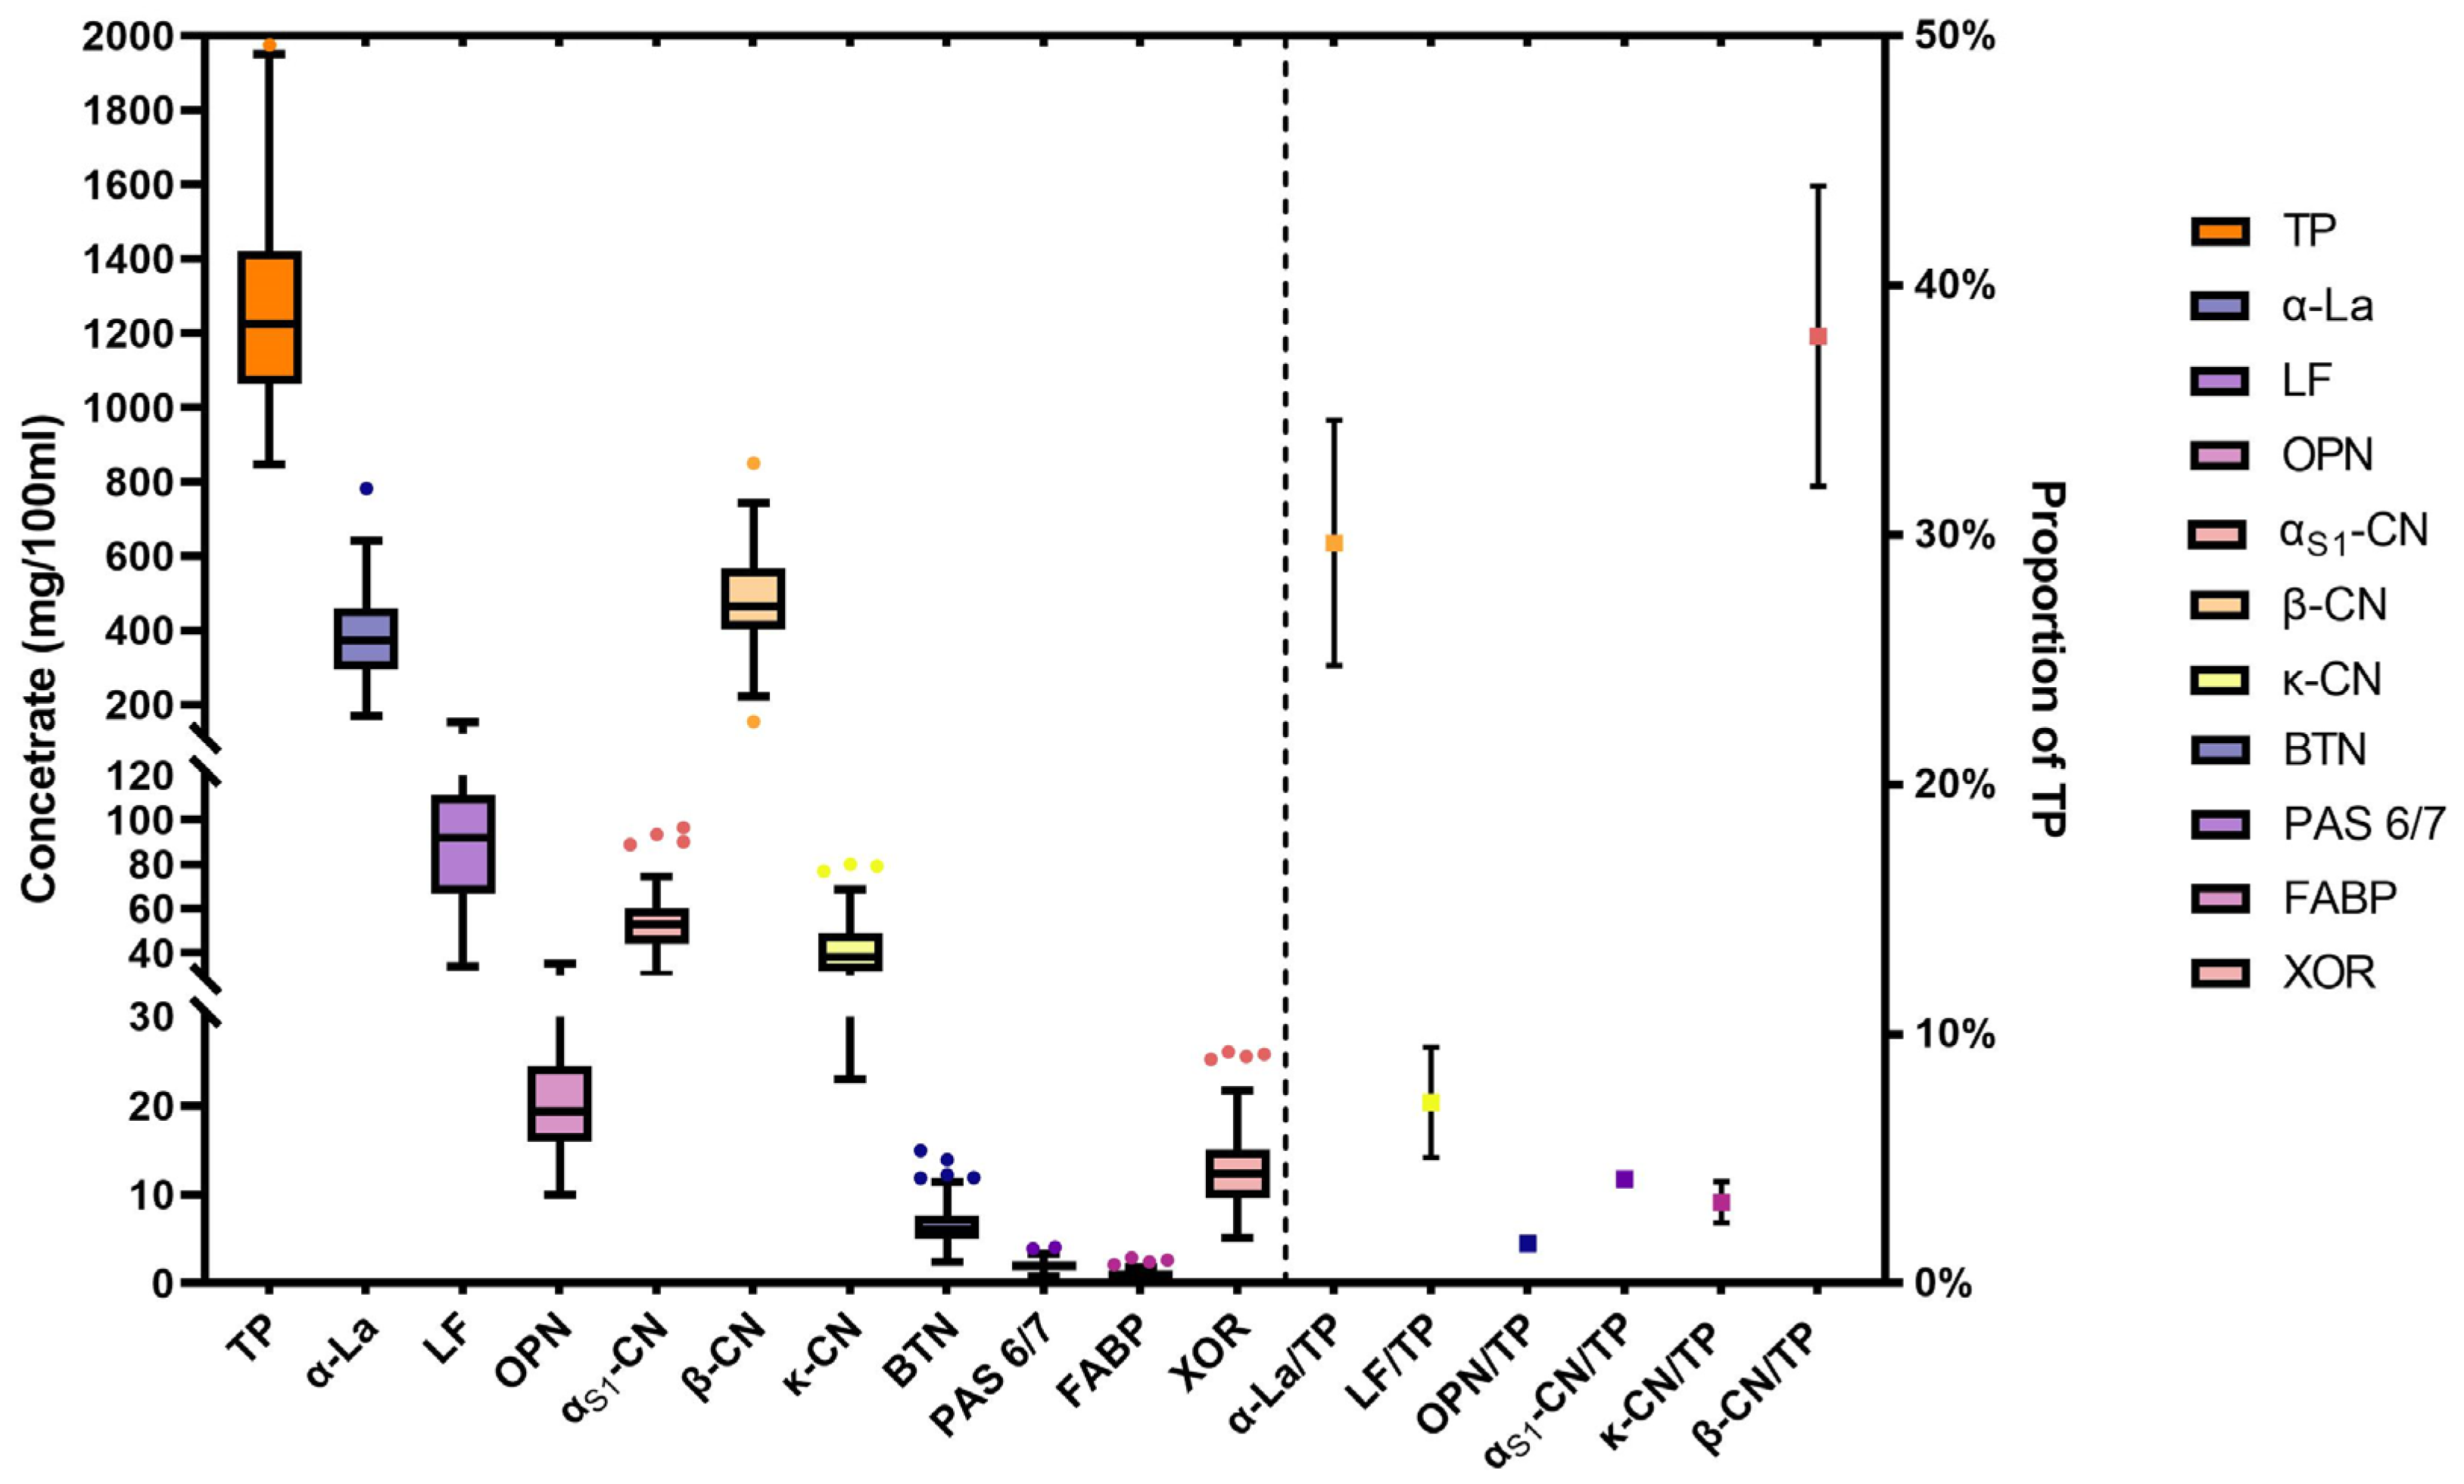
3.2. Distribution of Breast Milk Proteins
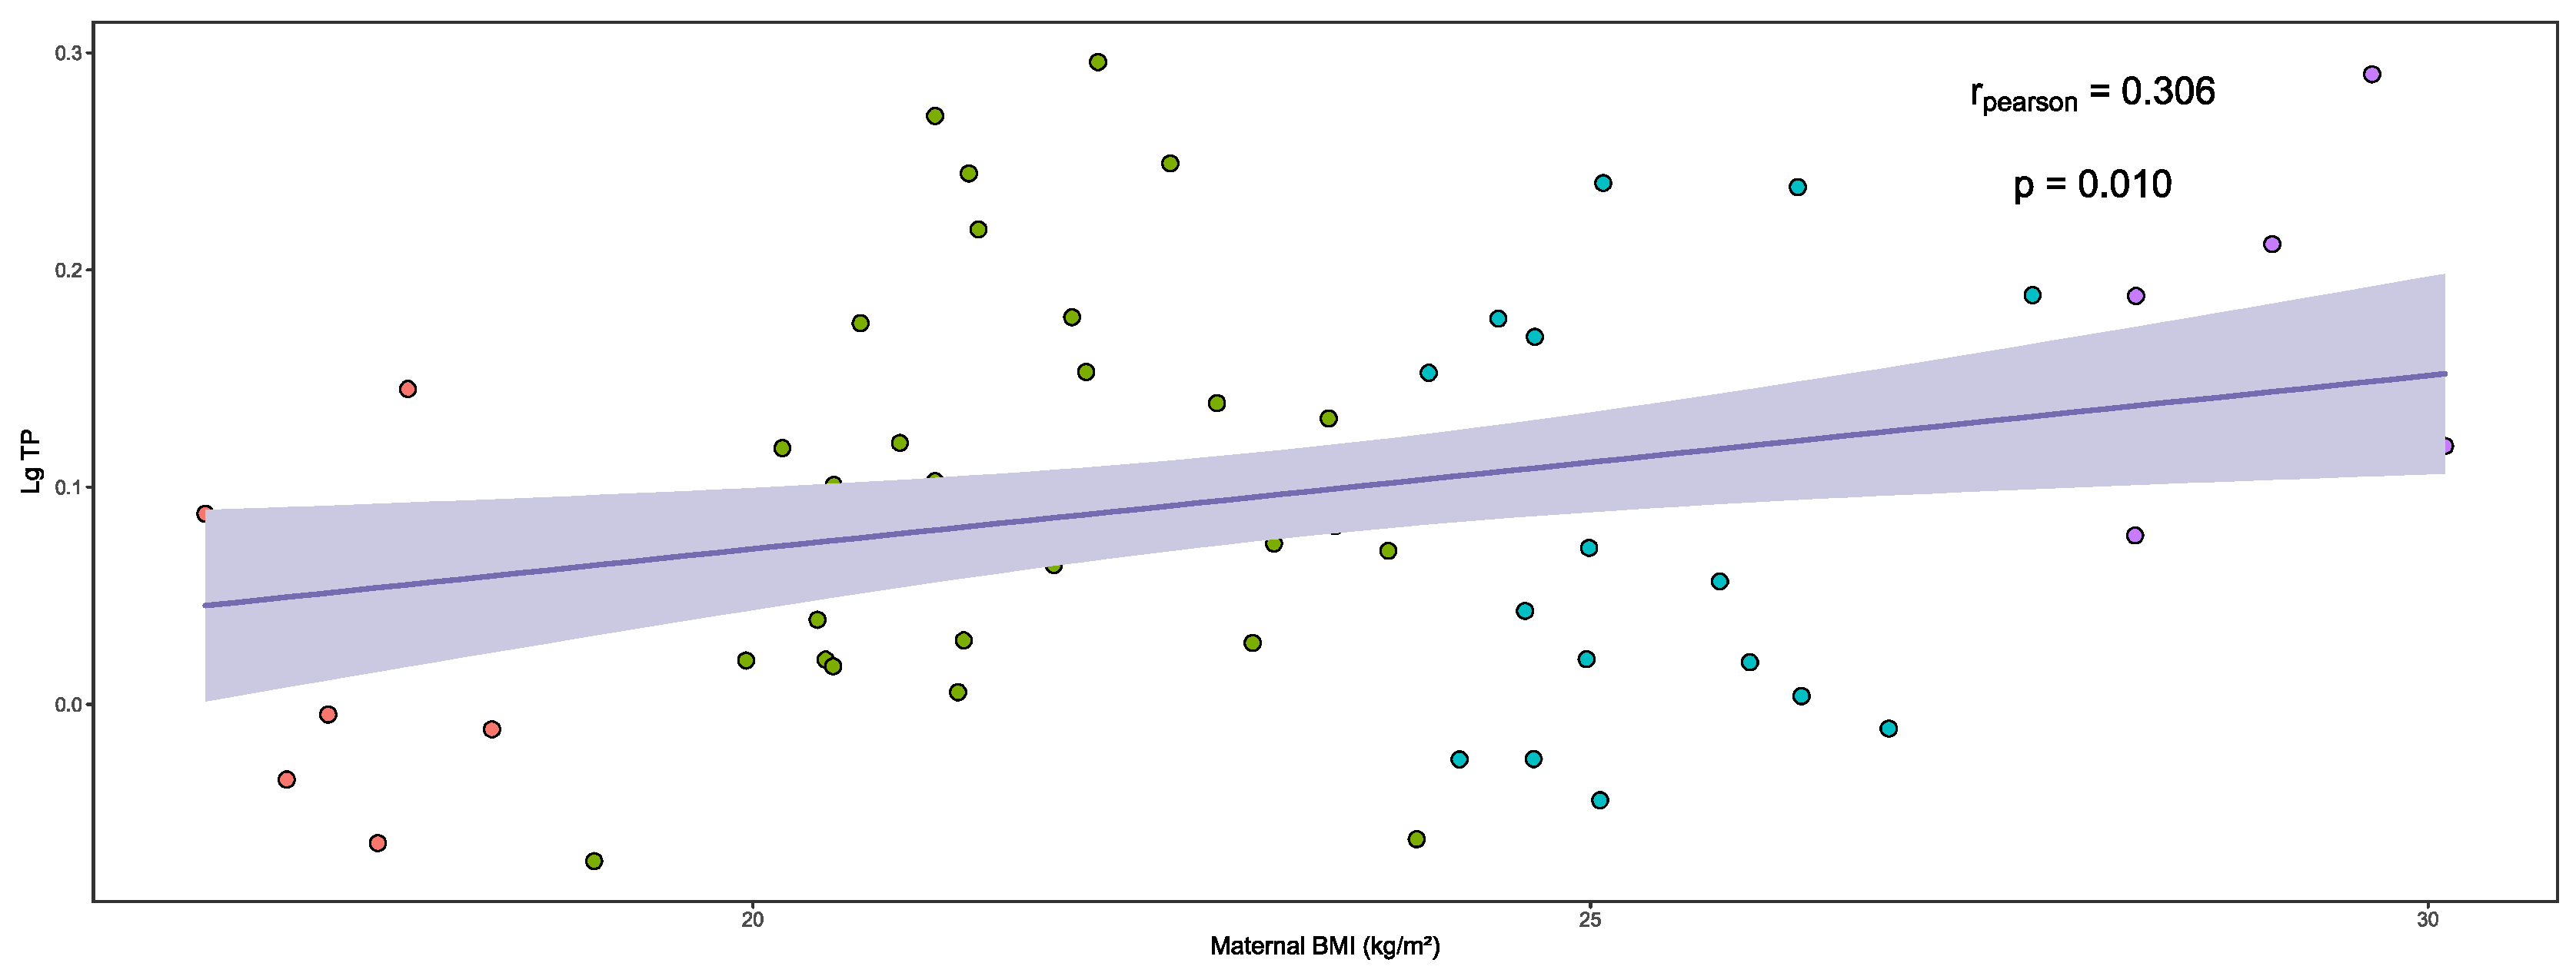
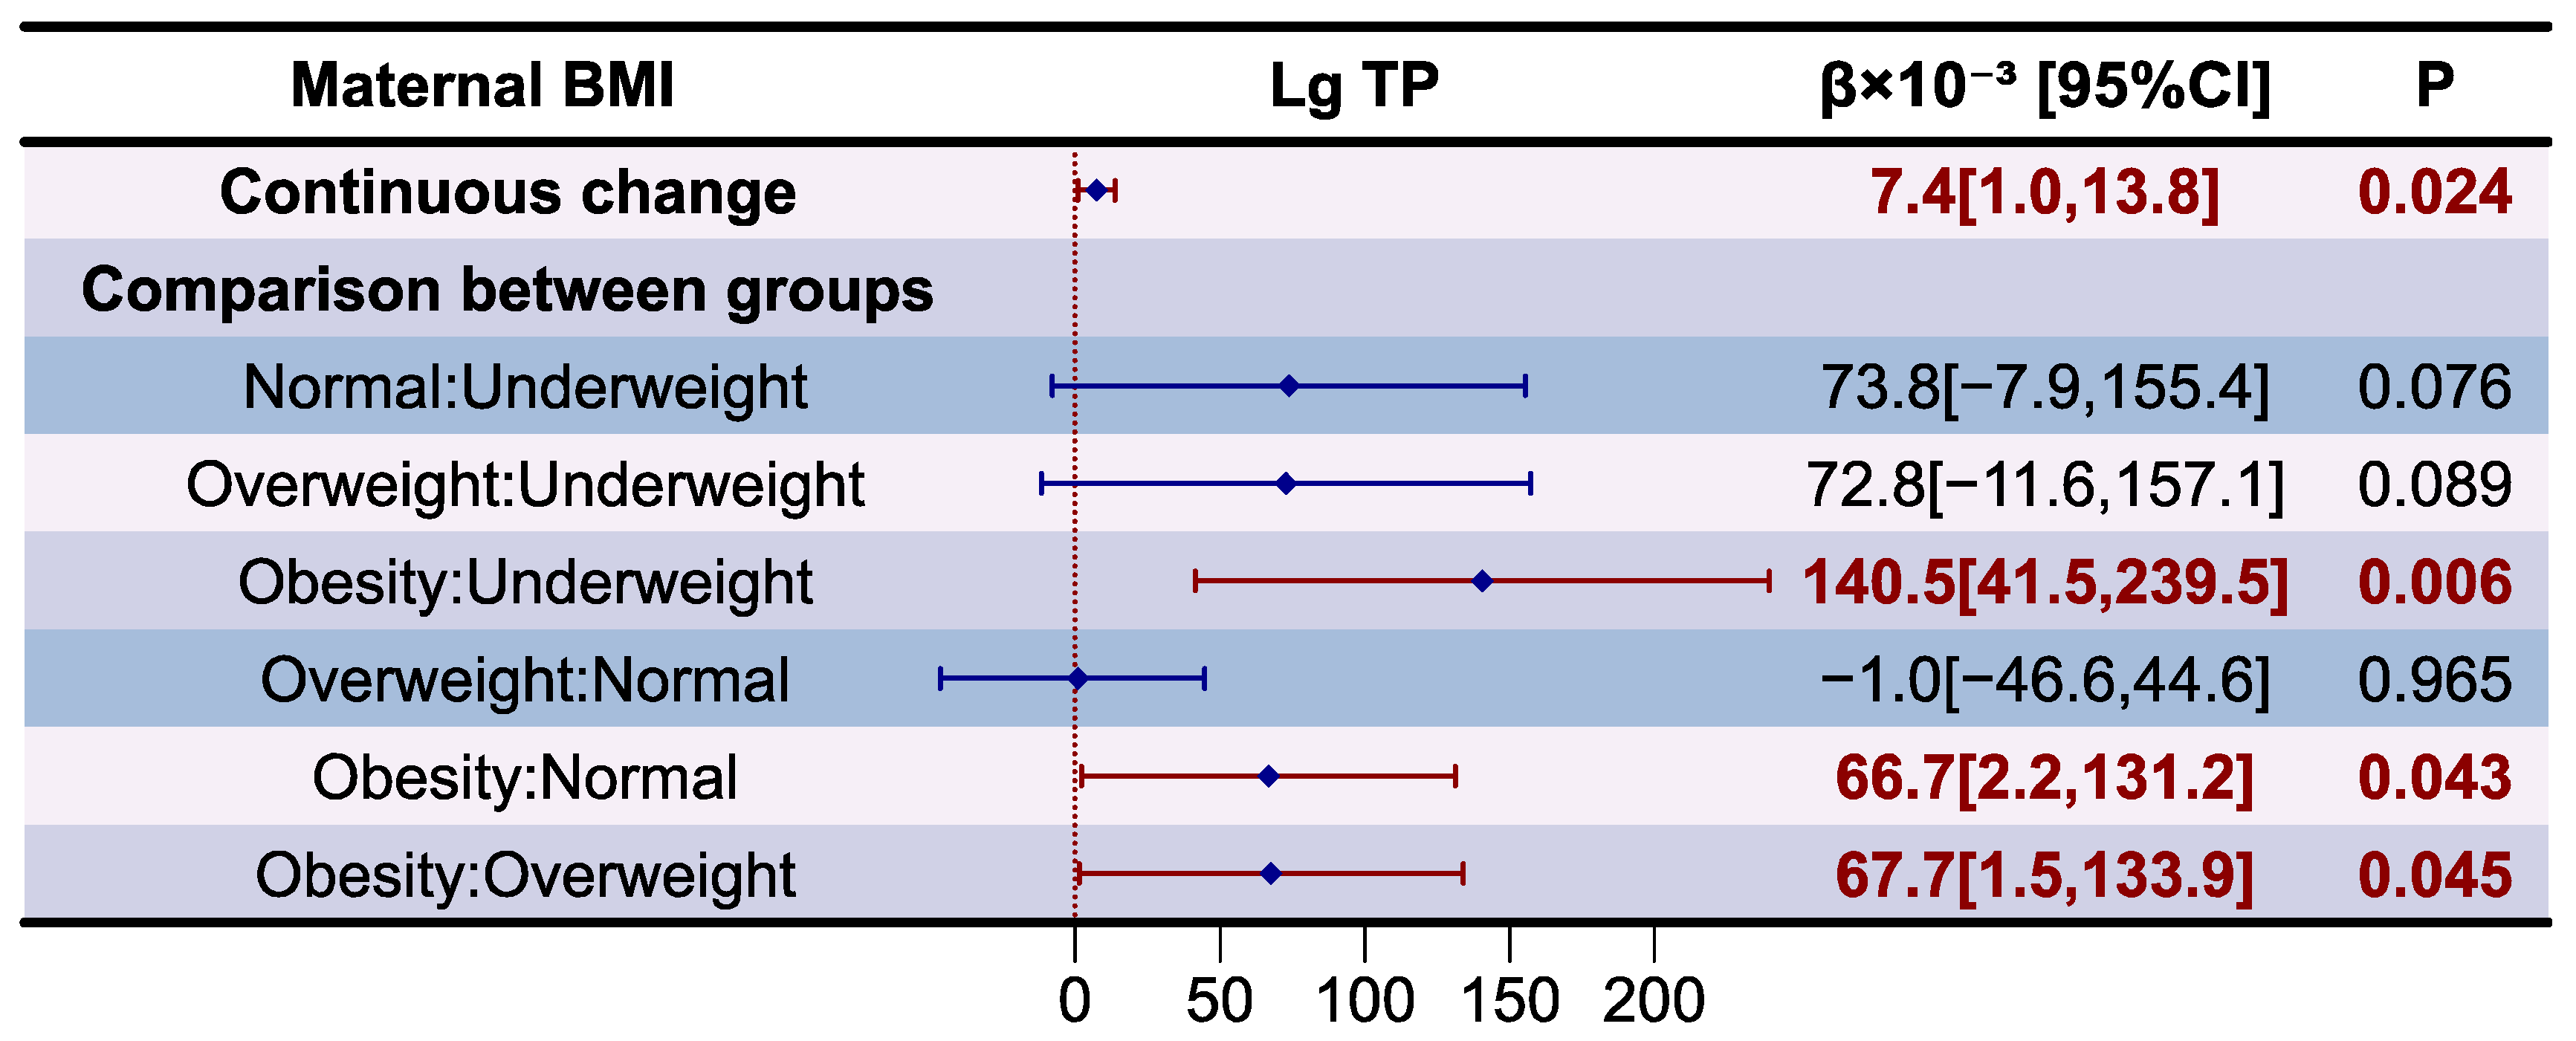
3.3. Analysis of Total Protein in Human Milk
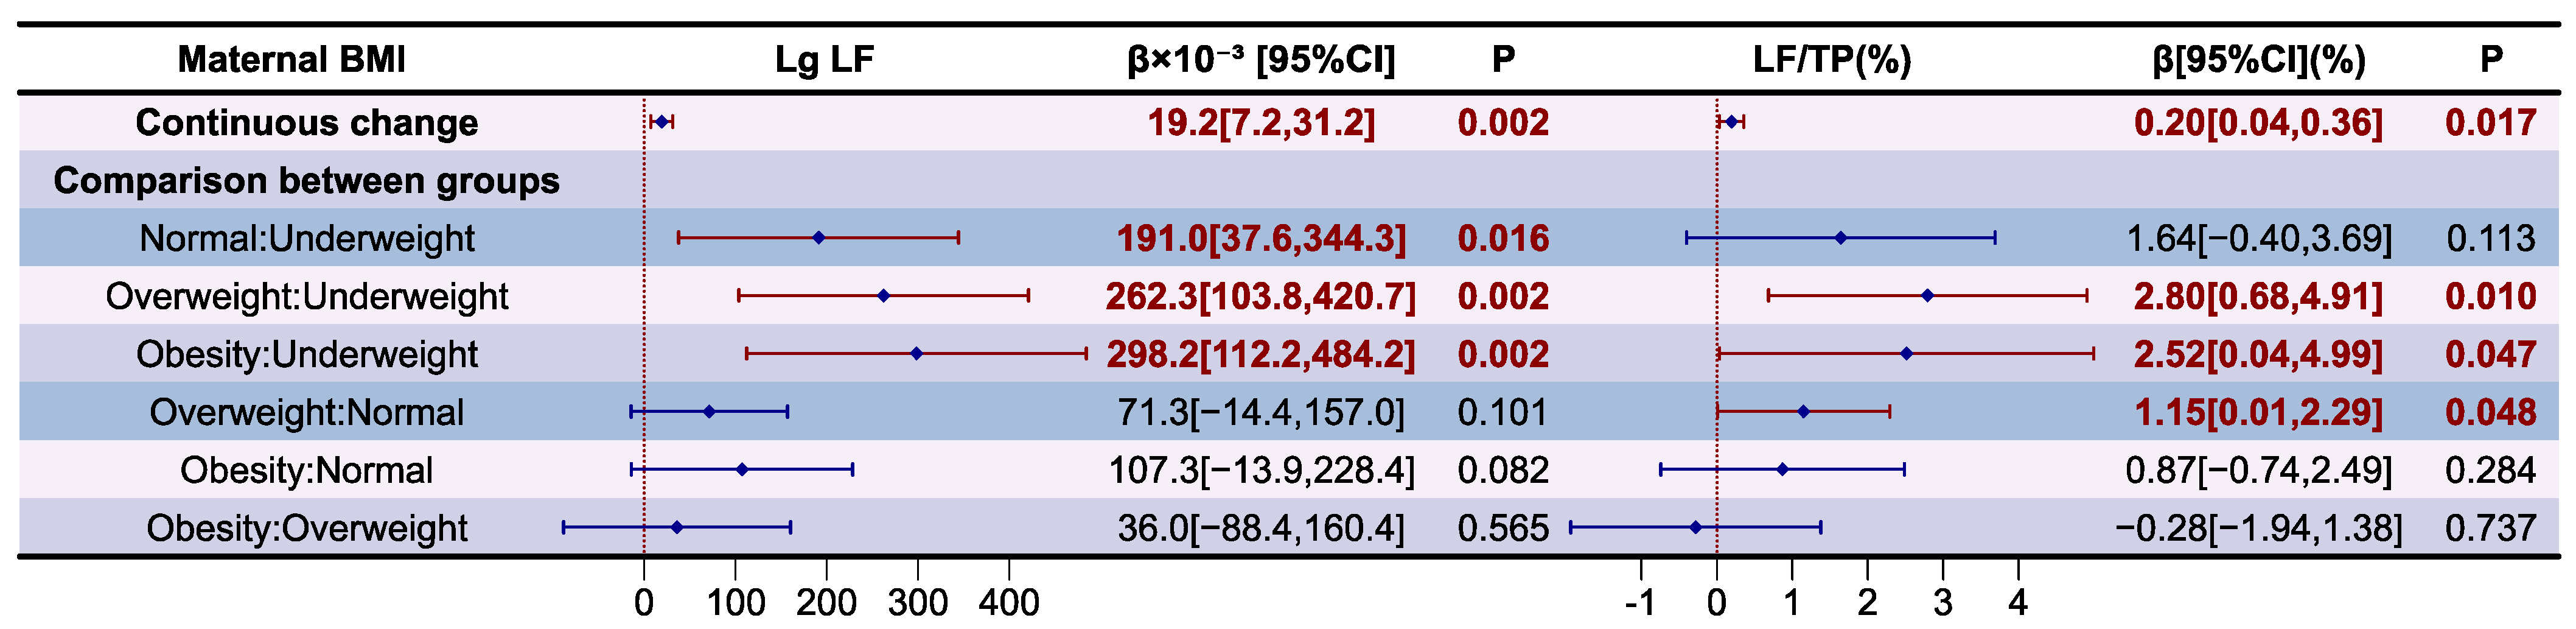
3.4. Analysis of Whey Proteins in Human Milk
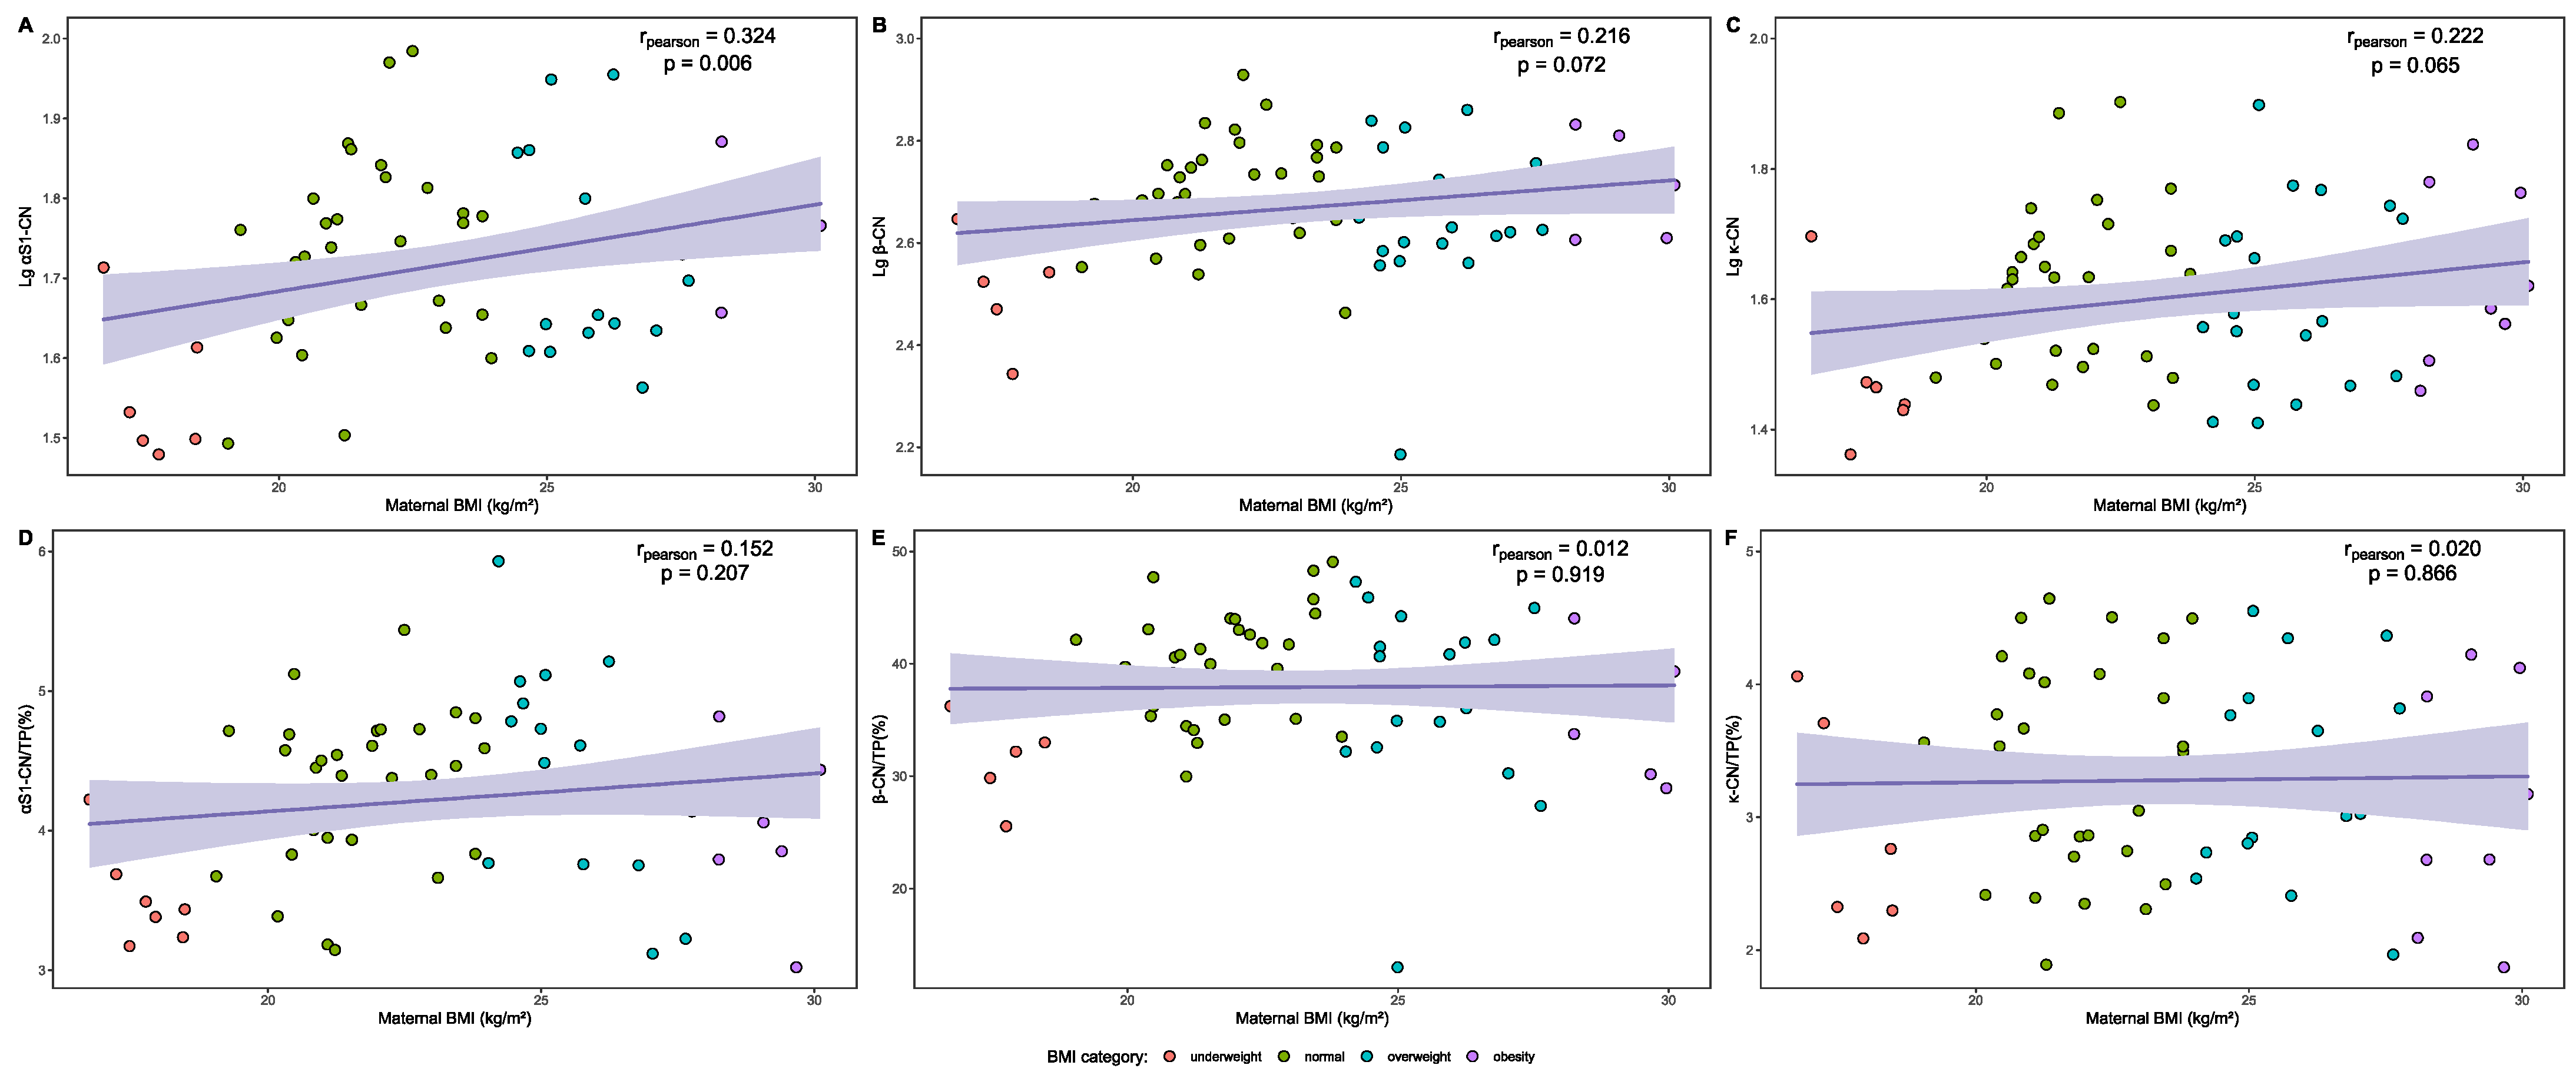
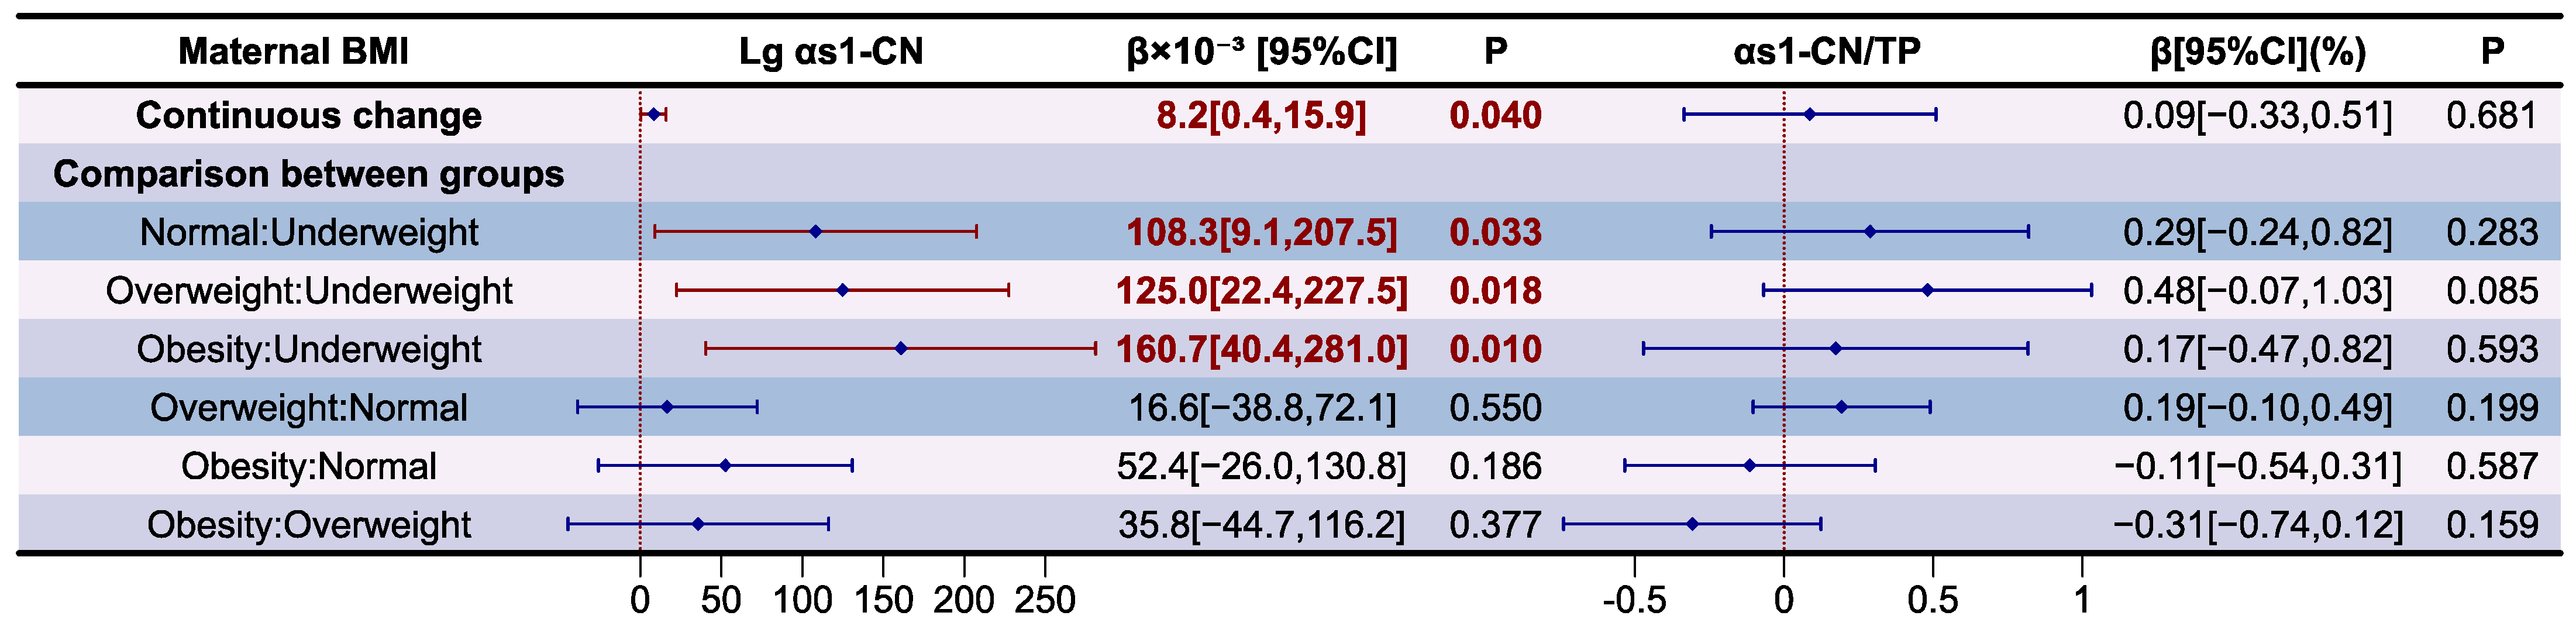
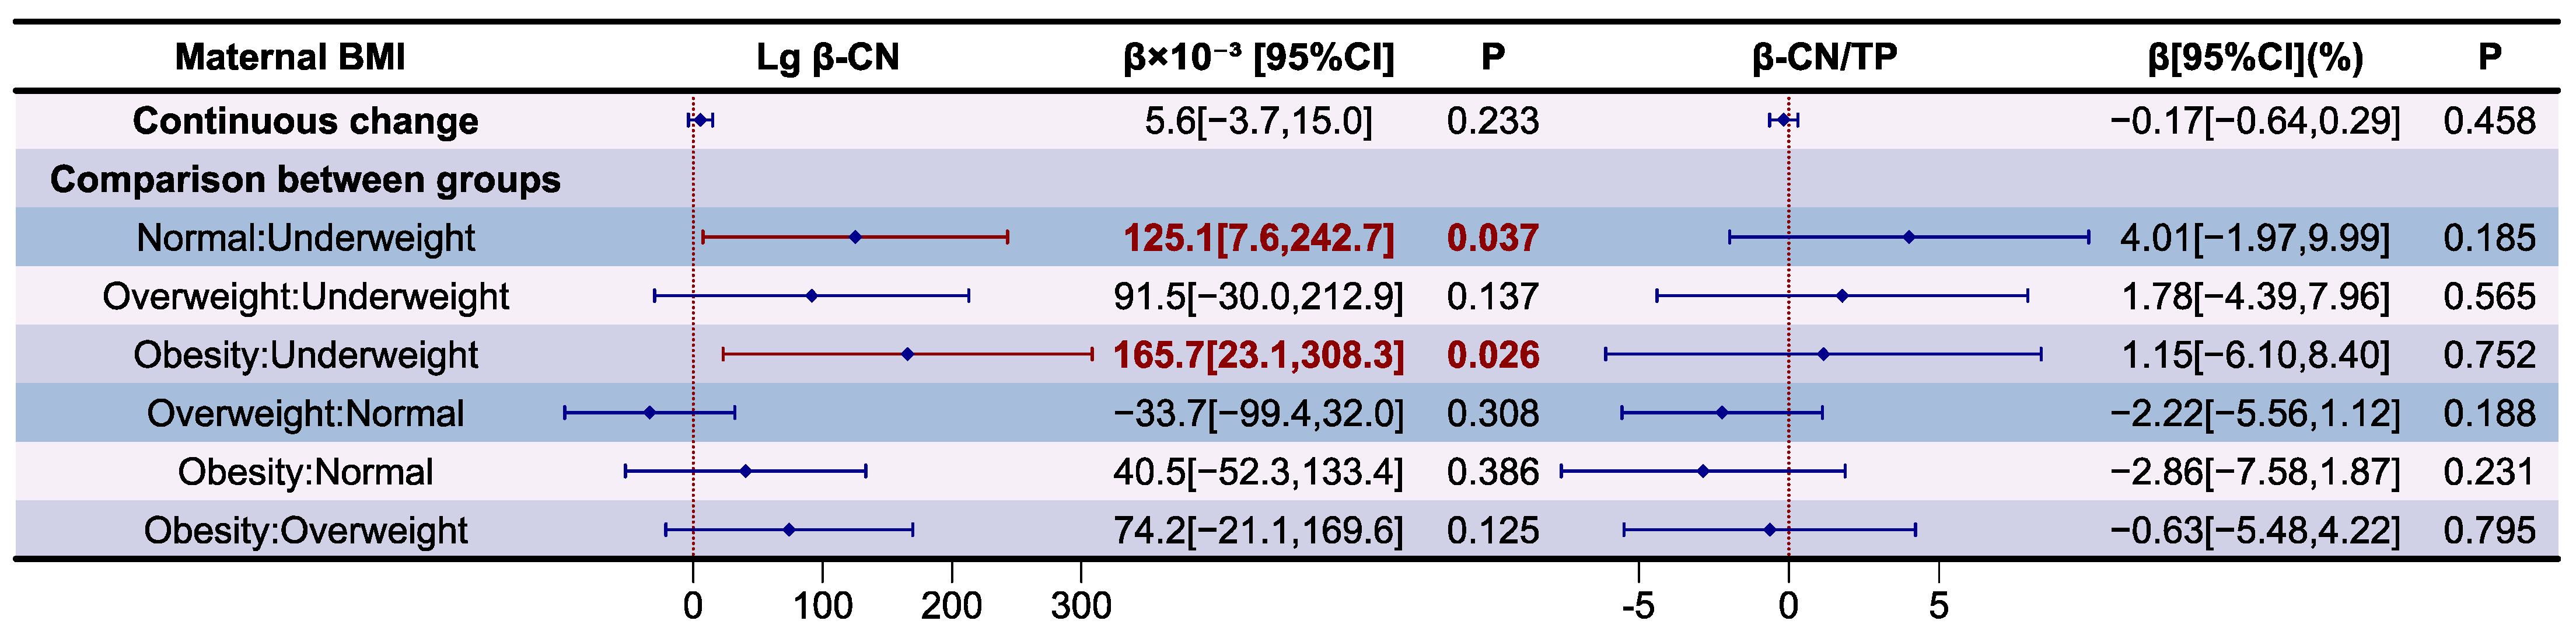
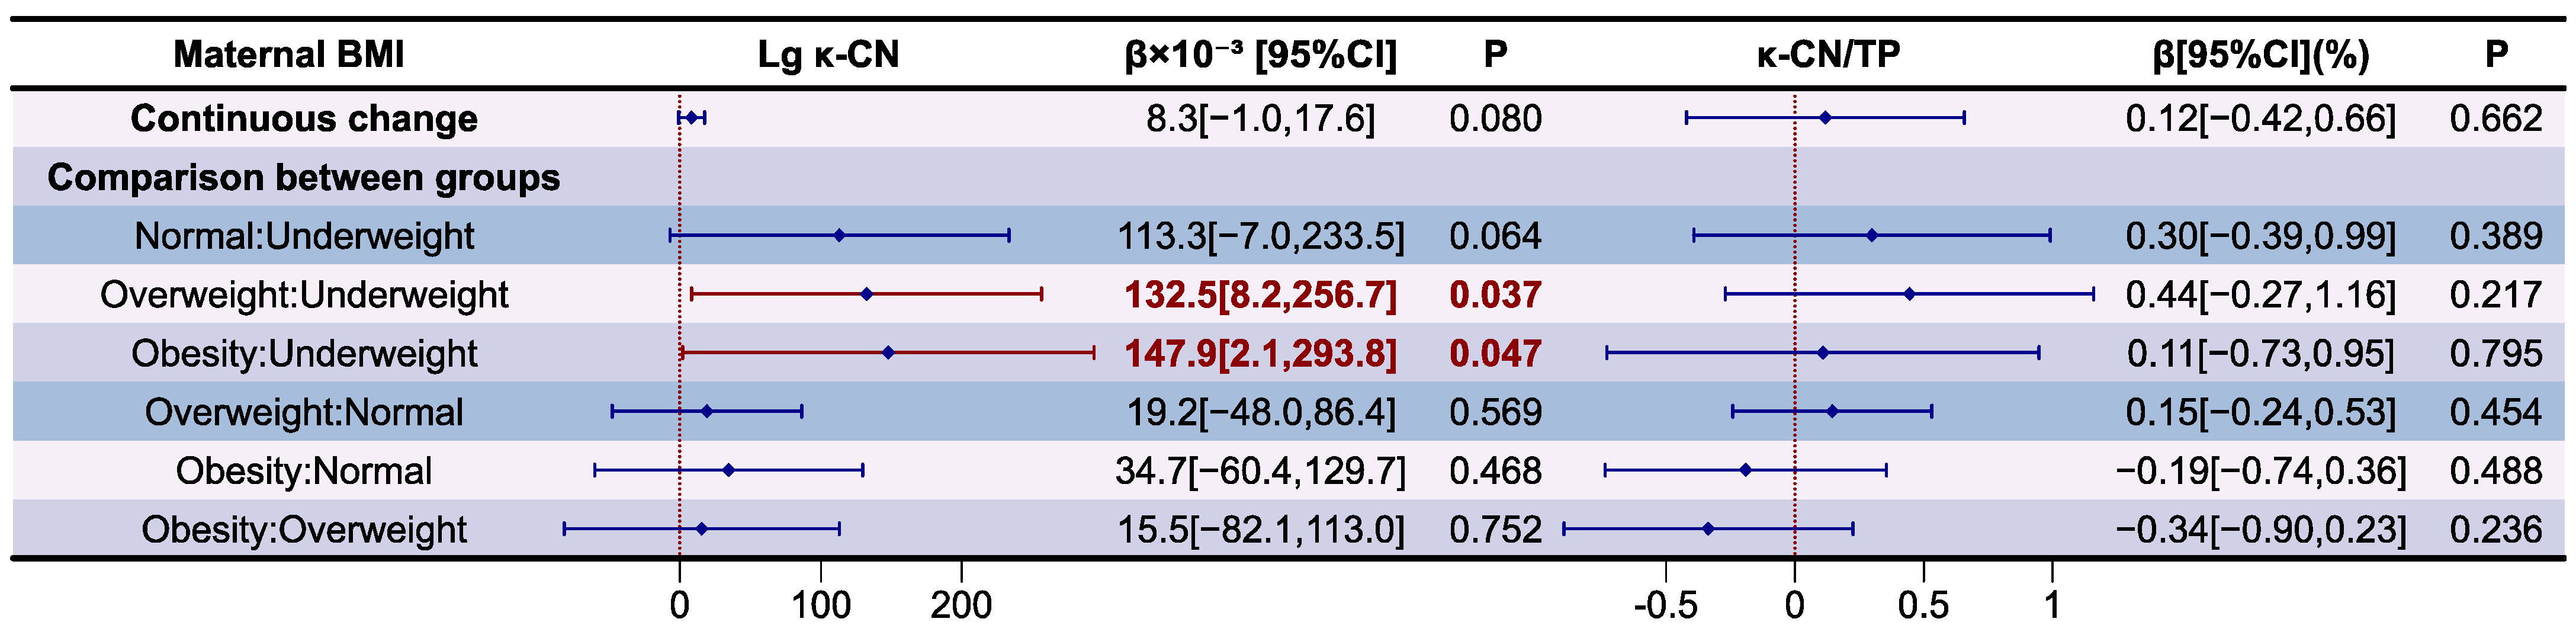
3.5. Analysis of Casein Proteins in Human Milk
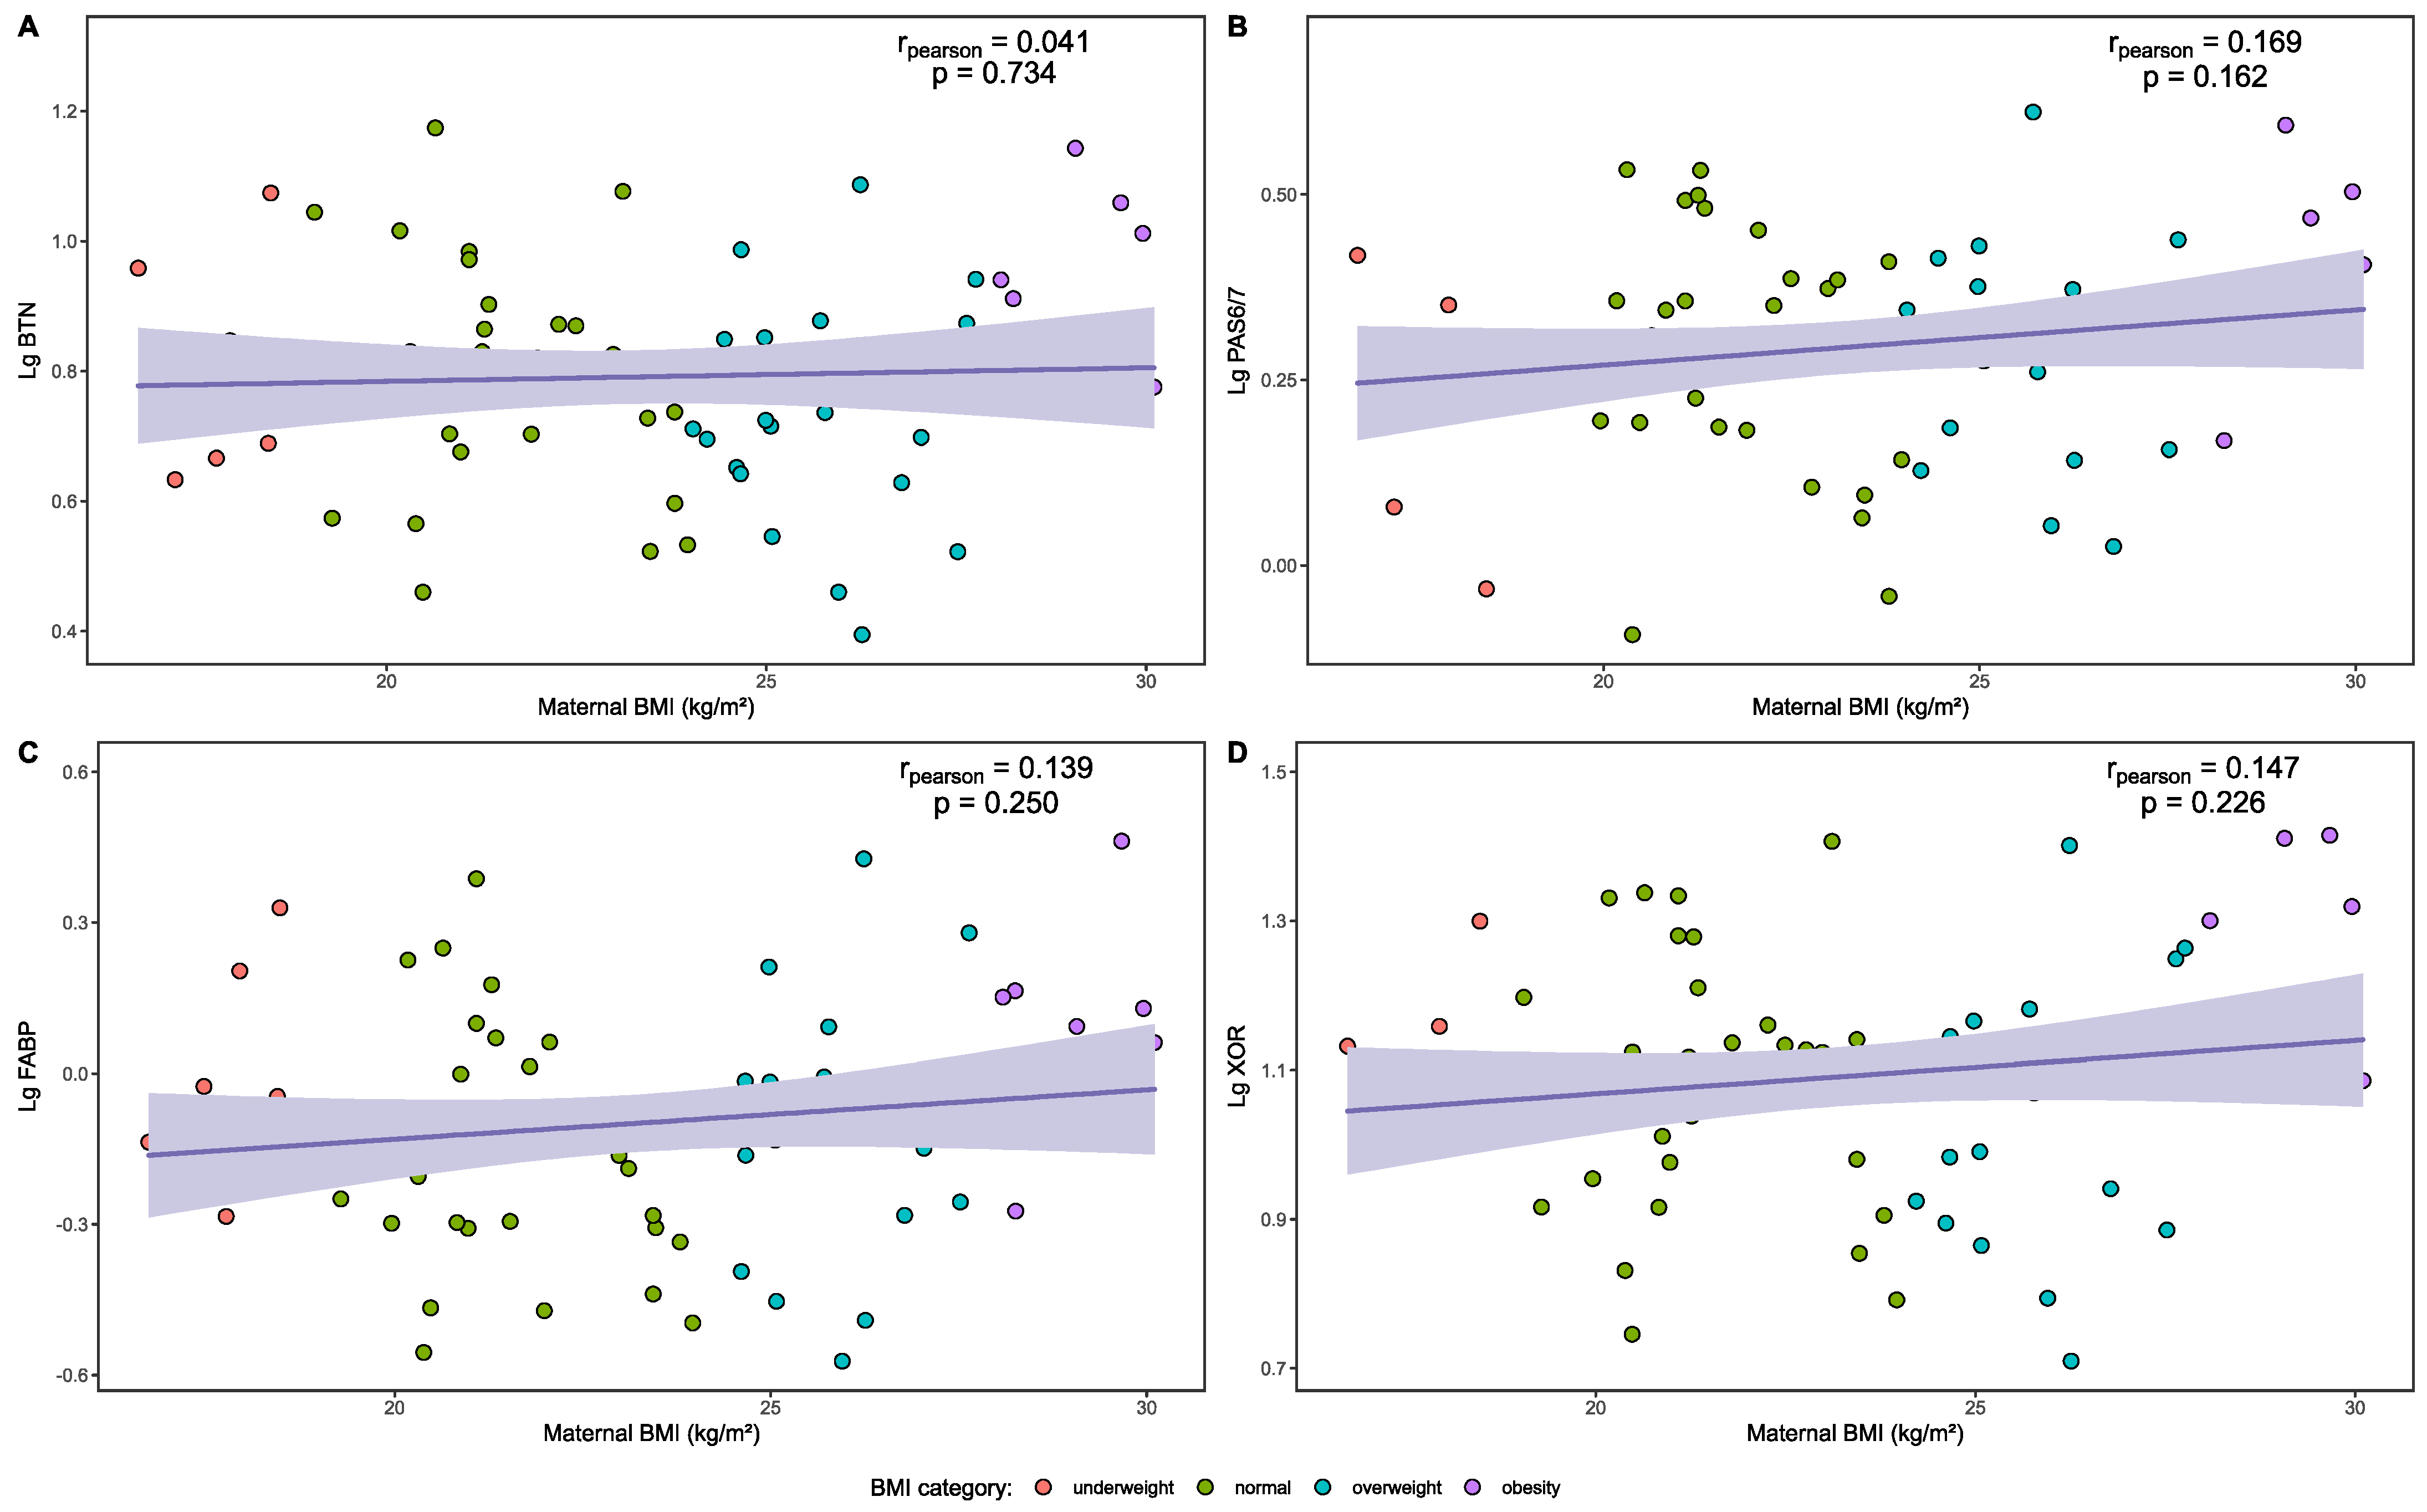
3.6. Analysis of MFGM Proteins in Human Milk
4. Discussion
5. Conclusions
Supplementary Materials
Author Contributions
Funding
Institutional Review Board Statement
Informed Consent Statement
Data Availability Statement
Conflicts of Interest
References
- Krol, K.M.; Grossmann, T. Psychological effects of breastfeeding on children and mothers. Bundesgesundheitsblatt Gesundheitsforschung Gesundheitsschutz 2018, 61, 977–985. [Google Scholar] [CrossRef] [PubMed]
- Nuzzi, G.; Trambusti, I.; ME, D.I.C.; Peroni, D.G. Breast milk: More than just nutrition! Minerva Pediatr. 2021, 73, 111–114. [Google Scholar] [CrossRef] [PubMed]
- Andreas, N.J.; Kampmann, B.; Mehring Le-Doare, K. Human breast milk: A review on its composition and bioactivity. Early Hum. Dev. 2015, 91, 629–635. [Google Scholar] [CrossRef] [PubMed]
- Chinese Nutrition Society. Dietery Guidelines for Chinesee Residents (2022); People’s Medeical Publishing House: Beijing, China, 2022; pp. 197–198. [Google Scholar]
- Binns, C.W.; Lee, M.K. Exclusive breastfeeding for six months: The WHO six months recommendation in the Asia Pacific Region. Asia Pac. J. Clin. Nutr. 2014, 23, 344–350. [Google Scholar]
- World Health Organization. Infant and Young Child Feeding; World Health Organization: Geneva, Switzerland, 2023.
- Del Ciampo, L.A.; Del Ciampo, I.R.L. Breastfeeding and the Benefits of Lactation for Women’s Health. Rev. Bras. Ginecol. Obstet. 2018, 40, 354–359. [Google Scholar] [CrossRef]
- von der Ohe, G. Benefits of Breastfeeding. Dtsch. Arztebl. Int. 2018, 115, 453. [Google Scholar] [CrossRef]
- Binns, C.; Lee, M.; Low, W.Y. The Long-Term Public Health Benefits of Breastfeeding. Asia Pac. J. Public Health 2016, 28, 7–14. [Google Scholar] [CrossRef]
- McGowan, C.; Bland, R. The Benefits of Breastfeeding on Child Intelligence, Behavior, and Executive Function: A Review of Recent Evidence. Breastfeed. Med. 2023, 18, 172–187. [Google Scholar] [CrossRef]
- Young, B.E. Chapter 2—Breastfeeding and Human Milk: Short and Long-Term Health Benefits to the Recipient Infant. In Early Nutrition and Long-Term Health; Saavedra, J.M., Dattilo, A.M., Eds.; Woodhead Publishing: Sawston, UK, 2017; pp. 25–53. [Google Scholar]
- Oddy, W.H. Breastfeeding, Childhood Asthma, and Allergic Disease. Ann. Nutr. Metab. 2017, 70 (Suppl. S2), 26–36. [Google Scholar] [CrossRef]
- Haschke, F.; Haiden, N.; Thakkar, S.K. Nutritive and Bioactive Proteins in Breastmilk. Ann. Nutr. Metab. 2016, 69 (Suppl. S2), 17–26. [Google Scholar] [CrossRef]
- Brockway, M.M.; Daniel, A.I.; Reyes, S.M.; Granger, M.; McDermid, J.M.; Chan, D.; Refvik, R.; Sidhu, K.K.; Musse, S.; Patel, P.P.; et al. Human Milk Macronutrients and Child Growth and Body Composition in the First Two Years: A Systematic Review. Adv. Nutr. 2024, 15, 100149. [Google Scholar] [CrossRef] [PubMed]
- Donovan, S.M. Human Milk Proteins: Composition and Physiological Significance. Nestle Nutr. Inst. Workshop Ser. 2019, 90, 93–101. [Google Scholar] [PubMed]
- Molinari, C.E.; Casadio, Y.S.; Hartmann, B.T.; Livk, A.; Bringans, S.; Arthur, P.G.; Hartmann, P.E. Proteome mapping of human skim milk proteins in term and preterm milk. J. Proteome Res. 2012, 11, 1696–1714. [Google Scholar] [CrossRef] [PubMed]
- Meng, F.; Uniacke-Lowe, T.; Ryan, A.C.; Kelly, A.L. The composition and physico-chemical properties of human milk: A review. Trends Food Sci. Technol. 2021, 112, 608–621. [Google Scholar] [CrossRef]
- Bourlieu, C.; Bouzerzour, K.; Ferret-Bernard, S.; Bourgot, C.L.; Chever, S.; Ménard, O.; Deglaire, A.; Cuinet, I.; Ruyet, P.L.; Bonhomme, C.; et al. Infant formula interface and fat source impact on neonatal digestion and gut microbiota. Eur. J. Lipid Sci. Technol. 2015, 117, 1500–1512. [Google Scholar] [CrossRef]
- Saadi, S.; Makhlouf, C.; Nacer, N.E.; Halima, B.; Faiza, A.; Kahina, H.; Wahiba, F.; Afaf, K.; Rabah, K.; Saoudi, Z. Whey proteins as multifunctional food materials: Recent advancements in hydrolysis, separation, and peptidomimetic approaches. Compr. Rev. Food Sci. Food Saf. 2024, 23, e13288. [Google Scholar] [CrossRef]
- Martin, C.R.; Ling, P.R.; Blackburn, G.L. Review of Infant Feeding: Key Features of Breast Milk and Infant Formula. Nutrients 2016, 8, 279. [Google Scholar] [CrossRef]
- Permyakov, E.A. α-Lactalbumin, Amazing Calcium-Binding Protein. Biomolecules 2020, 10, 1210. [Google Scholar] [CrossRef]
- Layman, D.K.; Lönnerdal, B.; Fernstrom, J.D. Applications for α-lactalbumin in human nutrition. Nutr. Rev. 2018, 76, 444–460. [Google Scholar] [CrossRef]
- Demmelmair, H.; Prell, C.; Timby, N.; Lönnerdal, B. Benefits of Lactoferrin, Osteopontin and Milk Fat Globule Membranes for Infants. Nutrients 2017, 9, 817. [Google Scholar] [CrossRef]
- Wang, B.; Timilsena, Y.P.; Blanch, E.; Adhikari, B. Lactoferrin: Structure, function, denaturation and digestion. Crit. Rev. Food Sci. Nutr. 2019, 59, 580–596. [Google Scholar] [CrossRef] [PubMed]
- Manzoni, P. Clinical Benefits of Lactoferrin for Infants and Children. J. Pediatr. 2016, 173, S43–S52. [Google Scholar] [CrossRef] [PubMed]
- Kahles, F.; Findeisen, H.M.; Bruemmer, D. Osteopontin: A novel regulator at the cross roads of inflammation, obesity and diabetes. Mol. Metab. 2014, 3, 384–393. [Google Scholar] [CrossRef] [PubMed]
- Jiang, R.; Lönnerdal, B. Osteopontin in human milk and infant formula affects infant plasma osteopontin concentrations. Pediatr. Res. 2019, 85, 502–505. [Google Scholar] [CrossRef] [PubMed]
- Zhang, J.; Du, X.; Jiang, S.; Xie, Q.; Mu, G.; Wu, X. Formulation of infant formula with different casein fractions and their effects on physical properties and digestion characteristics. Food Funct. 2022, 13, 769–780. [Google Scholar] [CrossRef]
- Liao, Y.; Alvarado, R.; Phinney, B.; Lönnerdal, B. Proteomic characterization of specific minor proteins in the human milk casein fraction. J. Proteome Res. 2011, 10, 5409–5415. [Google Scholar] [CrossRef]
- Saenger, T.; Vordenbäumen, S.; Genich, S.; Haidar, S.; Schulte, M.; Nienberg, C.; Bleck, E.; Schneider, M.; Jose, J. Human αS1-casein induces IL-8 secretion by binding to the ecto-domain of the TLR4/MD2 receptor complex. Biochim. Biophys. Acta (BBA)-Gen. Subj. 2019, 1863, 632–643. [Google Scholar] [CrossRef]
- Saenger, T.; Schulte, M.F.; Vordenbäumen, S.; Hermann, F.C.; Bertelsbeck, J.; Meier, K.; Bleck, E.; Schneider, M.; Jose, J. Structural Analysis of Breast-Milk α(S1)-Casein: An α-Helical Conformation Is Required for TLR4-Stimulation. Int. J. Mol. Sci. 2024, 25, 1743. [Google Scholar] [CrossRef]
- Gidrewicz, D.A.; Fenton, T.R. A systematic review and meta-analysis of the nutrient content of preterm and term breast milk. BMC Pediatr. 2014, 14, 216. [Google Scholar] [CrossRef]
- Bernardes-Loch, R.M.; Ribeiro, A.C.; Ramírez-López, C.J.; Loch Gomes, R.A.; Barros, E.; Filomeno Fontes, E.A.; Baracat-Pereira, M.C. Human milk proteins differentiate over the sex of newborns and across stages of lactation. Clin. Nutr. ESPEN 2024, 62, 144–156. [Google Scholar] [CrossRef]
- Purkiewicz, A.; Stasiewicz, M.; Nowakowski, J.J.; Pietrzak-Fiećko, R. The Influence of the Lactation Period and the Type of Milk on the Content of Amino Acids and Minerals in Human Milk and Infant Formulas. Foods 2023, 12, 3674. [Google Scholar] [CrossRef] [PubMed]
- Liao, Y.; Weber, D.; Xu, W.; Durbin-Johnson, B.P.; Phinney, B.S.; Lönnerdal, B. Absolute Quantification of Human Milk Caseins and the Whey/Casein Ratio during the First Year of Lactation. J. Proteome Res. 2017, 16, 4113–4121. [Google Scholar] [CrossRef] [PubMed]
- Bzikowska-Jura, A.; Czerwonogrodzka-Senczyna, A.; Olędzka, G.; Szostak-Węgierek, D.; Weker, H.; Wesołowska, A. Maternal Nutrition and Body Composition During Breastfeeding: Association with Human Milk Composition. Nutrients 2018, 10, 1379. [Google Scholar] [CrossRef] [PubMed]
- Kugananthan, S.; Gridneva, Z.; Lai, C.T.; Hepworth, A.R.; Mark, P.J.; Kakulas, F.; Geddes, D.T. Associations between Maternal Body Composition and Appetite Hormones and Macronutrients in Human Milk. Nutrients 2017, 9, 252. [Google Scholar] [CrossRef]
- Daniel, A.I.; Shama, S.; Ismail, S.; Bourdon, C.; Kiss, A.; Mwangome, M.; Bandsma, R.H.J.; O’Connor, D.L. Maternal BMI is positively associated with human milk fat: A systematic review and meta-regression analysis. Am. J. Clin. Nutr. 2021, 113, 1009–1022. [Google Scholar] [CrossRef]
- Bzikowska, A.; Czerwonogrodzka-Senczyna, A.; Weker, H.; Wesołowska, A. Correlation between human milk composition and maternal nutritional status. Rocz. Panstw. Zakl. Hig. 2018, 69, 363–367. [Google Scholar] [CrossRef]
- WS/T 428-2013; The Criteria of Weight for Adults. National Health Commission of the People’s Republic of China: Beijing, China, 2013.
- T/CNSS 009-2021; Weight Monitoring and Evaluation During Pregnancy Period of Chinese Women. Chinese Medical Association Perinatal Medicine Branch: Beijing, China, 2021.
- Wang, M.; Zhao, Z.; Zhao, A.; Zhang, J.; Wu, W.; Ren, Z.; Wang, P.; Zhang, Y. Neutral Human Milk Oligosaccharides Are Associated with Multiple Fixed and Modifiable Maternal and Infant Characteristics. Nutrients 2020, 12, 826. [Google Scholar] [CrossRef]
- Hammond, J.B.; Kruger, N.J. The bradford method for protein quantitation. Methods Mol. Biol. 1988, 3, 25–32. [Google Scholar]
- Chen, Q.; Zhang, J.; Ke, X.; Lai, S.; Li, D.; Yang, J.; Mo, W.; Ren, Y. Simultaneous quantification of α-lactalbumin and β-casein in human milk using ultra-performance liquid chromatography with tandem mass spectrometry based on their signature peptides and winged isotope internal standards. Biochim. Biophys. Acta 2016, 1864, 1122–1127. [Google Scholar] [CrossRef]
- Ren, Q.; Sun, H.; Zhao, M.; Xu, Y.; Xie, Q.; Jiang, S.; Zhao, X.; Zhang, W. Longitudinal Changes in Crude Protein and Amino Acids in Human Milk in Chinese Population: A Systematic Review. J. Pediatr. Gastroenterol. Nutr. 2020, 70, 555–561. [Google Scholar] [CrossRef]
- Wang, J.; Xv, L.; Ren, Y.; Guo, G.; Yang, Z.; Yin, S. Contents of Protein Profiles in Hyman Milk at Different Lactation Stages From Urban and Rural Areas of China. Acta Nutr. Sin. 2021, 43, 328–333. [Google Scholar]
- Hahn, W.H.; Jeong, T.; Park, S.; Song, S.; Kang, N.M. Content fat and calorie of human milk is affected by interactions between maternal age and body mass index. J. Matern. Fetal Neonatal Med. 2018, 31, 1385–1388. [Google Scholar] [CrossRef] [PubMed]
- Sims, C.R.; Lipsmeyer, M.E.; Turner, D.E.; Andres, A. Human milk composition differs by maternal BMI in the first 9 months postpartum. Am. J. Clin. Nutr. 2020, 112, 548–557. [Google Scholar] [CrossRef] [PubMed]
- Young, B.E.; Patinkin, Z.; Palmer, C.; de la Houssaye, B.; Barbour, L.A.; Hernandez, T.; Friedman, J.E.; Krebs, N.F. Human milk insulin is related to maternal plasma insulin and BMI: But other components of human milk do not differ by BMI. Eur. J. Clin. Nutr. 2017, 71, 1094–1100. [Google Scholar] [CrossRef] [PubMed]
- Han, S.M.; Derraik, J.G.B.; Vickers, M.H.; Devaraj, S.; Huang, F.; Pang, W.W.; Godfrey, K.M.; Chan, S.Y.; Thakkar, S.K.; Cutfield, W.S. A nutritional supplement taken during preconception and pregnancy influences human milk macronutrients in women with overweight/obesity and gestational diabetes mellitus. Front. Nutr. 2023, 10, 1282376. [Google Scholar] [CrossRef] [PubMed]
- Thakur, A.; Kler, N.; Garg, P.; Gandhi, P.; Srivastava, S. Macronutrient analysis of human milk and factors associated with its composition in mothers of preterm infants ≤ 32 weeks. Eur. J. Pediatr. 2021, 180, 3527–3534. [Google Scholar] [CrossRef]
- Yin, S. Human Milk Compositions—Forms, Contents, Functions and Analytical Methods; Chemical Industry Press: Beijing, China, 2016; pp. 77–78. [Google Scholar]
- Gridneva, Z.; Tie, W.J.; Rea, A.; Lai, C.T.; Ward, L.C.; Murray, K.; Hartmann, P.E.; Geddes, D.T. Human Milk Casein and Whey Protein and Infant Body Composition over the First 12 Months of Lactation. Nutrients 2018, 10, 1332. [Google Scholar] [CrossRef]
- Chen, J.; Liu, Y.; Zhao, J.; Jiang, T.; Xu, T.; Liu, B.; Liu, Y.; Yang, B.; Li, Y.; Zhang, X.; et al. Three urban areas of China: A cohort study of maternal-infant factors and HM protein components. Food Funct. 2022, 13, 5202–5214. [Google Scholar] [CrossRef]
- Ma, J.; Qiao, Y.; Zhao, P.; Li, W.; Katzmarzyk, P.T.; Chaput, J.P.; Fogelholm, M.; Kuriyan, R.; Lambert, E.V.; Maher, C.; et al. Breastfeeding and childhood obesity: A 12-country study. Matern. Child. Nutr. 2020, 16, e12984. [Google Scholar] [CrossRef]
- Santos, M.D.; Ferrari, G.; Drenowatz, C.; Estivaleti, J.M.; de Victo, E.R.; de Oliveira, L.C.; Matsudo, V. Association between breastfeeding, parents’ body mass index and birth weight with obesity indicators in children. BMC Pediatr. 2022, 22, 604. [Google Scholar] [CrossRef]
- Ma, J.; Palmer, D.J.; Geddes, D.; Lai, C.T.; Stinson, L. Human Milk Microbiome and Microbiome-Related Products: Potential Modulators of Infant Growth. Nutrients 2022, 14, 5148. [Google Scholar] [CrossRef] [PubMed]
- Hassan, M.A.; Abedelmaksoud, T.G.; Abd El-Maksoud, A.A. Effects of Lactoferrin Supplemented with Fermented Milk on Obesity-Associated Pancreatic Damage in Rats. Life 2022, 12, 2019. [Google Scholar] [CrossRef] [PubMed]
- Wu, M.; Xun, Y.; Dong, H.; Han, S.; Huang, H.; Xue, Y.; Zhang, J.; Yu, W.; Wang, S.; Ning, Y.; et al. The Concentration of Lactoferrin in Breast Milk Correlates with Maternal Body Mass Index and Parity. Breastfeed. Med. 2024, 19, 208–216. [Google Scholar] [CrossRef] [PubMed]
- Yang, Z.; Jiang, R.; Chen, Q.; Wang, J.; Duan, Y.; Pang, X.; Jiang, S.; Bi, Y.; Zhang, H.; Lönnerdal, B.; et al. Concentration of Lactoferrin in Human Milk and Its Variation during Lactation in Different Chinese Populations. Nutrients 2018, 10, 1235. [Google Scholar] [CrossRef] [PubMed]
- Kulesza-Brończyk, B.; Bień, A.; Sobieraj, P.; Orczyk-Pawiłowicz, M.; Lis-Kuberka, J.; Czosnykowska-Łukacka, M.; Bzikowska-Jura, A. Factors affecting total protein and lactoferrin in human milk. Sci. Rep. 2023, 13, 22434. [Google Scholar] [CrossRef]
- Liu, Y.-P.; Dong, X.-Y.; Jiang, T.-M.; Li, Z.; Chen, L.-J. Lactoferrin concentrationin in human milk and its affection factors. China Food Addit. 2018, 8, 70–74. [Google Scholar] [CrossRef]
- Zhu, J.; Yu, X.; Wang, Y.; Bai, S.; Lai, J.; Tong, X.; Xing, Y. Longitudinal changes of lactopontin (milk osteopontin) in term and preterm human milk. Front. Nutr. 2022, 9, 962802. [Google Scholar] [CrossRef]
- Zhou, Y.; Chen, Q.; Jiang, R.; Wang, J.; Duan, Y.; Bi, Y.; Yang, Z.; Lai, J. Concentration of osteopontin in human milk and associated factors in Chinese populations from 2011 to 2013. Wei Sheng Yan Jiu 2022, 51, 39–44. [Google Scholar]
- Le Parc, A.; Leonil, J.; Chanat, E. AlphaS1-casein, which is essential for efficient ER-to-Golgi casein transport, is also present in a tightly membrane-associated form. BMC Cell Biol. 2010, 11, 65. [Google Scholar] [CrossRef]
- Dingess, K.A.; Gazi, I.; van den Toorn, H.W.P.; Mank, M.; Stahl, B.; Reiding, K.R.; Heck, A.J.R. Monitoring Human Milk β-Casein Phosphorylation and O-Glycosylation Over Lactation Reveals Distinct Differences between the Proteome and Endogenous Peptidome. Int. J. Mol. Sci. 2021, 22, 8140. [Google Scholar] [CrossRef]
- Lönnerdal, B.; Erdmann, P.; Thakkar, S.K.; Sauser, J.; Destaillats, F. Longitudinal evolution of true protein, amino acids and bioactive proteins in breast milk: A developmental perspective. J. Nutr. Biochem. 2017, 41, 1–11. [Google Scholar] [CrossRef] [PubMed]
- Leghi, G.E.; Middleton, P.F.; Netting, M.J.; Wlodek, M.E.; Geddes, D.T.; Muhlhausler, B.S. A Systematic Review of Collection and Analysis of Human Milk for Macronutrient Composition. J. Nutr. 2020, 150, 1652–1670. [Google Scholar] [CrossRef] [PubMed]
- Zurutuza, J.I.; Caba, M.; Morales-Romero, J.; Caba-Flores, M.D.; Viveros-Contreras, R. Maternal Overweight and Obesity and Their Effect on the Growth of the Newborn During the First Six Months of Life. Cureus 2024, 16, e64867. [Google Scholar] [CrossRef] [PubMed]
- Samuel, T.M.; Zhou, Q.; Giuffrida, F.; Munblit, D.; Verhasselt, V.; Thakkar, S.K. Nutritional and Non-nutritional Composition of Human Milk Is Modulated by Maternal, Infant, and Methodological Factors. Front. Nutr. 2020, 7, 576133. [Google Scholar] [CrossRef]
- Komatsu, Y.; Wada, Y.; Tabata, F.; Kawakami, S.; Takeda, Y.; Nakamura, K.; Ayabe, T.; Nakamura, K.; Kimura, T.; Tamakoshi, A. Associations between Maternal Diet, Human Milk Macronutrients, and Breast-Fed Infant Growth during the First Month of Life in the SMILE Iwamizawa in Japan. Nutrients 2023, 15, 654. [Google Scholar] [CrossRef]
- Bravi, F.; Wiens, F.; Decarli, A.; Dal Pont, A.; Agostoni, C.; Ferraroni, M. Impact of maternal nutrition on breast-milk composition: A systematic review. Am. J. Clin. Nutr. 2016, 104, 646–662. [Google Scholar] [CrossRef]
- Vernal, S. Human Milk and Infant Formula; Academic Press: Cambridge, MA, USA, 1982; pp. 7–28. [Google Scholar]


| Pre-Gestational BMI | Category of Gestational Weight Gain | ||
|---|---|---|---|
| Inadequate | Appropriate | Excessive | |
| Underweight (BMI < 18.5 kg/m2) | GWG < 11 kg | 11 ≤ GWG ≤ 16 | GWG > 16 kg |
| Normal (18.5 kg/m2 ≤ BMI < 24.0 kg/m2) | GWG < 8 kg | 8 ≤ GWG ≤ 14 | GWG > 14 kg |
| Overweight (24.0 kg/m2 ≤ BMI < 28.0 kg/m2) | GWG < 7 kg | 7 ≤ GWG ≤ 11 | GWG > 11 kg |
| Obesity (BMI ≥ 28.0 kg/m2) | GWG < 5 kg | 5 ≤ GWG ≤ 9 | GWG > 9 kg |
| Variables | Descriptive Value |
|---|---|
| Maternal age (year, ) | 29.7 ± 4.2 |
| Lactation stage (day, M(P25, P75)) | 51 (37, 71) |
| Maternal BMI (kg/m2, ) | 23.2 ± 3.4 |
| Area (%) | |
| West | 19 (27.1%) |
| South | 15 (21.4%) |
| North | 15 (21.4%) |
| East | 21 (30.0%) |
| Cesarean (%) | 25 (35.7%) |
| GWG (%) | |
| Inadequate | 13 (18.6%) |
| Appropriate | 33 (47.1%) |
| Excessive | 24 (34.3%) |
| Infant gender (%) | |
| Male | 39 (55.7%) |
| Female | 31 (44.3%) |
| Gestational hypertension (%) | 4 (5.7%) |
| Gestational diabetes (%) | 7 (10.0%) |
| Variables | Maternal BMI (kg/m2, ) | Underweight | Normal | Overweight | Obesity | P1 | P2 |
|---|---|---|---|---|---|---|---|
| Maternal age (year, ) | - | 27.7 ± 3.9 | 29.5 ± 4.4 | 31.2 ± 4.2 | 28.8 ± 2.8 | 0.202 | |
| Lactation stage (day, M(P25, P75)) | - | 65 (50, 87) | 51 (35, 74) | 52 (35, 68) | 39 (34, 64) | 0.220 | |
| Area (%) | 0.135 | 0.589 | |||||
| West | 22.6 ± 3.4 | 2 (10.5) | 11 (57.9) | 4 (21.1) | 2 (10.5) | ||
| South | 22.3 ± 3.8 | 4 (26.7) | 6 (40.0) | 4 (26.7) | 1 (6.7) | ||
| North | 24.9 ± 2.9 | 0 | 7 (46.7) | 5 (33.3) | 3 (20.0) | ||
| East | 23.3 ± 3.2 | 1 (4.8) | 11 (52.4) | 7 (33.3) | 2 (9.5) | ||
| Delivery mode (%) | 0.703 | 0.979 | |||||
| Cesarean | 23.4 ± 3.4 | 3 (12.0) | 12 (48.0) | 7 (28.0) | 3 (12.0) | ||
| Eutocia | 23.1 ± 3.4 | 4 (8.9) | 23 (51.1) | 13 (28.9) | 5 (11.1) | ||
| GWG (%) | <0.001 | <0.001 | |||||
| Inadequate | 20.8 ± 3.4 a | 6 (46.2) a | 4 (30.8) b | 3 (23.1) b | 0 a | ||
| Appropriate | 22.9 ± 2.7 a | 1 (3.0) a | 22 (66.7) a | 8 (24.2) a | 2 (6.1) a | ||
| Excessive | 25.1 ± 3.4 b | 0 a | 9 (37.5) a | 9 (37.5) ab | 6 (25.0) b | ||
| Infant gender (%) | 0.646 | 0.691 | |||||
| Male | 23.4 ± 3.5 | 4 (10.3) | 17 (43.6) | 13 (33.3) | 5 (12.8) | ||
| Female | 23.0 ± 3.3 | 3 (9.7) | 18 (58.1) | 7 (22.6) | 3 (9.7) | ||
| Gestational hypertension (%) | 0.615 | 0.481 | |||||
| Yes | 23.0 ± 0.8 | 0 | 4 (100.0) | 0 | 0 | ||
| No | 23.2 ± 3.5 | 7 (10.5) | 31 (47.0) | 20 (30.3) | 8 (12.1) | ||
| Gestational diabetes (%) | 0.705 | 0.617 | |||||
| Yes | 22.8 ± 2.7 | 1 (14.3) | 3 (42.9) | 3 (42.9) | 0 | ||
| No | 23.3 ± 3.5 | 6 (9.5) | 32 (50.8) | 17 (27.0) | 8 (12.7) |
| BMI | Lg TP | p |
|---|---|---|
| Overall | 0.097 ± 0.088 | 0.021 |
| Underweight | 0.028 ± 0.076 a | |
| Normal | 0.100 ± 0.085 a,b | |
| Overweight | 0.090 ± 0.090 a,b | |
| Obesity | 0.167 ± 0.065 b |
| BMI | Lg α-La | p | Lg LF | p | Lg OPN | p |
|---|---|---|---|---|---|---|
| Overall | 2.564 ± 0.123 | 0.036 | 1.939 ± 0.156 | 0.003 | 1.287 ± 0.122 | 0.018 |
| Underweight | 2.467 ± 0.133 a | 1.755 ± 0.163 a | 1.180 ± 0.120 a | |||
| Normal | 2.562 ± 0.127 a,b | 1.935 ± 0.140 b | 1.296 ± 0.107 a,b | |||
| Overweight | 2.566 ± 0.110 a,b | 1.979 ± 0.144 b | 1.276 ± 0.130 a,b | |||
| Obesity | 2.651 ± 0.074 b | 2.016 ± 0.142 b | 1.372 ± 0.104 b |
| BMI | α-La/TP(%) | p | LF/TP(%) | p | OPN/TP(%) | p |
|---|---|---|---|---|---|---|
| Overall | 29.7 ± 4.9 | 0.555 | 7.3 ± 2.1 | 0.091 | 1.6 ± 0.3 | 0.786 |
| Underweight | 27.8 ± 4.7 | 5.7 ± 2.1 | 1.5 ± 0.4 | |||
| Normal | 29.4 ± 4.4 | 7.1 ± 2.0 | 1.6 ± 0.3 | |||
| Overweight | 30.5 ± 5.9 | 8.0 ± 1.9 | 1.6 ± 0.4 | |||
| Obesity | 30.8 ± 4.7 | 7.5 ± 2.6 | 1.6 ± 0.3 |
| BMI | Lg αS1-CN | p | Lg β-CN | p | Lg κ-CN | p |
|---|---|---|---|---|---|---|
| Overall | 1.719 ± 0.113 | 0.002 | 2.670 ± 0.122 | 0.006 | 1.601 ± 0.125 | 0.064 |
| Underweight | 1.573 ± 0.094 a | 2.539 ± 0.109 a | 1.486 ± 0.107 | |||
| Normal | 1.730 ± 0.107 b | 2.696 ± 0.098 b | 1.615 ± 0.110 | |||
| Overweight | 1.728 ± 0.112 b | 2.648 ± 0.145 a,b | 1.603 ± 0.138 | |||
| Obesity | 1.775 ± 0.063 b | 2.724 ± 0.083 b | 1.639 ± 0.138 |
| BMI | αS1-CN/TP(%) | p | β-CN/TP(%) | p | κ-CN/TP(%) | p |
|---|---|---|---|---|---|---|
| Overall | 4.2 ± 0.6 | 0.005 | 37.9 ± 6.0 | 0.023 | 3.3 ± 0.7 | 0.524 |
| Underweight | 3.5 ± 0.4 a | 32.7 ± 4.0 a | 3.0 ± 0.8 | |||
| Normal | 4.3 ± 0.5 b | 39.7 ± 4.6 b | 3.4 ± 0.7 | |||
| Overweight | 4.4 ± 0.7 b | 37.2 ± 7.9 a,b | 3.3 ± 0.7 | |||
| Obesity | 4.1 ± 0.6 a,b | 36.4 ± 5.1 a,b | 3.1 ± 0.9 |
| BMI | Lg BTN | p | Lg PAS 6/7 | p | Lg FABP | p | Lg XOR | p |
|---|---|---|---|---|---|---|---|---|
| Overall | 0.791 ± 0.170 | 0.043 | 0.294 ± 0.149 | 0.205 | −0.099 ± 0.239 | 0.060 | 1.092 ± 0.165 | 0.032 |
| Underweight | 0.801 ± 0.165 a,b | 0.232 ± 0.157 | −0.028 ± 0.225 | 1.091 ± 0.113 a,b | ||||
| Normal | 0.792 ± 0.160 a,b | 0.286 ± 0.151 | −0.149 ± 0.221 | 1.084 ± 0.160 a,b | ||||
| Overweight | 0.730 ± 0.177 a | 0.292 ± 0.143 | −0.110 ± 0.256 | 1.045 ± 0.172 a | ||||
| Obesity | 0.930 ± 0.138 b | 0.389 ± 0.133 | 0.091 ± 0.209 | 1.244 ± 0.135 b |
Disclaimer/Publisher’s Note: The statements, opinions and data contained in all publications are solely those of the individual author(s) and contributor(s) and not of MDPI and/or the editor(s). MDPI and/or the editor(s) disclaim responsibility for any injury to people or property resulting from any ideas, methods, instructions or products referred to in the content. |
© 2024 by the authors. Licensee MDPI, Basel, Switzerland. This article is an open access article distributed under the terms and conditions of the Creative Commons Attribution (CC BY) license (https://creativecommons.org/licenses/by/4.0/).
Share and Cite
Liang, D.; Jiang, Z.; Zhang, Y.; Li, N.; Jiang, H.; Ding, G. Maternal BMI During Lactation Is Associated with Major Protein Compositions in Early Mature Milk. Nutrients 2024, 16, 3811. https://doi.org/10.3390/nu16223811
Liang D, Jiang Z, Zhang Y, Li N, Jiang H, Ding G. Maternal BMI During Lactation Is Associated with Major Protein Compositions in Early Mature Milk. Nutrients. 2024; 16(22):3811. https://doi.org/10.3390/nu16223811
Chicago/Turabian StyleLiang, Dong, Zeyu Jiang, Yumei Zhang, Ning Li, Hua Jiang, and Gangqiang Ding. 2024. "Maternal BMI During Lactation Is Associated with Major Protein Compositions in Early Mature Milk" Nutrients 16, no. 22: 3811. https://doi.org/10.3390/nu16223811
APA StyleLiang, D., Jiang, Z., Zhang, Y., Li, N., Jiang, H., & Ding, G. (2024). Maternal BMI During Lactation Is Associated with Major Protein Compositions in Early Mature Milk. Nutrients, 16(22), 3811. https://doi.org/10.3390/nu16223811