
Development and Validation of the Meiji Nutritional Profiling System per Serving Size
 , , ,
, , , 
Abstract
1. Introduction
2. Materials and Methods
2.1. Nutrient Composition Database
2.2. Meiji NPS for Adults and Older Adults
2.3. Serving Size
2.4. Statistical Analysis
3. Results
3.1. Serving Size
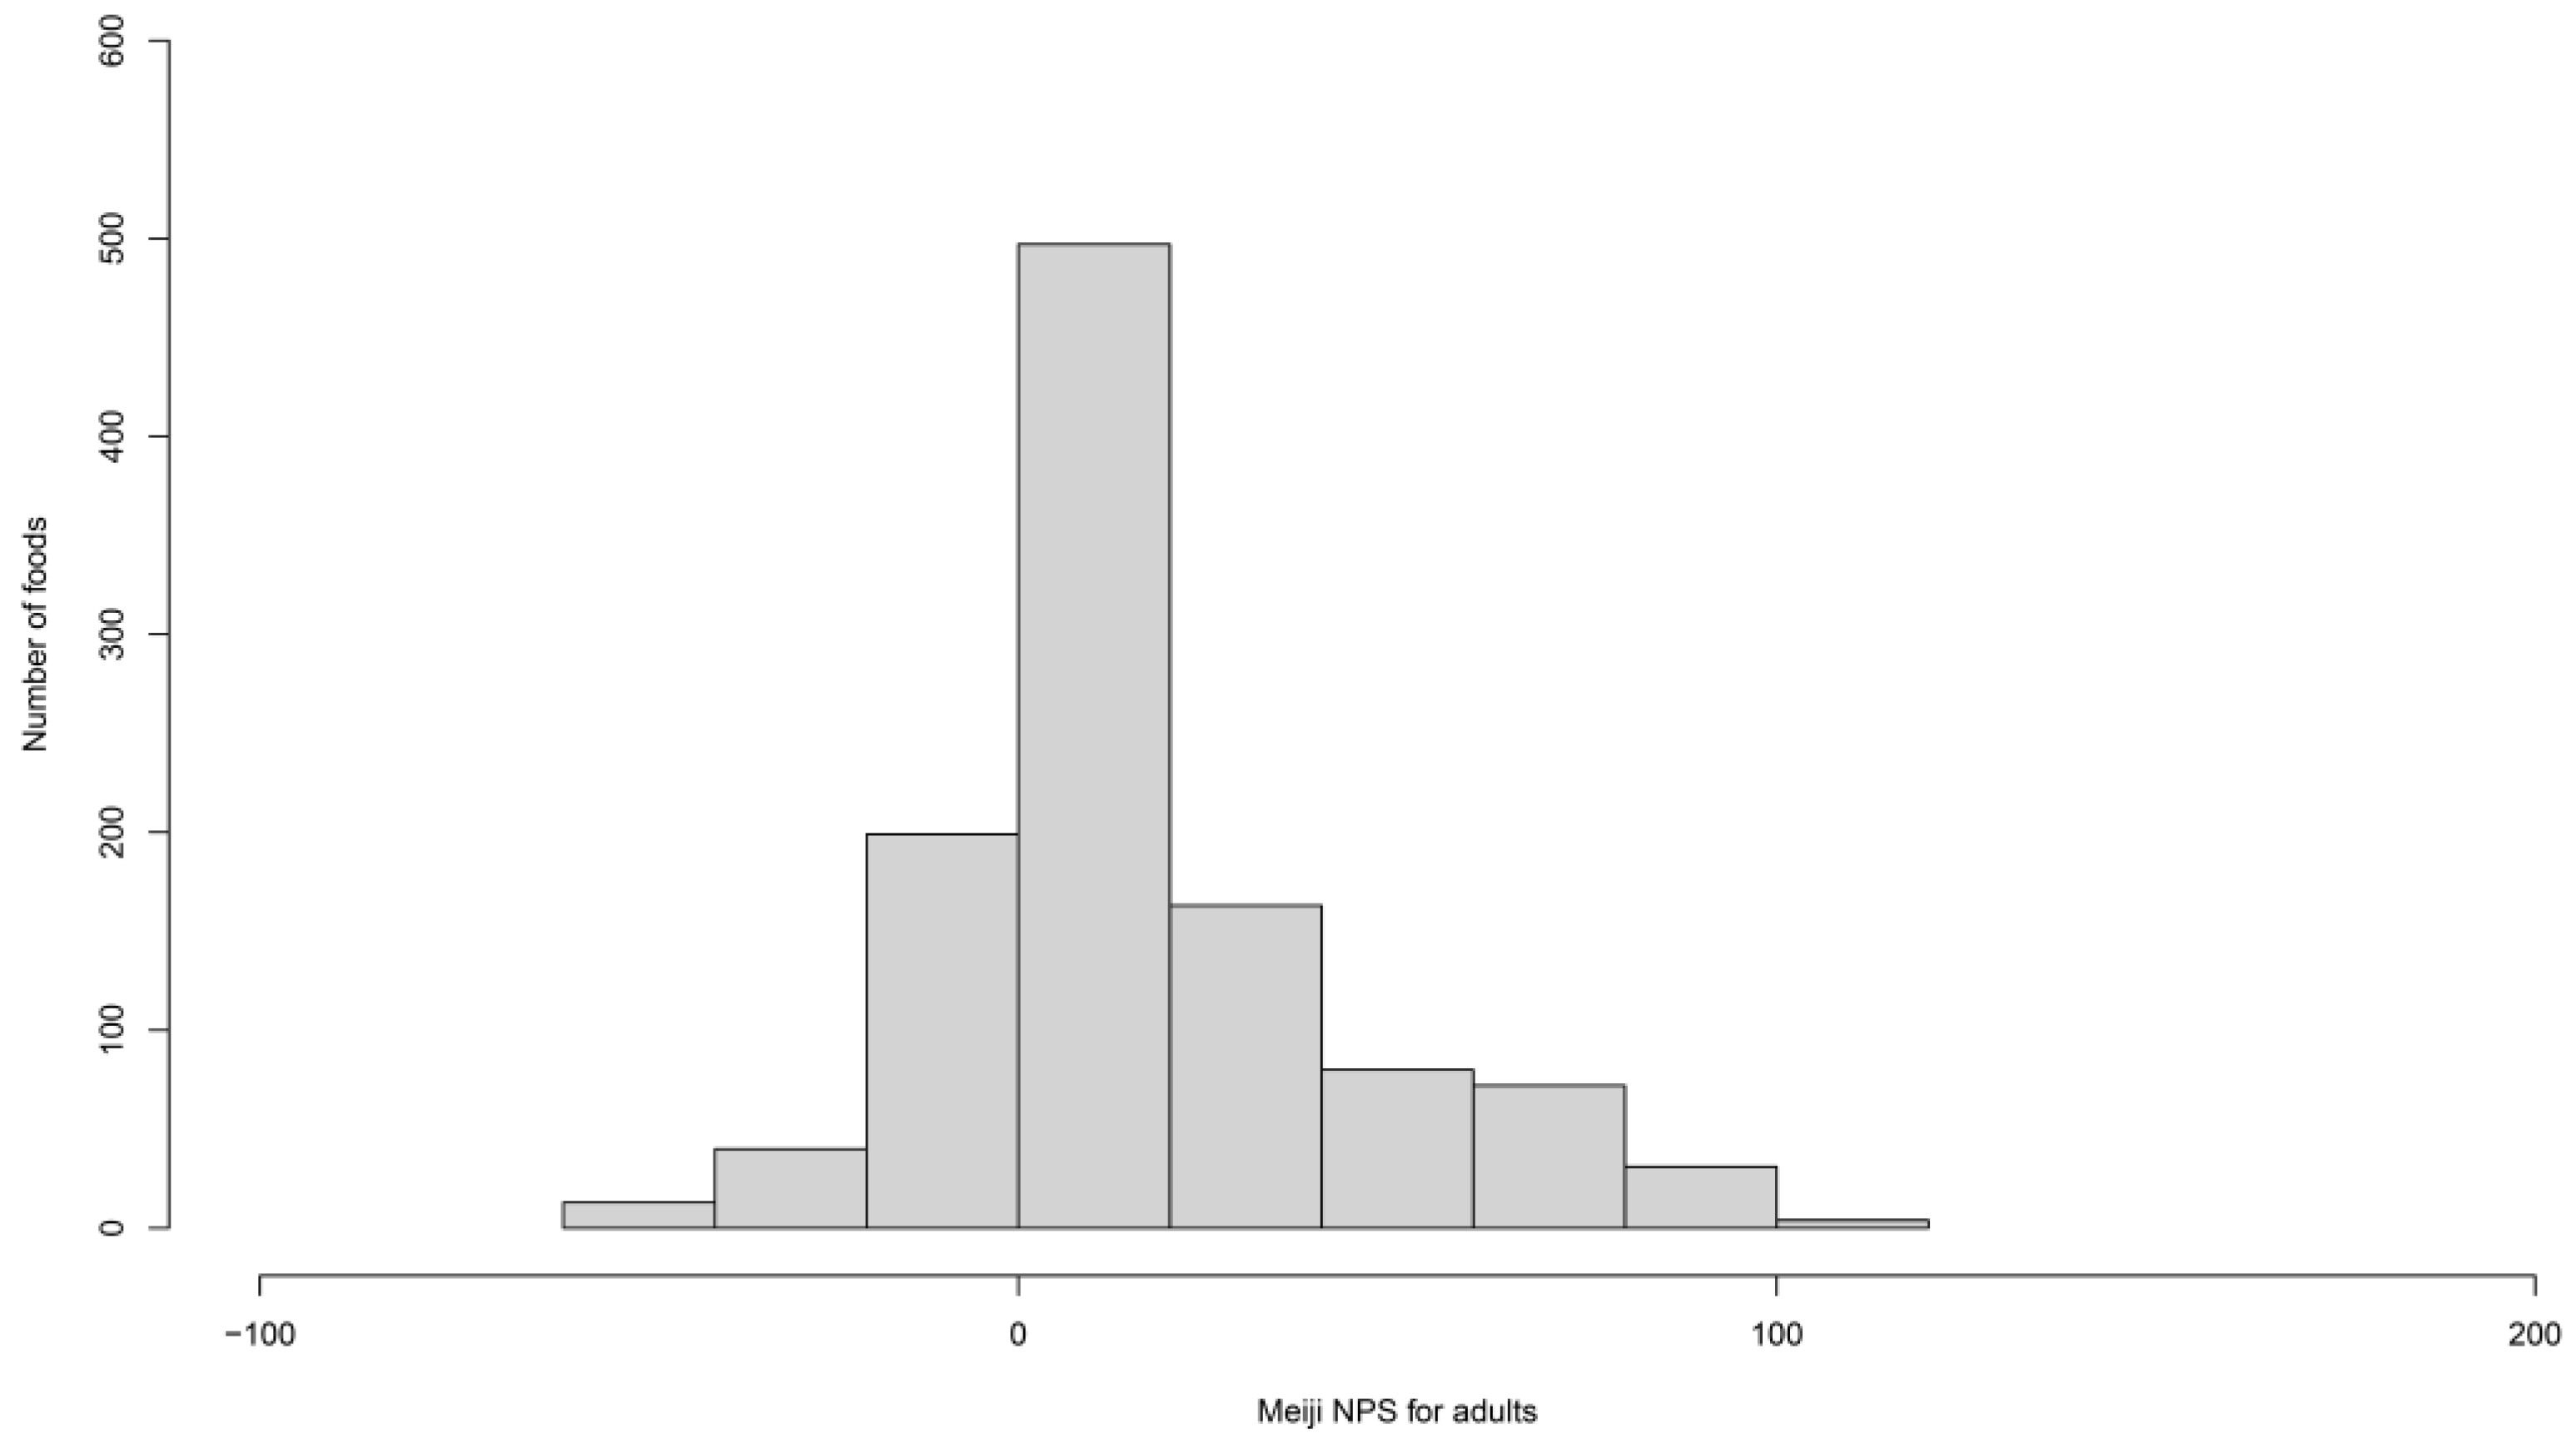
3.2. Meiji NPS for Adults per Serving Size
3.3. Convergent Validity of the Meiji NPS for Adults and Older Adults per Serving Size
4. Discussion
Limitations
5. Conclusions
Supplementary Materials
Author Contributions
Funding
Institutional Review Board Statement
Informed Consent Statement
Data Availability Statement
Acknowledgments
Conflicts of Interest
References
- WHO. Use of Nutrient Profile Models for Nutrition Andhealth Policies: Meeting Report on the Use of Nutrient Models in the WHO Europian Region; WHO Regional Office for Europe: Geneva, Switzerland, 2021. [Google Scholar]
- Drewnowski, A. Uses of nutrient profiling to address public health needs: From regulation to reformulation. Proc. Nutr. Soc. 2017, 76, 220–229. [Google Scholar] [CrossRef] [PubMed]
- Drewnowski, A.; Maillot, M.; Darmon, N. Should nutrient profiles be based on 100 g, 100 kcal or serving size? Eur. J. Clin. Nutr. 2009, 63, 898–904. [Google Scholar] [CrossRef] [PubMed]
- Department of Health. Nutrient Profiling Technical Guidance. Available online: https://assets.publishing.service.gov.uk/government/uploads/system/uploads/attachment_data/file/216094/dh_123492.pdf (accessed on 31 July 2024).
- About Health Star Ratings. Available online: http://healthstarrating.gov.au/internet/healthstarrating/publishing.nsf/Content/About-health-stars (accessed on 20 February 2024).
- Hercberg, S.; Touvier, M.; Salas-Salvado, J. The Nutri-Score nutrition label. Int. J. Vitam. Nutr. Res. 2022, 92, 147–157. [Google Scholar] [CrossRef] [PubMed]
- Kanter, R.; Vanderlee, L.; Vandevijvere, S. Front-of-package nutrition labelling policy: Global progress and future directions. Public. Health Nutr. 2018, 21, 1399–1408. [Google Scholar] [CrossRef] [PubMed]
- Merz, B.; Temme, E.; Alexiou, H.; Beulens, J.W.J.; Buyken, A.E.; Bohn, T.; Ducrot, P.; Falquet, M.N.; Solano, M.G.; Haidar, H.; et al. Nutri-Score 2023 update. Nat. Food 2024, 5, 102–110. [Google Scholar] [CrossRef] [PubMed]
- Front-of-Package Nutrition Labelling. Available online: https://www.canada.ca/en/health-canada/news/2022/06/front-of-package-nutrition-labelling.html (accessed on 21 February 2024).
- Nutrition Labelling: Front-of-Package Nutrition Symbol. Available online: https://www.canada.ca/en/health-canada/services/food-nutrition/nutrition-labelling/front-package.html (accessed on 21 February 2024).
- Lee, J.J.; Ahmed, M.; Julia, C.; Ng, A.P.; Paper, L.; Lou, W.Y.; L’Abbé, M.R. Examining the diet quality of Canadian adults and the alignment of Canadian front-of-pack labelling regulations with other front-of-pack labelling systems and dietary guidelines. Front. Public Health 2023, 11, 1168745. [Google Scholar] [CrossRef] [PubMed]
- Flexner, N.; Ahmed, M.; Mulligan, C.; Bernstein, J.T.; Christoforou, A.K.; Lee, J.J.; Khandpur, N.; L’Abbe, M.R. The estimated dietary and health impact of implementing the recently approved ‘high in’ front-of-package nutrition symbol in Canada: A food substitution scenario modeling study. Front. Nutr. 2023, 10, 1158498. [Google Scholar] [CrossRef] [PubMed]
- Lee, J.J.; Ahmed, M.; Ng, A.P.; Mulligan, C.; Flexner, N.; L’Abbé, M.R. Nutrient intakes and top food categories contributing to intakes of energy and nutrients-of-concern consumed by Canadian adults that would require a ‘high-in’ front-of-pack symbol according to Canadian labelling regulations. PLoS ONE 2023, 18, e0285095. [Google Scholar] [CrossRef] [PubMed]
- Drewnowski, A.; Fulgoni, V., 3rd. Nutrient profiling of foods: Creating a nutrient-rich food index. Nutr. Rev. 2008, 66, 23–39. [Google Scholar] [CrossRef]
- Fulgoni, V.L., 3rd; Keast, D.R.; Drewnowski, A. Development and validation of the nutrient-rich foods index: A tool to measure nutritional quality of foods. J. Nutr. 2009, 139, 1549–1554. [Google Scholar] [CrossRef]
- Drewnowski, A.; Amanquah, D.; Gavin-Smith, B. Perspective: How to Develop Nutrient Profiling Models Intended for Global Use: A Manual. Adv. Nutr. 2021, 12, 609–620. [Google Scholar] [CrossRef] [PubMed]
- Garsetti, M.; de Vries, J.; Smith, M.; Amosse, A.; Rolf-Pedersen, N.; ILSI Europe. Nutrient profiling schemes: Overview and comparative analysis. Eur. J. Nutr. 2007, 46, 15–28. [Google Scholar] [CrossRef] [PubMed]
- Kliemann, N.; Kraemer, M.V.S.; Scapin, T.; Rodrigues, V.M.; Fernandes, A.C.; Bernardo, G.L.; Uggioni, P.L.; Proença, R.P.C. Serving Size and Nutrition Labelling: Implications for Nutrition Information and Nutrition Claims on Packaged Foods. Nutrients 2018, 10, 891. [Google Scholar] [CrossRef]
- Van der Horst, K.; Bucher, T.; Duncanson, K.; Murawski, B.; Labbe, D. Consumer Understanding, Perception and Interpretation of Serving Size Information on Food Labels: A Scoping Review. Nutrients 2019, 11, 2189. [Google Scholar] [CrossRef]
- Mandle, J.; Tugendhaft, A.; Michalow, J.; Hofman, K. Nutrition labelling: A review of research on consumer and industry response in the global South. Glob. Health Action 2015, 8, 25912. [Google Scholar] [CrossRef] [PubMed]
- Wakayama, R.; Drewnowski, A.; Horimoto, T.; Saito, Y.; Yu, T.; Suzuki, T.; Takasugi, S. Development and Validation of the Meiji Nutritional Profiling System (Meiji NPS) to Address Dietary Needs of Adults and Older Adults in Japan. Nutrients 2024, 16, 936. [Google Scholar] [CrossRef] [PubMed]
- Yu, T.; Zhang, S.; Wakayama, R.; Horimoto, T.; Tange, C.; Nishita, Y.; Otsuka, R. The relationship between the dietary index based Meiji nutritional profiling system for adults and lifestyle-related diseases: A predictive validity study from the National Institute for Longevity Sciences—Longitudinal Study of Aging. Front. Nutr. 2024, 11, 1413980. [Google Scholar] [CrossRef]
- Japan: An Overview of the Food Labeling Standard. Available online: https://apps.fas.usda.gov/newgainapi/api/report/downloadreportbyfilename?filename=An%20Overview%20of%20the%20Food%20Labeling%20Standard_Tokyo_Japan_5-26-2017.pdf (accessed on 21 February 2024).
- About Nutritional Information. Available online: https://www.caa.go.jp/policies/policy/food_labeling/nutrient_declearation/ (accessed on 31 July 2024).
- Guideline for Nutrition Labeling Based on the Food Labeling Act. Available online: https://www.caa.go.jp/policies/policy/food_labeling/nutrient_declearation/business/assets/food_labeling_cms206_20220531_08.pdf (accessed on 31 July 2024).
- Ishiyaku Publishers, Inc. [Ordinary Serving Values Food Composition Tables] Jouyouryou Shokuhin Seibun Hayami Hyou, 3rd ed.; The Japanese Clinical Nutrition Association; Ishiyaku Publishers, Inc.: Tokyo, Japan, 2006; p. 553. (In Japanese) [Google Scholar]
- Yuko Koyama, H.U. [Nutrient Amounts per Serving Size 100: Food Component Ranking] Serving Size Eiyouso Ryou 100, 2nd ed.; DAI-ICHI SHUPPAN Co., Ltd.: Tokyo, Japan, 2017; p. 136. (In Japanese) [Google Scholar]
- Ziauddeen, N.; Fitt, E.; Edney, L.; Dunford, E.; Neal, B.; Jebb, S.A. Variability in the reported energy, total fat and saturated fat contents in fast-food products across ten countries. Public Health Nutr. 2015, 18, 2962–2969. [Google Scholar] [CrossRef]
- Serving Size on the Nutrition Facts Label. Available online: https://www.fda.gov/food/nutrition-facts-label/serving-size-nutrition-facts-label (accessed on 20 February 2024).
- Codex Guidelines for Use of Nutrition and Health Claims (CAC/GL 23-1997). Available online: https://www.fao.org/ag/humannutrition/32444-09f5545b8abe9a0c3baf01a4502ac36e4.pdf (accessed on 21 February 2024).
- Ministry of Education, Culture, Sports, Science and Technology. Standard Tables of Food Composition in Japan -2020- (Eighth Rivised Edition); Report of the Subdivision on Resources The Council for Science and Technology; Ministry of Education, Culture, Sports, Science and Technology: Tokyo, Japan, 2020. [Google Scholar]
- Overview of the Dietary Reference Intakes for Japanese. 2020. Available online: https://www.mhlw.go.jp/content/10900000/000862500.pdf (accessed on 21 February 2024).
- National Health and Nutrition Survey. Available online: https://www.nibiohn.go.jp/eiken/kenkounippon21/en/eiyouchousa/ (accessed on 21 February 2024).
- Wakayama, R.; Takasugi, S.; Honda, K.; Kanaya, S. Application of a Two-Dimensional Mapping-Based Visualization Technique: Nutrient-Value-Based Food Grouping. Nutrients 2023, 15, 5006. [Google Scholar] [CrossRef]
- Schober, P.; Boer, C.; Schwarte, L.A. Correlation Coefficients: Appropriate Use and Interpretation. Anesth Analg. 2018, 126, 1763–1768. [Google Scholar] [CrossRef]
- Excel Calculator. Available online: http://www.healthstarrating.gov.au/internet/healthstarrating/publishing.nsf/Content/excel-calculator (accessed on 21 February 2024).
- Healthy Diet. Available online: https://www.who.int/news-room/fact-sheets/detail/healthy-diet (accessed on 5 September 2023).
- Shrivastava, S.R.; Shrivastava, P.S.; Ramasamy, J. World Health Organization advocates for a healthy diet for all: Global perspective. J. Res. Med. Sci. 2016, 21, 44. [Google Scholar] [CrossRef] [PubMed]
- Yoshiike, N.; Hayashi, F.; Takemi, Y.; Mizoguchi, K.; Seino, F. A New Food Guide in Japan: The Japanese Food Guide Spinning Top. Nutr. Rev. 2007, 65, 149–154. [Google Scholar] [CrossRef] [PubMed]
- Japanese Food Guide Spinning Top. Available online: https://www.maff.go.jp/e/policies/tech_res/attach/pdf/shokuiku-1.pdf (accessed on 31 July 2024).
- Interpretation of “Japanese Food Guide Spinning Top”. Available online: https://www.maff.go.jp/e/policies/tech_res/attach/pdf/shokuiku-2.pdf (accessed on 31 July 2024).
- [Targets of Health Japan 21] Kenkou Nihon 21 Mokuhyouchi Ichiran. Available online: https://www.mhlw.go.jp/www1/topics/kenko21_11/t2a.html (accessed on 31 July 2024). (In Japanese).
- Jiang, K.; Zhang, Z.; Fullington, L.A.; Huang, T.T.; Kaliszewski, C.; Wei, J.; Zhao, L.; Huang, S.; Ellithorpe, A.; Wu, S.; et al. Dietary Patterns and Obesity in Chinese Adults: A Systematic Review and Meta-Analysis. Nutrients 2022, 14, 4911. [Google Scholar] [CrossRef]
- Eslami, O.; Khorramrouz, F.; Sohouli, M.; Bagheri, N.; Shidfar, F.; Fernandez, M.L. Effect of nuts on components of metabolic syndrome in healthy adults with overweight/obesity: A systematic review and meta-analysis. Nutr. Metab. Cardiovasc. Dis. 2022, 32, 2459–2469. [Google Scholar] [CrossRef] [PubMed]
- Jayedi, A.; Ge, L.; Johnston, B.C.; Shahinfar, H.; Safabakhsh, M.; Mohamadpur, S.; Ghorbaninejad, P.; Abyadeh, M.; Zeraattalab-Motlagh, S.; Soltani, S.; et al. Comparative effectiveness of single foods and food groups on body weight: A systematic review and network meta-analysis of 152 randomized controlled trials. Eur. J. Nutr. 2023, 62, 1153–1164. [Google Scholar] [CrossRef]
- Fernández-Rodríguez, R.; Mesas, A.E.; Garrido-Miguel, M.; Martínez-Ortega, I.A.; Jiménez-López, E.; Martínez-Vizcaíno, V. The Relationship of Tree Nuts and Peanuts with Adiposity Parameters: A Systematic Review and Network Meta-Analysis. Nutrients 2021, 13, 2251. [Google Scholar] [CrossRef]
- Nishi, S.K.; Viguiliouk, E.; Blanco Mejia, S.; Kendall, C.W.C.; Bazinet, R.P.; Hanley, A.J.; Comelli, E.M.; Salas Salvadó, J.; Jenkins, D.J.A.; Sievenpiper, J.L. Are fatty nuts a weighty concern? A systematic review and meta-analysis and dose-response meta-regression of prospective cohorts and randomized controlled trials. Obes. Rev. 2021, 22, e13330. [Google Scholar] [CrossRef]
- Feng, Y.; Zhao, Y.; Liu, J.; Huang, Z.; Yang, X.; Qin, P.; Chen, C.; Luo, X.; Li, Y.; Wu, Y.; et al. Consumption of Dairy Products and the Risk of Overweight or Obesity, Hypertension, and Type 2 Diabetes Mellitus: A Dose-Response Meta-Analysis and Systematic Review of Cohort Studies. Adv. Nutr. 2022, 13, 2165–2179. [Google Scholar] [CrossRef]
- Mullins, A.P.; Arjmandi, B.H. Health Benefits of Plant-Based Nutrition: Focus on Beans in Cardiometabolic Diseases. Nutrients 2021, 13, 519. [Google Scholar] [CrossRef]
- Gibson, R.; Lau, C.E.; Loo, R.L.; Ebbels, T.M.D.; Chekmeneva, E.; Dyer, A.R.; Miura, K.; Ueshima, H.; Zhao, L.; Daviglus, M.L.; et al. The association of fish consumption and its urinary metabolites with cardiovascular risk factors: The International Study of Macro-/Micronutrients and Blood Pressure (INTERMAP). Am. J. Clin. Nutr. 2020, 111, 280–290. [Google Scholar] [CrossRef]
- Hirahatake, K.M.; Astrup, A.; Hill, J.O.; Slavin, J.L.; Allison, D.B.; Maki, K.C. Potential Cardiometabolic Health Benefits of Full-Fat Dairy: The Evidence Base. Adv. Nutr. 2020, 11, 533–547. [Google Scholar] [CrossRef] [PubMed]
- Alissa, E.M.; Ferns, G.A. Dietary fruits and vegetables and cardiovascular diseases risk. Crit. Rev. Food Sci. Nutr. 2017, 57, 1950–1962. [Google Scholar] [CrossRef] [PubMed]
- Bae, Y.J.; Kim, M.H.; Choi, M.K. Dietary Mineral Intake from Nuts and Its Relationship to Hypertension among Korean Adults. Biol. Trace Elem. Res. 2022, 200, 3519–3528. [Google Scholar] [CrossRef]
- Schwingshackl, L.; Schwedhelm, C.; Hoffmann, G.; Knüppel, S.; Iqbal, K.; Andriolo, V.; Bechthold, A.; Schlesinger, S.; Boeing, H. Food Groups and Risk of Hypertension: A Systematic Review and Dose-Response Meta-Analysis of Prospective Studies. Adv. Nutr. 2017, 8, 793–803. [Google Scholar] [CrossRef] [PubMed]
- Vimaleswaran, K.S.; Zhou, A.; Cavadino, A.; Hyppönen, E. Evidence for a causal association between milk intake and cardiometabolic disease outcomes using a two-sample Mendelian Randomization analysis in up to 1,904,220 individuals. Int. J. Obes. Lond. 2021, 45, 1751–1762. [Google Scholar] [CrossRef] [PubMed]
- Wilunda, C.; Sawada, N.; Goto, A.; Yamaji, T.; Iwasaki, M.; Tsugane, S.; Noda, M. Soy food and isoflavones are not associated with changes in serum lipids and glycohemoglobin concentrations among Japanese adults: A cohort study. Eur. J. Nutr. 2020, 59, 2075–2087. [Google Scholar] [CrossRef] [PubMed]
- Wang, N.; Deng, Z.; Wen, L.; Ding, Y.; He, G. Relationships between Maternal Dietary Patterns and Blood Lipid Levels during Pregnancy: A Prospective Cohort Study in Shanghai, China. Int. J. Environ. Res. Public Health 2021, 18, 3701. [Google Scholar] [CrossRef] [PubMed]
- Buscemi, S.; Corleo, D.; Buscemi, C.; Randazzo, C.; Borzì, A.M.; Barile, A.M.; Rosafio, G.; Ciaccio, M.; Caldarella, R.; Meli, F.; et al. Influence of Habitual Dairy Food Intake on LDL Cholesterol in a Population-Based Cohort. Nutrients 2021, 13, 593. [Google Scholar] [CrossRef] [PubMed]
- Ushula, T.W.; Mamun, A.; Darssan, D.; Wang, W.Y.S.; Williams, G.M.; Whiting, S.J.; Najman, J.M. Dietary patterns and the risk of abnormal blood lipids among young adults: A prospective cohort study. Nutr. Metab. Cardiovasc. Dis. 2022, 32, 1165–1174. [Google Scholar] [CrossRef]
- Lee, K.; Kim, H.; Rebholz, C.M.; Kim, J. Association between Different Types of Plant-Based Diets and Risk of Dyslipidemia: A Prospective Cohort Study. Nutrients 2021, 13, 220. [Google Scholar] [CrossRef]
- Kim, J.; Hoang, T.; Bu, S.Y.; Kim, J.M.; Choi, J.H.; Park, E.; Lee, S.M.; Park, E.; Min, J.Y.; Lee, I.S.; et al. Associations of Dietary Intake with Cardiovascular Disease, Blood Pressure, and Lipid Profile in the Korean Population: A Systematic Review and Meta-Analysis. J. Lipid Atheroscler. 2020, 9, 205–229. [Google Scholar] [CrossRef]
- Xu, L.; Tian, Z.; Chen, H.; Zhao, Y.; Yang, Y. Anthocyanins, Anthocyanin-Rich Berries, and Cardiovascular Risks: Systematic Review and Meta-Analysis of 44 Randomized Controlled Trials and 15 Prospective Cohort Studies. Front. Nutr. 2021, 8, 747884. [Google Scholar] [CrossRef] [PubMed]
- Tani, S.; Matsuo, R.; Imatake, K.; Suzuki, Y.; Takahashi, A.; Matsumoto, N. Association of daily fish intake with serum non-high-density lipoprotein cholesterol levels and healthy lifestyle behaviours in apparently healthy males over the age of 50 years in Japanese: Implication for the anti-atherosclerotic effect of fish consumption. Nutr. Metab. Cardiovasc. Dis. 2020, 30, 190–200. [Google Scholar] [CrossRef] [PubMed]
- Pearce, M.; Fanidi, A.; Bishop, T.R.P.; Sharp, S.J.; Imamura, F.; Dietrich, S.; Akbaraly, T.; Bes-Rastrollo, M.; Beulens, J.W.J.; Byberg, L.; et al. Associations of Total Legume, Pulse, and Soy Consumption with Incident Type 2 Diabetes: Federated Meta-Analysis of 27 Studies from Diverse World Regions. J. Nutr. 2021, 151, 1231–1240. [Google Scholar] [CrossRef] [PubMed]
- Nanri, A.; Mizoue, T.; Noda, M.; Takahashi, Y.; Matsushita, Y.; Poudel-Tandukar, K.; Kato, M.; Oba, S.; Inoue, M.; Tsugane, S. Fish intake and type 2 diabetes in Japanese men and women: The Japan Public Health Center-based Prospective Study. Am. J. Clin. Nutr. 2011, 94, 884–891. [Google Scholar] [CrossRef]
- Kondo, I.; Ojima, T.; Nakamura, M.; Hayasaka, S.; Hozawa, A.; Saitoh, S.; Ohnishi, H.; Akasaka, H.; Hayakawa, T.; Murakami, Y.; et al. Consumption of dairy products and death from cardiovascular disease in the Japanese general population: The NIPPON DATA80. J. Epidemiol. 2013, 23, 47–54. [Google Scholar] [CrossRef] [PubMed]
- Matsuyama, S.; Sawada, N.; Tomata, Y.; Zhang, S.; Goto, A.; Yamaji, T.; Iwasaki, M.; Inoue, M.; Tsuji, I.; Tsugane, S. Association between adherence to the Japanese diet and all-cause and cause-specific mortality: The Japan Public Health Center-based Prospective Study. Eur. J. Nutr. 2021, 60, 1327–1336. [Google Scholar] [CrossRef]
- Ozawa, M.; Ninomiya, T.; Ohara, T.; Doi, Y.; Uchida, K.; Shirota, T.; Yonemoto, K.; Kitazono, T.; Kiyohara, Y. Dietary patterns and risk of dementia in an elderly Japanese population: The Hisayama Study. Am. J. Clin. Nutr. 2013, 97, 1076–1082. [Google Scholar] [CrossRef]
- Ozawa, M.; Ohara, T.; Ninomiya, T.; Hata, J.; Yoshida, D.; Mukai, N.; Nagata, M.; Uchida, K.; Shirota, T.; Kitazono, T.; et al. Milk and dairy consumption and risk of dementia in an elderly Japanese population: The Hisayama Study. J. Am. Geriatr. Soc. 2014, 62, 1224–1230. [Google Scholar] [CrossRef]
- Kimura, Y.; Yoshida, D.; Ohara, T.; Hata, J.; Honda, T.; Hirakawa, Y.; Shibata, M.; Oishi, E.; Sakata, S.; Furuta, Y.; et al. Long-term association of vegetable and fruit intake with risk of dementia in Japanese older adults: The Hisayama study. BMC Geriatr. 2022, 22, 257. [Google Scholar] [CrossRef]
- Otsuka, R.; Tange, C.; Tomida, M.; Nishita, Y.; Kato, Y.; Yuki, A.; Ando, F.; Shimokata, H.; Arai, H. Dietary factors associated with the development of physical frailty in community-dwelling older adults. J. Nutr. Health Aging 2019, 23, 89–95. [Google Scholar] [CrossRef] [PubMed]
- Otsuka, R.; Zhang, S.; Tange, C.; Nishita, Y.; Tomida, M.; Kinoshita, K.; Kato, Y.; Ando, F.; Shimokata, H.; Arai, H. Association of Dietary Intake with the Transitions of Frailty among JapaneseCommunity-Dwelling Older Adults. J. Frailty Aging 2022, 11, 26–32. [Google Scholar] [CrossRef] [PubMed]
- Lu, Y.; Sugawara, Y.; Tsuji, I. Association between dairy intake and risk of incident dementia: The Ohsaki Cohort 2006 Study. Eur. J. Nutr. 2023, 62, 2751–2761. [Google Scholar] [CrossRef] [PubMed]
- Yamagishi, K.; Iso, H.; Tsugane, S. Saturated Fat Intake and Cardiovascular Disease in Japanese Population. J. Atheroscler. Thromb. 2015, 22, 435–439. [Google Scholar] [CrossRef] [PubMed]
- Muto, M.; Ezaki, O. High Dietary Saturated Fat is Associated with a Low Risk of Intracerebral Hemorrhage and Ischemic Stroke in Japanese but not in Non-Japanese: A Review and Meta-Analysis of Prospective Cohort Studies. J. Atheroscler. Thromb. 2018, 25, 375–392. [Google Scholar] [CrossRef]
- Kang, Z.-Q.; Yang, Y.; Xiao, B. Dietary saturated fat intake and risk of stroke: Systematic review and dose-response meta-analysis of prospective cohort studies. Nutr. Metab. Cardiovasc. Dis. 2020, 30, 179–189. [Google Scholar] [CrossRef] [PubMed]
- Fujiwara, A.; Murakami, K.; Asakura, K.; Uechi, K.; Sugimoto, M.; Wang, H.-C.; Masayasu, S.; Sasaki, S. Estimation of Starch and Sugar Intake in a Japanese Population Based on a Newly Developed Food Composition Database. Nutrients 2018, 10, 1474. [Google Scholar] [CrossRef] [PubMed]
- Fujiwara, A.; Murakami, K.; Asakura, K.; Uechi, K.; Sugimoto, M.; Wang, H.C.; Masayasu, S.; Sasaki, S. Association of Free Sugar Intake Estimated Using a Newly-Developed Food Composition Database With Lifestyles and Parental Characteristics Among Japanese Children Aged 3-6 Years: DONGuRI Study. J. Epidemiol. 2019, 29, 414–423. [Google Scholar] [CrossRef] [PubMed]
- Fujiwara, A.; Okada, E.; Okada, C.; Matsumoto, M.; Takimoto, H. Association between free sugar intake and nutrient dilution among Japanese children and adolescents: The 2016 National Health and Nutrition Survey, Japan. Br. J. Nutr. 2021, 125, 1394–1404. [Google Scholar] [CrossRef]
- Vartanian, L.R.; Schwartz, M.B.; Brownell, K.D. Effects of soft drink consumption on nutrition and health: A systematic review and meta-analysis. Am. J. Public Health 2007, 97, 667–675. [Google Scholar] [CrossRef]
- Te Morenga, L.; Mallard, S.; Mann, J. Dietary sugars and body weight: Systematic review and meta-analyses of randomised controlled trials and cohort studies. BMJ 2012, 346, e7492. [Google Scholar] [CrossRef]
- Nguyen, M.; Jarvis, S.E.; Tinajero, M.G.; Yu, J.; Chiavaroli, L.; Mejia, S.B.; Khan, T.A.; Tobias, D.K.; Willett, W.C.; Hu, F.B.; et al. Sugar-sweetened beverage consumption and weight gain in children and adults: A systematic review and meta-analysis of prospective cohort studies and randomized controlled trials. Am. J. Clin. Nutr. 2023, 117, 160–174. [Google Scholar] [CrossRef] [PubMed]
- Malik, V.S.; Hu, F.B. The role of sugar-sweetened beverages in the global epidemics of obesity and chronic diseases. Nat. Rev. Endocrinol. 2022, 18, 205–218. [Google Scholar] [CrossRef] [PubMed]
- Xi, B.; Li, S.; Liu, Z.; Tian, H.; Yin, X.; Huai, P.; Tang, W.; Zhou, D.; Steffen, L.M. Intake of fruit juice and incidence of type 2 diabetes: A systematic review and meta-analysis. PLoS ONE 2014, 9, e93471. [Google Scholar] [CrossRef] [PubMed]
- Murphy, M.M.; Barraj, L.M.; Brisbois, T.D.; Duncan, A.M. Frequency of fruit juice consumption and association with nutrient intakes among Canadians. Nutr. Health 2020, 26, 277–283. [Google Scholar] [CrossRef] [PubMed]
- O’Neil, C.E.; Nicklas, T.A.; Rampersaud, G.C.; Fulgoni, V.L., 3rd. One hundred percent orange juice consumption is associated with better diet quality, improved nutrient adequacy, and no increased risk for overweight/obesity in children. Nutr. Res. 2011, 31, 673–682. [Google Scholar] [CrossRef] [PubMed]
- Mitchell, E.S.; Musa-Veloso, K.; Fallah, S.; Lee, H.Y.; Chavez, P.J.; Gibson, S. Contribution of 100% Fruit Juice to Micronutrient Intakes in the United States, United Kingdom and Brazil. Nutrients 2020, 12, 1258. [Google Scholar] [CrossRef] [PubMed]
- Rampersaud, G.C.; Valim, M.F. 100% citrus juice: Nutritional contribution, dietary benefits, and association with anthropometric measures. Crit. Rev. Food Sci. Nutr. 2017, 57, 129–140. [Google Scholar] [CrossRef]
- Rossi, I.; Mignogna, C.; Del Rio, D.; Mena, P. Health effects of 100% fruit and vegetable juices: Evidence from human subject intervention studies. Nutr. Res. Rev. 2024, 37, 194–238. [Google Scholar] [CrossRef]
- Ruxton, C.H.S.; Myers, M. Fruit Juices: Are They Helpful or Harmful? An Evidence Review. Nutrients 2021, 13, 1815. [Google Scholar] [CrossRef]
- Bowman, S.A. Added sugars: Definition and estimation in the USDA Food Patterns Equivalents Databases. J. Food Compos. Anal. 2017, 64, 64–67. [Google Scholar] [CrossRef]
- Haskelberg, H.; Neal, B.; Dunford, E.; Flood, V.; Rangan, A.; Thomas, B.; Cleanthous, X.; Trevena, H.; Zheng, J.M.; Louie, J.C.; et al. High variation in manufacturer-declared serving size of packaged discretionary foods in Australia. Br. J. Nutr. 2016, 115, 1810–1818. [Google Scholar] [CrossRef] [PubMed]

| Items | For Adults | For Older Adults | |||
|---|---|---|---|---|---|
| RDV | Cap | RDV | Cap | ||
| Nutrients to encourage | Protein | 65 g | 65 g | 60 g | 60 g |
| Dietary fiber | 21 g | 21 g | 20 g | 20 g | |
| Calcium | 1000 mg | 423.9 mg | 750 mg | 389.4 mg | |
| Iron | 12 mg | 5.8 mg | NA | NA | |
| Vitamin D | 9.5 µg | 6.2 µg | 8.5 µg | 8.5 µg | |
| Nutrients to limit | Energy | 2800 kcal | NA | 2400 kcal | NA |
| SFAs | 31.1 g | NA | NA | NA | |
| Sugar | 70 g | NA | 60 g | NA | |
| Salt equivalents | 7.5 g | NA | 7.5 g | NA | |
| Food groups to encourage | Fruits | 200 g | 200 g | 200 g | 113 g |
| Vegetables | 350 g | 157.7 g | 350 g | 84.7 g | |
| Nuts | 75 g | 75 g | 75 g | 75 g | |
| Legumes | 100 g | 90 g | 100 g | 57 g | |
| Dairy | 130 g | 108.5 g | 130 g | 55 g | |
| Items | n | Median (g) | Max (g) | Min (g) | IQR |
|---|---|---|---|---|---|
| Cereals | 77 | 80.0 | 300.0 | 3.0 | 30.0 to 140.0 |
| Potatoes and starches | 18 | 55.0 | 80.0 | 15.0 | 40.0 to 60.0 |
| Sugars and sweeteners | 0 | NA | NA | NA | NA |
| Pulses | 42 | 35.0 | 175.0 | 4.0 | 15.0 to 45.0 |
| Nuts and seeds | 22 | 13.8 | 25.0 | 0.8 | 7.5 to 15.0 |
| Vegetables | 123 | 30.0 | 175.0 | 0.8 | 15.0 to 50.0 |
| Fruits | 62 | 50.0 | 175.0 | 5.0 | 26.3 to 65.0 |
| Mushrooms | 24 | 15.0 | 25.0 | 1.5 | 13.8 to 15.0 |
| Algae | 9 | 3.0 | 7.5 | 0.5 | 2.0 to 7.5 |
| Fish and seafood | 350 | 35.0 | 70.0 | 1.0 | 15.0 to 45.0 |
| Meat | 210 | 40.0 | 55.0 | 4.0 | 35.0 to 45.0 |
| Eggs | 13 | 22.5 | 50.0 | 10.0 | 10.0 to 40.0 |
| Milk and milk products | 37 | 15.0 | 175.0 | 6.5 | 12.5 to 175.0 |
| Fats and oils | 4 | 10.8 | 11.5 | 7.5 | 9.4 to 11.5 |
| Confectionery | 82 | 30.0 | 80.0 | 2.0 | 20.0 to 50.0 |
| Beverages | 10 | 180.0 | 500.0 | 1.5 | 90.0 to 180.0 |
| Seasonings and spices | 16 | 10.0 | 15.0 | 1.0 | 9.5 to 12.5 |
| Total | 1099 | 35.0 | 500.0 | 0.5 | 20.0 to 45.0 |
| Items | n | Meiji NPS per Serving Size | Meiji NPS per 100 g | ||||||
|---|---|---|---|---|---|---|---|---|---|
| Median | Max | Min | IQR | Median | Max | Min | IQR | ||
| Pulses | 42 | 55.7 | 114.9 | 6.6 | 38.0 to 69.9 | 161.3 | 278.2 | 66.3 | 116.1 to 245.1 |
| Nuts and seeds | 22 | 26.3 | 45.5 | 1.8 | 10.0 to 31.7 | 152.2 | 257.1 | −9.1 | 134.2 to 184.2 |
| Fish and seafood | 350 | 25.0 | 102.8 | −38.8 | 7.8 to 53.8 | 62.5 | 229.3 | −155.2 | 27.7 to 91.1 |
| Fruits | 62 | 15.1 | 91.2 | −12.4 | 6.5 to 28.9 | 39.9 | 77.7 | −165.6 | 134.2 to 184.2 |
| Vegetables | 123 | 13.8 | 47.6 | 0.2 | 7.8 to 19.9 | 46.2 | 141.7 | 3.3 | 38.2 to 64.5 |
| Milk and milk products | 37 | 11.6 | 102.8 | −38.8 | 7.8 to 53.8 | 54.2 | 83.8 | −147.2 | −31.7 to 74.5 |
| Mushrooms | 24 | 9.9 | 58.1 | −1.1 | 7.8 to 13.5 | 66.6 | 275.8 | −10.9 | 53.2 to 143.2 |
| Potatoes and starches | 18 | 7.5 | 22.8 | −6.3 | 4.8 to 10.4 | 14.9 | 49.4 | −12.6 | 10.9 to 20.7 |
| Eggs | 13 | 7.2 | 32.4 | −1.3 | 2.2 to 12.4 | 25.9 | 101.3 | −13.2 | 7.2 to 55.0 |
| Algae | 9 | 6.2 | 29.2 | −2.7 | 4.2 to 15.0 | 144.2 | 238.9 | −73.9 | 77.2 to 170.5 |
| Meat | 210 | 4.2 | 37.0 | −53.7 | −4.2 to 12.1 | 10.1 | 96.1 | −119.3 | −16.1 to 31.2 |
| Cereals | 77 | 1.8 | 38.7 | −59.9 | −0.6 to 12.4 | 5.5 | 133.1 | −66.6 | −0.9 to 17.2 |
| Beverages | 10 | −6.8 | 31.9 | −11.9 | −11.6 to −1.5 | −3.4 | 251.7 | −6.6 | −6.4 to −0.7 |
| Seasonings and spices | 16 | −7.9 | 3.3 | −27.4 | −11.4 to 0.3 | −72.6 | 219.1 | −219.0 | −108.1 to 3.1 |
| Confectionery | 82 | −10.4 | 13.1 | −34.3 | −19.4 to −4.1 | −35.5 | 43.5 | −152.2 | −60.4 to −18.9 |
| Fats and oils | 4 | −13.8 | 0.0 | −23.4 | −21.6 to −5.0 | −135.6 | −50.2 | −203.6 | −187.6 to −79.3 |
| Sugars and sweeteners | 0 | NA | NA | NA | NA | NA | NA | NA | NA |
| Total | 1099 | 10.2 | 114.9 | −59.9 | 0.7 to 25.9 | 36.4 | 278.2 | −219.0 | 1.7 to 71.5 |
| Items | n | r | p-Values |
|---|---|---|---|
| Cereals | 77 | 0.83 | <0.001 |
| Potatoes and starches | 18 | 0.80 | <0.001 |
| Sugars and sweeteners | 0 | NA | NA |
| Pulses | 42 | 0.34 | 0.030 |
| Nuts and seeds | 22 | −0.20 | 0.380 |
| Vegetables | 123 | 0.00 | 0.960 |
| Fruits | 62 | 0.23 | 0.067 |
| Mushrooms | 24 | 0.38 | 0.066 |
| Algae | 9 | 0.53 | 0.148 |
| Fish and seafood | 350 | −0.07 | 0.185 |
| Meat | 210 | 0.89 | <0.001 |
| Eggs | 13 | 0.65 | 0.018 |
| Milk and milk products | 37 | 0.65 | <0.001 |
| Fats and oils | 4 | 0.80 | 0.333 |
| Confectionery | 82 | 0.39 | <0.001 |
| Beverages | 10 | 0.89 | 0.001 |
| Seasonings and spices | 16 | 0.87 | <0.001 |
| Total | 1099 | 0.51 | <0.001 |
Disclaimer/Publisher’s Note: The statements, opinions and data contained in all publications are solely those of the individual author(s) and contributor(s) and not of MDPI and/or the editor(s). MDPI and/or the editor(s) disclaim responsibility for any injury to people or property resulting from any ideas, methods, instructions or products referred to in the content. |
© 2024 by the authors. Licensee MDPI, Basel, Switzerland. This article is an open access article distributed under the terms and conditions of the Creative Commons Attribution (CC BY) license (https://creativecommons.org/licenses/by/4.0/).
Share and Cite
Wakayama, R.; Drewnowski, A.; Horimoto, T.; Yu, T.; Saito, Y.; Suzuki, T.; Honda, K.; Kanaya, S.; Takasugi, S. Development and Validation of the Meiji Nutritional Profiling System per Serving Size. Nutrients 2024, 16, 2700. https://doi.org/10.3390/nu16162700
Wakayama R, Drewnowski A, Horimoto T, Yu T, Saito Y, Suzuki T, Honda K, Kanaya S, Takasugi S. Development and Validation of the Meiji Nutritional Profiling System per Serving Size. Nutrients. 2024; 16(16):2700. https://doi.org/10.3390/nu16162700
Chicago/Turabian StyleWakayama, Ryota, Adam Drewnowski, Tomohito Horimoto, Tao Yu, Yoshie Saito, Takao Suzuki, Keiko Honda, Shigehiko Kanaya, and Satoshi Takasugi. 2024. "Development and Validation of the Meiji Nutritional Profiling System per Serving Size" Nutrients 16, no. 16: 2700. https://doi.org/10.3390/nu16162700
APA StyleWakayama, R., Drewnowski, A., Horimoto, T., Yu, T., Saito, Y., Suzuki, T., Honda, K., Kanaya, S., & Takasugi, S. (2024). Development and Validation of the Meiji Nutritional Profiling System per Serving Size. Nutrients, 16(16), 2700. https://doi.org/10.3390/nu16162700