
Are Supplemental Nutrition Assistance Program Restrictions on Sugar-Sweetened Beverages Effective in Reducing Purchase or Consumption? A Systematic Review


Abstract
1. Introduction
2. Materials and Methods
2.1. Overview
2.2. Study Selection Criteria
2.2.1. Study Design
2.2.2. Study Subjects
2.2.3. Outcomes
2.2.4. Intervention
2.2.5. Article Type
2.2.6. Time Period of Search
2.3. Search Strategies
2.4. Data Extraction and Synthesis
2.5. Study Quality Assessment
3. Results
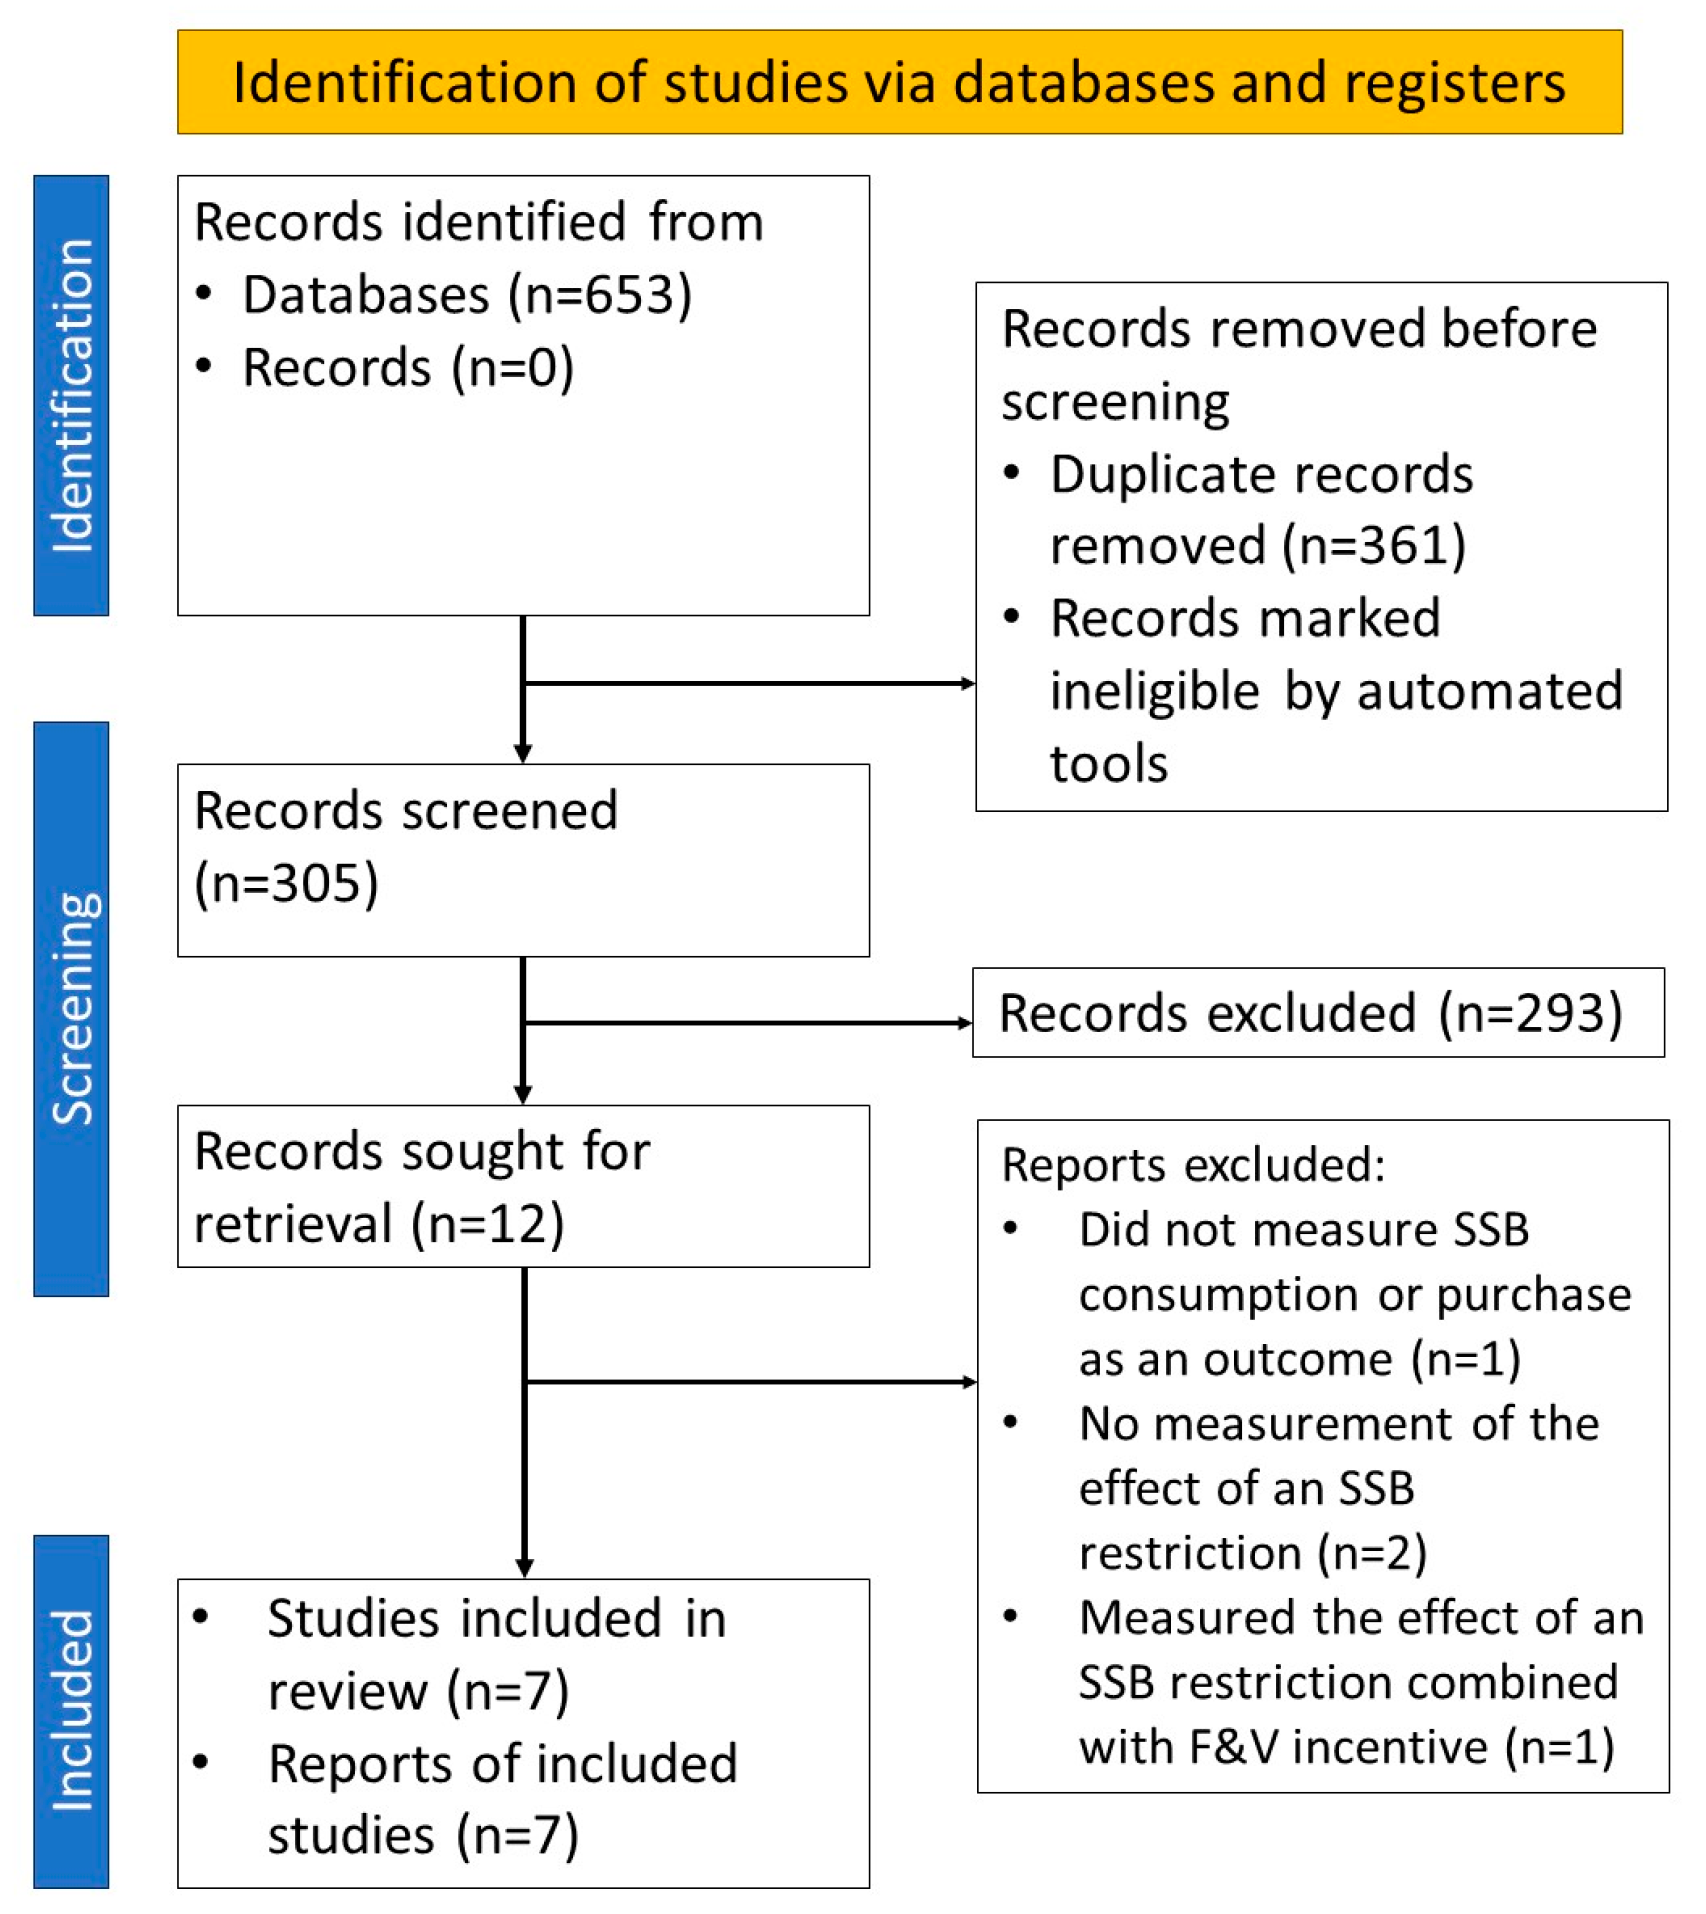
3.1. Study Selection
3.2. Study Characteristics
3.2.1. Study Design
- Modelling approaches
- 2.
- Length of intervention
3.2.2. Subject Characteristics
- Sample sizes
- 2.
- Subject ages
- 3.
- Gender demographic
- 4.
- Racial Demographic
3.3. Eligibility Criteria of Participants
3.4. Measures of SSB Consumption or Purchases
Definitions of SSB
3.5. Types of Restrictions
3.6. Estimated Effect of Restrictions on SSB Consumption
3.7. Study Quality Assessment
4. Discussion
4.1. Principal Findings
4.2. Implications on Health and Non-Health Outcomes amongst SNAP Participants
4.3. Limitations
4.3.1. Limited Studies
4.3.2. Limited Geographical Scope amongst RCTs
4.3.3. Work-Around from SSB Restrictions
4.3.4. Differed Estimated Effects When Combined with Combined with Incentives or Educational Initiatives
5. Conclusions
Supplementary Materials
Author Contributions
Funding
Data Availability Statement
Acknowledgments
Conflicts of Interest
References
- United States Department of Agriculture. Supplemental Nutrition Assistance Program Fact Sheet; Technical Report; Food and Nutrition Service, United States Department of Agriculture: Washington, DC, USA, 2017.
- Bleich, S.N.; Moran, A.J.; Vercammen, K.A.; Frelier, J.M.; Dunn, C.G.; Zhong, A.; Fleischhacker, S.E. Strengthening the public health impacts of the supplemental nutrition assistance program through policy. Annu. Rev. Public Health 2020, 41, 453–480. [Google Scholar] [CrossRef] [PubMed]
- DeSilver, D. What the data says about food stamps in the U.S.; Pew Research Center: Washington, DC, USA, 2023. [Google Scholar]
- Basu, S.; Seligman, H.K.; Gardner, C.; Bhattacharya, J. Ending SNAP subsidies for sugar-sweetened beverages could reduce obesity and type 2 diabetes. Health Aff. 2014, 33, 1032–1039. [Google Scholar] [CrossRef] [PubMed]
- Pearson-Stuttard, J.; Bandosz, P.; Rehm, C.D.; Penalvo, J.; Whitsel, L.; Gaziano, T.; Conrad, Z.; Wilde, P.; Micha, R.; Lloyd-Williams, F.; et al. Reducing US cardiovascular disease burden and disparities through national and targeted dietary policies: A modelling study. PLoS Med. 2017, 14, e1002311. [Google Scholar] [CrossRef] [PubMed]
- An, R.; Huang, C.; Baghbabian, A. Health policy analysis. In Community-Oriented Health Services: Practices across Disciplines; Springer Publishing Company: New York, NY, USA, 2015; pp. 17–40. [Google Scholar]
- U.S. Department of Health and Human Services. Making the Connection: Dietary Behavior and Academic Grades; Technical Report; Centers for Disease Control and Prevention and others: Atlanta, GA, USA, 2015. [Google Scholar]
- Singleton, C.R.; Young, S.K.; Kessee, N.; Springfield, S.E.; Sen, B.P. Examining disparities in diet quality between SNAP participants and non-participants using Oaxaca-Blinder decomposition analysis. Prev. Med. Rep. 2020, 19, 101134. [Google Scholar] [CrossRef] [PubMed]
- Bremer, M.C.; Zoellner, J.M.; Misyak, S.A.; Hedrick, V.E. Dietary intake changes in response to a sugar-sweetened beverage reduction trial for various Supplemental Nutrition Assistance Program (SNAP) eligibility groups. J. Nutr. Educ. Behav. 2018, 50, 931–936. [Google Scholar] [CrossRef] [PubMed]
- Garasky, S.; Mbwana, K.; Romualdo, A.; Tenaglio, A.; Roy, M. Foods Typically Purchased by Supplemental Nutrition Assistance Program (SNAP) Households; Technical Report; Office of Policy Support, Food and Nutrition Service, United States Department of Agriculture: Washington, DC, USA, 2016. [Google Scholar]
- Tordella, S.; Mabli, J. Dynamics of Supplemental Nutrition Assistance Program Participation from 2008 to 2012; Technical Report; Mathematica Policy Research: Princeton, NJ, USA, 2015. [Google Scholar]
- Abdalla, S.M.; Yu, S.; Galea, S. Trends in cardiovascular disease prevalence by income level in the United States. JAMA Netw. Open 2020, 3, e2018150. [Google Scholar] [CrossRef] [PubMed]
- Acciai, F.; Srinivasan, M.; Ohri-Vachaspati, P. Sugar-sweetened beverage consumption in children: The interplay of household SNAP and WIC participation. Am. J. Prev. Med. 2021, 61, 665–673. [Google Scholar] [CrossRef] [PubMed]
- Brooker, C.; Rubio, M. SNAP Nutrition Security Act of 2023. 118th Congress. 2023. Available online: https://www.congress.gov/bill/118th-congress/senate-bill/2326 (accessed on 22 April 2024).
- Ross, N.; MacKay, D.P. Ending SNAP-subsidized purchases of sugar-sweetened beverages: The need for a pilot project. Public Health Ethics 2017, 10, 62–77. [Google Scholar] [CrossRef]
- Negowetti, N.E. The snap sugar-sweetened beverage debate: Restricting purchases to improve health outcomes of low-income Americans. J. Food Law Policy 2018, 14, 83. [Google Scholar]
- Thapa, K.; Rajbhandari-Thapa, J.; Hanks, A.; Lee, J.S.; Zhen, C. Sugar sweetened beverage restriction or fruit and vegetable purchase incentive in Supplemental Nutrition Assistance Program (SNAP): Participant’s voice and choice behavior. J. Hunger. Environ. Nutr. 2024, 19, 1–22. [Google Scholar] [CrossRef]
- Harnack, L.J.; Oakes, J.M.; Elbel, B.; Rydell, S.A.; Lasswell, T.A.; Mitchell, N.R.; Valluri, S.; French, S.A. Effects of Inclusion of Food Purchase Restrictions and Incentives in a Food Benefit Program on Diet Quality and Food Purchasing: Results from a Randomized Trial. J. Acad. Nutr. Diet. 2023, 124, 569–582. [Google Scholar] [CrossRef] [PubMed]
- Harnack, L.; Oakes, J.M.; Elbel, B.; Beatty, T.; Rydell, S.; French, S. Effects of subsidies and prohibitions on nutrition in a food benefit program: A randomized clinical trial. JAMA Intern. Med. 2016, 176, 1610–1619. [Google Scholar] [CrossRef] [PubMed]
- French, S.A.; Rydell, S.A.; Mitchell, N.R.; Michael Oakes, J.; Elbel, B.; Harnack, L. Financial incentives and purchase restrictions in a food benefit program affect the types of foods and beverages purchased: Results from a randomized trial. Int. J. Behav. Nutr. Phys. Act. 2017, 14, 127. [Google Scholar] [CrossRef] [PubMed]
- Choi, S.E.; Wright, D.R.; Bleich, S.N. Impact of restricting sugar-sweetened beverages from the Supplemental Nutrition Assistance Program on children’s health. Am. J. Prev. Med. 2021, 60, 276–284. [Google Scholar] [CrossRef] [PubMed]
- Choi, S.E.; Wright, D.; Bleich, S. Modeling the Impact of Restricting Sugar-Sweetened Beverages from SNAP Purchases on Children’s Consumption and Risk of Dental Caries and Obesity. Health Serv. Res. 2020, 55, 29–30. [Google Scholar] [CrossRef]
- Mozaffarian, D.; Liu, J.; Sy, S.; Huang, Y.; Rehm, C.; Lee, Y.; Wilde, P.; Abrahams-Gessel, S.; Jardim, T.d.S.V.; Gaziano, T.; et al. Cost-effectiveness of financial incentives and disincentives for improving food purchases and health through the US Supplemental Nutrition Assistance Program (SNAP): A microsimulation study. PLoS Med. 2018, 15, e1002661. [Google Scholar] [CrossRef]
- Leschewski, A.; Kuhns, A. Supplemental Nutrition Assistance Program participation and current restricted food expenditures: Implications for policy. Public Health Nutr. 2020, 23, 3448–3455. [Google Scholar] [CrossRef] [PubMed]
- Todd, J.E.; Ver Ploeg, M. Caloric beverage intake among adult supplemental nutrition assistance program participants. Am. J. Public Health 2014, 104, e80–e85. [Google Scholar] [CrossRef]
- An, R. Beverage consumption in relation to discretionary food intake and diet quality among US adults, 2003 to 2012. J. Acad. Nutr. Diet. 2016, 116, 28–37. [Google Scholar] [CrossRef]
- United States Department of Agriculture. Dietary Guidelines for Americans 2020 to 2025. Technical Report. 2020. Available online: https://www.dietaryguidelines.gov/sites/default/files/2020-12/Dietary_Guidelines_for_Americans_2020-2025.pdf (accessed on 4 May 2024).
- Guyatt, G.H.; Oxman, A.D.; Vist, G.E.; Kunz, R.; Falck-Ytter, Y.; Alonso-Coello, P.; Schünemann, H.J. GRADE: An emerging consensus on rating quality of evidence and strength of recommendations. BMJ 2008, 336, 924–926. [Google Scholar] [CrossRef]
- Guyatt, G.H.; Oxman, A.D.; Kunz, R.; Vist, G.E.; Falck-Ytter, Y.; Schünemann, H.J. What is “quality of evidence” and why is it important to clinicians? BMJ 2008, 336, 995–998. [Google Scholar] [CrossRef] [PubMed]
- Basu, A. A tutorial on how to use Gradepro GDT Tool for writing reviews. PeerJ 2016, 4, e2520v1. [Google Scholar] [CrossRef]
- DeCourcey, D. Maine’s Governor Wants to Take This Benefit Away from Thousands of People. ATTN 2016, 9509, 1–10. Available online: https://archive.attn.com/stories/9509/maine-governor-threatens-to-stop-food-stamp-program (accessed on 20 April 2024).
- Sturm, R.; An, R. Obesity and economic environments. CA Cancer J. Clin. 2014, 64, 337–350. [Google Scholar] [CrossRef] [PubMed]
- Chevinsky, J.R.; Lee, S.H.; Blanck, H.M.; Park, S. Peer Reviewed: Prevalence of self-reported intake of sugar-sweetened beverages among us adults in 50 states and the district of Columbia, 2010 and 2015. Prev. Chronic Dis. 2021, 18, 200434. [Google Scholar] [CrossRef] [PubMed]
- Alba, C.; An, R. Using Mobile Phone Data to Assess Socio-Economic Disparities in Unhealthy Food Reliance during the COVID-19 Pandemic. Health Data Sci. 2023, 3, 0101. [Google Scholar] [CrossRef]
- Ryan-Ibarra, S.; DeLisio, A.; Bang, H.; Adedokun, O.; Bhargava, V.; Franck, K.; Funderburk, K.; Lee, J.S.; Parmer, S.; Sneed, C. The US Supplemental Nutrition Assistance Program–education improves nutrition-related behaviors. J. Nutr. Sci. 2020, 9, e44. [Google Scholar] [CrossRef]
- Thayer, J.; Murphy, C.; Cook, J.; Ettinger de Cuba, S.; DaCosta, R.; Chilton, M. Coming Up Short: High Food Costs Outstrip Food Stamp Benefits; Children’s HealthWatch: Boston, MA, USA, 2008. [Google Scholar]

| Study ID | Authors (Year) | Study Design | Data Source | Study Period | Baseline Duration | Intervention Duration | Statistical Modeling Approach | Grade |
|---|---|---|---|---|---|---|---|---|
| 1 | Harnack et al. (2023) [18] | Randomized Control Trial (RCT) | Grocery Assistance Program Study (GAPS) for Families experiment participants | May of 2018 through May of 2019 | 2 weeks | 20 weeks | Linear Regression | High |
| 2 | Harnack et al. (2016) [19] | Randomized Control Trial (RCT) | Grocery Assistance Program Study (GAPS) participants registered under clinicaltrials.gov identifier NCT02643576 | August 2013 and May 2015 | 4 weeks | 12 weeks | Group differences | High |
| 3 | French et al. (2017) [20] | Randomized Control Trial (RCT) | Grocery Assistance Program Study (GAPS) participants registered under clinicaltrials.gov identifier NCT02643576 | August 2013 and May 2015 | 4 weeks | 12 weeks | Group differences | High |
| 4 | Thapa et al. (2024) [17] | Randomized Control Trial (RCT) | Participants recruited with the assistance of Extension County Family and Consumer Sciences agents | August to December 2018 | 0 days (choice experiment) | 0 days (choice experiment) | Within-subjects ANCOVA towards a randomized control choice experiment | High |
| 5 | Basu et al. (2014) [4] | Simulation/Modeling study | National Health and Nutrition Examination Survey (1999 to 2010) | - | - | 10 years | Micro-simulation | Moderate |
| 6 | Choi, Wright, and Bleich (2021) [21] | Simulation/Modeling study | National Health and Nutrition Examination Survey (2009 to 2016) | - | - | 10 years | Micro-simulation | Moderate |
| 7 | Choi, Wright, and Bleich (2020) [22] | Simulation/Modeling study | National Health and Nutrition Examination Survey (2009 to 2014) | - | - | 10 years | Micro-simulation | Moderate |
| Study ID | Authors (Year) | Region | Sample Size | Age Statistic | Racial Demographic | Female |
|---|---|---|---|---|---|---|
| 1 | Harnack et al. (2023) [18] | Minneapolis/St Paul (Minnesota) metropolitan area | n = 233 adults and n = 224 children, totaling to n = 218 families | Mean: 35 (sd: 7.5) for adults; Mean: 7.3 (sd: 2.6) for children | 45% White, 36% African American, 11% Hispanic/Latino, 3% Asian-American, 1% Native American, 8% multi-racial for adults | 216 (93%) for adults, 118 (53%) for children |
| 2 | Harnack et al. (2016) [19] | Minneapolis/St Paul (Minnesota) metropolitan area | n = 265 | Mean: 44.5 | 29.2% White, 52.7% African American, 10% Hispanic/Latino, 13.3% biracial | 214 (81%) |
| 3 | French et al. (2017) [20] | Minneapolis/St Paul (Minnesota) metropolitan area | n = 252 | Mean: 45.0 (sd: 1.6) | 31.1% White, 51.6% African American, 3.6% Hispanic/Latino, 12.3% biracial | 205 (81%) |
| 4 | Thapa et al. (2024) [17] | 8 counties in Georgia | n = 73 | Mean: 54.7 years (SD: 20.7) | 11% White, 82.2% African American | 69 (94.5%) |
| 5 | Basu et al. (2014) [4] | United States | n = 19,388 SNAP participants and n = 120,130 non-SNAP participants | - | - | - |
| 6 | Choi, Wright, and Bleich (2021) [21] | United States | n = 13,004 | Aged 2 to 19 | - | - |
| 7 | Choi, Wright, and Bleich (2020) [22] | United States | n = 9753 | Aged 0–19 | - | - |
| Study ID | Authors (Year) | Type of Restriction | Definition of SSB | Measure of SSB Purchase/Consumption | Eligibility Criteria | Estimated Effect of Restriction on SSB Consumption/Purchase |
|---|---|---|---|---|---|---|
| 1 | Harnack et al. (2023) [18] | Not allowed to buy sugar-sweetened beverages [SSB], sweet baked goods, or candy | Water-based beverages with added sugar such as soft drinks, fruit drinks, and sports drinks | Average Dollars per week (USD/wk.) | Households, consisting of adult–child dyads, eligible for SNAP but not currently enrolled | Least-square means of USD 2.66 (sd = 0.35) on SSB in restriction group vs. USD 4.44 (sd = 0.33) in control group (p < 0.0003) during follow-up |
| 2 | Harnack et al. (2016) [19] | Not allowed to buy sugar-sweetened beverages [SSB], sweet baked goods, or candy | - | Servings per day (servings/d) | (1) Not currently participating in SNAP; (2) household income ≤ 200 percent of the federal poverty level or participating in a government program which automatically qualifies household for SNAP in Minnesota; and (3) adult in household most responsible for food shopping is able to read and speak English and is willing to participate. | Mean change of −0.1 servings/d (sd: 0.2) in restriction group vs. +0.2 (sd: 0.1) in control group during post-intervention period compared to baseline period |
| 3 | French et al. (2017) [20] | Not allowed to buy sugar-sweetened beverages [SSB], sweet baked goods, or candy | water-based beverages with added sugar such as soft drinks, fruit drinks, energy drinks, and sports drinks | Average Dollars per week (USD/wk.) | (1) Not currently participating in SNAP; (2) household income ≤ 200 percent of the federal poverty level or participating in a government program which automatically qualifies household for SNAP in Minnesota; and (3) adult in household most responsible for food shopping is able to read and speak English and is willing to participate. | Mean change of −USD 1.4/wk. (sd: 0.4) in restriction group vs. +USD 1.5/wk. (sd: 0.4) in control group (p < 0.05) during post-intervention period compared to baseline period |
| 4 | Thapa et al. (2024) [17] | Restricting SSB purchases in SNAP | Sweet tea and soda | Purchase amount in Dollars (USD) | Low-income individuals who either participate in or qualify for the SNAP program and had the ability to read and speak English | Participants assigned to the SSB restriction group choose significantly lower amount of SSBs compared to unrestricted groups with SNAP benefits (p < 0.001) and cash (p < 0.001) |
| 5 | Basu et al. (2014) [4] | Restricting SSB purchases in SNAP | - | Kilocalorie intake per person per day (kcal/person/d) | - | A net average SSB reduction of 24.2 kcal/person/d among SNAP participants (95% CI: 22.8, 25.5), which is a 15.4% decline in calorie consumption of SSBs |
| 6 | Choi, Wright, and Bleich (2021) [21] | Restricting SSB purchases in SNAP | - | Grams per person per day (g/person/d) | US children aged 2–19 years as of 2019 | A reduction in SSB intake by 112.5 g/person/d (95% CI = −115.90, −109.17), approximately 4 fluid ounces on average |
| 7 | Choi, Wright, and Bleich (2020) [22] | Restricting SSB purchases in SNAP | - | Grams per person per day (g/person/d) | US children aged less than 19 years | A reduction in SSB intake by 108.3 g/person/d (95% CI: −150.6, −66.0) |
Disclaimer/Publisher’s Note: The statements, opinions and data contained in all publications are solely those of the individual author(s) and contributor(s) and not of MDPI and/or the editor(s). MDPI and/or the editor(s) disclaim responsibility for any injury to people or property resulting from any ideas, methods, instructions or products referred to in the content. |
© 2024 by the authors. Licensee MDPI, Basel, Switzerland. This article is an open access article distributed under the terms and conditions of the Creative Commons Attribution (CC BY) license (https://creativecommons.org/licenses/by/4.0/).
Share and Cite
Alba, C.; Wang, X.; An, R. Are Supplemental Nutrition Assistance Program Restrictions on Sugar-Sweetened Beverages Effective in Reducing Purchase or Consumption? A Systematic Review. Nutrients 2024, 16, 1459. https://doi.org/10.3390/nu16101459
Alba C, Wang X, An R. Are Supplemental Nutrition Assistance Program Restrictions on Sugar-Sweetened Beverages Effective in Reducing Purchase or Consumption? A Systematic Review. Nutrients. 2024; 16(10):1459. https://doi.org/10.3390/nu16101459
Chicago/Turabian StyleAlba, Charles, Xi Wang, and Ruopeng An. 2024. "Are Supplemental Nutrition Assistance Program Restrictions on Sugar-Sweetened Beverages Effective in Reducing Purchase or Consumption? A Systematic Review" Nutrients 16, no. 10: 1459. https://doi.org/10.3390/nu16101459
APA StyleAlba, C., Wang, X., & An, R. (2024). Are Supplemental Nutrition Assistance Program Restrictions on Sugar-Sweetened Beverages Effective in Reducing Purchase or Consumption? A Systematic Review. Nutrients, 16(10), 1459. https://doi.org/10.3390/nu16101459