

Epigallocatechin-3-Gallate Alleviates Liver Oxidative Damage Caused by Iron Overload in Mice through Inhibiting Ferroptosis


 and
and 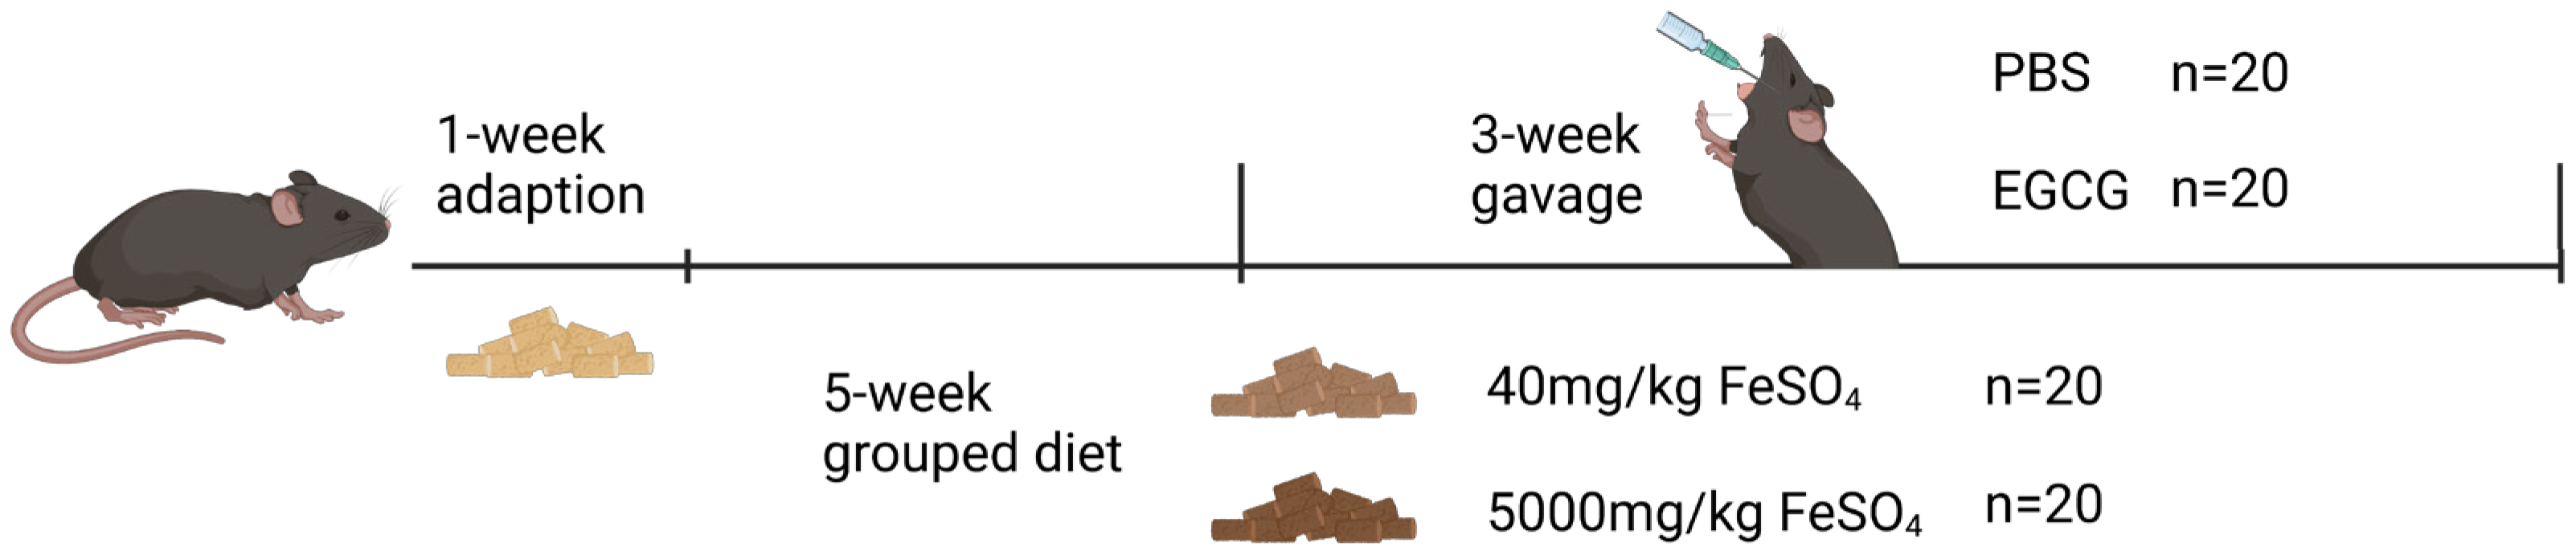
Abstract
1. Introduction
2. Materials and Methods
2.1. Chemicals and Antibodies
2.2. Animal Experiment
2.3. Isolation and Culture of Mouse Primary Hepatocytes
2.4. ROS and Lipid ROS Determination
2.5. Measurement of Fe2+
2.6. Blood Parameters Determination
2.7. Determination of Iron Parameters
2.8. Histological Examination of Liver
2.9. ALT/AST Assay
2.10. Measurement of Malondialdehyde (MDA) and GSH/GSSG Levels
2.11. qPCR and Western Blot
2.12. Statistical Analysis
3. Results
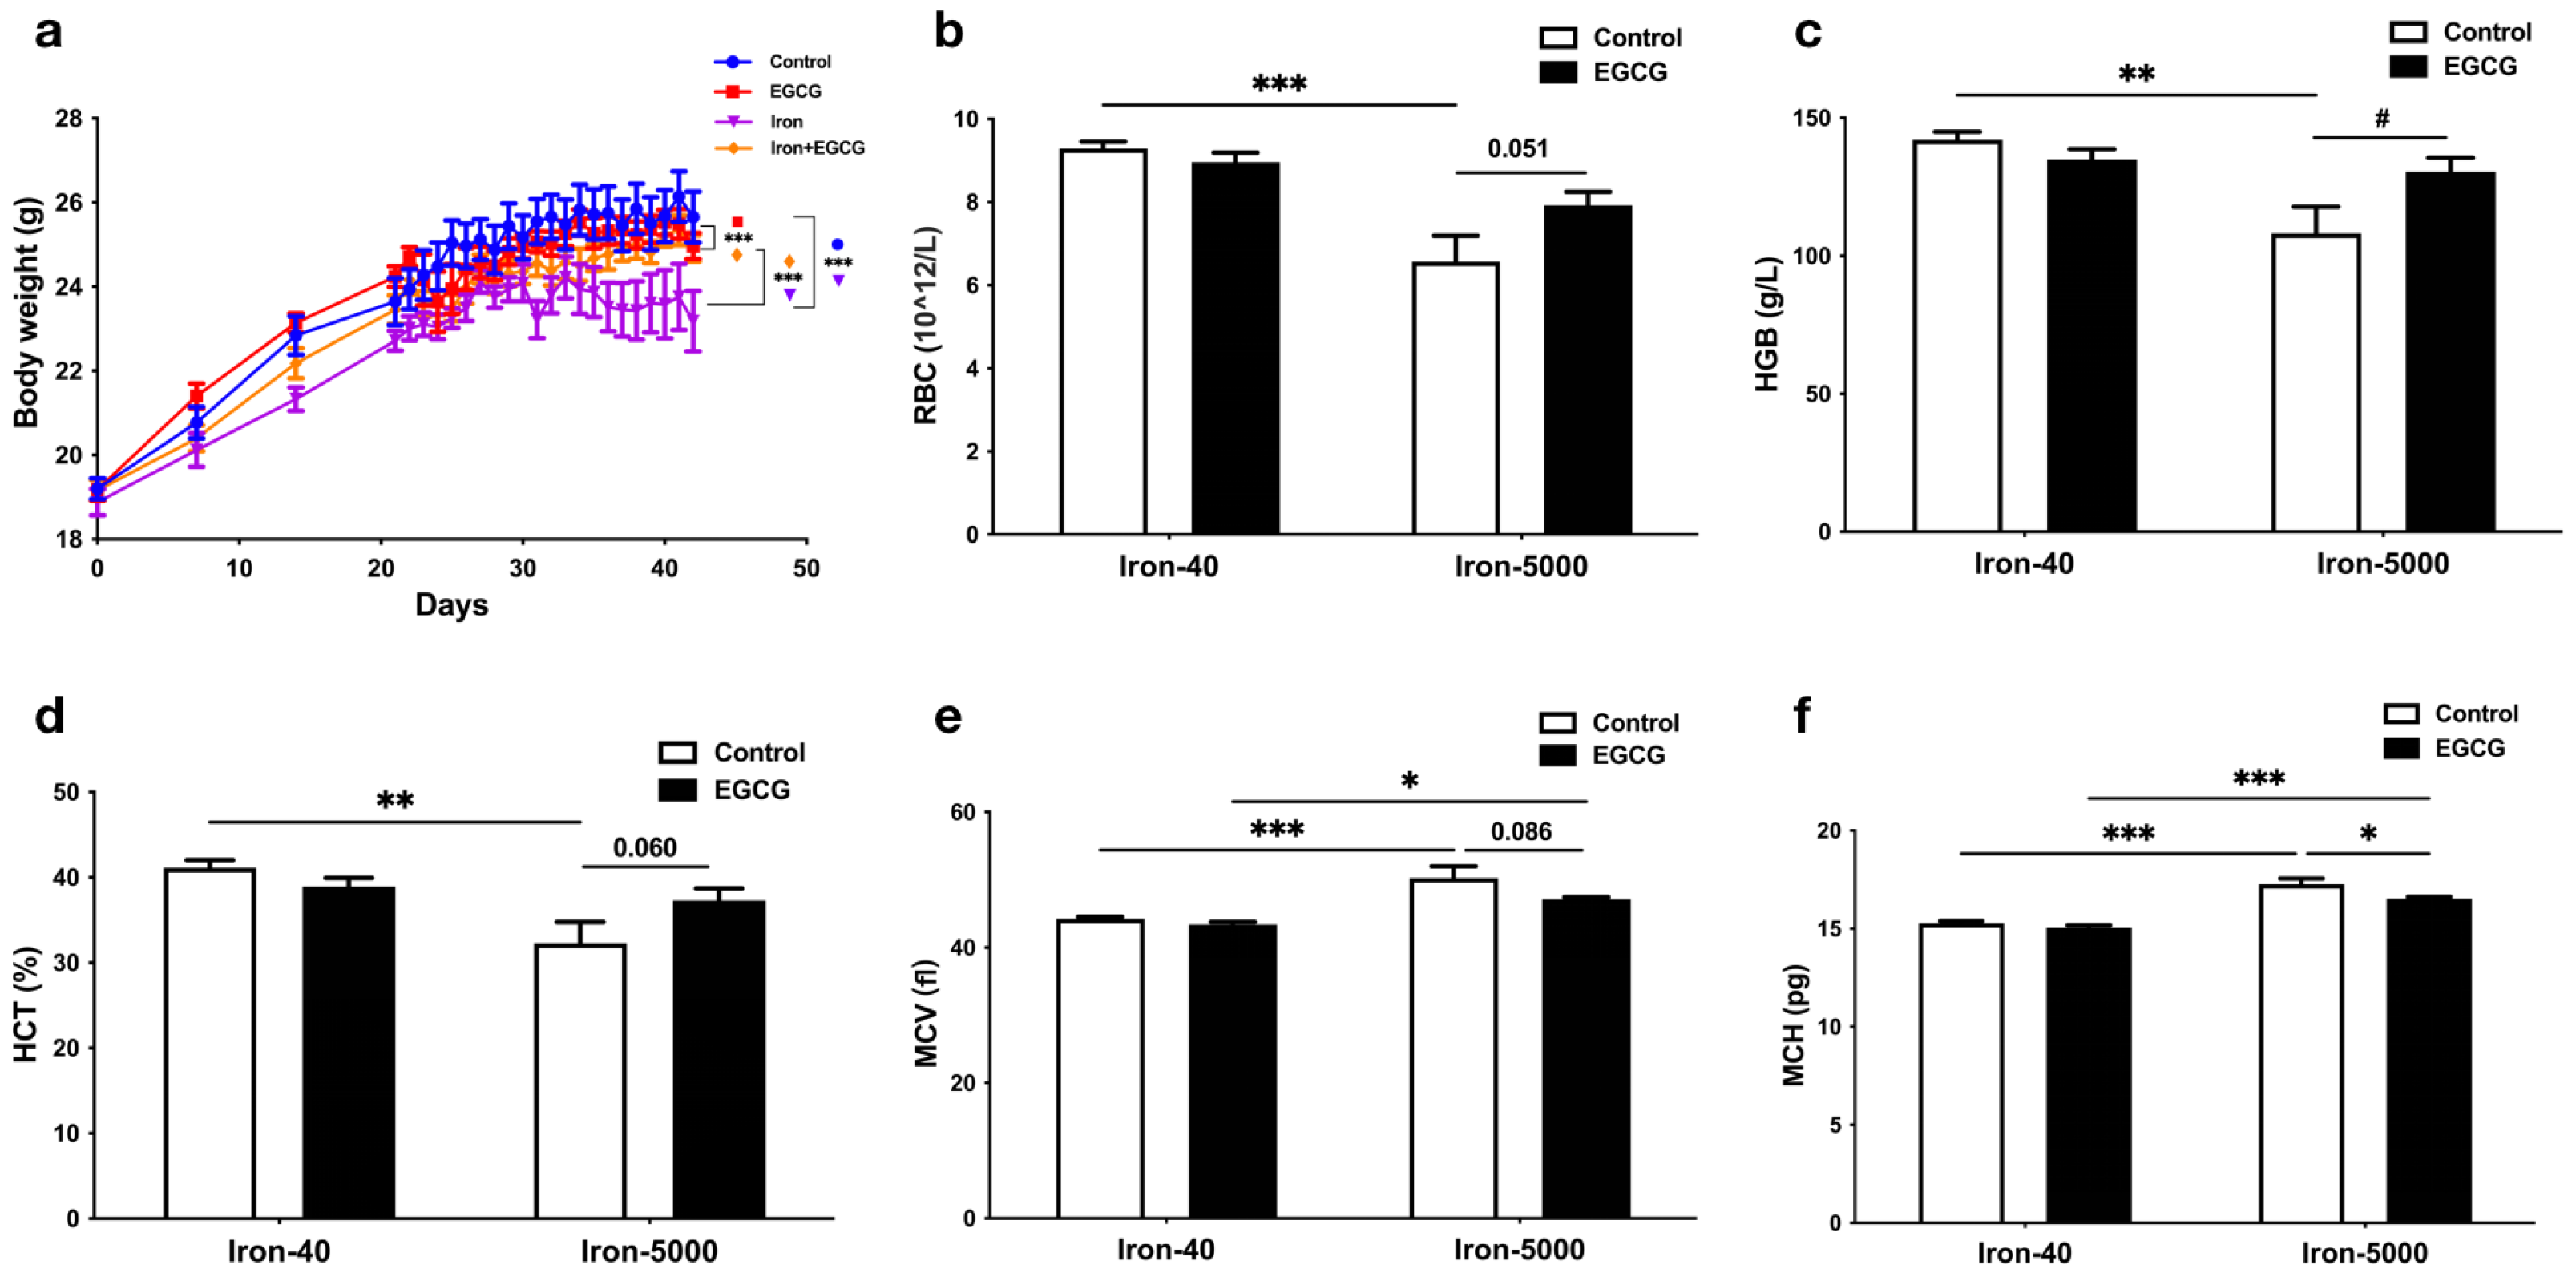
3.1. EGCG Supplementation Restores Impaired Growth in Mice Caused by Iron Overload
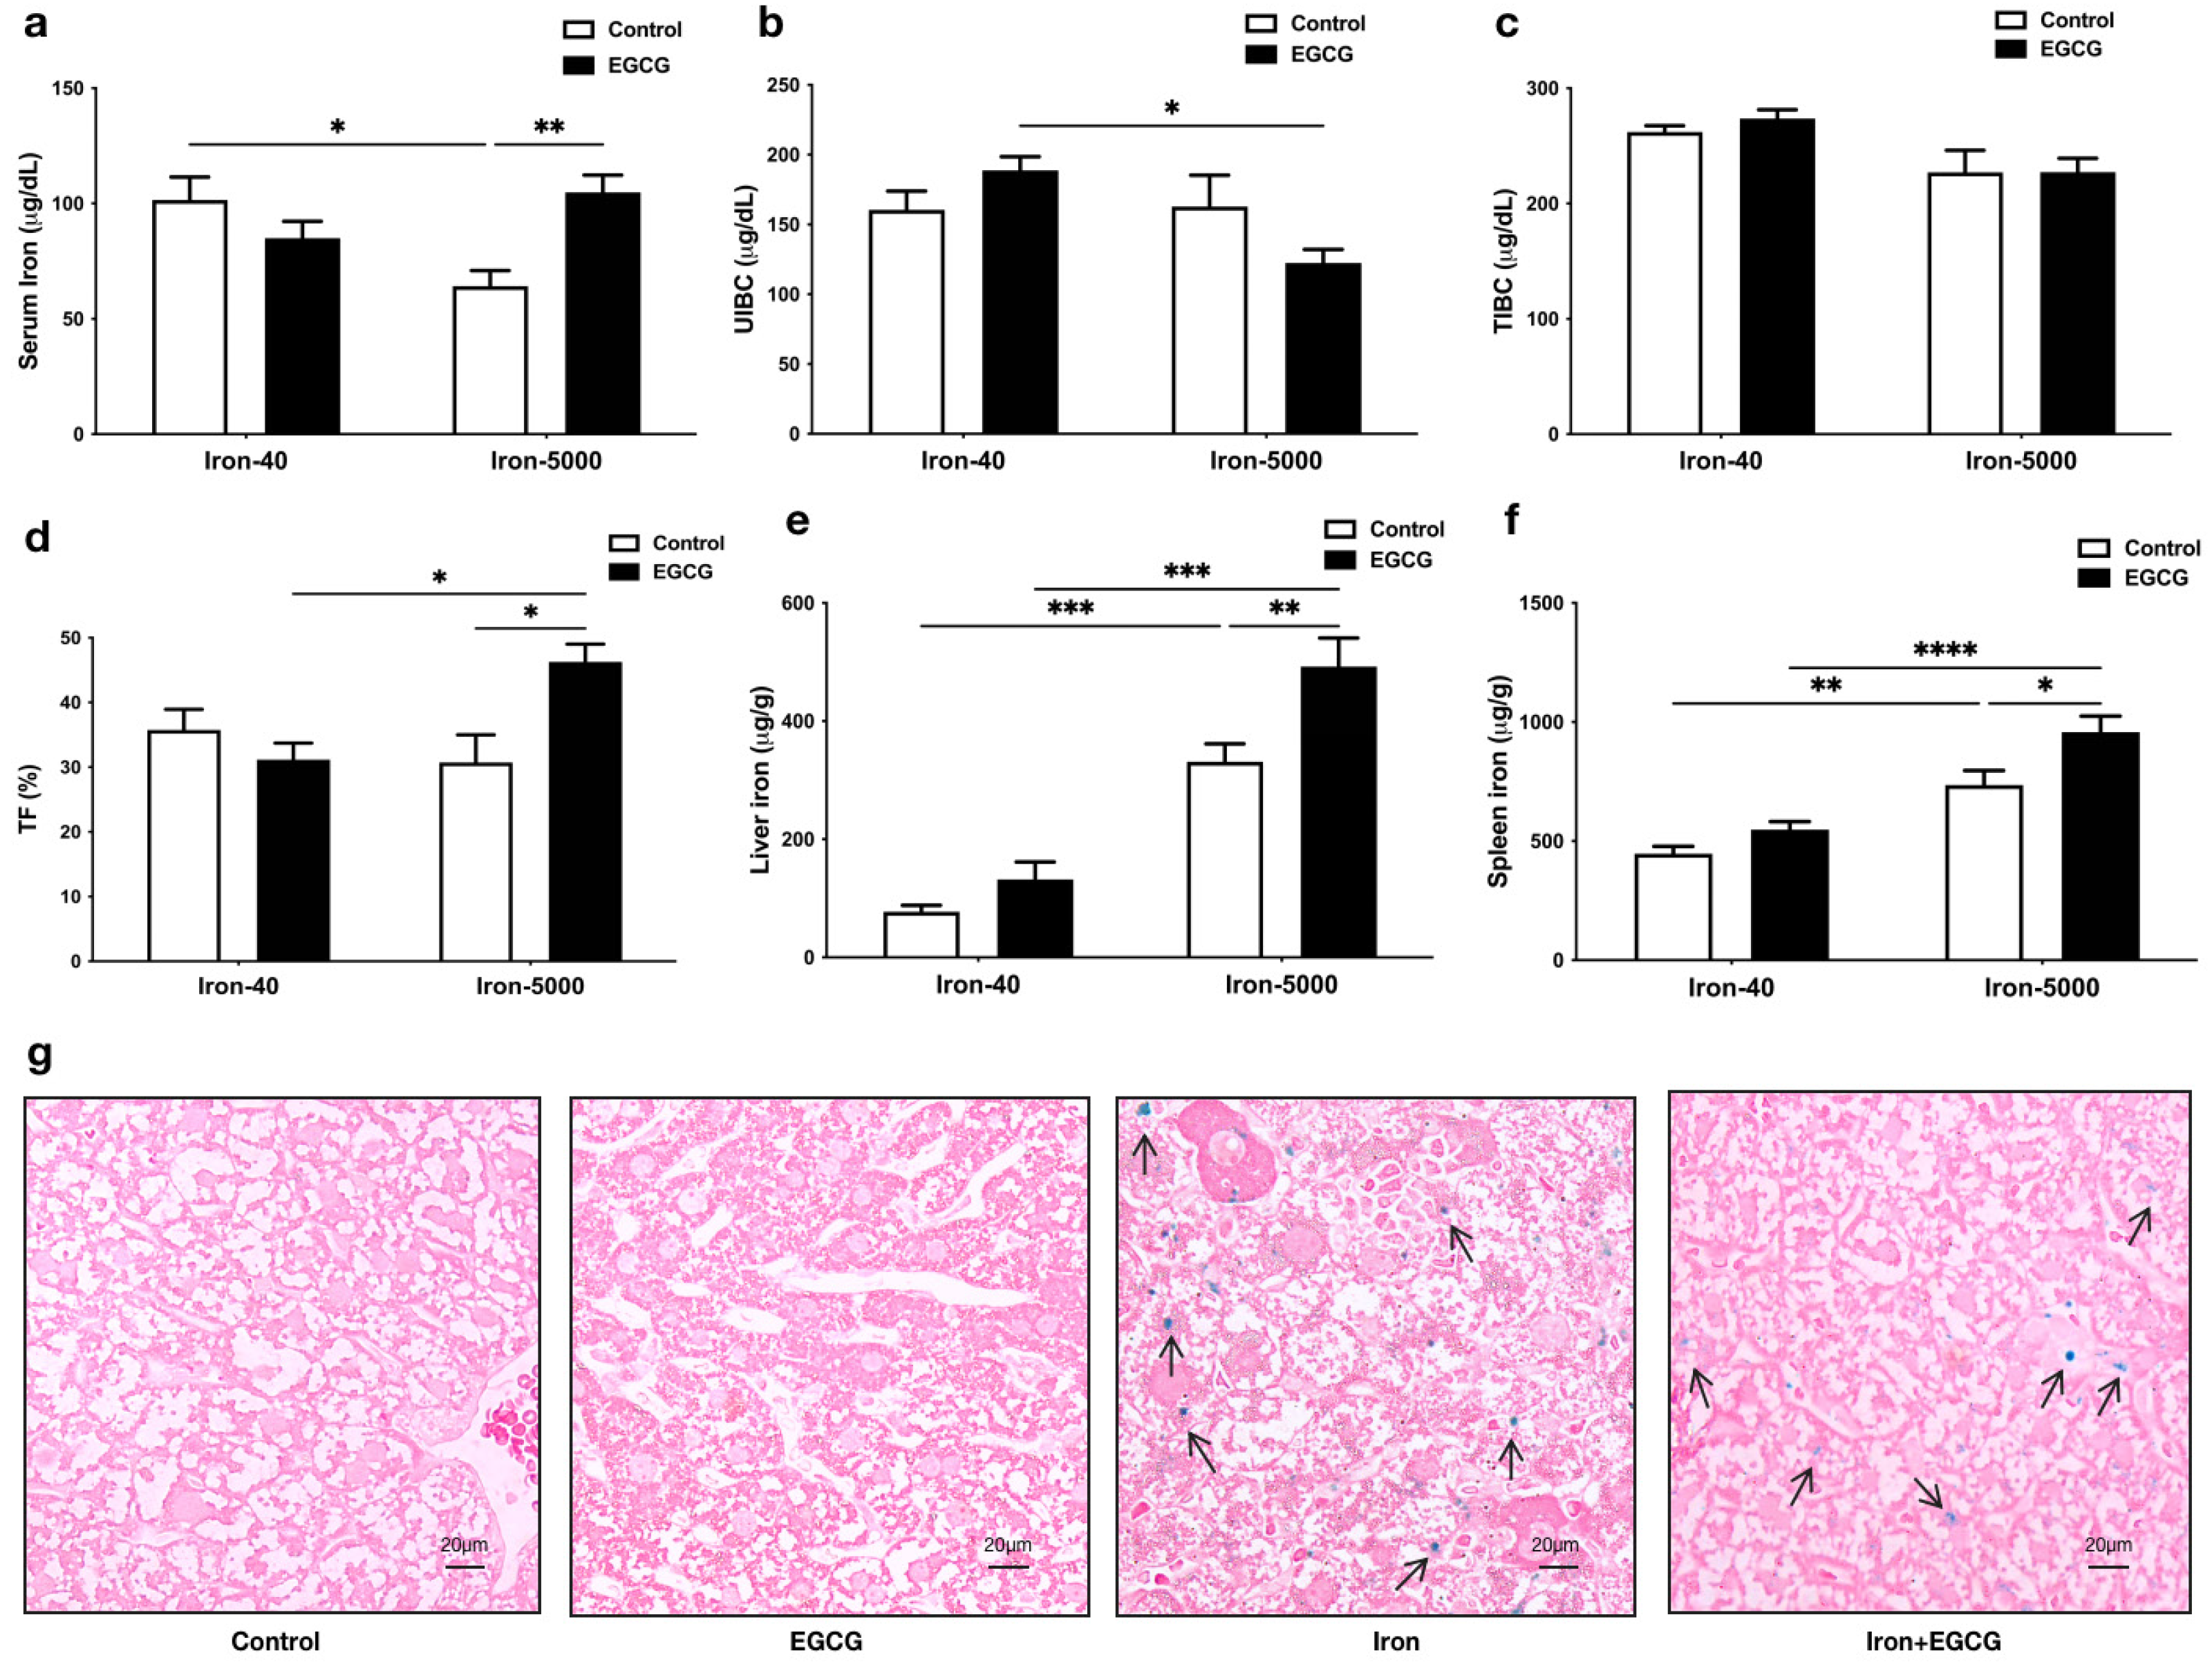
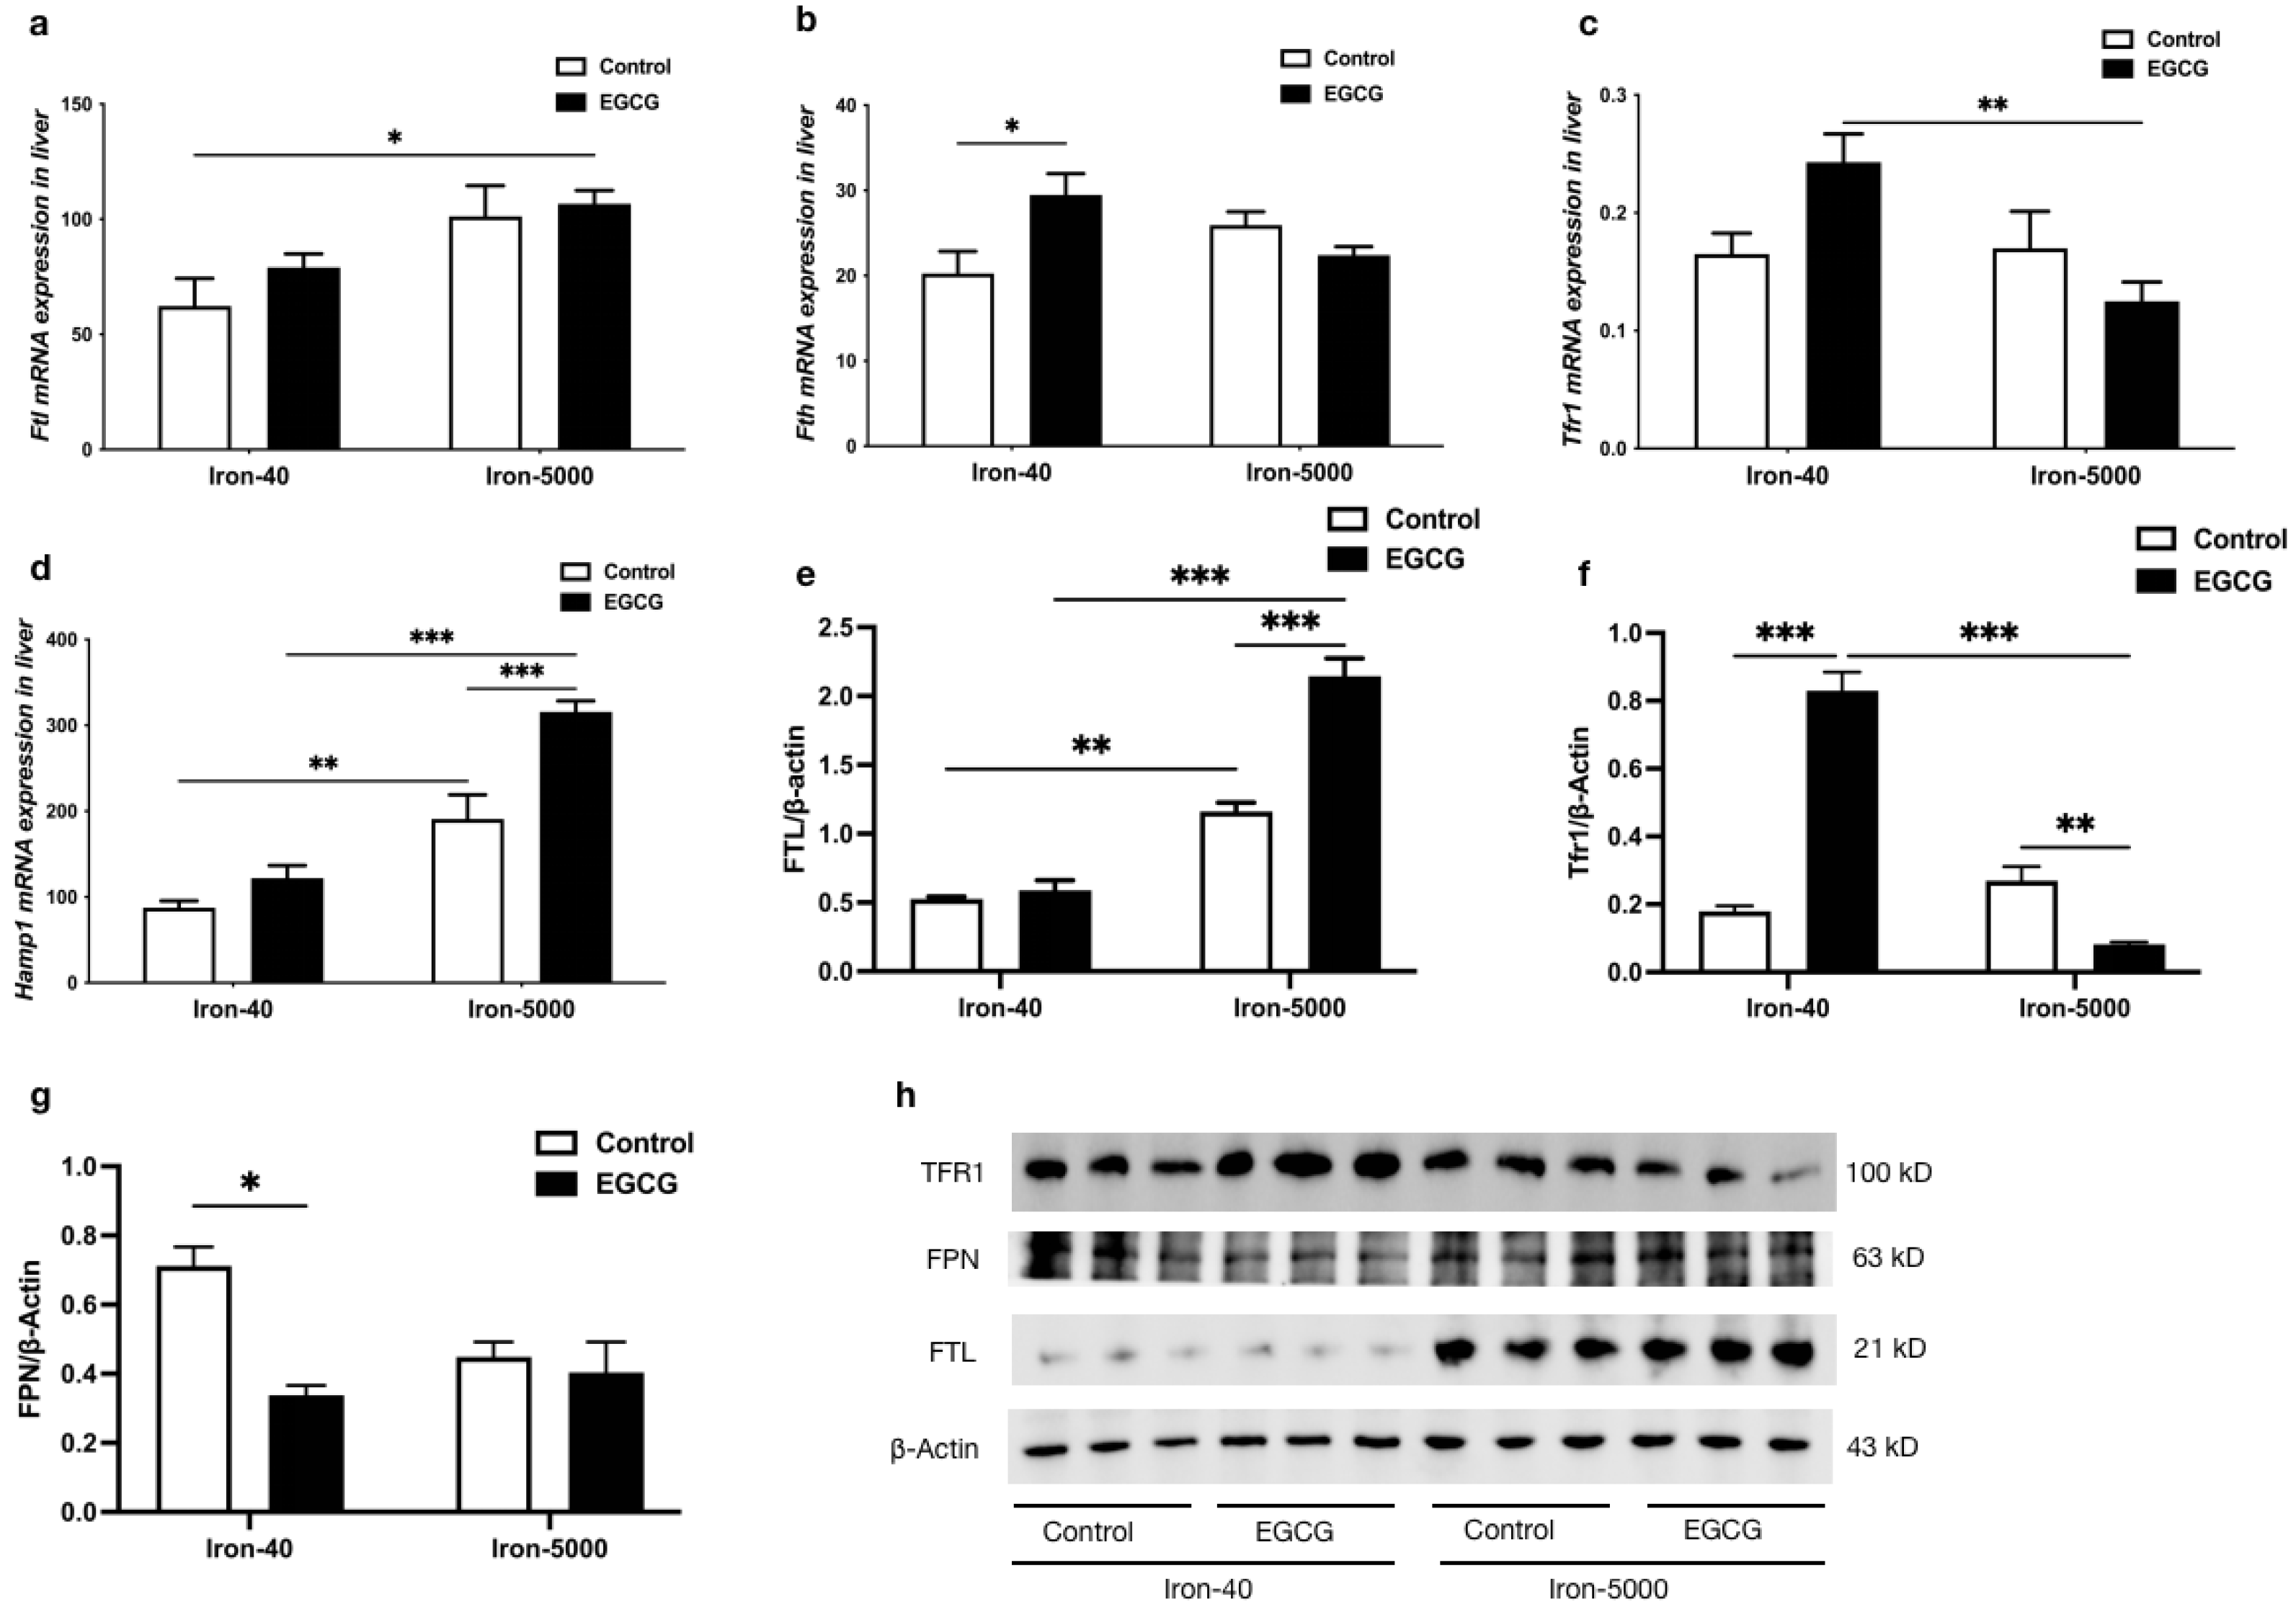
3.2. EGCG Improves Iron Metabolism Disorders Caused by Iron Overload
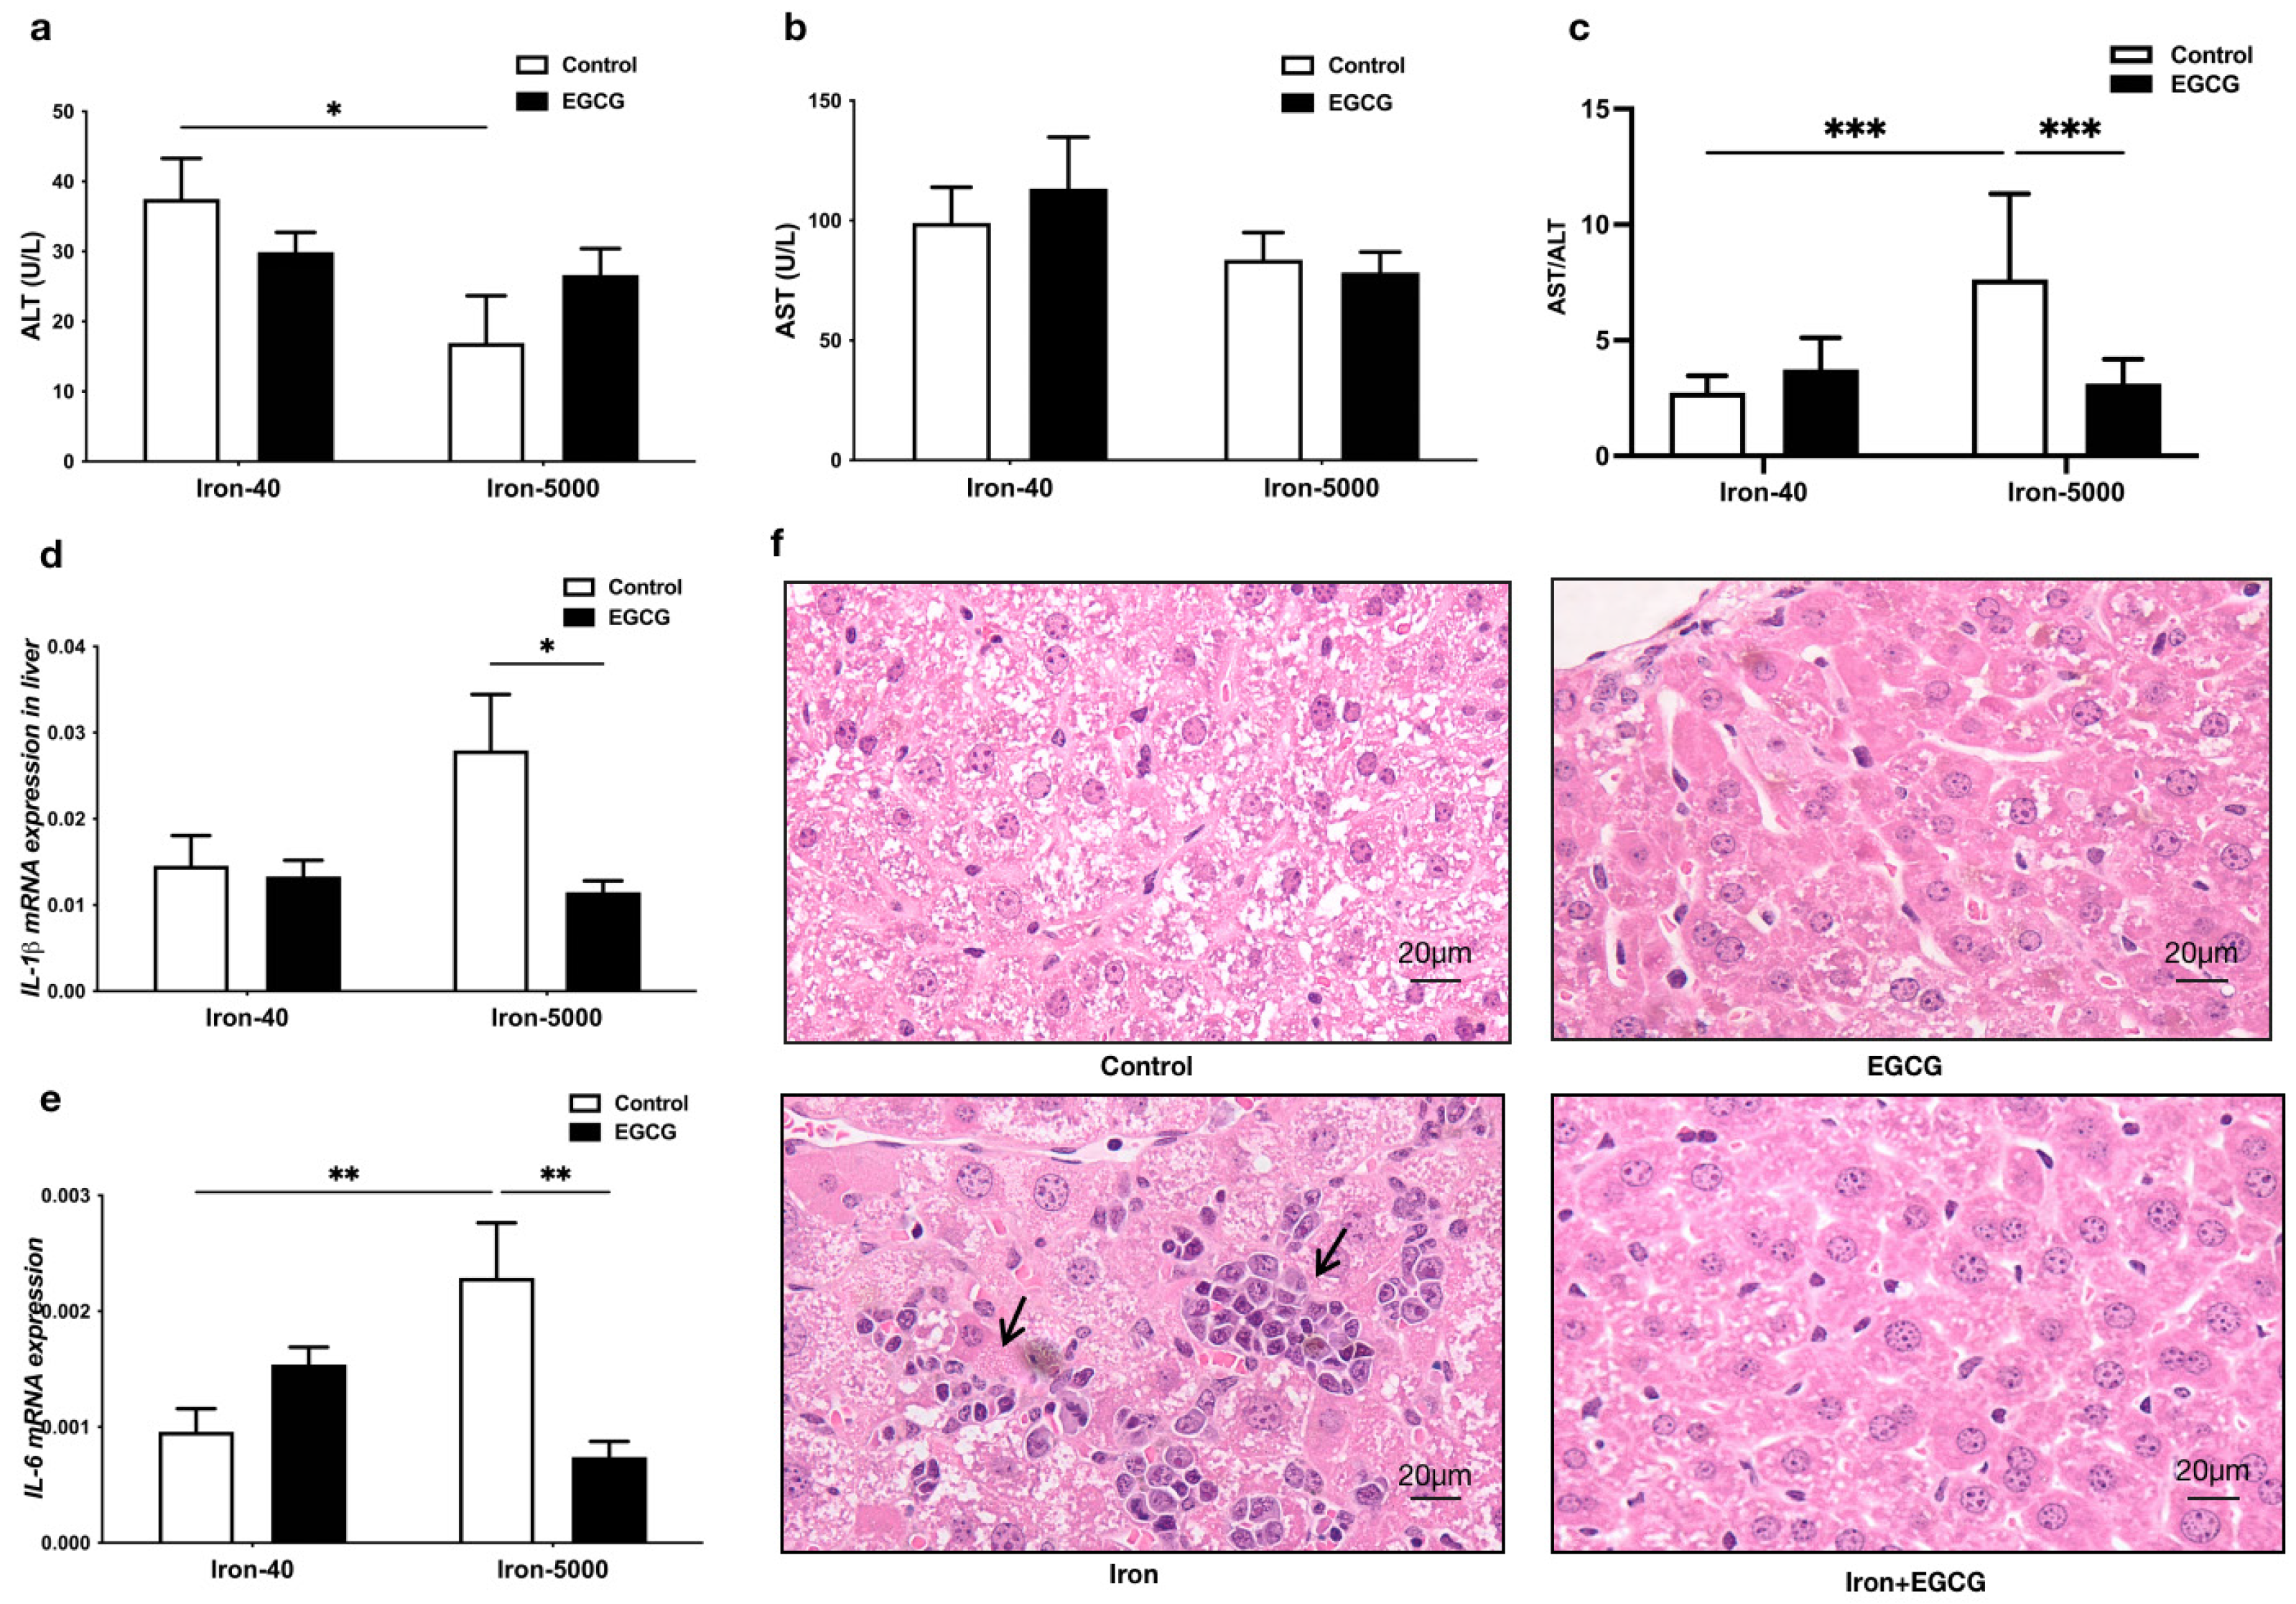
3.3. EGCG Addition Attenuates Liver Injury
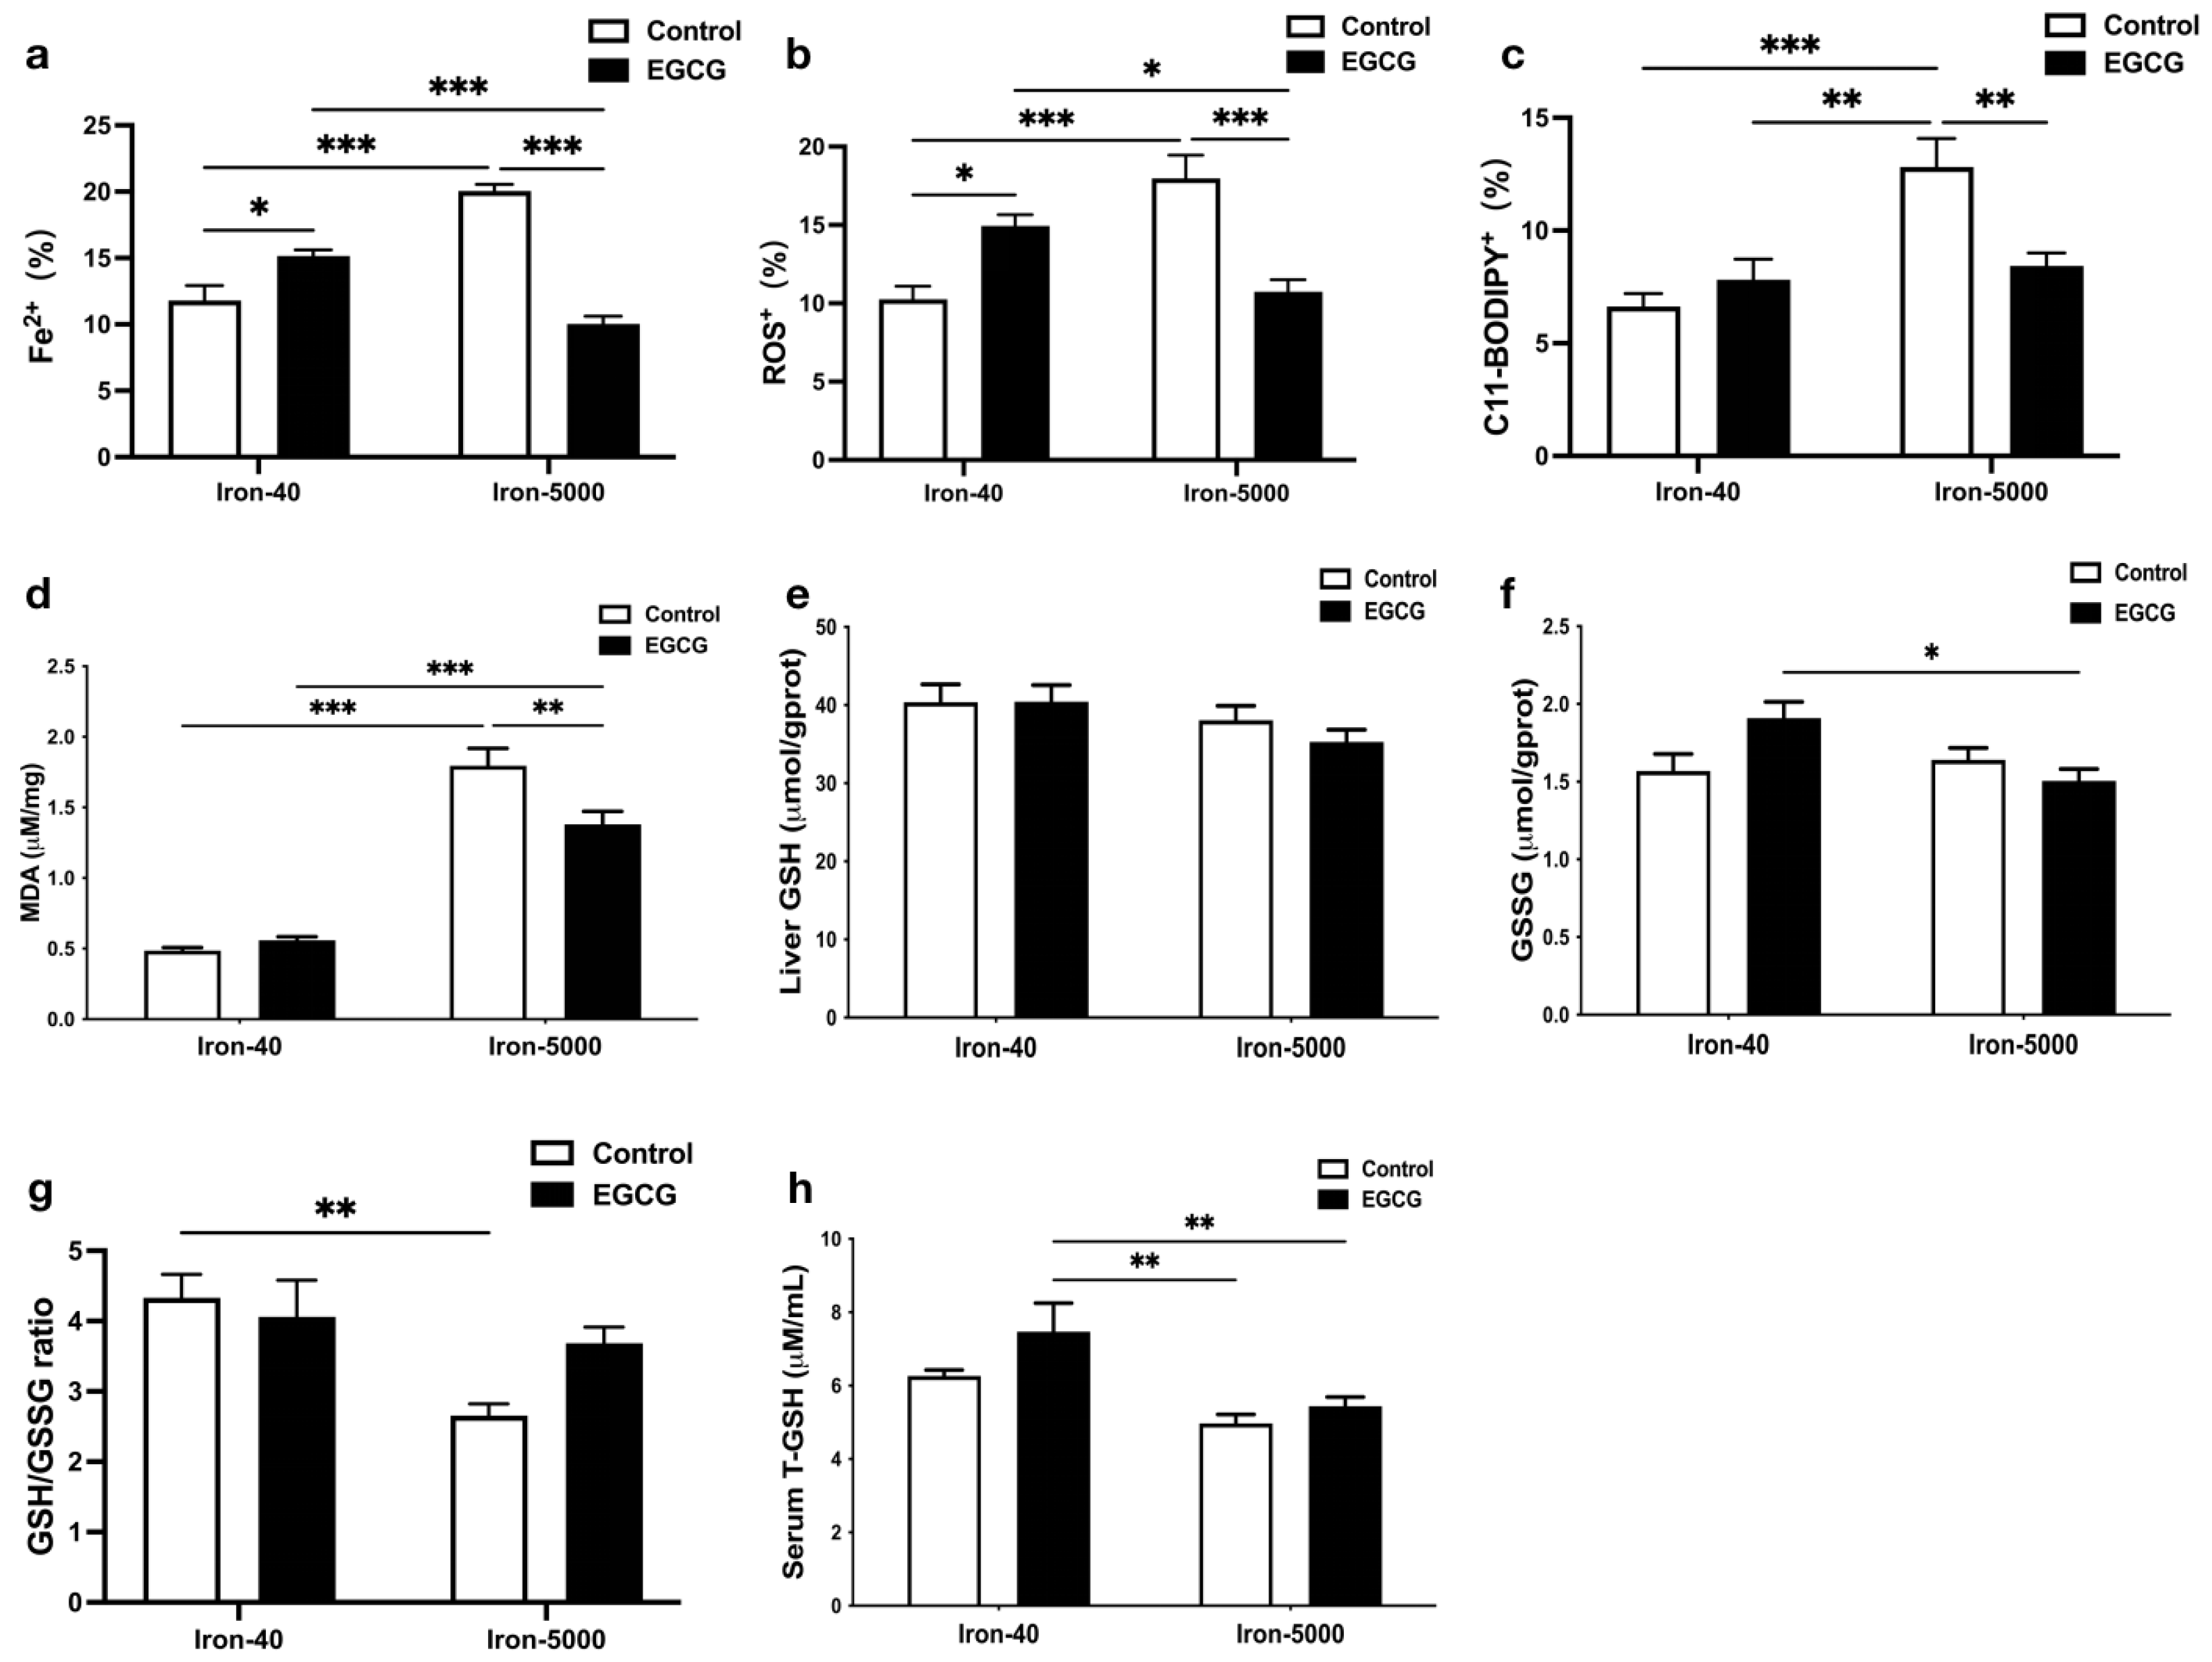
3.4. EGCG Relieves Oxidative Stress and Hepatocytes Ferroptosis Caused by Iron Overload
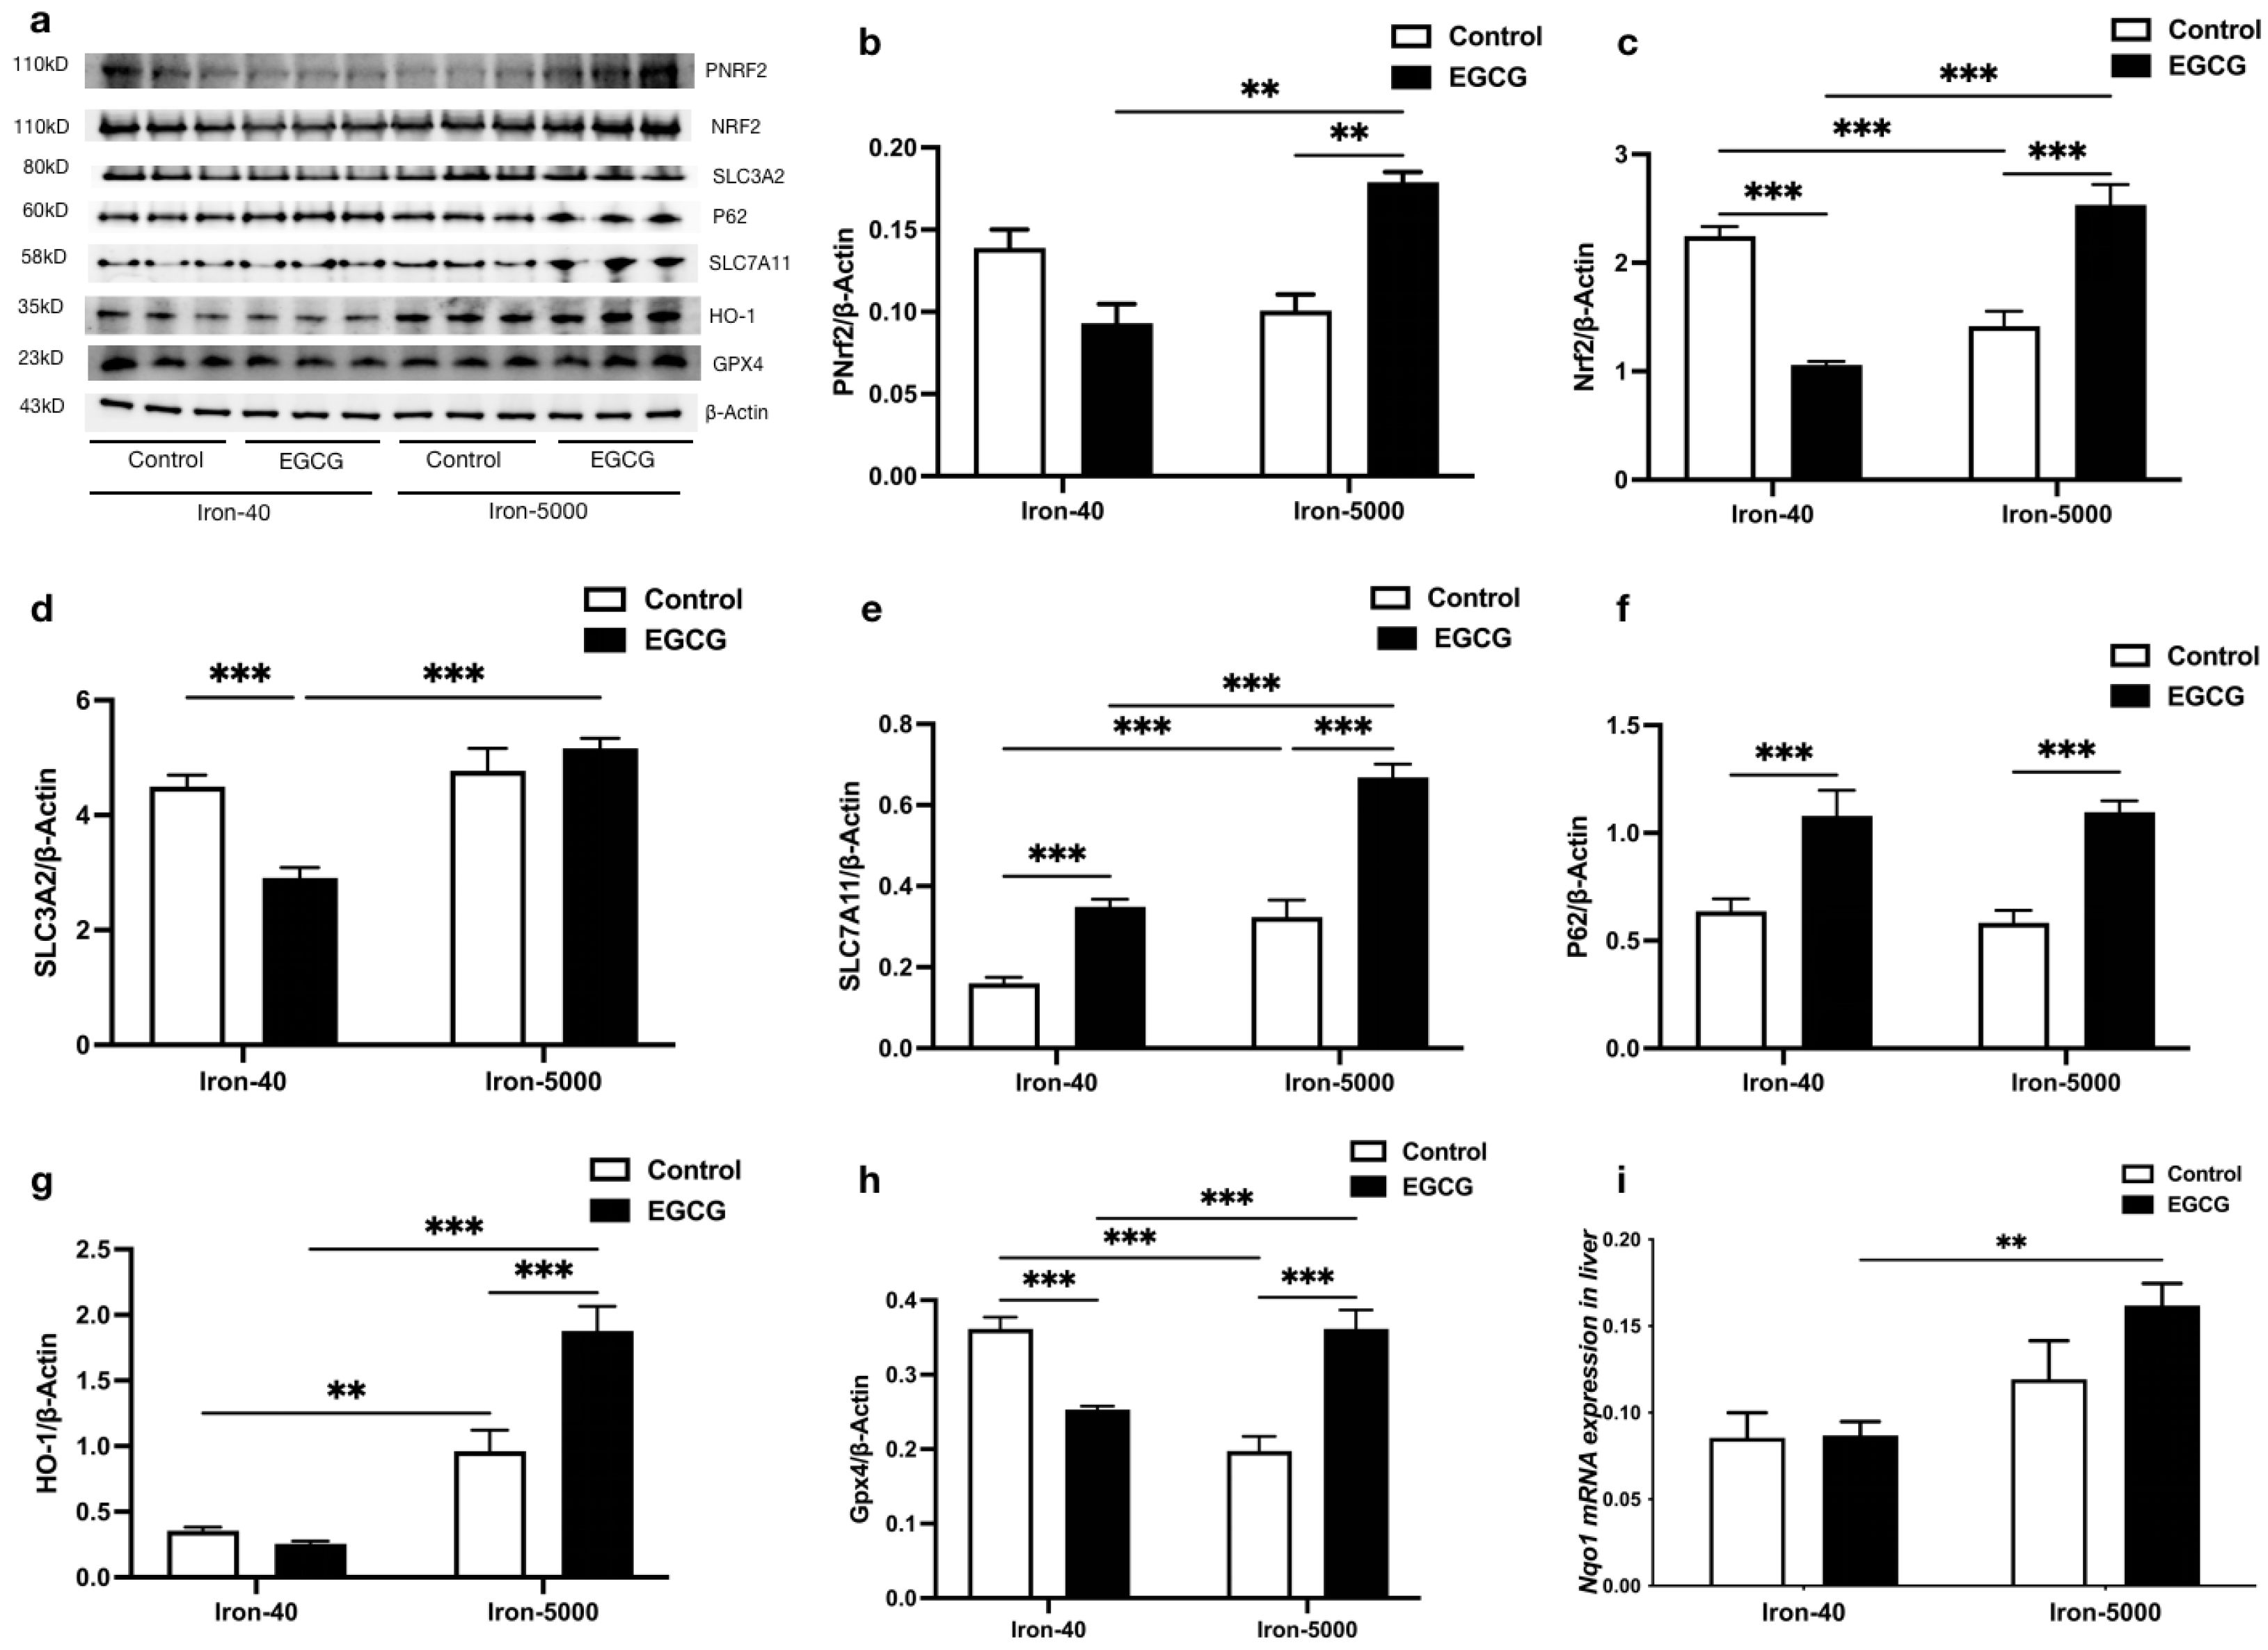
3.5. EGCG Addition Inhibits Iron Overload-Induced Ferroptosis by Elevating Antioxidant Capacity
3.6. EGCG Addition Inhibits Iron Overload-Induced Ferroptosis by Altering Iron Metabolism
4. Discussion
5. Conclusions
Supplementary Materials
Author Contributions
Funding
Institutional Review Board Statement
Informed Consent Statement
Data Availability Statement
Acknowledgments
Conflicts of Interest
Abbreviations
| RBC | red blood cell count |
| HGB | hemoglobin |
| HCT | hematocrit |
| MCV | mean corpuscular volume |
| MCH | mean corpuscular hemoglobin |
| MCHC | mean corpuscular hemoglobin concentration |
| TIBC | total iron binding capacity |
| UIBC | unsaturated iron binding capacity |
| TF | transferrin saturation |
| ALT | alanine transaminase |
| AST | aspartate transaminase |
| FAC | ferric citrate |
| ROS | reactive oxygen species |
| MDA | malondialdehyde |
| GSH/GSSG | glutathione |
| IL-1β/IL-6 | interleukin |
| Nrf2/pNrf2 | nuclear factor erythroid 2-related factor 2 |
| SLC3A2 | solute carrier family 3 member 2 |
| SLC7A11 | solute carrier family 7 member 11 |
| P62/SQSTM1 | sequestosome-1 |
| HO-1 | heme oxygenase 1 |
| GPX4 | glutathione peroxidase 4 |
| FTH/L | ferritin heavy/light chain |
| TRF1 | transferrin receptor 1 |
| FPN | ferroportin |
| Hamp1 | hepcidin1 |
References
- Ganz, T. Systemic iron homeostasis. Physiol. Rev. 2013, 93, 1721–1741. [Google Scholar] [CrossRef] [PubMed]
- Sonnweber, T.; Pizzini, A.; Tancevski, I.; Loffler, R.J.; Weiss, G. Anaemia, iron homeostasis and pulmonary hypertension: A review. Intern. Emerg. Med. 2020, 15, 573–585. [Google Scholar] [CrossRef] [PubMed]
- Dixon, S.J.; Lemberg, K.M.; Lamprecht, M.R.; Skouta, R.; Zaitsev, E.M.; Gleason, C.E.; Patel, D.N.; Bauer, A.J.; Cantley, A.M.; Yang, W.S. Ferroptosis: An iron-dependent form of nonapoptotic cell death. Cell 2012, 149, 1060–1072. [Google Scholar] [CrossRef]
- Bersuker, K.; Hendricks, J.M.; Li, Z.P.; Magtanong, L.; Ford, B.; Tang, P.H.; Roberts, M.A.; Tong, B.; Maimone, T.J.; Zongcu, R.; et al. The CoQ oxidoreductase FSP1 acts parallel to GPX4 to inhibit ferroptosis. Nature 2019, 575, 688–692. [Google Scholar] [CrossRef] [PubMed]
- Dixon, S.J.; Patel, D.N.; Welsch, M.; Skouta, R.; Lee, E.D.; Hayano, M.; Thomas, A.G.; Gleason, C.E.; Tatonetti, N.P.; Slusher, B.S.; et al. Pharmacological inhibition of cystine-glutamate exchange induces endoplasmic reticulum stress and ferroptosis. eLife 2014, 3, e02523. [Google Scholar] [CrossRef]
- Mancuso, C.; Barone, E. The heme oxygenase/biliverdin reductase pathway in drug research and development. Curr. Drug Metab. 2009, 10, 579–594. [Google Scholar] [CrossRef] [PubMed]
- Valko, M.; Morris, H.; Cronin, M.T. Metals, toxicity and oxidative stress. Curr. Med. Chem. 2005, 12, 11611208. [Google Scholar] [CrossRef] [PubMed]
- Eaton, J.W.; Qian, M. Molecular bases of cellular iron toxicity. Free Radic. Biol. Med. 2002, 32, 833–840. [Google Scholar] [CrossRef]
- Li, J.; Cao, F.; Yin, H.L.; Huang, Z.J.; Lin, Z.T.; Mao, N.; Sun, B.; Wang, G. Ferroptosis: Past, present and future. Cell Death Dis. 2020, 11, 88. [Google Scholar] [CrossRef]
- Yang, W.S.; SriRamaratnam, R.; Welsch, M.E.; Shimada, K.; Skouta, R.; Viswanathan, V.S.; Cheah, J.H.; Clemon, P.A.; Shamji, A.F.; Clish, C.B.; et al. Regulation of ferroptotic cancer cell death by GPX4. Cell 2014, 156, 317–331. [Google Scholar] [CrossRef] [PubMed]
- Dodson, M.; Castro-Portuguez, R.; Zhang, D.D. NRF2 plays a critical role in mitigating lipid peroxidation and ferroptosis. Redox Biol. 2019, 23, 101107. [Google Scholar] [CrossRef] [PubMed]
- Wang, H.; An, P.; Xie, E.; Wu, Q.; Fang, X.; Gao, H.; Zhang, Z.; Li, Y.; Wang, X.; Zhang, J.; et al. Characterization of ferroptosis in murine models of hemochromatosis. Hepatology 2017, 66, 449–465. [Google Scholar] [CrossRef] [PubMed]
- Stockwell, B.R.; Friedmann Angeli, J.P.; Bayir, H.; Bush, A.I.; Conrad, M.; Dixon, S.J.; Fulda, S.; Gascón, S.; Hatzios, S.K.; Kagan, V.E.; et al. Ferroptosis: A regulated cell death nexus linking metabolism, redox biology, and disease. Cell 2017, 171, 273–285. [Google Scholar] [CrossRef]
- Tsurusaki, S.; Tsuchiya, Y.; Koumura, T.; Nakasone, M.; Sakamoto, T.; Matsuoka, M.; Imai, H.; Kok, C.Y.; Okochi, H.; Nakano, H.; et al. Hepatic ferroptosis plays an important role as the trigger for initiating inflammation in nonalcoholic steatohepatitis. Cell Death Dis. 2019, 10, 449. [Google Scholar] [CrossRef]
- Kim, H.S.; Quon, M.; Kim, J. New insights into the mechanisms of polyphenols beyond antioxidant properties; lessons from the green tea polyphenol, epigallocatechin 3-gallate. Redox Boil. 2014, 2, 187–195. [Google Scholar] [CrossRef]
- Nesran, Z.N.M.; Shafie, N.H.; Tohid, S.F.M.; Norhaizan, M.E.; Ismail, A. Iron Chelation Properties of Green Tea Epigallocatechin-3-Gallate (EGCG) in Colorectal Cancer Cells: Analysis on Tfr/Fth Regulations and Molecular Docking. Evid.-Based Complement. Altern. Med. 2020, 2020, 7958041. [Google Scholar] [CrossRef] [PubMed]
- Chakrawarti, L.; Agrawal, R.; Dang, S.; Gupta, S.; Gabrani, R. Therapeutic effects of EGCG: A patent review. Expert Opin. Ther. Pat. 2016, 26, 907–916. [Google Scholar] [CrossRef] [PubMed]
- Li, Y.; Wu, S. Epigallocatechin gallate suppresses hepatic cholesterol synthesis by targeting SREBP-2 through SIRT1/FOXO1 signaling pathway. Mol. Cell. Biochem. 2018, 448, 175–185. [Google Scholar] [CrossRef]
- Levites, Y.; Weinreb, O.; Maor, G.; Youdim, M.B.; Mandel, S. Green tea polyphenol (–)-epigallocatechin-3-gallatep-rreventsN-methyl-4-phenyl-1,2,3,6-tetrahydropyridine-induced dopaminergic neurodegeneration. J. Neurochem. 2001, 78, 1073–1082. [Google Scholar] [CrossRef] [PubMed]
- Grünblatt, E.; Mandel, S.; Youdim, M.B. Neuroprotective strategies in Parkinson’s disease using the models of 6- hydroxydopamine and MPTP. Ann. N. Y. Acad. Sci. 2000, 899, 262–273. [Google Scholar] [CrossRef]
- Yeoh, B.S.; Olvera, R.A.; Singh, V.; Xiao, X.; Kennett, M.J.; Joe, B.; Lambert, J.D.; Vijay-Kumar, M. Epigallocatechin-3-Gallate Inhibition of Myeloperoxidase and Its Counter-Regulation by Dietary Iron and Lipocalin 2 in Murine Model of Gut Inflammation. Am. J. Pathol. 2016, 186, 912–926. [Google Scholar] [CrossRef]
- Xu, Q.; Langley, M.; Kanthasamy, A.G.; Reddy, M.B. Epigallocatechin Gallate Has a Neurorescue Effect in a Mouse Model of Parkinson Disease. J. Nutr. 2017, 147, 1926–1931. [Google Scholar] [CrossRef]
- Xu, Q.; Kanthasamy, A.G.; Reddy, M.B. Epigallocatechin Gallate Protects against TNF alpha- or H2O2-Induced Apoptosis by Modulating Iron Related Proteins in a Cell Culture Model. Int. J. Vitam. Nutr. Res. 2018, 88, 158–165. [Google Scholar] [CrossRef]
- Guo, Q.; Zhao, B.; Li, M.; Shen, S.; Xin, W. Studies on protective mechanisms of four components of green tea polyphenols against lipid peroxidation in synaptosomes. Biochim. Biophys. Acta 1996, 1304, 210–222. [Google Scholar] [CrossRef]
- Apak, R.; Güçlü, K.; Ozyürek, M.; Karademir, S.E. Novel total antioxidant capacity index for dietary polyphenols and vitamins C and E, using their cupric ion reducing capability in the presence of neocuproine: CUPRAC method. J. Agric. Food Chem. 2004, 52, 7970–7981. [Google Scholar] [CrossRef] [PubMed]
- Ullmann, U.; Haller, J.; Bakker, G.C.M.; Brink, E.J.; Weber, P. Epigallocatechin gallate (EGCG) (TEAVIGO) does not impair nonhaem-iron absorption in man. Phytomedicine 2005, 12, 410–415. [Google Scholar] [CrossRef] [PubMed]
- Della Via, F.I.; Shiraishi, R.N.; Santos, I.; Ferro, K.P.; Salazar-Terreros, M.J.; Junior, G.C.F.; Rego, E.M.; Saad, S.T.O.; Torello, C.O. (-)-Epigallocatechin-3-gallate induces apoptosis and differentiation in leukaemia by targeting reactive oxygen species and PIN1. Sci. Resour. 2021, 11, 2045–2322. [Google Scholar] [CrossRef]
- Lemanne, D.; Block, K.I.; Kressel, B.R.; Sukhatme, V.P.; White, J.D. A Case of Complete and Durable Molecular Remission of Chronic Lymphocytic Leukemia Following Treatment with Epigallocatechin-3-gallate, an Extract of Green Tea. Cureus 2015, 7, e441. [Google Scholar] [CrossRef]
- Wu, A.; Feng, B.; Yu, J.; Yan, L.; Che, L.; Zhuo, Y.; Luo, Y.; Yu, B.; Wu, D.; Chen, D. Fibroblast growth factor 21 attenuates iron overload-induced liver injury and fibrosis by inhibiting ferroptosis. Redox Biol. 2021, 46, 102131. [Google Scholar] [CrossRef]
- Wu, A.; Yu, B.; Zhang, K.; Xu, Z.; Wu, D.; He, J.; Luo, J.; Luo, Y.; Yu, J.; Zheng, P.; et al. Transmissible gastroenteritis virus targets Paneth cells to inhibit the self-renewal and differentiation of Lgr5 intestinal stem cells via Notch signaling. Cell Death Dis. 2020, 11, 40. [Google Scholar] [CrossRef] [PubMed]
- Kose, T.; Vera-Aviles, M.; Sharp, P.A.; Latunde-Dada, G.O. Curcumin and (−)- Epigallocatechin-3-Gallate Protect Murine MIN6 Pancreatic Beta-Cells against Iron Toxicity and Erastin-Induced Ferroptosis. Pharmaceuticals 2019, 12, 26. [Google Scholar] [CrossRef]
- Kang, R.; Tang, D. Autophagy and ferroptosis—What is the connection? Curr. Pathobiol. Rep. 2017, 5, 153–159. [Google Scholar] [CrossRef] [PubMed]
- Yanatori, I.; Richardson, D.R.; Toyokuni, S.; Kishi, F. The iron chaperone poly(rC)-binding protein 2 forms a metabolon with the heme oxygenase 1/cytochrome P450 reductase complex for heme catabolism and iron transfer. J. Biol. Chem. 2017, 292, 13205–13229. [Google Scholar] [CrossRef]
- Girelli, D.; Ugolini, S.; Busti, F.; Marchi, G.; Castagna, A. Modern iron replacement therapy: Clinical and pathophysiological insights. Int. J. Hematol. 2018, 107, 16–30. [Google Scholar] [CrossRef] [PubMed]
- Chen, Z.; Jiang, J.; Fu, N.; Chen, L. Targetting ferroptosis for blood cell-related diseases. J. Drug Target. 2022, 30, 244–258. [Google Scholar] [CrossRef] [PubMed]
- Berger, S.H.; Ford, R.M. Alcoholic liver disease. In Sitaraman and Friedman’s Essentials of Gastroenterology; Wiley: Hoboken, NJ, USA, 2017; pp. 211–225. [Google Scholar]
- Owiredu, W.K.B.A.; Brenya, P.K.; Osei, Y.; Laing, E.F.; Okrah, C.O.; Obirikorang, C.; Anto, E.O.; Acheampong, E.; Donkor, S. Evaluation of serum iron overload, AST:ALT ratio and log10ferritin: AST ratio among schizophrenia patients in the Kumasi Metropolis, Ghana: A case–control study. BMC Res. Notes 2019, 12, 802. [Google Scholar] [CrossRef]
- Camaschella, C.; Pagani, A.; Nai, A.; Silvestri, L. The mutual control of iron and erythropoiesis. Int. J. Lab. Hematol. 2016, 38, 20–26. [Google Scholar] [CrossRef] [PubMed]
- Yang, L.; Wang, H.; Yang, X.; Wu, Q.; An, P.; Jin, X.; Liu, W.; Huang, X.; Li, Y.; Yan, S.; et al. Auranofin mitigates systemic iron overload and induces ferroptosis via distinct mechanisms. Signal Transduct. Target. Ther. 2020, 31, 5. [Google Scholar] [CrossRef]
- Poggiali, E.; De Amicis, M.M.; Motta, I. Anemia of chronic disease: A unique defect of iron recycling for many different chronic diseases. Eur. J. Intern. Med. 2014, 25, 12–17. [Google Scholar] [CrossRef]
- Zhabyeyev, P.; Das, S.K.; Basu, R.; Shen, M.; Patel, V.B.; Kassiri, Z.; Oudit, G.Y. TIMP3 deficiency exacerbates iron overload-mediated cardiomyopathy and liver disease. Am. J. Physiol.-Heart Circ. Physiol. 2018, 314, H978–H990. [Google Scholar] [CrossRef]
- Garringer, H.J.; Irimia, J.M.; Li, W.; Goodwin, C.B.; Richin, B.; Acton, A.; Chan, R.J.; Peacock, M.; Muhoberac, B.B.; Ghetti, B.; et al. Effect of Systemic Iron Overload and a Chelation Therapy in a Mouse Model of the Neurodegenerative Disease Hereditary Ferritinopathy. PLoS ONE 2016, 11, e0161341. [Google Scholar] [CrossRef]
- Rong, G.L.; Cai, Y.C.; Weng, W.C.; Chen, Y.; Yu, X.; Shao, M.; Han, P.; Sun, H. Artemether attenuates renal tubular injury by regulating iron metabolism in mice with streptozotocin-induced diabetes. Am. J. Transl. Res. 2022, 14, 6095–6106. [Google Scholar] [PubMed]
- Tang, D.; Chen, X.; Kang, R.; Kroemer, G. Ferroptosis: Molecular mechanisms and health implications. Cell Res. 2021, 31, 107–125. [Google Scholar] [CrossRef] [PubMed]
- Altamura, S.; Kessler, R.; Gröne, H.-J.; Gretz, N.; Hentze, M.W.; Galy, B.; Muckenthaler, M.U. Resistance of Ferroportin to Hepcidin Binding causes Exocrine Pancreatic Failure and Fatal Iron Overload. Cell Metab. 2014, 20, 359–367. [Google Scholar] [CrossRef] [PubMed]
- Kuang, F.; Liu, J.; Tang, D.; Kang, R. Oxidative damage and antioxidant defense in ferroptosis. Front. Cell Dev. Biol. 2020, 8, 586578. [Google Scholar] [CrossRef]
- Xicota, L.; Rodríguez, J.; Langohr, K.; Fitó, M.; Dierssen, M.; Torre, R.d.l. Effect of epigallocatechin gallate on the body composition and lipid profile of down syndrome individuals: Implications for clinical management. Clin. Nutr. 2020, 39, 1292–1300. [Google Scholar] [CrossRef] [PubMed]
- Wichaiyo, S.; Yatmark, P.; Vargas, R.E.M.; Sanvarinda, P.; Svasti, S.; Fucharoen, S.; Morales, N.P. Effect of iron overload on furin expression in wild-type and beta-thalassemic mice. Toxicol. Rep. 2015, 2, 415–422. [Google Scholar] [CrossRef]
- Koonyosying, P.; Kongkarnka, S.; Uthaipibull, C.; Svasti, S.; Fucharoen, S.; Srichairatanakool, S. Green tea extract modulates oxidative tissue injury in beta-thalassemic mice by chelation of redox iron and inhibition of lipid peroxidation. Biomed. Pharm. 2018, 108, 1694–1702. [Google Scholar] [CrossRef] [PubMed]
- Lopez-Castejon, G.; Brough, D. Understanding the mechanism of IL-1β secretion. Cytokine Growth Factor Rev. 2011, 22, 189–195. [Google Scholar] [CrossRef]
- Novilla, A.; Djamhuri, D.S.; Nurhayati, B.; Rihibiha, D.D.; Afifah, E.; Widowati, W. Anti-inflammatory properties of oolong tea (Camellia sinensis) ethanol extract and epigallocatechin gallate in LPS-induced RAW 264.7 cells. Asian Pac. J. Trop. Biomed. 2017, 7, 1005–1009. [Google Scholar] [CrossRef]
- Lashari, D.M.; Aljunaid, M.A.; Ridwan, R.D.; Diyatri, I.; Lashari, Y.; Qaid, H.; Surboyo, M.D.C. The ability of mucoadhesive gingival patch loaded with EGCG on IL-6 and IL-10 expression in periodontitis. J. Oral Biol. Craniofacial Res. 2022, 12, 679–682. [Google Scholar] [CrossRef] [PubMed]
- Gan, L.; Cao, Y.; Yuan, J. Effects of (+)-catechin and epigallocatechin gallate on alcoholic fatty liver in mice models. Zhong Hua Yu Fang Yi Xue Za Zhi 2021, 55, 1305–1310. [Google Scholar]
- Pradhan, A.; Sengupta, S.; Sengupta, R.; Chatterjee, M. Attenuation of methotrexate induced hepatotoxicity by epigallocatechin 3-gallate. Drug Chem. Toxicol. 2022, 14, 1–9. [Google Scholar] [CrossRef]
- Zhang, H.; Tsao, R. Dietary polyphenols, oxidative stress and antioxidant and anti-inflammatory effects. Curr. Opin. Food Sci. 2016, 8, 33–42. [Google Scholar] [CrossRef]
- Meng, Q.; Velalar, C.N.; Ruan, R. Regulating the age-related oxidative damage, mitochondrial integrity, and antioxidative enzyme activity in Fischer 344 rats by supplementation of the antioxidant epigallocatechin-3-gallate. Rejuvenation Res. 2008, 11, 649–660. [Google Scholar] [CrossRef] [PubMed]
- Li, Y.; Zhao, S.; Zhang, W.; Zhao, P.; He, B.; Wu, N.; Han, P. Epigallocatechin-3-Ogallate (EGCG) attenuates FFAs-induced peripheral insulin resistance through AMPK pathway and insulin signaling pathway in vivo. Diabetes Res. Clin. Pract. 2011, 93, 205–214. [Google Scholar] [CrossRef]
- Tong, X.; Kawabata, H.; Koeffler, H.P. Iron deficiency can upregulate expression of transferrin receptor at both the mRNA and protein level. Br. J. Haematol. 2002, 116, 458–464. [Google Scholar] [CrossRef]
- DRichardson, D.R. Iron chelators as therapeutic agents for the treatment of cancer. Crit. Rev. Oncol./Hematol. 2002, 42, 267–281. [Google Scholar] [CrossRef]
- Nakagawa, H.; Hasumi, K.; Woo, J.T.; Nagai, K.; Wachi, M. Generation of hydrogen peroxide primarily contributes to the induction of Fe(II)-dependent apoptosis in Jurkat cells by (-)-epigallocatechin gallate. Carcinogenesis 2004, 25, 1567–1574. [Google Scholar] [CrossRef]
- Dai, W.Z.; Ruan, C.; Zhang, Y.; Wang, J.; Han, J.; Shao, Z.; Sun, Y.; Liang, J. Bioavailability enhancement of EGCG by structural modification and nano-delivery: A review. J. Funct. Foods 2020, 65, 103732. [Google Scholar] [CrossRef]
- Zhu, S.; Meng, N.; Li, Y.; Chen, S.; Xia, Y. Antioxidant activities of lipophilic (-)-epigallocatechin gallate derivatives in vitro and in lipid-based food systems. Food Biosci. 2021, 42, 101055. [Google Scholar] [CrossRef]
- Zhang, Z.; Zhang, X.; Bi, K.; He, Y.; Yan, W.; YANG, C.S.; Zhang, J. Potential protective mechanisms of green tea polyphenol EGCG against COVID-19. Trends Food Sci. Technol. 2021, 114, 11–24. [Google Scholar] [PubMed]


Disclaimer/Publisher’s Note: The statements, opinions and data contained in all publications are solely those of the individual author(s) and contributor(s) and not of MDPI and/or the editor(s). MDPI and/or the editor(s) disclaim responsibility for any injury to people or property resulting from any ideas, methods, instructions or products referred to in the content. |
© 2023 by the authors. Licensee MDPI, Basel, Switzerland. This article is an open access article distributed under the terms and conditions of the Creative Commons Attribution (CC BY) license (https://creativecommons.org/licenses/by/4.0/).
Share and Cite
Yang, C.; Wu, A.; Tan, L.; Tang, D.; Chen, W.; Lai, X.; Gu, K.; Chen, J.; Chen, D.; Tang, Q. Epigallocatechin-3-Gallate Alleviates Liver Oxidative Damage Caused by Iron Overload in Mice through Inhibiting Ferroptosis. Nutrients 2023, 15, 1993. https://doi.org/10.3390/nu15081993
Yang C, Wu A, Tan L, Tang D, Chen W, Lai X, Gu K, Chen J, Chen D, Tang Q. Epigallocatechin-3-Gallate Alleviates Liver Oxidative Damage Caused by Iron Overload in Mice through Inhibiting Ferroptosis. Nutrients. 2023; 15(8):1993. https://doi.org/10.3390/nu15081993
Chicago/Turabian StyleYang, Chunjing, Aimin Wu, Liqiang Tan, Dandan Tang, Wei Chen, Xin Lai, Ke Gu, Junzhou Chen, Daiwen Chen, and Qian Tang. 2023. "Epigallocatechin-3-Gallate Alleviates Liver Oxidative Damage Caused by Iron Overload in Mice through Inhibiting Ferroptosis" Nutrients 15, no. 8: 1993. https://doi.org/10.3390/nu15081993
APA StyleYang, C., Wu, A., Tan, L., Tang, D., Chen, W., Lai, X., Gu, K., Chen, J., Chen, D., & Tang, Q. (2023). Epigallocatechin-3-Gallate Alleviates Liver Oxidative Damage Caused by Iron Overload in Mice through Inhibiting Ferroptosis. Nutrients, 15(8), 1993. https://doi.org/10.3390/nu15081993