


Prevalence of Relative Energy Deficiency in Sport (RED-S) among National Athletes in Malaysia

 , ,
, ,
Abstract
1. Introduction
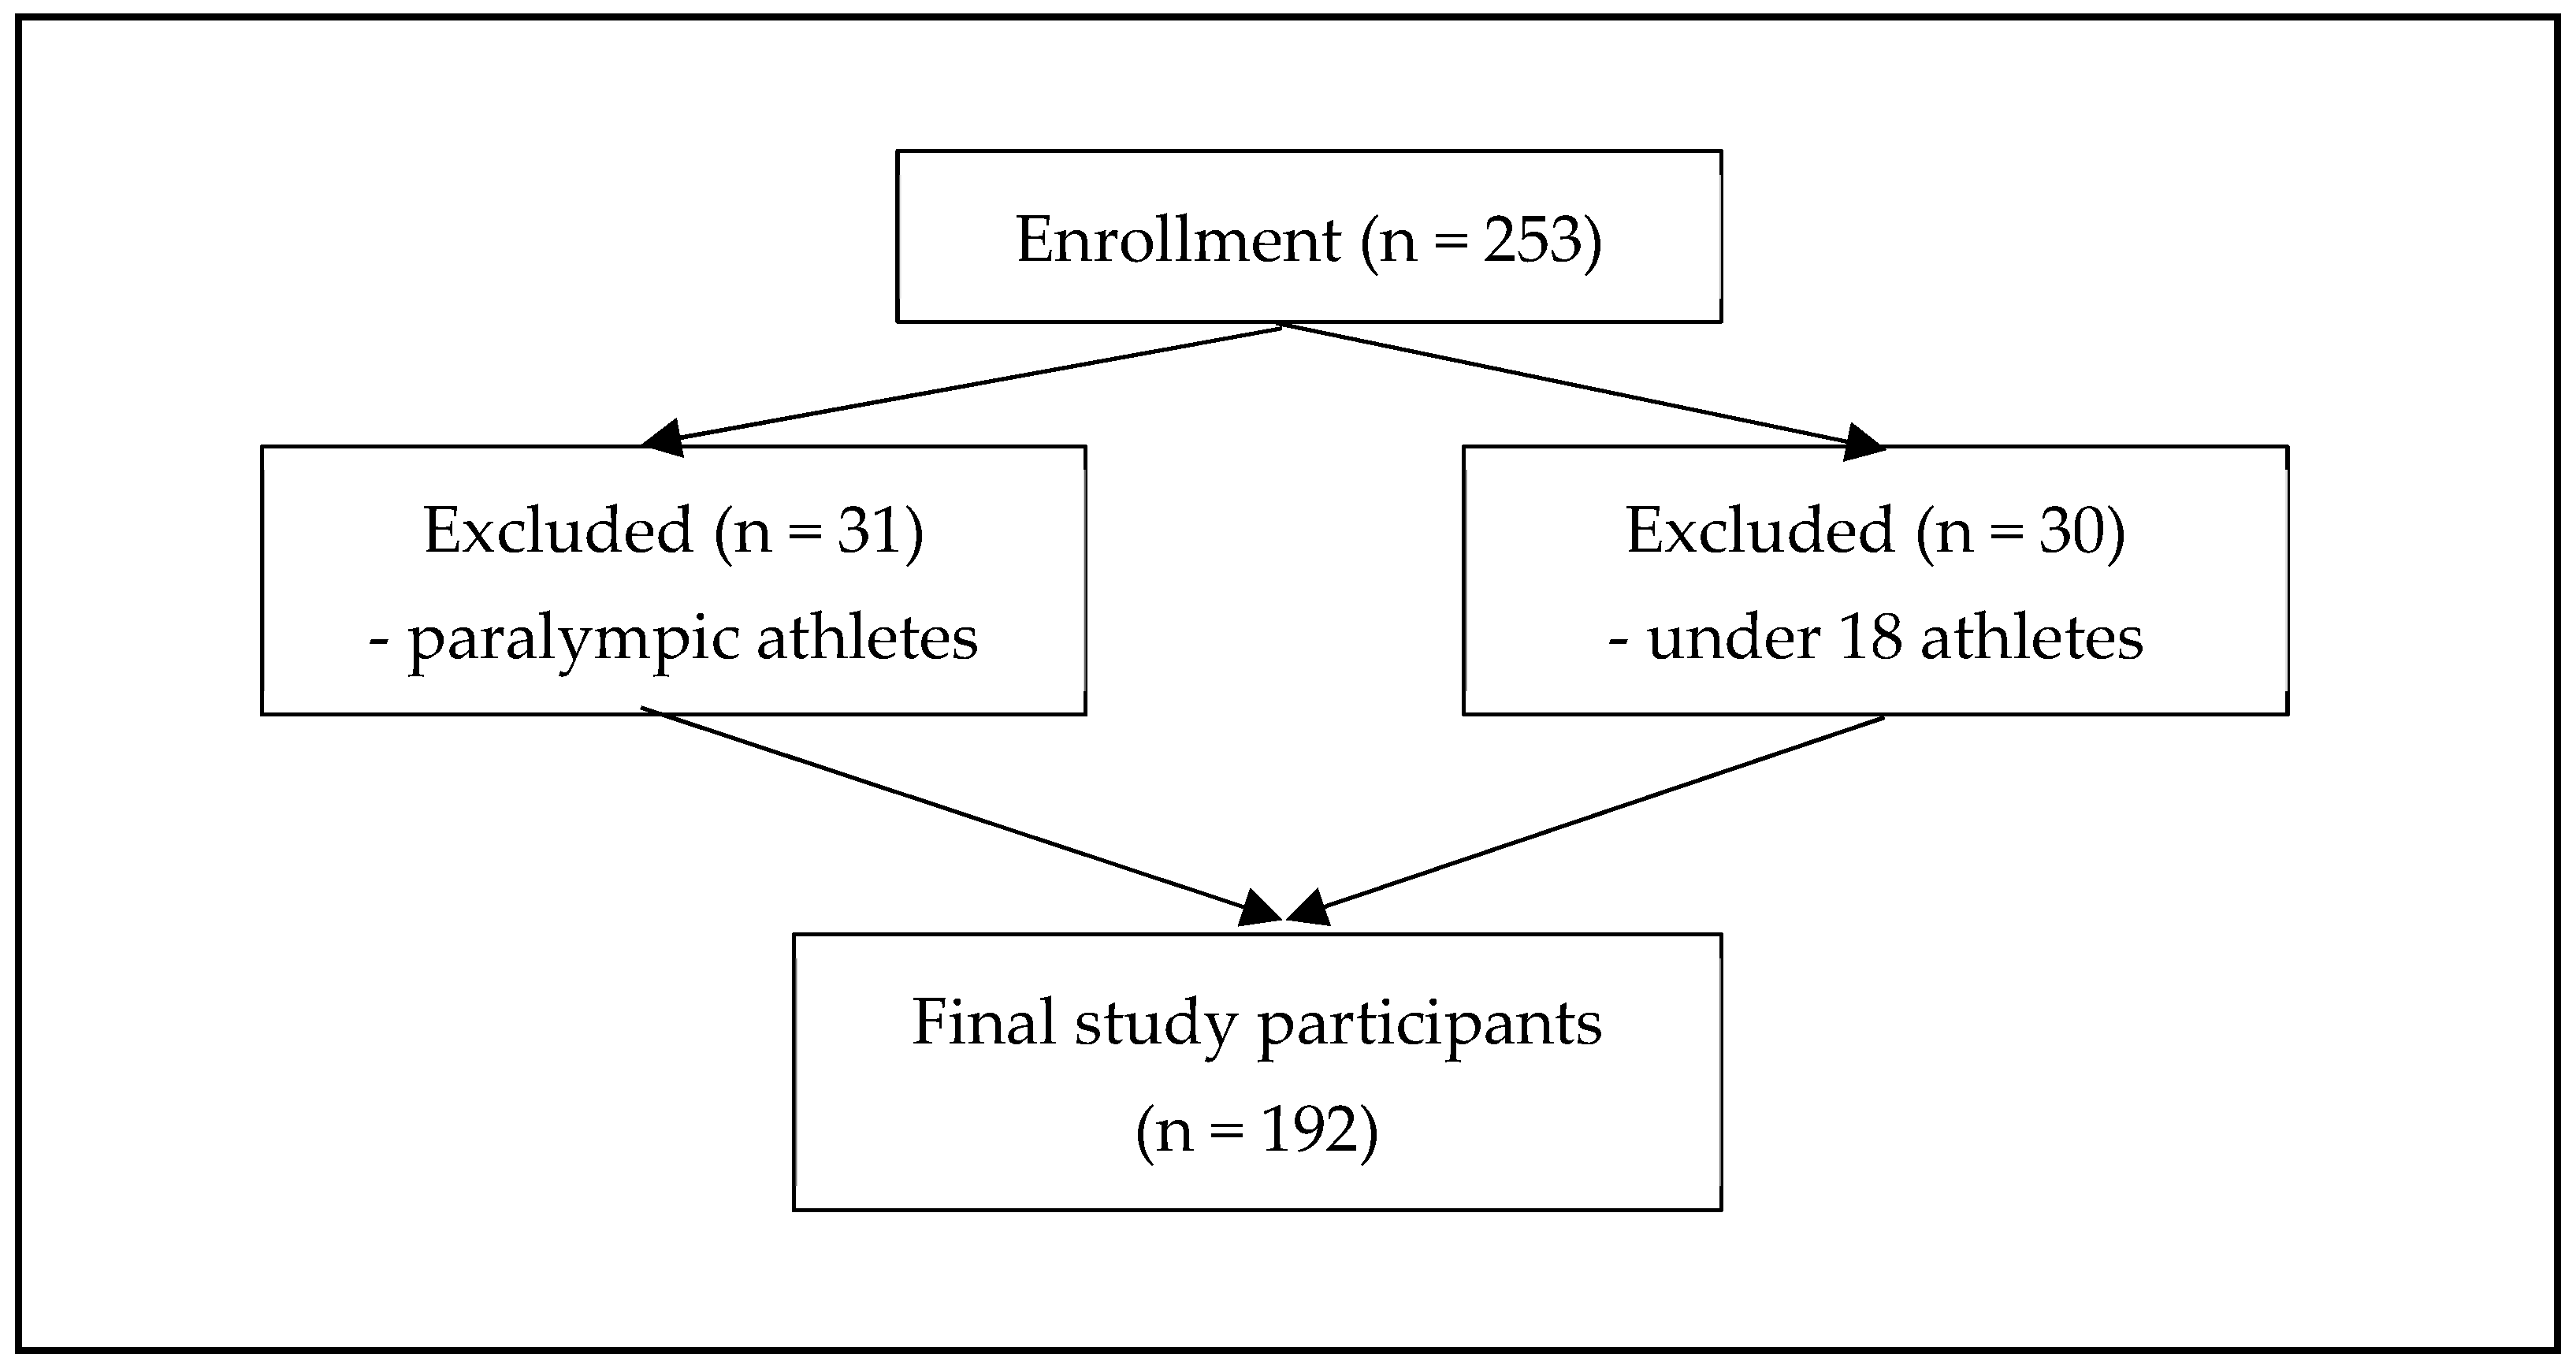
2. Materials and Methods
3. Results
4. Discussion
5. Conclusions
Author Contributions
Funding
Institutional Review Board Statement
Informed Consent Statement
Data Availability Statement
Acknowledgments
Conflicts of Interest
References
- Black, K.; Slater, J.; Brown, R.C.; Cooke, R. Low energy availability, plasma lipids, and hormonal profiles of recreational athletes. J. Strength Cond. Res. 2018, 32, 2816–2824. [Google Scholar] [CrossRef] [PubMed]
- Mountjoy, M.; Sundgot-Borgen, J.; Burke, L.; Carter, S.; Constantini, N.; Lebrun, C.; Meyer, N.; Sherman, R.; Steffen, K.; Budgett, R.; et al. The IOC consensus statement: Beyond the female athlete triad-relative energy deficiency in sport (RED-S). Br. J. Sport. Med. 2014, 48, 491–497. [Google Scholar] [CrossRef] [PubMed]
- Logue, D.M.; Madigan, S.M.; Melin, A.; Delahunt, E.; Heinen, M.; Donnell, S.M.; Corish, C.A. Low energy availability in athletes 2020: An updated narrative review of prevalence, risk, within-day energy balance, knowledge, and impact on sports performance. Nutrients 2020, 12, 835. [Google Scholar] [CrossRef] [PubMed]
- Yeager, K.K.; Agostini, R.; Nattiv, A.; Drinkwater, B. The female athlete triad: Disordered eating, amenorrhea, osteoporosis. Med. Sci. Sport. Exerc. 1993, 25, 775–777. [Google Scholar] [CrossRef] [PubMed]
- Nattiv, A.; Loucks, A.B.; Manore, M.M.; Sanborn, C.F.; Sundgot-Borgen, J.; Warren, M.P. American College of Sports Medicine. American College of Sports Medicine position stand. The female athlete triad. Med. Sci. Sport. Exerc. 2007, 39, 1867–1882. [Google Scholar] [CrossRef]
- Nattiv, A.; De Souza, M.J.; Koltun, K.J.; Misra, M.; Kussman, A.; Williams, N.I.; Barrack, M.T.; Kraus, E.; Joy, E.; Fredericson, M. The Male Athlete Triad-A Consensus Statement from the Female and Male Athlete Triad Coalition Part 1: Definition and Scientific Basis. Clin. J. Sport. Med. 2021, 31, 345–353. [Google Scholar] [CrossRef]
- Mountjoy, M.; Sundgot-Borgen, J.K.; Burke, L.M.; Ackerman, K.E.; Blauwet, C.; Constantini, N.; Lebrun, C.; Lundy, B.; Melin, A.K.; Meyer, N.L.; et al. IOC consensus statement on relative energy deficiency in sport (RED-S): 2018 update. Br. J. Sport. Med. 2018, 52, 687–697. [Google Scholar] [CrossRef]
- Ackerman, K.E.; Holtzman, B.; Cooper, K.M.; Flynn, E.F.; Bruinvels, G.; Tenforde, A.S.; Popp, K.L.; Simpkin, A.J.; Parziale, A.L. Low energy availability surrogates correlate with health and performance consequences of relative energy deficiency in sport. Br. J. Sport. Med. 2019, 53, 628–633. [Google Scholar] [CrossRef]
- Drew, M.; Vlahovich, N.; Hughes, D.; Appaneal, R.; Burke, L.M.; Lundy, B.; Rogers, M.; Toomey, M.; Watts, D.; Lovell, G.; et al. Prevalence of illness, poor mental health and sleep quality and low energy availability prior to the 2016 summer Olympic games. Br. J. Sport. Med. 2018, 52, 47–53. [Google Scholar] [CrossRef]
- Burke, L.M.; Lundy, B.; Fahrenholtz, I.L.; Melin, A.K. Pitfalls of conducting and interpreting estimates of energy availability in free-living athletes. Int. J. Sport Nutr. Exerc. Metab. 2018, 28, 350–363. [Google Scholar] [CrossRef]
- Sim, A.; Mukherjee, S. Potential Low Energy Availability (LEA) risk amongst amateur and recreational athletes in Singapore. Phys. Act. Health 2021, 5, 166–177. [Google Scholar] [CrossRef]
- Melin, A.; Tornberg, Å.B.; Skouby, S.; Faber, J.; Ritz, C.; Sjödin, A.; Sundgot-Borgen, J. The LEAF questionnaire: A screening tool for the identification of female athletes at risk for the female athlete triad. Br. J. Sport. Med. 2014, 48, 540–545. [Google Scholar] [CrossRef]
- Lundy, B.; Torstveit, M.K.; Stenqvist, T.B.; Burke, L.M.; Garthe, I.; Slater, G.J.; Ritz, C.; Melin, A.K. Screening for Low Energy Availability in Male Athletes: Attempted Validation of LEAM-Q. Nutrients 2022, 14, 1873. [Google Scholar] [CrossRef]
- Heikura, I.A.; Uusitalo, A.L.T.; Stellingwerff, T.; Bergland, D.; Mero, A.A.; Burke, L.M. Low energy availability is difficult to assess but outcomes have large impact on bone injury rates in elite distance athletes. Int. J. Sport Nutr. Exerc. Metab. 2018, 28, 403–411. [Google Scholar] [CrossRef]
- Jesus, F.; Castela, I.; Silva, A.M.; Branco, P.A.; Sousa, M. Risk of low energy availability among female and male elite runners competing at the 26th European cross-country championships. Nutrients 2021, 13, 873. [Google Scholar] [CrossRef]
- Keay, N.; Overseas, A.D.; Francis, G. Indicators and correlates of low energy availability in male and female dancers. BMJ Open Sport Exerc. Med. 2020, 6, 1–7. [Google Scholar] [CrossRef]
- Quah, Y.V.; Poh, B.K.; Ng, L.O.; Noor, M.I. The female athlete triad among elite Malaysian athletes: Prevalence and associated factors. Asia Pac. J. Clin. Nutr. 2009, 18, 200–208. [Google Scholar]
- Krejcie, R.V.; Morgan, D.W. Determining Sample Size for Research Activities. Educ. Psychol. Meas. 1970, 30, 607–610. [Google Scholar] [CrossRef]
- Foley Davelaar, C.M.; Ostrom, M.; Schulz, J.; Trane, K.; Wolkin, A.; Granger, J. Validation of an age-appropriate screening tool for female athlete triad and relative energy deficiency in sport in young athletes. Cureus 2020, 12, 1–22. [Google Scholar] [CrossRef]
- Tavakol, M.; Dennick, R. Making Sense of Cronbach’s Alpha. Int. J. Med. Educ. 2011, 2, 53–55. [Google Scholar] [CrossRef]
- Wasserfurth, P.; Palmowski, J.; Hahn, A. Reasons for and consequences of low energy availability in female and male athletes: Social environment, adaptations, and prevention. Sport. Med. 2020, 6, 44. [Google Scholar] [CrossRef] [PubMed]
- Charlton, B.T.; Forsyth, S.; Clarke, D.C. Low energy availability and relative energy deficiency in sport: What coaches should know. Int. J. Sport. Sci. Coach. 2022, 17, 445–460. [Google Scholar] [CrossRef]
- Jurov, I.; Keay, N.; Hadžić, V. Relationship between energy availability, energy conservation and cognitive restraint with performance measures in male endurance athletes. J. Int. Soc. Sport. Nutr. 2021, 18, 24. [Google Scholar] [CrossRef] [PubMed]
- Lane, A.R.; Hackney, A.C.; Smith-Ryan, A.E.; Kucera, K.; Register-Mihalik, J.K.; Ondrak, K. Energy Availability and RED-S Risk Factors in Competitive, Non-elite Male Endurance Athletes. Transl. Med. Exerc. Prescr. 2021, 1, 25–32. [Google Scholar] [CrossRef]
- Lane, A.R.; Hackney, A.C.; Smith-Ryan, A.; Kucera, K.; Registar-Mihalik, J.; Ondrak, K. Prevalence of Low Energy Availability in Competitively Trained Male Endurance Athletes. Medicina 2019, 55, 665. [Google Scholar] [CrossRef]
- Beermann, B.L.; Lee, D.G.; Almstedt, H.C.; McCormack, W.P. Nutritional intake and energy availability of collegiate distance runners. J. Am. Coll. Nutr. 2020, 39, 747–755. [Google Scholar] [CrossRef]
- Dave, S.C.; Fisher, M. Relative energy deficiency in sport (RED–S). Curr. Probl. Pediatr. Adolesc. Health Care 2022, 52, 101242. [Google Scholar] [CrossRef]
- Meng, K.; Qiu, J.; Benardot, D. The risk of low energy availability in Chinese elite and recreational female aesthetic sports athletes. J. Int. Soc. Sport. Nutr. 2020, 17, 13. [Google Scholar] [CrossRef]
- Smith, A.B.; Gay, J.L.; Arent, S.M.; Sarzynski, M.A.; Emerson, D.M.; Torres-McGehee, T.M. Examination of the prevalence of female athlete triad components among competitive cheerleaders. Int. J. Environ. Res. Public Health 2022, 19, 1375. [Google Scholar] [CrossRef]
- Sundgot-Borgen, J.; Meyer, N.L.; Lohman, T.G.; Ackland, T.R.; Maughan, R.J.; Stewart, A.D.; Müller, W. How to minimise the health risks to athletes who compete in weight-sensitive sports review and position statement on behalf of the Ad Hoc Research Working Group on Body Composition, Health and Performance, under the auspices of the IOC Medical Commission. Br. J. Sport. Med. 2013, 47, 1012–1022. [Google Scholar] [CrossRef]
- Torres-McGehee, T.M.; Emerson, D.M.; Pritchett, K.; Moore, E.M.; Smith, A.B.; Uriegas, N.A. Energy availability with or without eating disorder risk in collegiate female athletes and performing artists. J. Athl. Train. 2021, 56, 993–1002. [Google Scholar] [CrossRef]
- Kerksick, C.M.; Wilborn, C.D.; Roberts, M.D. ISSN exercise & sports nutrition review update: Research & recommendations. J Int. Soc. Sport. Nutr. 2018, 15, 38. [Google Scholar] [CrossRef]
- Sanda, S.B.; Sundgot-Borgen, J. Eating disorders in athletes: Overview of prevalence, risk factors and recommendations for prevention and treatment. Eur. J. Sport. Sci. 2013, 13, 499–508. [Google Scholar] [CrossRef]
- Kuikman, M.A.; Mountjoy, M.; Burr, J.F. Examining the relationship between exercise dependence, disordered eating, and low energy availability. Nutrients 2021, 13, 2601. [Google Scholar] [CrossRef]
- Syed, J.; Jamil, A.; Namroz, N.; Shakeel, M.; Malik, A.; Kanwal, S.; Riaz, H. Prevalence of risk factors of the female athlete triad among young elite athletes of Pakistan. Int. J. Sport. Phys. Ther. 2022, 17, 210–217. [Google Scholar] [CrossRef]
- Goltz, F.R.; Stenzel, L.M.; Schneider, C.D. Disordered eating behaviors and body image in male athletes. Rev. Bras. De. Psiquiatr. 2013, 35, 237–242. [Google Scholar] [CrossRef]
- De Borja, C.; Holtzman, B.; McCall, L.M. Specific dietary practices in female athletes and their association with positive screening for disordered eating. J. Eat. Disorder. 2021, 9, 50. [Google Scholar] [CrossRef]
- Papageorgiou, M.; Dolan, E.; Elliott-Sale, K.J.; Sale, C. Reduced energy availability: Implications for bone health in physically active populations. Eur. J. Nutrition. 2018, 57, 847–859. [Google Scholar] [CrossRef]
- Nor Azizam, N.S.; Yusof, S.N.; Amon, J.J.; Ahmad, A.; Safii, N.S.; Jamil, N.A. Sports nutrition and food knowledge among Malaysian university athletes. Nutrients 2022, 14, 572. [Google Scholar] [CrossRef]
- Chin, K.Y.; Ng, B.N.; Rostam, M.K.I.; Muhammad Fadzil, N.F.D.; Raman, V.; Mohamed Yunus, F.; Syed Hashim, S.A.; Ekeuku, S.O. A mini review on osteoporosis: From biology to pharmacological management of bone loss. J. Clin. Med. 2022, 11, 6434. [Google Scholar] [CrossRef]


| Male (n = 97) | Female (n = 95) | Total (n = 192) | |||||
|---|---|---|---|---|---|---|---|
| Median (IQR) | n (%) | Median (IQR) | n (%) | Median (IQR) | n (%) | p-Value | |
| Age (years) | 22.7 (5.1) | 22.3 (5.6) | 22.7 (5.4) | 0.431 a | |||
| Weight (kg) | 68.0 (12.0) | 56.0 (11.0) | 61.5 (15.0) | <0.001 a | |||
| Height (cm) | 170.0 (9.0) | 160.0 (7.0) | 165.0 (12.0) | <0.001 a | |||
| Ethnicity | <0.001 b | ||||||
| Malay | 68 (70.1) | 43 (45.3) | 111 (57.8) | ||||
| Chinese | 17 (17.5) | 34 (35.8) | 51 (26.6) | ||||
| Indian | 4 (4.1) | 5 (5.3) | 9 (4.7) | ||||
| Others | 8 (8.2) | 13 (13.7) | 21 (10.9) | ||||
| Education level | 0.414 b | ||||||
| Secondary school | 49 (48.5) | 37 (38.9) | 86 (44.8) | ||||
| Pre-university | 11 (11.3) | 12 (12.6) | 23 (12.0) | ||||
| Tertiary education | 37 (38.2) | 46 (48.4) | 83 (43.2) | ||||
| Sport category | 0.717 b | ||||||
| Weight class | 30 (30.9) | 23 (24.2) | 53 (27.6) | ||||
| Power | 10 (10.3) | 15 (15.8) | 25 (13.0) | ||||
| Intermittent | 33 (34.0) | 31 (32.6) | 64 (33.3) | ||||
| Endurance | 4 (4.1) | 5 (5.3) | 9 (4.7) | ||||
| Skill | 20 (20.6) | 21 (22.1) | 41 (21.4) | ||||
| Athlete’s training program | 0.161 b | ||||||
| Elite | 76 (78.4) | 66 (69.5) | 142 (74.0) | ||||
| Development (junior) | 21 (21.6) | 29 (30.5) | 50 (26.0) | ||||
| Training phase | |||||||
| General preparation | 27 (27.8) | 25 (26.3) | 52 (27.1) | 0.183 b | |||
| Specific preparation | 24 (24.7) | 16 (16.8) | 40 (20.8) | ||||
| Pre-competition | 27 (27.8) | 27 (28.4) | 54 (28.1) | ||||
| Competition | 16 (16.5) | 16 (16.8) | 32 (16.7) | ||||
| Transition | 3 (3.1) | 11 (11.6) | 14 (7.3) | ||||
| Low RED-S Risk | Medium/High RED-S Risk | p-Value a | |
|---|---|---|---|
| n (%) | n (%) | ||
| Sex | <0.001 | ||
| Male | 47 (24.5) | 50 (26.0) | |
| Female | 16 (8.3) | 79 (41.2) | |
| Ethnicity | 0.051 | ||
| Malay | 45 (23.4) | 66 (34.3) | |
| Chinese | 10 (5.2) | 41 (21.3) | |
| Indian | 2 (1.0) | 7 (3.6) | |
| Others | 6 (3.1) | 15 (7.8) | |
| Education level | 0.561 | ||
| Secondary school | 30 (15.6) | 56 (29.2) | |
| Pre-university | 9 (4.7) | 14 (7.3) | |
| Tertiary education | 24 (12.5) | 59 (30.7) | |
| Sports category | <0.001 | ||
| Weight class | 7 (3.6) | 46 (23.9) | |
| Power | 2 (1.0) | 23 (11.9) | |
| Intermittent | 25 (13.0) | 39 (20.3) | |
| Endurance | 3 (1.6) | 6 (3.1) | |
| Skill | 26 (13.5) | 15 (7.8) | |
| Athlete’s training program | 0.435 | ||
| Elite | 49 (25.5) | 93 (48.5) | |
| Development (junior) | 14 (7.3) | 36 (18.7) | |
| Training phase | 0.457 | ||
| General preparation | 19 (9.9) | 33 (17.2) | |
| Specific preparation | 14 (7.3) | 26 (13.5) | |
| Pre-competition | 19 (9.9) | 35 (18.2) | |
| Competition | 8 (4.2) | 24 (12.5) | |
| Transition | 3 (1.6) | 11 (5.7) |
| Domain: Activity Levels | Responses | All | Sex | p-Value a | ||
|---|---|---|---|---|---|---|
| n | % | Male n (%) | Female n (%) | |||
| How many hours in a day do you practice/play/do your sport/activity? | 1–2 h | 21 | 10.9 | 10 (10.3) | 11 (11.5) | 0.080 |
| 2–5 h | 106 | 55.2 | 61 (62.9) | 45 (47.3) | ||
| 5 h and above | 65 | 33.9 | 26 (26.8) | 39 (41.2) | ||
| How many times in a week do you practice/play/do your sport/activity? | 2–3 days a week | 3 | 1.6 | 1 (1.0) | 2 (2.1) | 0.377 |
| 3–5 days a week | 86 | 44.8 | 48 (49.5) | 38 (40) | ||
| 6–7 days a week | 103 | 53.6 | 48 (49.5) | 55 (57.9) | ||
| Do you feel like your ability to perform your sport has changed? | Yes | 41 | 21.4 | 18 (18.6) | 23 (24.2) | 0.339 |
| No | 151 | 78.6 | 79 (81.4) | 72 (75.8) | ||
| Domain: Nutrition, weight, and diet | ||||||
| Have you recently had a change in your weight? | Yes, lost weight | 42 | 21.9 | 24 (24.7) | 18 (18.9) | 0.620 |
| Yes, gain weight | 63 | 32.8 | 31 (32.0) | 32 (33.6) | ||
| No change | 87 | 45.3 | 42 (43.3) | 45 (47.5) | ||
| Are you terrified about being overweight? | Usually/Always | 49 | 25.6 | 15 (15.5) | 34 (35.7) | 0.007 |
| Sometimes | 69 | 35.9 | 37 (38.1) | 32 (33.6) | ||
| Never/Rarely | 74 | 38.5 | 45 (46.4) | 29 (30.7) | ||
| Are you worried about what you eat? | Usually/Always | 40 | 20.9 | 16 (16.5) | 24 (25.2) | 0.286 |
| Sometimes | 84 | 43.8 | 42 (43.3) | 42 (44.1) | ||
| Never/Rarely | 68 | 35.3 | 39 (40.2) | 29 (30.7) | ||
| Are you worried about the thought of having fat on your body? | Usually/Always | 63 | 32.9 | 32 (33.0) | 31 (32.5) | 0.044 |
| Sometimes | 57 | 29.7 | 22 (22.7) | 35 (36.8) | ||
| Never/Rarely | 72 | 37.4 | 43 (44.3) | 29 (30.7) | ||
| Do you think about burning calories while exercising? | Usually/Always | 75 | 39.1 | 38 (39.2) | 37 (38.9) | 0.048 |
| Sometimes | 58 | 30.2 | 22 (22.7) | 36 (37.8) | ||
| Never/Rarely | 59 | 30.7 | 37 (38.1) | 22 (23.3) | ||
| Do you feel like you cannot stop eating, even if you feel full? | Usually/Always | 14 | 7.3 | 6 (6.2) | 8 (8.4) | 0.776 |
| Sometimes | 56 | 29.2 | 30 (30.9) | 26 (26.3) | ||
| Never/Rarely | 122 | 63.5 | 61 (62.9) | 61 (65.3) | ||
| Have you purposely thrown up after eating? | Sometimes | 4 | 2.1 | 2 (2.1) | 2 (2.1) | 0.962 |
| Never/Rarely | 188 | 97.9 | 95 (97.9) | 93 (97.9) | ||
| Do you feel extremely guilty after eating? | Usually/Always | 11 | 5.8 | 4 (4.1) | 7 (7.3) | <0.001 |
| Sometimes | 40 | 20.8 | 15 (15.5) | 25 (26.3) | ||
| Never/Rarely | 141 | 73.4 | 78 (80.4) | 63 (66.4) | ||
| Do you wish you were thinner? | Usually/Always | 45 | 23.5 | 15 (15.5) | 30 (31.5) | 0.004 |
| Sometimes | 57 | 29.7 | 24 (24.7) | 33 (34.7) | ||
| Never/Rarely | 90 | 46.8 | 58 (59.8) | 32 (33.8) | ||
| Do you feel pressured by your friends, parents, or coaches to lose weight? | Usually/Always | 9 | 4.7 | 4 (4.1) | 5 (5.2) | 0.134 |
| Sometimes | 24 | 12.5 | 13 (13.4) | 11 (11.5) | ||
| Never/Rarely | 159 | 82.8 | 80 (82.5) | 79 (83.3) | ||
| Practice special diet | Low carbohydrate | 19 | 9.9 | 6 (6.2) | 13 (13.6) | 0.405 |
| Vegetarian | 9 | 4.7 | 6 (6.2) | 3 (3.1) | ||
| High protein | 28 | 14.6 | 13 (13.4) | 15 (15.7) | ||
| No special diet | 136 | 70.8 | 72 (74.2) | 64 (67.6) | ||
| Domain: Injury and Factors That Affect BMD | Responses | All | Sex | p-Value a | ||
|---|---|---|---|---|---|---|
| n | % | Male n (%) | Female n (%) | |||
| Have you ever had a stress fracture? | Yes | 32 | 16.7 | 16 (16.5) | 16 (16.8) | 0.949 |
| No | 160 | 83.3 | 81 (83.5) | 79 (83.2) | ||
| How much activity (hours/day) were you doing at the time of your injury? | 0–1 h per day | 9 | 28.1 | 5 (31.3) | 4 (25.0) | 0.335 |
| 1–2 h per day | 8 | 25.0 | 5 (31.3) | 3 (18.7) | ||
| 2–5 h per day | 9 | 28.1 | 5 (31.3) | 4 (25.0) | ||
| 5 + hours per day | 6 | 18.8 | 1 (6.1) | 5 (31.3) | ||
| How much activity (days/week) were you doing at the time of your injury (stress fracture)? | 0–2 days per week | 4 | 12.5 | 3 (18.7) | 1 (6.1) | 0.642 |
| 2–3 days per week | 5 | 15.6 | 3 (18.7) | 2 (12.5) | ||
| 3–5 days per week | 10 | 31.3 | 4 (25.0) | 6 (37.6) | ||
| 6–7 days per week | 13 | 40.6 | 6 (37.6) | 7 (43.8) | ||
| When you had the fracture, were you getting your period? (female athletes only) | No | 10 | 31.3 | |||
| Do not remember | 6 | 18.8 | ||||
| How often do you drink milk? | Usually/Always | 75 | 39.0 | 41 (42.3) | 34 (35.7) | 0.100 |
| Sometimes | 76 | 39.6 | 36 (37.1) | 40 (42.1) | ||
| Never/Rarely | 41 | 21.4 | 20 (20.6) | 21 (22.2) | ||
| Do you take calcium supplements? | Yes | 71 | 37.0 | 41 (42.3) | 30 (31.5) | 0.125 |
| No | 121 | 63.0 | 56 (57.7) | 65 (68.5) | ||
| Domain: Menstrual function (female athletes only) | ||||||
| How old were you when you first got your period? | <15 years old | 83 | 87.2 | |||
| ≥15 years old | 12 | 12.8 | ||||
| How often do you get your period? | More than once a month | 5 | 5.3 | |||
| Once a month | 84 | 88.3 | ||||
| Once in 1–3 months | 5 | 5.3 | ||||
| Less than every 3 months | 1 | 1.1 | ||||
| Are you prescribed any medication to help with your period or your hormones? | Yes | 4 | 4.2 | |||
| No | 91 | 95.8 | ||||
| Domain: Physiological Effect | Responses | All | Sex | p-Value a | ||
|---|---|---|---|---|---|---|
| n | % | Male n (%) | Female n (%) | |||
| Have you been told you have anemia? | Yes | 14 | 7.3 | 5 (5.2) | 9 (9.4) | 0.511 |
| No | 178 | 92.7 | 92 (94.8) | 86 (90.6) | ||
| Have you noticed a change in your skin color (i.e., have you become paler)? | Yes | 9 | 4.7 | 6 (6.2) | 3 (3.1)) | 0.321 |
| No | 183 | 95.3 | 91 (93.8) | 92 (96.9) | ||
| Have you felt like you were going to faint? | Yes | 33 | 17.2 | 11 (11.3) | 22 (23.1) | 0.030 |
| No | 159 | 82.8 | 86 (88.7) | 73 (76.9) | ||
| Have you been more tired recently? | Yes | 92 | 47.9 | 45 (53.6) | 47 (49.5) | 0.669 |
| No | 100 | 52.1 | 52 (46.4) | 48 (50.5) | ||
| Fever/infection in the last 6 months | Yes | 43 | 22.4 | 24 (24.7) | 19 (20.0) | 0.431 |
| No | 149 | 77.6 | 73 (75.3) | 76 (80.0) | ||
| Do you have a heart condition? | Yes | 2 | 1.0 | 1 (1.0) | 1 (1.0) | 0.988 |
| No | 190 | 99.0 | 96 (99.0) | 94 (99.0) | ||
| Domain: Psychological effect | ||||||
| Feelings that you have felt over the last 6 months | Easily annoyed | 51 | 26.6 | 22 (22.6) | 29 (30.5) | 0.050 |
| Sad all the time | 15 | 7.8 | 7 (7.2) | 8 (8.4) | ||
| Hard to focus | 53 | 27.6 | 29 (29.8) | 24 (25.2) | ||
| Hard to make decision | 51 | 26.6 | 27 (27.8) | 24 (25.2) | ||
| Stressed | 70 | 36.5 | 26 (26.8) | 44 (46.3) | ||
| Nervous | 65 | 33.9 | 31 (31.9) | 34 (35.7) | ||
Disclaimer/Publisher’s Note: The statements, opinions and data contained in all publications are solely those of the individual author(s) and contributor(s) and not of MDPI and/or the editor(s). MDPI and/or the editor(s) disclaim responsibility for any injury to people or property resulting from any ideas, methods, instructions or products referred to in the content. |
© 2023 by the authors. Licensee MDPI, Basel, Switzerland. This article is an open access article distributed under the terms and conditions of the Creative Commons Attribution (CC BY) license (https://creativecommons.org/licenses/by/4.0/).
Share and Cite
Marzuki, M.I.H.; Mohamad, M.I.; Chai, W.J.; Farah, N.M.F.; Safii, N.S.; Jasme, J.K.; Jamil, N.A. Prevalence of Relative Energy Deficiency in Sport (RED-S) among National Athletes in Malaysia. Nutrients 2023, 15, 1697. https://doi.org/10.3390/nu15071697
Marzuki MIH, Mohamad MI, Chai WJ, Farah NMF, Safii NS, Jasme JK, Jamil NA. Prevalence of Relative Energy Deficiency in Sport (RED-S) among National Athletes in Malaysia. Nutrients. 2023; 15(7):1697. https://doi.org/10.3390/nu15071697
Chicago/Turabian StyleMarzuki, Muhammad Irfan Haiqal, Mohd Izham Mohamad, Wen Jin Chai, Nor M. F. Farah, Nik Shanita Safii, Jasmiza Khuzairi Jasme, and Nor Aini Jamil. 2023. "Prevalence of Relative Energy Deficiency in Sport (RED-S) among National Athletes in Malaysia" Nutrients 15, no. 7: 1697. https://doi.org/10.3390/nu15071697
APA StyleMarzuki, M. I. H., Mohamad, M. I., Chai, W. J., Farah, N. M. F., Safii, N. S., Jasme, J. K., & Jamil, N. A. (2023). Prevalence of Relative Energy Deficiency in Sport (RED-S) among National Athletes in Malaysia. Nutrients, 15(7), 1697. https://doi.org/10.3390/nu15071697