


Impact of Regular Intake of Microalgae on Nutrient Supply and Cardiovascular Risk Factors: Results from the NovAL Intervention Study

 , ,
, ,  and
and 
Abstract
1. Introduction
2. Materials and Methods
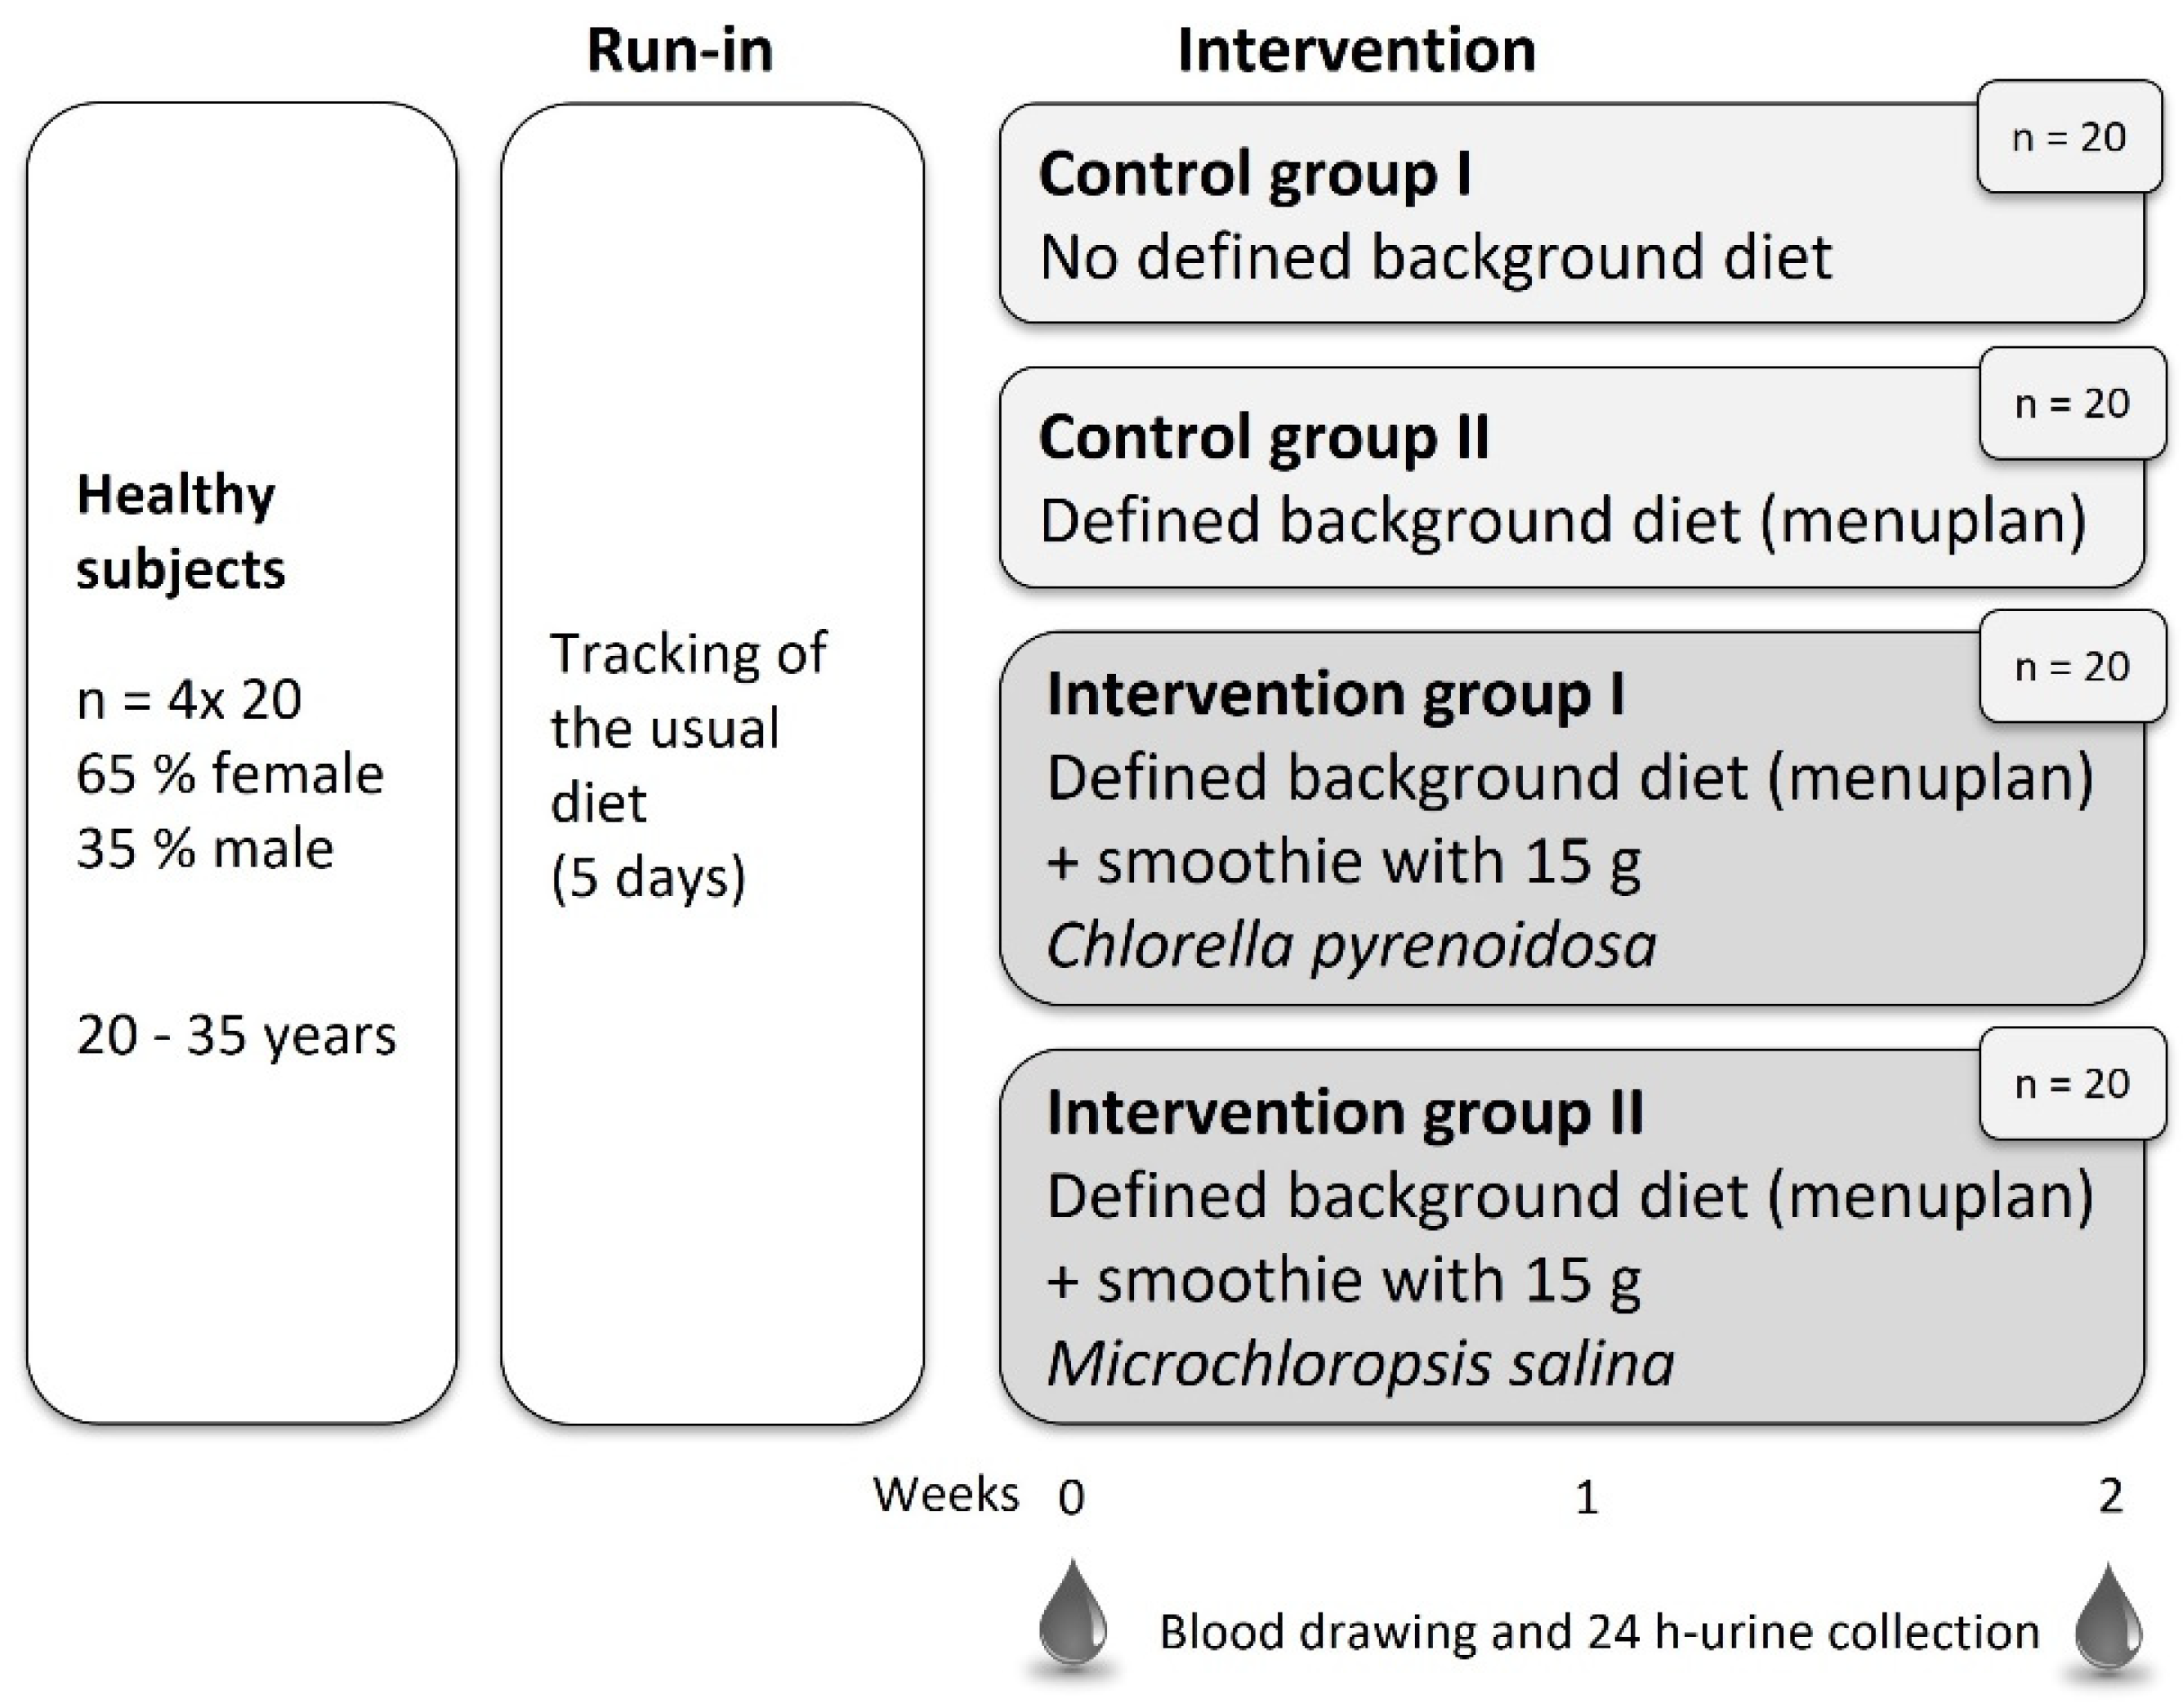
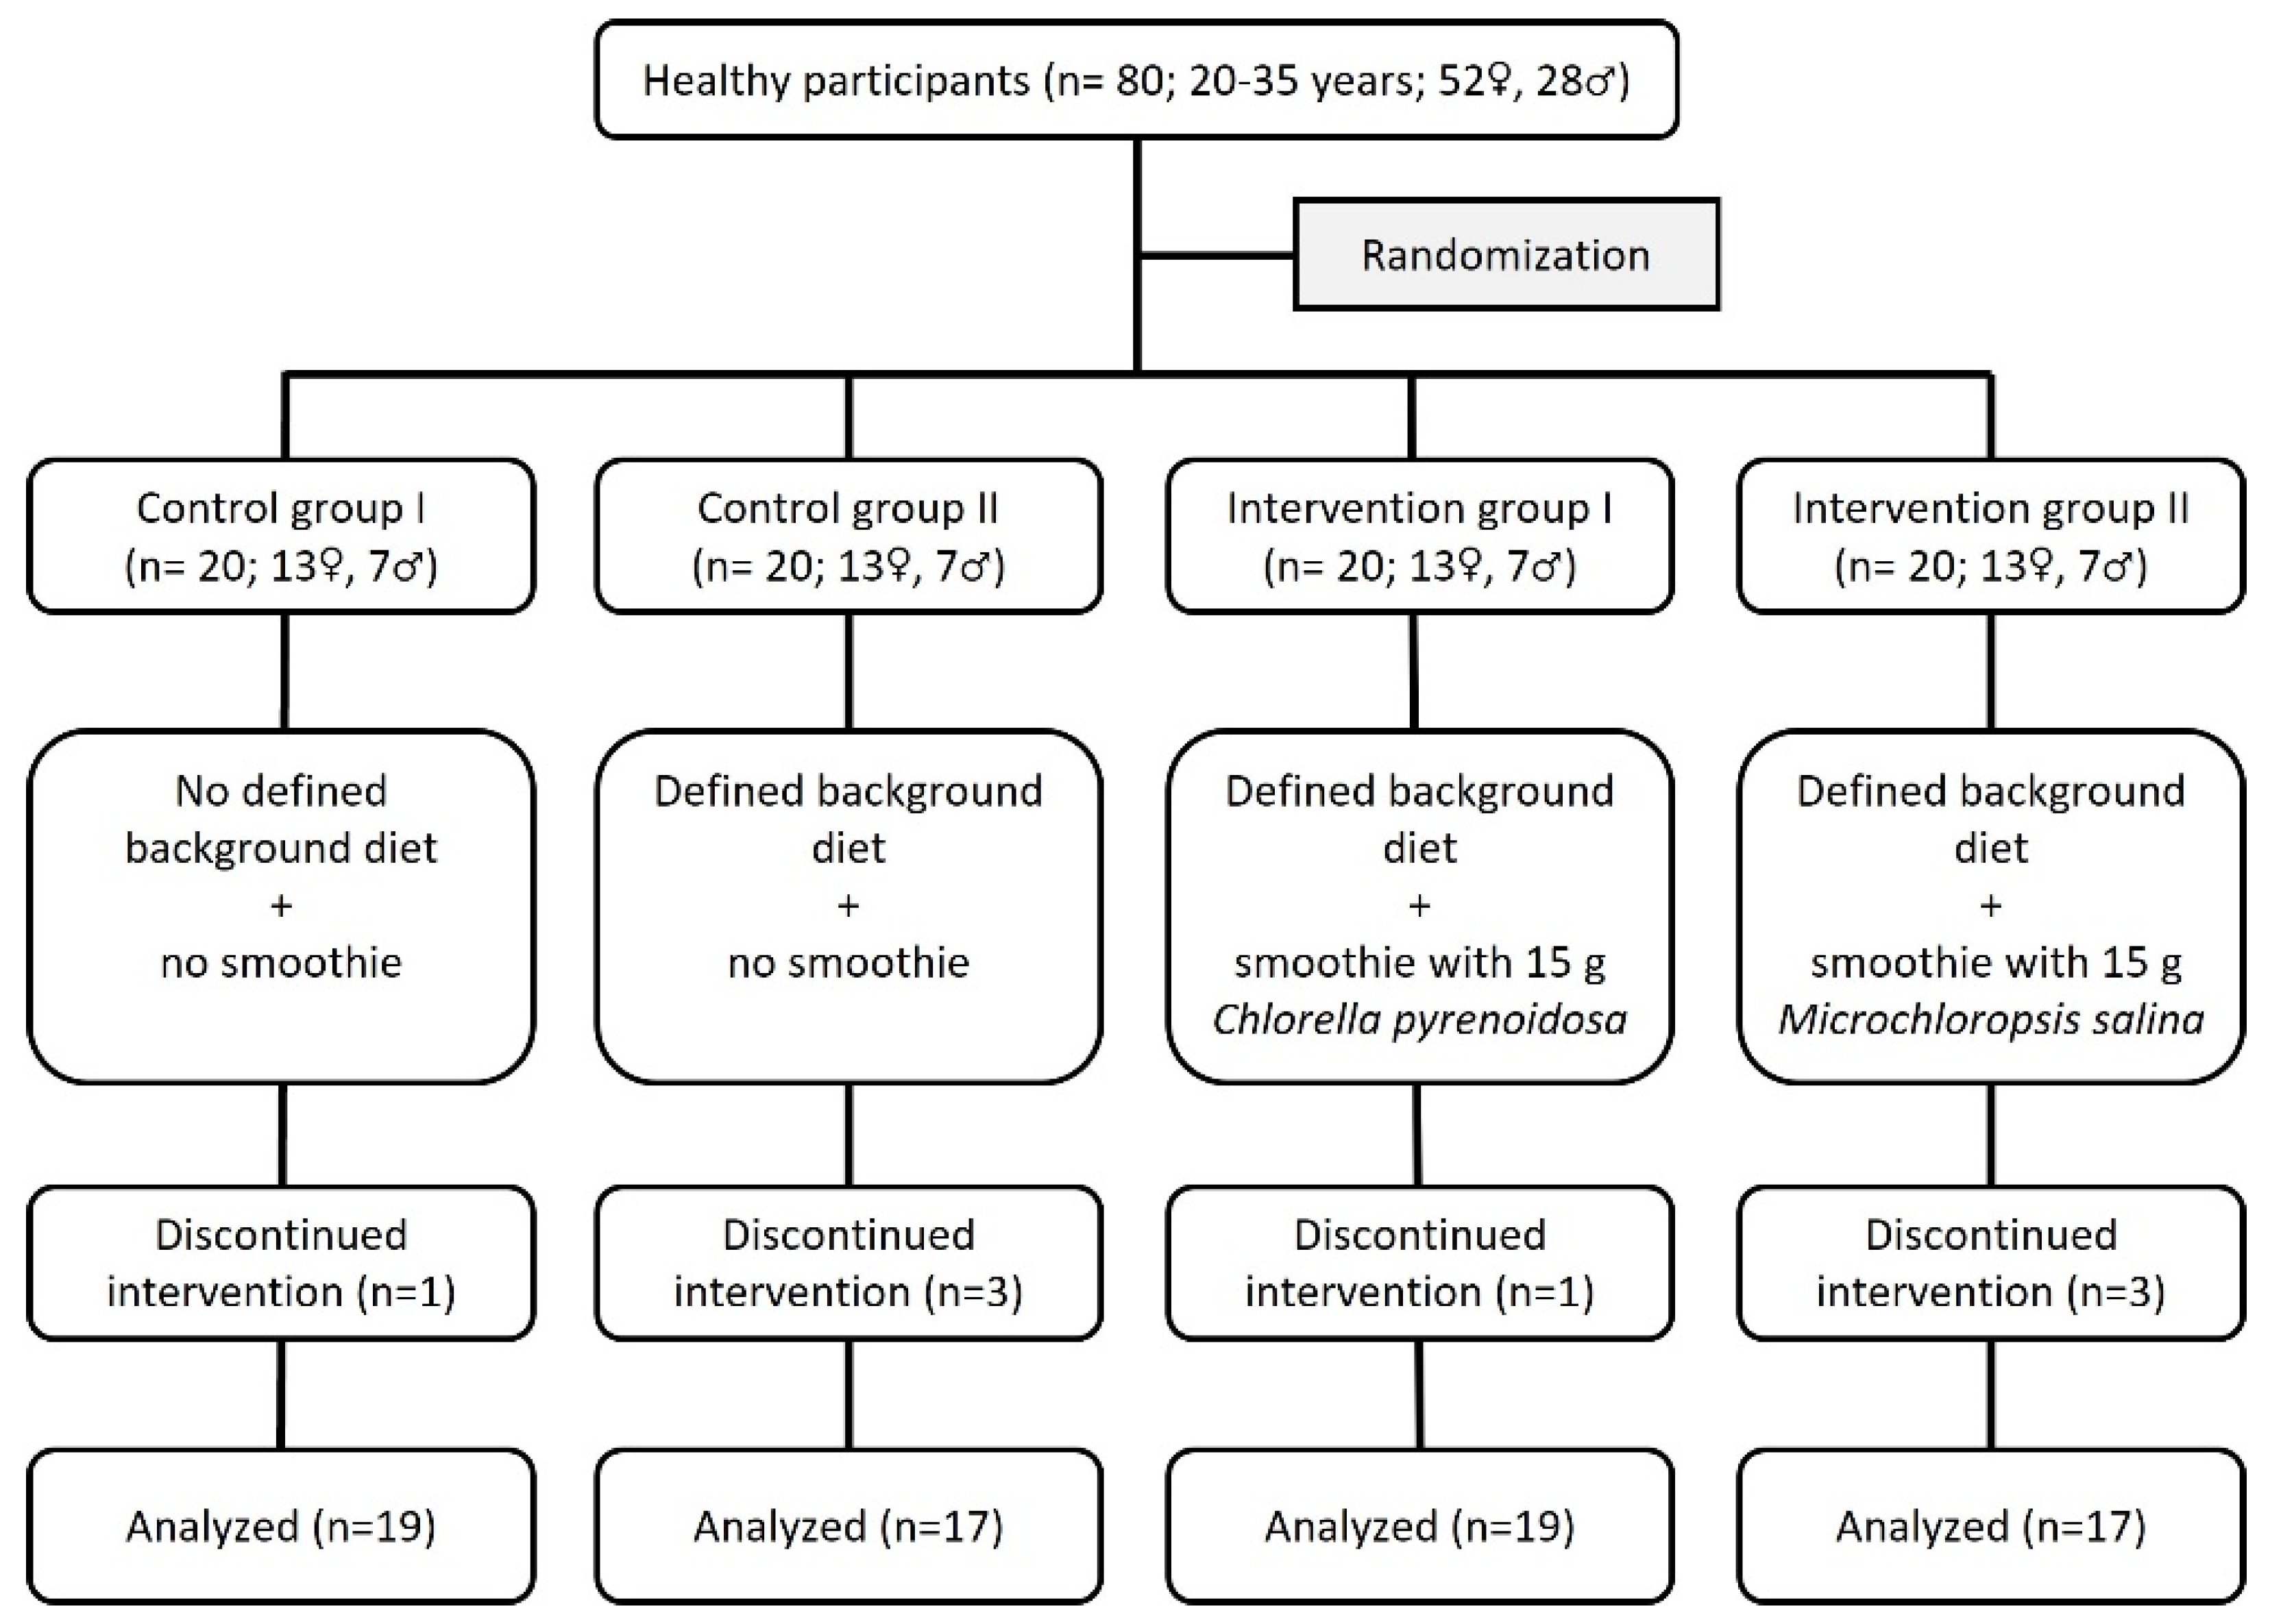
2.1. Subjects
2.2. Study Design
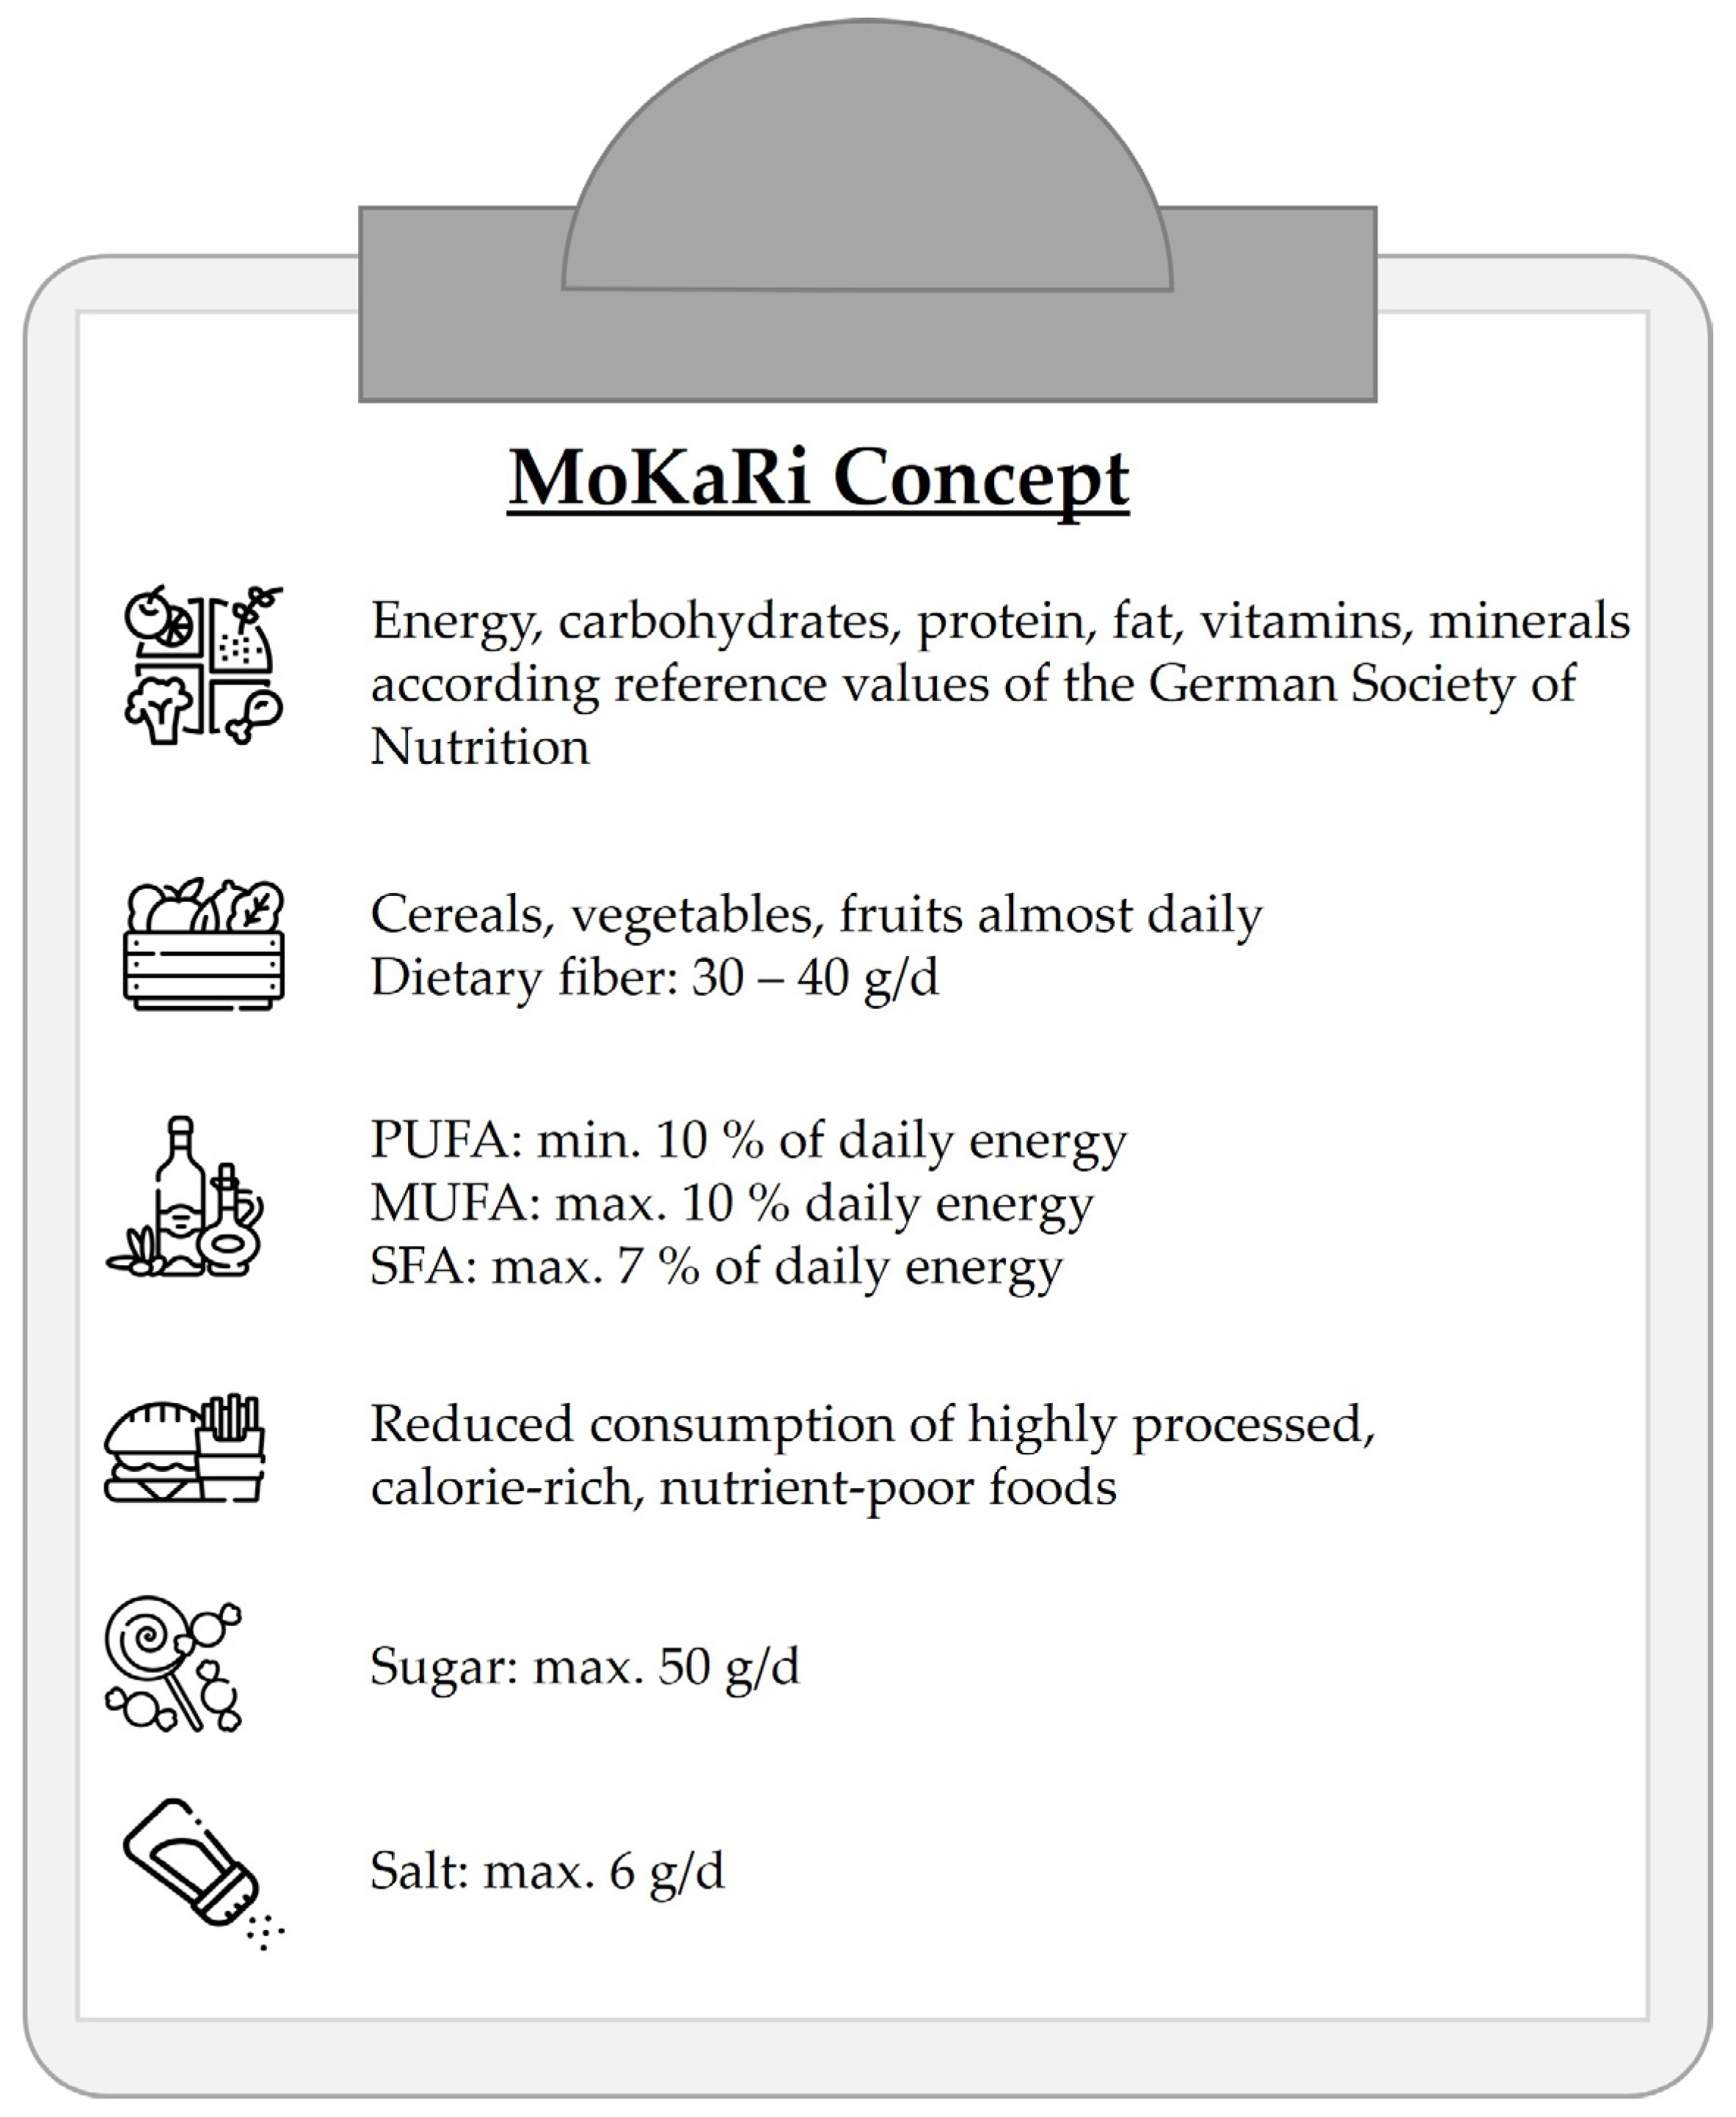
2.3. Diet
2.4. Intervention Food Product
2.5. Blood, Urine and Body Parameters
2.6. Lipid Extraction and Fatty Acid Analysis in Total Plasma Lipids
2.7. Statistical Analysis
3. Results
3.1. Anthropometric Data, Body Composition, Blood Pressure, Energy and Nutrient Intake
3.2. Nutrient Status
3.3. Fatty Acid Profiles in Plasma Lipids
3.4. Liver and Kidney Function
3.5. Clotting
3.6. Blood Count
3.7. Cardiovascular Risk Factors
3.8. Diabetes Risk Factors
4. Discussion
4.1. Bioavailability of Nutrients
4.2. Influence on Human Health
5. Conclusions
Supplementary Materials
Author Contributions
Funding
Institutional Review Board Statement
Informed Consent Statement
Data Availability Statement
Acknowledgments
Conflicts of Interest
References
- Sandgruber, F.; Gielsdorf, A.; Baur, A.C.; Schenz, B.; Muller, S.M.; Schwerdtle, T.; Stangl, G.I.; Griehl, C.; Lorkowski, S.; Dawczynski, C. Variability in macro- and micronutrients of 15 commercially available microalgae powders. Mar. Drugs 2021, 19, 310. [Google Scholar] [CrossRef] [PubMed]
- Chick, H. A study of a unicellular green alga, occurring in polluted water, with especial reference to its nitrogenous metabolism. Proc. R. Soc. Lond. 1902, 71, 458–476. [Google Scholar]
- Lee, Y.-K. Commercial production of microalgae in the asia-pacific rim. J. Appl. Phycol. 1997, 9, 403–411. [Google Scholar] [CrossRef]
- Rani, K.P.; Sandal, N.; Sahoo, P. A comprehensive review on chlorella-its composition, health benefits, market and regulatory scenario. Pharma Innov. J. 2018, 7, 584–589. [Google Scholar]
- Fawley, K.P.; Fawley, M.W. Observations on the diversity and ecology of freshwater nannochloropsis (eustigmatophyceae), with descriptions of new taxa. Protist 2007, 158, 325–336. [Google Scholar] [CrossRef]
- Merchant, R.E.; Phillips, T.W.; Udani, J. Nutritional supplementation with chlorella pyrenoidosa lowers serum methylmalonic acid in vegans and vegetarians with a suspected vitamin b12 deficiency. J. Med. Food 2015, 18, 1357–1362. [Google Scholar] [CrossRef]
- Watanabe, F.; Takenaka, S.; Kittaka-Katsura, H.; Ebara, S.; Miyamoto, E. Characterization and bioavailability of vitamin b12-compounds from edible algae. J. Nutr. Sci. Vitam. 2002, 48, 325–331. [Google Scholar] [CrossRef]
- Coelho, D.; Lopes, P.A.; Cardoso, V.; Ponte, P.; Bras, J.; Madeira, M.S.; Alfaia, C.M.; Bandarra, N.M.; Fontes, C.M.G.A.; Prates, J.A.M. A two-enzyme constituted mixture to improve the degradation of arthrospira platensis microalga cell wall for monogastric diets. J. Anim. Physiol. Nutr. 2020, 104, 310–321. [Google Scholar] [CrossRef]
- Cha, K.H.; Koo, S.Y.; Song, D.G.; Pan, C.H. Effect of microfluidization on bioaccessibility of carotenoids from chlorella ellipsoidea during simulated digestion. J. Agric. Food Chem. 2012, 60, 9437–9442. [Google Scholar] [CrossRef]
- Fuller, C.J.; Butterfoss, D.N.; Failla, M.L. Relative bioavailability of β-carotene from supplement sources. Nutr. Res. 2001, 21, 1209–1215. [Google Scholar] [CrossRef]
- Ross, R. Atherosclerosis—An inflammatory disease. N. Engl. J. Med. 1999, 340, 115–126. [Google Scholar] [CrossRef] [PubMed]
- Rader, D.J. Effect of insulin resistance, dyslipidemia, and intra-abdominal adiposity on the development of cardiovascular disease and diabetes mellitus. Am. J. Med. 2007, 120, S12–S18. [Google Scholar] [CrossRef] [PubMed]
- Liu, R.H. Health benefits of fruit and vegetables are from additive and synergistic combinations of phytochemicals. Am. J. Clin. Nutr. 2003, 78, 517S–520S. [Google Scholar] [CrossRef]
- Pedro-Botet, J.; Pintó, X. Ldl-cholesterol: The lower the better. Clin. E Investig. Arterioscler. 2019, 31 (Suppl. 2), 16–27. [Google Scholar]
- Jain, A.P.; Aggarwal, K.K.; Zhang, P.Y. Omega-3 fatty acids and cardiovascular disease. Eur. Rev. Med. Pharmacol. Sci. 2015, 19, 441–445. [Google Scholar] [PubMed]
- Robinson, J.G.; Stone, N.J. Antiatherosclerotic and antithrombotic effects of omega-3 fatty acids. Am. J. Cardiol. 2006, 98, 39–49. [Google Scholar] [CrossRef]
- Gagnon, C.; Lu, Z.X.; Magliano, D.J.; Dunstan, D.W.; Shaw, J.E.; Zimmet, P.Z.; Sikaris, K.; Ebeling, P.R.; Daly, R.M. Low serum 25-hydroxyvitamin d is associated with increased risk of the development of the metabolic syndrome at five years: Results from a national, population-based prospective study (the australian diabetes, obesity and lifestyle study: Ausdiab). J. Clin. Endocrinol. Metab. 2012, 97, 1953–1961. [Google Scholar] [CrossRef] [PubMed]
- Ferrario, C.M.; Strawn, W.B. Role of the renin-angiotensin-aldosterone system and proinflammatory mediators in cardiovascular disease. Am. J. Cardiol. 2006, 98, 121–128. [Google Scholar] [CrossRef]
- Pereira, M.A.; O’Reilly, E.; Augustsson, K.; Fraser, G.E.; Goldbourt, U.; Heitmann, B.L.; Hallmans, G.; Knekt, P.; Liu, S.; Pietinen, P. Dietary fiber and risk of coronary heart disease: A pooled analysis of cohort studies. Arch. Intern. Med. 2004, 164, 370–376. [Google Scholar] [CrossRef]
- de Jesus Raposo, M.F.; de Morais, A.M.M.B.; de Morais, R.M.S.C. Emergent sources of prebiotics: Seaweeds and microalgae. Mar. Drugs 2016, 14, 27. [Google Scholar] [CrossRef]
- Dawczynski, C.; Schubert, R.; Hein, G.; Müller, A.; Eidner, T.; Vogelsang, H.; Basu, S.; Jahreis, G. Long-term moderate intervention with n-3 long-chain pufa-supplemented dairy products: Effects on pathophysiological biomarkers in patients with rheumatoid arthritis. Br. J. Nutr. 2009, 101, 1517–1526. [Google Scholar] [CrossRef] [PubMed]
- Dawczynski, C.; Cullen, P.M.; Schlattmann, P.; Lorkowski, S. A study protocol of a randomized trial evaluating the effect of using defined menu plans within an intensive personal nutritional counseling program on cardiovascular risk factors: The mokari (modulation of cardiovascular risk factors) trial. Contemp. Clin. Trials Commun. 2021, 22, 100761. [Google Scholar] [CrossRef] [PubMed]
- Dittrich, M.; Jahreis, G.; Bothor, K.; Drechsel, C.; Kiehntopf, M.; Blüher, M.; Dawczynski, C. Benefits of foods supplemented with vegetable oils rich in α-linolenic, stearidonic or docosahexaenoic acid in hypertriglyceridemic subjects: A double-blind, randomized, controlled trail. Eur. J. Nutr. 2015, 54, 881–893. [Google Scholar] [CrossRef]
- Folch, J.; Lees, M.; Sloane Stanley, G.H. A simple method for the isolation and purification of total lipids from animal tissues. J. Biol. Chem. 1957, 226, 497–509. [Google Scholar] [CrossRef]
- Bligh, E.G.; Dyer, W.J. A rapid method of total lipid extraction and purification. Can. J. Biochem. Physiol. 1959, 37, 911–917. [Google Scholar] [CrossRef]
- Degen, C.; Ecker, J.; Piegholdt, S.; Liebisch, G.; Schmitz, G.; Jahreis, G. Metabolic and growth inhibitory effects of conjugated fatty acids in the cell line ht-29 with special regard to the conversion of t11,t13-cla. Biochim. Biophys. Acta 2011, 1811, 1070–1080. [Google Scholar] [CrossRef] [PubMed]
- Kay, R.A.; Barton, L.L. Microalgae as food and supplement. Crit. Rev. Food Sci. Nutr. 1991, 30, 555–573. [Google Scholar] [CrossRef]
- Raposo, M.F.d.J.; de Morais, A.M.M.B. Microalgae for the prevention of cardiovascular disease and stroke. Life Sci. 2015, 125, 32–41. [Google Scholar] [CrossRef]
- Statistisches Bundesamt (Destatis). Ergebnisse der Todesursachenstatistik für Deutschland 2020 (Ausführliche 4-Stellige Icd-klassifikation); Statistisches Bundesamt (Destatis): Wiesbaden, Germany, 2021. [Google Scholar]
- Ravera, A.; Carubelli, V.; Sciatti, E.; Bonadei, I.; Gorga, E.; Cani, D.; Vizzardi, E.; Metra, M.; Lombardi, C. Nutrition and cardiovascular disease: Finding the perfect recipe for cardiovascular health. Nutrients 2016, 8, 363. [Google Scholar] [CrossRef]
- Gómez-Jacinto, V.; Navarro-Roldán, F.; Garbayo-Nores, I.; Vílchez-Lobato, C.; Borrego, A.A.; García-Barrera, T. In vitro selenium bioaccessibility combined with in vivo bioavailability and bioactivity in se-enriched microalga (chlorella sorokiniana) to be used as functional food. J. Funct. Foods 2020, 66, 103817. [Google Scholar] [CrossRef]
- Nasirian, F.; Dadkhah, M.; Moradi-Kor, N.; Obeidavi, Z. Effects of spirulina platensis microalgae on antioxidant and anti-inflammatory factors in diabetic rats. Diabetes Metab. Syndr. Obes. Targets Ther. 2018, 11, 375–380. [Google Scholar] [CrossRef]
- Gao, F.; Guo, W.; Zeng, M.; Feng, Y.; Feng, G. Effect of microalgae as iron supplements on iron-deficiency anemia in rats. Food Funct. 2019, 10, 723–732. [Google Scholar] [CrossRef]
- Bhatnagar, R.S.; Miller, D.D.; Padilla-Zakour, O.I.; Lei, X.G. Supplemental microalgal iron helps replete blood hemoglobin in moderately anemic mice fed a rice-based diet. Nutrients 2020, 12, 2239. [Google Scholar] [CrossRef]
- Manor, M.L.; Kim, J.; Derksen, T.J.; Schwartz, R.L.; Roneker, C.A.; Bhatnagar, R.S.; Lei, X.G. Defatted microalgae serve as a dual dietary source of highly bioavailable iron and protein in an anemic pig model. Algal Res. 2017, 26, 409–414. [Google Scholar] [CrossRef]
- Bhatia, P.; Aureli, F.; D’Amato, M.; Prakash, R.; Cameotra, S.S.; Nagaraja, T.P.; Cubadda, F. Selenium bioaccessibility and speciation in biofortified pleurotus mushrooms grown on selenium-rich agricultural residues. Food Chem. 2013, 140, 225–230. [Google Scholar] [CrossRef] [PubMed]
- Knudsen, E.; Sandström, B.; Solgaard, P. Zinc, copper and magnesium absorption from a fibre-rich diet. J. Trace Elem. Med. Biol. 1996, 10, 68–76. [Google Scholar] [CrossRef] [PubMed]
- Brune, M.; Rossander-Hultén, L.; Hallberg, L.; Gleerup, A.; Sandberg, A.-S. Iron absorption from bread in humans: Inhibiting effects of cereal fiber, phytate and inositol phosphates with different numbers of phosphate groups. J. Nutr. 1992, 122, 442–449. [Google Scholar] [CrossRef]
- Lesjak, M.; Srai, S.K.S. Role of dietary flavonoids in iron homeostasis. Pharmaceuticals 2019, 12, 119. [Google Scholar] [CrossRef]
- Kotrbáček, V.; Doubek, J.; Doucha, J. The chlorococcalean alga chlorella in animal nutrition: A review. J. Appl. Phycol. 2015, 27, 2173–2180. [Google Scholar] [CrossRef]
- Díaz-Castro, J.; Ojeda, M.L.; Alférez, M.J.; López-Aliaga, I.; Nestares, T.; Campos, M.S. Se bioavailability and glutathione peroxidase activity in iron deficient rats. J. Trace Elem. Med. Biol. Organ Soc. Miner. Trace Elem. (GMS) 2011, 25, 42–46. [Google Scholar] [CrossRef]
- House, W.A.; Welch, R.M. Bioavailability of and interactions between zinc and selenium in rats fed wheat grain intrinsically labeled with 65zn and 75se. J. Nutr. 1989, 119, 916–921. [Google Scholar] [CrossRef] [PubMed]
- Renz, P. Biosynthesis of the 5, 6-dimethylbenzimidazole moiety of cobalamin and of the other bases found in natural corrinoids. In Chemistry and Biochemistry of B12; John Wiley and Sons: New York, NY, USA, 1999; pp. 557–575. [Google Scholar]
- Tanioka, Y.; Miyamoto, E.; Yabuta, Y.; Ohnishi, K.; Fujita, T.; Yamaji, R.; Misono, H.; Shigeoka, S.; Nakano, Y.; Inui, H. Methyladeninylcobamide functions as the cofactor of methionine synthase in a cyanobacterium, spirulina platensis nies-39. FEBS Lett. 2010, 584, 3223–3226. [Google Scholar] [CrossRef] [PubMed]
- Helliwell, K.E.; Lawrence, A.D.; Holzer, A.; Kudahl, U.J.; Sasso, S.; Kräutler, B.; Scanlan, D.J.; Warren, M.J.; Smith, A.G. Cyanobacteria and eukaryotic algae use different chemical variants of vitamin b12. Curr. Biol. 2016, 26, 999–1008. [Google Scholar] [CrossRef] [PubMed]
- van den Oever, S.P.; Mayer, H.K. Biologically active or just “pseudo”-vitamin b12 as predominant form in algae-based nutritional supplements? J. Food Compos. Anal. 2022, 109, 104464. [Google Scholar] [CrossRef]
- Bikle, D.D. Vitamin d metabolism, mechanism of action, and clinical applications. Chem. Biol. 2014, 21, 319–329. [Google Scholar] [CrossRef]
- Tian, Y.-T.; Wang, X.; Cui, Y.-H.; Wang, S.-K. A symbiotic yeast to enhance heterotrophic and mixotrophic cultivation of chlorella pyrenoidosa using sucrose as the carbon source. Bioprocess Biosyst. Eng. 2020, 43, 2243–2252. [Google Scholar] [CrossRef]
- Ljubic, A.; Jacobsen, C.; Holdt, S.L.; Jakobsen, J. Microalgae nannochloropsis oceanica as a future new natural source of vitamin d3. Food Chem. 2020, 320, 126627. [Google Scholar] [CrossRef]
- Cardwell, G.; Bornman, J.F.; James, A.P.; Black, L.J. A review of mushrooms as a potential source of dietary vitamin d. Nutrients 2018, 10, 1498. [Google Scholar] [CrossRef]
- Bailer, A.; Philipp, S.; Staudt, S.; Weidauer, T.; Kiehntopf, M.; Lorkowski, S.; Stangl, G.; Dawczynski, C. Uvb-exposed wheat germ oil increases serum 25-hydroxyvitamin d2 without improving overall vitamin d status: A randomized controlled trial. Eur. J. Nutr. 2022, 61, 2571–2583. [Google Scholar] [CrossRef]
- Eckel, R.H.; Jakicic, J.M.; Ard, J.D.; de Jesus, J.M.; Houston Miller, N.; Hubbard, V.S.; Lee, I.M.; Lichtenstein, A.H.; Loria, C.M.; Millen, B.E.; et al. 2013 aha/acc guideline on lifestyle management to reduce cardiovascular risk: A report of the american college of cardiology/american heart association task force on practice guidelines. Circulation 2014, 129, S76–S99. [Google Scholar] [CrossRef]
- Lewington, S.; Whitlock, G.; Clarke, R.; Sherliker, P.; Emberson, J.; Halsey, J.; Qizilbash, N.; Peto, R.; Collins, R. Blood cholesterol and vascular mortality by age, sex, and blood pressure: A meta-analysis of individual data from 61 prospective studies with 55,000 vascular deaths. Lancet 2007, 370, 1829–1839. [Google Scholar] [PubMed]
- Kalinski, P. Regulation of immune responses by prostaglandin e2. J. Immunol. 2012, 188, 21–28. [Google Scholar] [CrossRef]
- Calder, P.C. Marine omega-3 fatty acids and inflammatory processes: Effects, mechanisms and clinical relevance. Biochim. Biophys. Acta (BBA)-Mol. Cell Biol. Lipids 2015, 1851, 469–484. [Google Scholar]
- Hoen, W.P.; Lijmer, J.G.; Duran, M.; Wanders, R.J.A.; van Beveren, N.J.M.; de Haan, L. Red blood cell polyunsaturated fatty acids measured in red blood cells and schizophrenia: A meta-analysis. Psychiatry Res. 2013, 207, 1–12. [Google Scholar] [CrossRef] [PubMed]
- Byelashov, O.A.; Sinclair, A.J.; Kaur, G. Dietary sources, current intakes, and nutritional role of omega-3 docosapentaenoic acid. Lipid Technol. 2015, 27, 79–82. [Google Scholar] [CrossRef]
- Harris, W.S.; Tintle, N.L.; Imamura, F.; Qian, F.; Korat, A.V.A.; Marklund, M.; Djoussé, L.; Bassett, J.K.; Carmichael, P.-H.; Chen, Y.-Y.; et al. Blood n-3 fatty acid levels and total and cause-specific mortality from 17 prospective studies. Nat. Commun. 2021, 12, 2329. [Google Scholar] [CrossRef]
- Krul, E.S.; Lemke, S.L.; Mukherjea, R.; Taylor, M.L.; Goldstein, D.A.; Su, H.; Liu, P.; Lawless, A.; Harris, W.S.; Maki, K.C. Effects of duration of treatment and dosage of eicosapentaenoic acid and stearidonic acid on red blood cell eicosapentaenoic acid content. Prostaglandins Leukot Essent Fat. Acids 2012, 86, 51–59. [Google Scholar] [CrossRef]
- von Schacky, C.; Weber, P.C. Metabolism and effects on platelet function of the purified eicosapentaenoic and docosahexaenoic acids in humans. J. Clin. Investig. 1985, 76, 2446–2450. [Google Scholar] [CrossRef]
- Buettner, G.R. The pecking order of free radicals and antioxidants: Lipid peroxidation, α-tocopherol, and ascorbate. Arch. Biochem. Biophys. 1993, 300, 535–543. [Google Scholar] [CrossRef]
- Hagel, A.F.; Albrecht, H.; Dauth, W.; Hagel, W.; Vitali, F.; Ganzleben, I.; Schultis, H.W.; Konturek, P.C.; Stein, J.; Neurath, M.F.; et al. Plasma concentrations of ascorbic acid in a cross section of the german population. J. Int. Med. Res. 2018, 46, 168–174. [Google Scholar] [CrossRef]
- Singab, A.N.; Ibrahim, N.; Elsayed, A.E.-k.; El-Senousy, W.; Aly, H.; Abd Elsamiae, A.; Matloub, A.A. Antiviral, cytotoxic, antioxidant and anti-cholinesterase activities of polysaccharides isolated from microalgae spirulina platensis, scenedesmus obliquus and dunaliella salina. Arch. Pharm. Sci. Ain Shams Univ. 2018, 2, 121–137. [Google Scholar] [CrossRef]
- El-Baz, F.K.; Aly, H.F.; Ali, G.H. Neuromodulating effect of dunaliella salina extract in the regression of alzheimer s disease in rats. Int. J. Pharma Bio Sci. 2016, 414, 5357–5371. [Google Scholar]
- Group, U.P.D.S. Intensive blood-glucose control with sulphonylureas or insulin compared with conventional treatment and risk of complications in patients with type 2 diabetes (ukpds 33). Lancet 1998, 352, 837–853. [Google Scholar]
- Khaw, K.-T. Elevated hba 1c level: A risk factor for cardiovascular disease mortality in patients with chronic heart failure? Nat. Rev. Endocrinol. 2009, 5, 130–131. [Google Scholar] [CrossRef]
- Fallah, A.A.; Sarmast, E.; Habibian Dehkordi, S.; Engardeh, J.; Mahmoodnia, L.; Khaledifar, A.; Jafari, T. Effect of chlorella supplementation on cardiovascular risk factors: A meta-analysis of randomized controlled trials. Clin. Nutr. 2018, 37, 1892–1901. [Google Scholar] [CrossRef] [PubMed]
- Hosseini, A.M.; Keshavarz, S.A.; Nasli-Esfahani, E.; Amiri, F.; Janani, L. The effects of chlorella supplementation on glycemic control, lipid profile and anthropometric measures on patients with type 2 diabetes mellitus. Eur. J. Nutr. 2021, 60, 3131–3141. [Google Scholar] [CrossRef] [PubMed]
- Ruiz-Núñez, B.; Kuipers, R.S.; Luxwolda, M.F.; De Graaf, D.J.; Breeuwsma, B.B.; Dijck-Brouwer, D.A.; Muskiet, F.A. Saturated fatty acid (sfa) status and sfa intake exhibit different relations with serum total cholesterol and lipoprotein cholesterol: A mechanistic explanation centered around lifestyle-induced low-grade inflammation. J. Nutr. Biochem. 2014, 25, 304–312. [Google Scholar] [CrossRef]
- Gibson, G.R.; Probert, H.M.; Loo, J.V.; Rastall, R.A.; Roberfroid, M.B. Dietary modulation of the human colonic microbiota: Updating the concept of prebiotics. Nutr. Res. Rev. 2004, 17, 259–275. [Google Scholar] [CrossRef]
- Threapleton, D.E.; Greenwood, D.C.; Evans, C.E.; Cleghorn, C.L.; Nykjaer, C.; Woodhead, C.; Cade, J.E.; Gale, C.P.; Burley, V.J. Dietary fibre intake and risk of cardiovascular disease: Systematic review and meta-analysis. BMJ (Clin. Res. Ed.) 2013, 347, f6879. [Google Scholar] [CrossRef]
- Kim, S.; Kim, J.; Lim, Y.; Kim, Y.J.; Kim, J.Y.; Kwon, O. A dietary cholesterol challenge study to assess chlorella supplementation in maintaining healthy lipid levels in adults: A double-blinded, randomized, placebo-controlled study. Nutr. J. 2016, 15, 54. [Google Scholar] [CrossRef]
- Plat, J.; Mensink, R.P. Plant stanol and sterol esters in the control of blood cholesterol levels: Mechanism and safety aspects. Am. J. Cardiol. 2005, 96, 15–22. [Google Scholar] [CrossRef]
- Saito, Y.; Tanaka, A.; Node, K.; Kobayashi, Y. Uric acid and cardiovascular disease: A clinical review. J. Cardiol. 2021, 78, 51–57. [Google Scholar] [CrossRef] [PubMed]
- Choi, H.K.; Atkinson, K.; Karlson, E.W.; Willett, W.; Curhan, G. Purine-rich foods, dairy and protein intake, and the risk of gout in men. N. Engl. J. Med. 2004, 350, 1093–1103. [Google Scholar] [CrossRef] [PubMed]
- El Ridi, R.; Tallima, H. Physiological functions and pathogenic potential of uric acid: A review. J. Adv. Res. 2017, 8, 487–493. [Google Scholar] [CrossRef]
- Fathallah-Shaykh, S.A.; Cramer, M.T. Uric acid and the kidney. Pediatr. Nephrol. 2014, 29, 999–1008. [Google Scholar] [CrossRef] [PubMed]
- Choi, H.K.; Liu, S.; Curhan, G. Intake of purine-rich foods, protein, and dairy products and relationship to serum levels of uric acid: The third national health and nutrition examination survey. Arthritis Rheum 2005, 52, 283–289. [Google Scholar] [CrossRef] [PubMed]
- Corrêa Leite, M.L. Fibrinogen, hematocrit, platelets in mild kidney dysfunction and the role of uric acid: An italian male population study. Clin. Appl. Thromb. Hemost. 2009, 17, 58–65. [Google Scholar] [CrossRef] [PubMed]
- Herrick, S.; Blanc-Brude, O.; Gray, A.; Laurent, G. Fibrinogen. Int. J. Biochem. Cell Biol. 1999, 31, 741–746. [Google Scholar] [CrossRef]
- Janczyk, P. Evaluation of Nutritional Value and Activity of Green Microalgae Chlorella Vulgaris in Rats and Mice. Ph.D. Thesis, Freie Universität, Berlin, Germany, 2006. [Google Scholar]
- Waslien, C.I.; Calloway, D.H.; Margen, S.; Costa, F. Uric acid levels in men fed algae and yeast as protein sources. J. Food Sci. 1970, 35, 294–298. [Google Scholar] [CrossRef]
- Spiga, R.; Marini, M.A.; Mancuso, E.; Fatta, C.D.; Fuoco, A.; Perticone, F.; Andreozzi, F.; Mannino, G.C.; Sesti, G. Uric acid is associated with inflammatory biomarkers and induces inflammation via activating the NF-κB signaling pathway in hepg2 cells. Arterioscler. Thromb. Vasc. Biol. 2017, 37, 1241–1249. [Google Scholar] [CrossRef]


| Parameter | Chlorella pyrenoidosa Smoothie (IG1) | Microchloropsis salina Smoothie (IG2) |
|---|---|---|
| Macronutrients | ||
| Fiber (g) | 10.4 | 8.56 |
| Fat (g) | 3.69 | 4.77 |
| Protein (g) | 9.53 | 7.18 |
| Carbohydrates (g) | 26.6 | 29.4 |
| Vitamins | ||
| Vitamin B12 (µg) | <0.3 | <0.3 |
| Vitamin D2 (ng) | 63,090 | <1.05 |
| Vitamin D3 (ng) | 186 | <0.15 |
| α-Tocopherol (mg) | 1.86 | 7.01 |
| β-Tocopherol (mg) | n.d. | n.d. |
| γ-Tocopherol (mg) | <0.01 | 0.14 |
| δ-Tocopherol (mg) | <12 | <12 |
| Minerals and trace elements | ||
| Calcium (mg) | 142 | 465 |
| Magnesium (mg) | 101 | 140 |
| Iron (mg) | 15.9 | 14.1 |
| Iodine (µg) | 33.8 | 6.62 |
| Copper (µg) | 232 | 495 |
| Manganese (mg) | 1.34 | 1.89 |
| Nickel (µg) | 5.10 | 180 |
| Selenium (µg) | 1.65 | 0.71 |
| Zinc (µg) | 660 | 900 |
| Purine | ||
| Adenine (mg) | 26.5 | 65.0 |
| Caffeine (mg) | <1 | <1 |
| Guanine (mg) | 38.5 | 81.0 |
| Uric acid (mg) | 0.3 | 0.7 |
| Hypoxanthine (mg) | 7.9 | 0.8 |
| Theobromine (mg) | <1 | <1 |
| 6-Thioguanidine (mg) | <1 | <1 |
| Xanthine (mg) | 2.5 | 0.5 |
| Sum purine nitrogen (mg) | 35.5 | 72.0 |
| FAME | Chlorella pyrenoidosa Smoothie (IG1) | Microchloropsis salina Smoothie (IG2) |
|---|---|---|
| SFA | ||
| C10:0 | 0.27 | 1.52 |
| C12:0 | 0.60 | 13.31 |
| C14:0 | 4.36 | 125.33 |
| C15:0 | 1.24 | 6.72 |
| C16:0 | 275.62 | 515.27 |
| C17:0 | 3.26 | 7.64 |
| C18:0 | 132.88 | 13.98 |
| C20:0 | 4.28 | 1.85 |
| C22:0 | 2.41 | 1.52 |
| C24:0 | 5.93 | 0.56 |
| MUFA | ||
| C14:1n6 | <0.1 | 2.16 |
| C16:1n7 | 35.92 | 540.45 |
| C17:1n7 | 1.48 | <0.1 |
| C18:1n9 | 717.32 | 290.00 |
| C18:1n7 | 34.30 | 34.37 |
| C20:1n9 | 2.24 | 0.91 |
| C20:1n12 | 0.03 | 0.03 |
| n6 PUFA | ||
| C16:2n6 | 0.22 | 3.90 |
| C18:2n6 | 390.23 | 89.47 |
| C18:3n6 | <0.1 | 7.83 |
| C20:2n6 | 0.88 | 0.45 |
| C20:3n6 | <0.1 | 10.80 |
| C20:4n6 | <0.1 | 99.30 |
| C22:4n6 | <0.1 | <0.1 |
| C22:5n6 | 0.24 | <0.1 |
| n3 PUFA | ||
| C18:3n3 | 35.32 | 29.98 |
| C20:4n3 | <0.1 | 1.45 |
| C20:5n3 | 0.53 | 714.25 |
| C22:5n3 | <0.1 | <0.1 |
| C22:6n3 | <0.1 | <0.1 |
| Sum | ||
| SFA | 430.85 | 687.70 |
| MUFA | 791.39 | 868.02 |
| PUFA | 428.12 | 957.83 |
| n6-PUFA | 391.97 | 211.95 |
| n3-PUFA | 36.15 | 745.88 |
| n6/n3 | 10.84 | 0.28 |
| Control Group I | Control Group II | Intervention Group I | Intervention Group II | ||||||||||||||||||
|---|---|---|---|---|---|---|---|---|---|---|---|---|---|---|---|---|---|---|---|---|---|
| Weeks | n | Md | / | IQR | p | n | Md | / | IQR | p | n | Md | / | IQR | p | n | Md | / | IQR | p | |
| Vitamins in blood | |||||||||||||||||||||
| Vitamin A | 0 | 11 | 1.60 | / | 0.84 | a | 11 | 1.64 | / | 0.33 | a | 14 | 1.55 | / | 0.44 | a | 13 | 1.70 | / | 0.50 | a |
| (µmol/L) | 2 | 11 | 1.75 | / | 0.51 | a | 11 | 1.98 | / | 0.80 | a | 14 | 1.47 | / | 0.40 | a | 13 | 1.41 | / | 0.60 | a |
| Δ | 11 | −0.10 | / | 0.30 | a | 11 | 0.07 | / | 0.73 | a | 14 | −0.17 | / | 0.34 | a | 13 | −0.05 | / | 0.31 | a | |
| Vitamin B1 | 0 | 17 | 134 | / | 28 | a | 16 | 114 | / | 31 | a | 19 | 122 | / | 34 | a | 17 | 114 | / | 28 | a |
| (nmol/L) | 2 | 17 | 122 | / | 14 | a | 16 | 131 | / | 31 | a | 19 | 134 | / | 33 | a | 17 | 128 | / | 8 | a |
| Δ | 17 | −17 | / | 128 | a | 16 | 2.9 | / | 41.3 | a | 19 | −2 | / | 65 | a | 17 | 1 | / | 44 | a | |
| Vitamin B2 | 0 | 19 | 211 | / | 33 | a | 17 | 209 | / | 45 | a | 19 | 195 | / | 33 | a | 17 | 205 | / | 31 | a |
| (µg/L) | 2 | 19 | 199 | / | 27 | a | 17 | 207 | / | 30 | a | 19 | 195 | / | 31 | a | 17 | 202 | / | 17 | a |
| Δ | 19 | −11 | / | 38 | a | 17 | −9 | / | 35 | a | 19 | 1 | / | 39 | a | 17 | −15 | / | 48 | a | |
| Vitamin B6 | 0 | 19 | 59.8 | / | 36.2 | a | 17 | 53.2 | / | 25.0 | a | 19 | 73.4 | / | 47.6 | a | 17 | 75.1 | / | 38.9 | a |
| (nmol/L) | 2 | 19 | 64.4 | / | 61.5 | a | 17 | 66.4 | / | 18.1 | a | 19 | 76.8 | / | 28.4 | a | 17 | 92.4 | / | 22.8 | a |
| Δ | 19 | 5.6 | / | 34.0 | a | 17 | 10.4 | / | 19.3 | a | 19 | 2.2 | / | 16.9 | a | 17 | 10.5 | / | 22.5 | a | |
| Vitamin B12 | 0 | 19 | 228 | / | 196 | a | 17 | 292 | / | 142 | a | 19 | 244 | / | 67 | a | 17 | 295 | / | 137 | a |
| (nmol/L) | 2 | 19 | 242 | / | 202 | a | 17 | 271 | / | 162 | a | 19 | 291 | / | 70 | a | 17 | 283 | / | 144 | a |
| Δ | 19 | −5 | / | 25 | a | 17 | −3 | / | 40 | a | 19 | *24 | / | 24 | a | 17 | 0 | / | 46 | a | |
| Holo-trans- | 0 | 19 | 60.8 | / | 16.3 | a | 17 | 68.8 | / | 42.4 | a | 19 | 69.8 | / | 19.5 | a | 17 | 63.2 | / | 27.7 | a |
| cobalamin | 2 | 19 | 58.8 | / | 27.7 | a | 17 | 64.3 | / | 24.2 | a | 19 | 79.2 | / | 36.6 | a | 17 | 66.7 | / | 40.7 | a |
| (pmol/L) | Δ | 19 | 2.6 | / | 14.2 | a | 17 | −4.8 | / | 16.8 | a | 19 | 9.1 | / | 17.3 | a | 17 | 4.3 | / | 16.4 | a |
| Vitamin C | 0 | 19 | 5.3 | / | 2.5 | a | 17 | 4.4 | / | 4.1 | a | 19 | 5.7 | / | 2.7 | a | 17 | 5.5 | / | 2.2 | a |
| (mg/L) | 2 | 19 | 7.1 | / | 3.0 | a | 17 | 7.9 | / | 3.3 | a | 19 | 7.7 | / | 1.4 | a | 17 | 7.9 | / | 2.5 | a |
| Δ | 19 | 1.8 | / | 2.7 | a | 17 | * 2.6 | / | 2.5 | a | 19 | * 1.9 | / | 4.2 | a | 17 | * 3.3 | / | 3.4 | a | |
| 25-Hydroxy- | 0 | 18 | 3.40 | / | 1.82 | a | 17 | 2.50 | / | 0.77 | a | 18 | 2.83 | / | 1.32 | a | 16 | 2.52 | / | 1.60 | a |
| vitamin D2 | 2 | 18 | 3.19 | / | 1.15 | a | 17 | 2.50 | / | 0.24 | a | 18 | 4.71 | / | 1.42 | b | 16 | 2.50 | / | 0.97 | a |
| (nmol/L) | Δ | 18 | 0.00 | / | 0.27 | a | 17 | 0.00 | / | 0.18 | a | 18 | * 1.49 | / | 1.43 | b | 16 | 0.00 | / | 0.51 | a |
| 25-Hydroxy- | 0 | 18 | 57.48 | / | 24.06 | a | 17 | 43.30 | / | 14.59 | a | 19 | 57.91 | / | 27.71 | a | 17 | 49.12 | / | 23.59 | a |
| vitamin D3 | 2 | 18 | 47.29 | / | 20.21 | a | 17 | 37.27 | / | 9.15 | a | 19 | 48.38 | / | 19.97 | a | 17 | 39.55 | / | 39.42 | a |
| (nmol/L) | Δ | 18 | * −6.81 | / | 9.59 | a | 17 | * −3.97 | / | 5.09 | a | 19 | * −4.31 | / | 7.82 | a | 17 | * −7.44 | / | 6.67 | a |
| Vitamin D3 | 0 | 17 | 2.04 | / | 11.78 | a | 17 | 1.52 | / | 1.17 | a | 18 | 4.13 | / | 6.95 | a | 16 | 2.36 | / | 6.10 | a |
| (nmol/L) | 2 | 17 | 1.63 | / | 3.25 | a | 17 | 1.32 | / | 0.79 | a | 18 | 2.87 | / | 3.35 | a | 16 | 1.64 | / | 2.87 | a |
| Δ | 17 | * −0.48 | / | 1.08 | a | 17 | * −0.33 | / | 0.39 | a | 18 | * −0.85 | / | 1.76 | a | 16 | * −0.89 | / | 3.55 | a | |
| Vitamin E | 0 | 8 | 30.5 | / | 5.4 | a | 9 | 29.5 | / | 10.6 | a | 9 | 30.7 | / | 9.6 | a | 9 | 29.4 | / | 8.2 | a |
| (µmol/L) | 2 | 8 | 30.7 | / | 5.0 | a | 9 | 30.7 | / | 5.1 | a | 9 | 27.6 | / | 6.3 | a | 9 | 30.7 | / | 7.7 | a |
| Δ | 8 | −3.7 | / | 31.0 | a | 9 | −2.0 | / | 30.5 | a | 9 | −6.0 | / | 21.1 | a | 9 | 1.0 | / | 12.7 | a | |
| Vitamin H | 0 | 19 | 296 | / | 151 | a | 16 | 305 | / | 120 | a | 18 | 305 | / | 139 | a | 16 | 286 | / | 128 | a |
| (ng/L) | 2 | 19 | 277 | / | 124 | a | 16 | 284 | / | 138 | a | 18 | 374 | / | 170 | a | 16 | 345 | / | 158 | a |
| Δ | 19 | −21 | / | 203 | a | 16 | −37 | / | 157 | a | 18 | 11 | / | 209 | a | 16 | 24 | / | 209 | a | |
| Folic acid | 0 | 19 | 6.50 | / | 3.45 | a | 17 | 5.3 | / | 2.0 | a | 19 | 7.0 | / | 3.9 | a | 17 | 6.2 | / | 5.1 | a |
| (µg/L) | 2 | 19 | 6.90 | / | 4.35 | a | 17 | 7.2 | / | 2.1 | a | 19 | 7.2 | / | 4.6 | a | 17 | 6.7 | / | 3.3 | a |
| Δ | 19 | 0.5 | / | 3.25 | a | 17 | 1.3 | / | 1.8 | a | 19 | 0.8 | / | 2.6 | a | 17 | 0.6 | / | 3.4 | a | |
| Minerals and trace elements in blood | |||||||||||||||||||||
| Calcium | 0 | 19 | 2.34 | / | 0.11 | a | 17 | 2.27 | / | 0.09 | a | 19 | 2.33 | / | 0.08 | a | 17 | 2.33 | / | 0.04 | a |
| (mmol/L) | 2 | 19 | 2.30 | / | 0.10 | a | 17 | 2.29 | / | 0.09 | a | 19 | 2.31 | / | 0.11 | a | 17 | 2.34 | / | 0.04 | a |
| Δ | 19 | −0.03 | / | 0.11 | a | 17 | −0.01 | / | 0.09 | a | 19 | −0.02 | / | 0.07 | a | 17 | 0.02 | / | 0.11 | a | |
| Potassium | 0 | 19 | 3.75 | / | 0.26 | a | 17 | 4.02 | / | 0.21 | a | 19 | 3.89 | / | 0.38 | a | 17 | 3.91 | / | 0.47 | a |
| (mmol/L) | 2 | 19 | 3.81 | / | 0.21 | a | 17 | 3.99 | / | 0.30 | a | 19 | 3.90 | / | 0.43 | a | 17 | 3.95 | / | 0.40 | a |
| Δ | 19 | 0.07 | / | 0.39 | a | 17 | −0.08 | / | 0.25 | a | 19 | −0.13 | / | 0.41 | a | 17 | −0.01 | / | 0.30 | a | |
| Iodine | 0 | 19 | 57.0 | / | 11.9 | a | 17 | 54.8 | / | 16.6 | a | 19 | 48.7 | / | 13.6 | a | 17 | 52.3 | / | 9.8 | a |
| (µmol/L) | 2 | 19 | 58.8 | / | 13.7 | a | 17 | 47.2 | / | 12.9 | a | 19 | 50.3 | / | 20.9 | a | 17 | 52.6 | / | 10.9 | a |
| Δ | 19 | −4.3 | / | 11.3 | a | 17 | −7.8 | / | 11.5 | a | 19 | −4.9 | / | 5.9 | a | 17 | 0.3 | / | 8.0 | a | |
| Selenium | 0 | 19 | 1.44 | / | 0.27 | a | 17 | 1.28 | / | 0.55 | a | 19 | 1.48 | / | 0.36 | a | 17 | 1.38 | / | 0.50 | a |
| (µmol/L) | 2 | 19 | 1.43 | / | 0.29 | a | 17 | 1.24 | / | 0.38 | a | 19 | 1.35 | / | 0.33 | a | 17 | 1.30 | / | 0.24 | a |
| Δ | 19 | 0.04 | / | 0.35 | a | 17 | −0.13 | / | 0.57 | a | 19 | * −0.28 | / | 0.40 | a | 17 | −0.10 | / | 0.47 | a | |
| Minerals and trace elements in urine | |||||||||||||||||||||
| Magnesium | 0 | 19 | 1.69 | / | 0.98 | a | 17 | 2.05 | / | 0.82 | a | 19 | 1.90 | / | 0.96 | a | 17 | 2.05 | / | 0.44 | a |
| (mmol/L) | 2 | 19 | 1.91 | / | 0.90 | a | 17 | 1.92 | / | 0.81 | a | 19 | 1.77 | / | 2.24 | a | 17 | 2.22 | / | 0.65 | a |
| Δ | 19 | 0.22 | / | 0.96 | a | 17 | −0.10 | / | 0.78 | a | 19 | 0.15 | / | 0.60 | a | 17 | −0.09 | / | 0.70 | a | |
| Sodium | 0 | 19 | 64 | / | 24 | a | 17 | 56 | / | 36 | a | 19 | 66 | / | 46 | a | 17 | 51 | / | 37 | a |
| (mmol/L) | 2 | 19 | 60 | / | 29 | a | 17 | 51 | / | 36 | a | 19 | 55 | / | 27 | a | 17 | 56 | / | 28 | a |
| Δ | 19 | −8 | / | 32 | a | 17 | −9 | / | 57 | a | 19 | −1 | / | 44 | a | 17 | 6 | / | 15 | a | |
| Copper | 0 | 19 | 0.29 | / | 0.05 | a | 17 | 0.29 | / | 0.00 | a | 19 | 0.29 | / | 0.05 | a | 17 | 0.29 | / | 0.02 | a |
| (µmol/L) | 2 | 19 | 0.29 | / | 0.00 | a | 17 | 0.29 | / | 0.02 | a | 19 | 0.29 | / | 0.10 | a | 17 | 0.31 | / | 0.08 | a |
| Δ | 19 | 0.00 | / | 0.02 | a | 17 | 0.00 | / | 0.00 | a | 19 | 0.00 | / | 0.02 | a | 17 | 0.00 | / | 0.03 | a | |
| Selenium | 0 | 19 | 0.19 | / | 0.19 | a | 17 | 0.14 | / | 0.08 | a | 19 | 0.16 | / | 0.12 | a | 17 | 0.16 | / | 0.05 | a |
| (µmol/L) | 2 | 19 | 0.14 | / | 0.10 | a | 17 | 0.10 | / | 0.10 | a | 19 | 0.10 | / | 0.10 | a | 17 | 0.14 | / | 0.11 | a |
| Δ | 19 | −0.06 | / | 0.10 | a | 17 | −0.03 | / | 0.05 | a | 19 | −0.08 | / | 0.20 | a | 17 | −0.03 | / | 0.16 | a | |
| Zinc | 0 | 19 | 4.1 | / | 3.1 | a | 17 | 3.5 | / | 2.9 | a | 19 | 3.5 | / | 3.2 | a | 17 | 2.8 | / | 1.2 | a |
| (µmol/L) | 2 | 19 | 3.7 | / | 2.1 | a | 17 | 3.1 | / | 2.6 | a | 19 | 2.8 | / | 3.2 | a | 17 | 3.4 | / | 2.3 | a |
| Δ | 19 | −0.3 | / | 3.2 | a | 17 | −0.8 | / | 1.3 | a | 19 | −0.7 | / | 1.7 | a | 17 | 0.8 | / | 2.2 | a | |
| Iron status | |||||||||||||||||||||
| Iron | 0 | 19 | 18.3 | / | 7.6 | a | 17 | 20.7 | / | 13.0 | a | 19 | 21.5 | / | 4.8 | a | 17 | 18.2 | / | 6.3 | a |
| (µmol/L) | 2 | 19 | 18.8 | / | 9.4 | a | 17 | 17.1 | / | 12.2 | a | 19 | 16.8 | / | 6.8 | a | 17 | 17.0 | / | 7.5 | a |
| Δ | 19 | −1.8 | / | 4.5 | a | 17 | −1.0 | / | 8.0 | a | 19 | * −6.4 | / | 8.4 | a | 17 | −1.3 | / | 6.7 | a | |
| Transferrin | 0 | 19 | 3.1 | / | 0.6 | a | 17 | 2.7 | / | 0.8 | a | 19 | 2.9 | / | 0.6 | a | 17 | 2.9 | / | 0.3 | a |
| (g/L) | 2 | 19 | 3.0 | / | 0.8 | a | 17 | 2.8 | / | 0.9 | a | 19 | 2.8 | / | 0.6 | a | 17 | 2.9 | / | 0.4 | a |
| Δ | 19 | 0.0 | / | 0.3 | a | 17 | 0.1 | / | 0.3 | a | 19 | −0.1 | / | 0.3 | a | 17 | 0.0 | / | 0.3 | a | |
| Transferrin | 0 | 19 | 23.5 | / | 11.1 | a | 17 | 30.7 | / | 23.0 | a | 19 | 29.4 | / | 8.0 | a | 17 | 27.9 | / | 15.5 | a |
| saturation | 2 | 19 | 22.1 | / | 12.7 | a | 17 | 22.0 | / | 17.5 | a | 19 | 21.8 | / | 15.8 | a | 17 | 21.8 | / | 10.8 | a |
| (%) | Δ | 19 | −3.0 | / | 4.1 | a | 17 | −3.3 | / | 10.0 | a | 19 | * −8.9 | / | 10.4 | a | 17 | −1.9 | / | 7.1 | a |
| Ferritin | 0 | 19 | 35.7 | / | 62.3 | a | 17 | 74.3 | / | 83.2 | a | 19 | 38.0 | / | 32.0 | a | 17 | 34.7 | / | 128.2 | a |
| (µg/L) | 2 | 19 | 35.5 | / | 47.6 | a | 17 | 54.4 | / | 85.0 | a | 19 | 20.2 | / | 26.3 | a | 17 | 40.4 | / | 127.7 | a |
| Δ | 19 | −6.3 | / | 8.9 | a | 17 | −7.5 | / | 15.2 | a | 19 | * −13.9 | / | 14.8 | a | 17 | −8.4 | / | 29.5 | a | |
| Hemoglobin | 0 | 19 | 8.5 | / | 1.0 | a | 17 | 8.4 | / | 1.2 | a | 19 | 8.8 | / | 0.9 | a | 17 | 8.2 | / | 1.2 | a |
| (mmol/L) | 2 | 19 | 8.3 | / | 1.4 | a | 17 | 8.6 | / | 1.6 | a | 19 | 8.8 | / | 1.0 | a | 17 | 8.5 | / | 1.1 | a |
| Δ | 19 | 0.0 | / | 0.4 | a | 17 | 0.1 | / | 0.4 | a | 19 | −0.1 | / | 0.5 | a | 17 | 0.3 | / | 0.4 | a | |
| Control Group I | Control Group II | Intervention Group I | Intervention Group II | ||||||||||||||||||
|---|---|---|---|---|---|---|---|---|---|---|---|---|---|---|---|---|---|---|---|---|---|
| FAME | Weeks | n | Md | / | IQR | p | n | Md | / | IQR | p | n | Md | / | IQR | p | n | Md | / | IQR | p |
| SFA (%) | |||||||||||||||||||||
| C14:0 | 0 | 17 | 0.93 | / | 0.35 | a | 16 | 0.92 | / | 0.38 | a | 19 | 0.83 | / | 0.36 | a | 17 | 0.88 | / | 0.36 | a |
| 2 | 17 | 0.87 | / | 0.18 | a | 16 | 0.69 | / | 0.18 | b | 19 | 0.78 | / | 0.27 | a,b | 17 | 0.68 | / | 0.17 | b | |
| Δ | 17 | 0.16 | / | 0.44 | a | 16 | −0.24 | / | 0.21 | a | 19 | −0.16 | / | 0.29 | a | 17 | −0.15 | / | 0.20 | a | |
| C15:0 | 0 | 17 | 0.27 | / | 0.07 | a | 16 | 0.28 | / | 0.08 | a | 19 | 0.27 | / | 0.05 | a | 17 | 0.25 | / | 0.08 | a |
| 2 | 17 | 0.26 | / | 0.04 | a | 16 | 0.23 | / | 0.04 | a | 19 | 0.27 | / | 0.04 | a | 17 | 0.24 | / | 0.04 | a | |
| Δ | 17 | 0.01 | / | 0.04 | a | 16 | −0.02 | / | 0.06 | a | 19 | −0.02 | / | 0.02 | a | 17 | −0.01 | / | 0.07 | a | |
| C16:0 | 0 | 17 | 21.17 | / | 2.75 | a | 16 | 20.87 | / | 2.23 | a | 19 | 20.90 | / | 1.71 | a | 17 | 20.23 | / | 1.07 | a |
| 2 | 17 | 20.54 | / | 2.33 | a | 16 | 20.80 | / | 2.74 | a | 19 | 20.18 | / | 2.18 | a | 17 | 19.92 | / | 1.80 | a | |
| Δ | 17 | −0.79 | / | 2.75 | a | 16 | −1.09 | / | 1.68 | a | 19 | −0.38 | / | 2.09 | a | 17 | −0.06 | / | 1.77 | a | |
| C17:0 | 0 | 17 | 0.26 | / | 0.05 | a | 16 | 0.25 | / | 0.05 | a | 19 | 0.26 | / | 0.04 | a | 17 | 0.25 | / | 0.03 | a |
| 2 | 17 | 0.25 | / | 0.02 | a | 16 | 0.27 | / | 0.05 | a | 19 | 0.29 | / | 0.03 | a | 17 | 0.31 | / | 0.04 | a | |
| Δ | 17 | 0.00 | / | 0.04 | a | 16 | 0.02 | / | 0.06 | a,b | 19 | 0.01 | / | 0.06 | a,b | 17 | * 0.05 | / | 0.07 | b | |
| C18:0 | 0 | 17 | 6.59 | / | 1.27 | a | 16 | 6.89 | / | 0.64 | a | 19 | 6.72 | / | 0.86 | a | 17 | 6.98 | / | 0.69 | a |
| 2 | 17 | 6.61 | / | 0.85 | a | 16 | 6.61 | / | 0.68 | a | 19 | 6.58 | / | 1.13 | a | 17 | 7.03 | / | 0.47 | a | |
| Δ | 17 | 0.10 | / | 1.01 | a | 16 | 0.17 | / | 0.94 | a | 19 | 0.01 | / | 0.79 | a | 17 | −0.06 | / | 0.95 | a | |
| Sum | 0 | 17 | 29.67 | / | 2.21 | a | 16 | 29.55 | / | 2.71 | a | 19 | 29.30 | / | 1.20 | a | 17 | 29.06 | / | 0.92 | a |
| SFA | 2 | 17 | 29.23 | / | 1.88 | a | 16 | 29.22 | / | 1.77 | a | 19 | 28.66 | / | 2.85 | a | 17 | 28.51 | / | 1.13 | a |
| Δ | 17 | 0.04 | / | 3.34 | a | 16 | −0.65 | / | 1.26 | a | 19 | −0.28 | / | 2.24 | a | 17 | −0.58 | / | 1.71 | a | |
| MUFA (%) | |||||||||||||||||||||
| C16:1n7 | 0 | 17 | 1.71 | / | 0.69 | a | 16 | 1.55 | / | 0.63 | a | 19 | 1.77 | / | 0.62 | a | 17 | 1.46 | / | 0.61 | a |
| 2 | 17 | 1.55 | / | 0.69 | a | 16 | 1.80 | / | 0.88 | a | 19 | 1.67 | / | 0.28 | a | 17 | 1.70 | / | 0.50 | a | |
| Δ | 17 | −0.12 | / | 0.71 | a | 16 | −0.05 | / | 0.44 | a | 19 | 0.00 | / | 0.62 | a | 17 | −0.02 | / | 0.37 | a | |
| C18:1n9 | 0 | 17 | 20.34 | / | 2.61 | a | 16 | 20.21 | / | 4.53 | a | 19 | 21.16 | / | 1.81 | a | 17 | 20.55 | / | 3.52 | a |
| 2 | 17 | 21.69 | / | 2.77 | a | 16 | 21.59 | / | 2.95 | a | 19 | 22.42 | / | 2.69 | a | 17 | 23.49 | / | 3.46 | a | |
| Δ | 17 | 0.35 | / | 1.53 | a | 16 | 2.10 | / | 2.71 | a | 19 | * 1.27 | / | 1.98 | a | 17 | 1.23 | / | 2.19 | a | |
| C18:1n7 | 0 | 17 | 1.76 | / | 0.27 | a | 16 | 1.67 | / | 0.24 | a | 19 | 1.75 | / | 0.24 | a | 17 | 1.74 | / | 0.13 | a |
| 2 | 17 | 1.75 | / | 0.25 | a | 16 | 1.89 | / | 0.26 | a | 19 | 1.89 | / | 0.36 | a | 17 | 2.05 | / | 0.29 | a | |
| Δ | 17 | −0.03 | / | 0.24 | a | 16 | 0.26 | / | 0.35 | a | 19 | * 0.18 | / | 0.23 | a | 17 | * 0.25 | / | 0.19 | a | |
| Sum | 0 | 17 | 24.72 | / | 2.69 | a | 16 | 24.20 | / | 3.54 | a | 19 | 25.57 | / | 3.20 | a | 17 | 24.05 | / | 3.79 | a |
| MUFA | 2 | 17 | 25.50 | / | 4.24 | a | 16 | 25.42 | / | 3.40 | a | 19 | 26.81 | / | 3.43 | a | 17 | 27.18 | / | 3.66 | a |
| Δ | 17 | 0.84 | / | 2.53 | a | 16 | 2.27 | / | 2.78 | a | 19 | 1.29 | / | 2.14 | a | 17 | 1.69 | / | 2.56 | a | |
| n6 PUFA (%) | |||||||||||||||||||||
| C18:2n6 | 0 | 17 | 31.35 | / | 5.06 | a | 16 | 30.70 | / | 2.09 | a | 19 | 29.53 | / | 5.03 | a | 17 | 30.03 | / | 3.77 | a |
| 2 | 17 | 29.96 | / | 3.27 | a | 16 | 27.79 | / | 4.68 | a | 19 | 28.22 | / | 2.96 | a | 17 | 27.29 | / | 3.67 | a | |
| Δ | 17 | −0.59 | / | 5.13 | a | 16 | −2.12 | / | 3.82 | a | 19 | −2.07 | / | 2.14 | a | 17 | −2.23 | / | 4.47 | a | |
| C18:3n6 | 0 | 17 | 0.22 | / | 0.08 | a | 16 | 0.34 | / | 0.10 | a,b | 19 | 0.40 | / | 0.19 | b | 17 | 0.32 | / | 0.15 | a,b |
| 2 | 17 | 0.22 | / | 0.11 | a | 16 | 0.25 | / | 0.12 | a | 19 | 0.29 | / | 0.16 | a | 17 | 0.27 | / | 0.17 | a | |
| Δ | 17 | 0.00 | / | 0.06 | a | 16 | −0.06 | / | 0.13 | a | 19 | −0.03 | / | 0.15 | a | 17 | −0.04 | / | 0.07 | a | |
| C20:2n6 | 0 | 17 | 0.16 | / | 0.11 | a | 16 | 0.17 | / | 0.08 | a | 19 | 0.16 | / | 0.07 | a | 17 | 0.15 | / | 0.05 | a |
| 2 | 17 | 0.19 | / | 0.05 | a | 16 | 0.19 | / | 0.06 | a | 19 | 0.19 | / | 0.05 | a | 17 | 0.16 | / | 0.04 | a | |
| Δ | 17 | 0.03 | / | 0.10 | a | 16 | 0.02 | / | 0.06 | a | 19 | 0.02 | / | 0.07 | a | 17 | 0.02 | / | 0.09 | a | |
| C20:3n6 | 0 | 17 | 1.36 | / | 0.44 | a | 16 | 1.77 | / | 0.55 | a | 19 | 1.69 | / | 0.42 | a | 17 | 1.47 | / | 0.32 | a |
| 2 | 17 | 1.55 | / | 0.44 | a | 16 | 1.79 | / | 0.36 | a | 19 | 1.46 | / | 0.31 | a,b | 17 | 1.24 | / | 0.25 | b | |
| Δ | 17 | 0.13 | / | 0.12 | a | 16 | −0.10 | / | 0.27 | a,b | 19 | −0.10 | / | 0.37 | a,b | 17 | −0.15 | / | 0.27 | b | |
| C20:4n6 | 0 | 17 | 6.40 | / | 1.67 | a | 16 | 6.75 | / | 1.58 | a | 19 | 6.95 | / | 1.64 | a | 17 | 6.76 | / | 1.32 | a |
| 2 | 17 | 6.53 | / | 1.34 | a | 16 | 7.01 | / | 2.99 | a | 19 | 7.00 | / | 1.22 | a | 17 | 6.91 | / | 1.35 | a | |
| Δ | 17 | 0.22 | / | 0.96 | a | 16 | 0.61 | / | 2.23 | a | 19 | −0.02 | / | 1.56 | a | 17 | 0.20 | / | 0.88 | a | |
| C22:4n6 | 0 | 17 | 0.16 | / | 0.05 | a | 16 | 0.18 | / | 0.04 | a | 19 | 0.17 | / | 0.02 | a | 17 | 0.18 | / | 0.03 | a |
| 2 | 17 | 0.17 | / | 0.05 | a | 16 | 0.19 | / | 0.03 | a | 19 | 0.18 | / | 0.03 | a | 17 | 0.16 | / | 0.02 | a | |
| Δ | 17 | 0.02 | / | 0.03 | a | 16 | 0.00 | / | 0.04 | a | 19 | 0.02 | / | 0.04 | a | 17 | −0.01 | / | 0.01 | a | |
| C22:5n6 | 0 | 17 | 0.12 | / | 0.05 | a | 16 | 0.13 | / | 0.05 | a | 19 | 0.13 | / | 0.04 | a | 17 | 0.12 | / | 0.04 | a |
| 2 | 17 | 0.12 | / | 0.06 | a | 16 | 0.16 | / | 0.05 | a | 19 | 0.13 | / | 0.04 | a | 17 | 0.11 | / | 0.04 | a | |
| Δ | 17 | 0.00 | / | 0.04 | a | 16 | 0.02 | / | 0.03 | a | 19 | 0.01 | / | 0.05 | a | 17 | −0.01 | / | 0.02 | a | |
| Sum n6 | 0 | 17 | 40.16 | / | 3.60 | a | 16 | 40.31 | / | 1.28 | a | 19 | 38.49 | / | 5.93 | a | 17 | 39.86 | / | 2.71 | a |
| PUFA | 2 | 17 | 38.99 | / | 2.86 | a | 16 | 38.90 | / | 2.40 | a | 19 | 38.08 | / | 4.22 | a | 17 | 36.69 | / | 3.31 | a |
| Δ | 17 | −0.52 | / | 5.60 | a | 16 | −1.98 | / | 3.30 | a | 19 | −1.58 | / | 1.96 | a | 17 | −1.99 | / | 4.32 | a | |
| n3 PUFA (%) | |||||||||||||||||||||
| C18:3n3 | 0 | 17 | 0.55 | / | 0.49 | a | 16 | 0.43 | / | 0.20 | a | 19 | 0.50 | / | 0.20 | a | 17 | 0.57 | / | 0.19 | a |
| 2 | 17 | 0.47 | / | 0.19 | a | 16 | 0.54 | / | 0.24 | a | 19 | 0.59 | / | 0.29 | a | 17 | 0.62 | / | 0.25 | a | |
| Δ | 17 | −0.03 | / | 0.32 | a | 16 | 0.10 | / | 0.23 | a | 19 | 0.02 | / | 0.17 | a | 17 | 0.03 | / | 0.43 | a | |
| C20:5n3 | 0 | 17 | 0.37 | / | 0.25 | a | 16 | 0.45 | / | 0.28 | a | 19 | 0.49 | / | 0.21 | a | 17 | 0.59 | / | 0.35 | a |
| 2 | 17 | 0.40 | / | 0.21 | a | 16 | 0.37 | / | 0.21 | a | 19 | 0.41 | / | 0.25 | a | 17 | 0.88 | / | 0.51 | b | |
| Δ | 17 | −0.05 | / | 0.25 | a | 16 | −0.09 | / | 0.31 | a | 19 | −0.10 | / | 0.18 | a | 17 | * 0.24 | / | 0.65 | b | |
| C22:5n3 | 0 | 17 | 0.32 | / | 0.15 | a | 16 | 0.36 | / | 0.14 | a | 19 | 0.37 | / | 0.16 | a | 17 | 0.46 | / | 0.14 | a |
| 2 | 17 | 0.36 | / | 0.18 | a | 16 | 0.40 | / | 0.12 | a | 19 | 0.43 | / | 0.21 | a | 17 | 0.65 | / | 0.13 | b | |
| Δ | 17 | 0.05 | / | 0.11 | a | 16 | 0.03 | / | 0.10 | a | 19 | 0.01 | / | 0.08 | a | 17 | * 0.17 | / | 0.10 | b | |
| C22:6n3 | 0 | 17 | 1.51 | / | 0.37 | a | 16 | 1.45 | / | 0.47 | a | 19 | 1.49 | / | 0.63 | a | 17 | 1.70 | / | 0.83 | a |
| 2 | 17 | 1.41 | / | 0.64 | a | 16 | 1.63 | / | 0.58 | a | 19 | 1.43 | / | 0.38 | a | 17 | 1.52 | / | 0.44 | a | |
| Δ | 17 | 0.09 | / | 0.43 | a | 16 | 0.18 | / | 0.43 | a | 19 | −0.06 | / | 0.28 | a | 17 | −0.24 | / | 0.54 | a | |
| Sum n3 | 0 | 17 | 2.83 | / | 0.78 | a | 16 | 2.66 | / | 0.91 | a | 19 | 3.05 | / | 0.96 | a | 17 | 3.54 | / | 1.21 | a |
| PUFA | 2 | 17 | 2.72 | / | 0.80 | a,b | 16 | 3.03 | / | 0.69 | a,b | 19 | 2.95 | / | 0.94 | a | 17 | 3.86 | / | 0.85 | b |
| Δ | 17 | −0.01 | / | 0.93 | a | 16 | 0.10 | / | 0.70 | a | 19 | −0.09 | / | 0.67 | a | 17 | 0.48 | / | 1.13 | a | |
| Sum | 0 | 17 | 2.04 | / | 0.80 | a | 16 | 2.20 | / | 0.76 | a | 19 | 2.50 | / | 0.90 | a | 17 | 2.92 | / | 1.04 | a |
| LC n3 | 2 | 17 | 2.00 | / | 1.04 | a,b | 16 | 2.44 | / | 0.51 | a,b | 19 | 2.28 | / | 0.87 | a | 17 | 3.08 | / | 1.03 | b |
| PUFA | Δ | 17 | 0.11 | / | 0.64 | a | 16 | 0.02 | / | 0.60 | a | 19 | −0.10 | / | 0.42 | a | 17 | 0.17 | / | 1.24 | a |
| Sum | 0 | 17 | 42.80 | / | 5.50 | a | 16 | 43.08 | / | 1.31 | a | 19 | 41.95 | / | 6.11 | a | 17 | 43.71 | / | 2.66 | a |
| PUFA | 2 | 17 | 41.82 | / | 3.46 | a | 16 | 41.94 | / | 2.57 | a | 19 | 40.57 | / | 3.05 | a | 17 | 40.61 | / | 4.63 | a |
| Δ | 17 | −0.57 | / | 5.98 | a | 16 | −1.72 | / | 2.49 | a | 19 | −1.45 | / | 2.73 | a | 17 | −1.45 | / | 4.34 | a | |
| n6/n3 | 0 | 17 | 14.12 | / | 3.77 | a | 16 | 14.93 | / | 5.29 | a | 19 | 13.00 | / | 3.30 | a | 17 | 11.44 | / | 2.80 | a |
| ratio | 2 | 17 | 14.14 | / | 4.59 | a | 16 | 12.92 | / | 2.50 | a,b | 19 | 13.70 | / | 4.85 | a | 17 | 9.97 | / | 2.03 | b |
| Δ | 17 | −0.11 | / | 3.49 | a | 16 | −2.19 | / | 4.10 | a | 19 | −0.60 | / | 3.37 | a | 17 | −1.44 | / | 2.59 | a | |
| Control Group I | Control Group II | Intervention Group I | Intervention Group II | ||||||||||||||||||
|---|---|---|---|---|---|---|---|---|---|---|---|---|---|---|---|---|---|---|---|---|---|
| Weeks | n | Md | / | IQR | p | n | Md | / | IQR | p | n | Md | / | IQR | p | n | Md | / | IQR | p | |
| Liver and kidney function | |||||||||||||||||||||
| Alanine ami- | 0 | 19 | 0.25 | / | 0.15 | a | 17 | 0.28 | / | 0.16 | a | 19 | 0.34 | / | 0.21 | a | 17 | 0.26 | / | 0.23 | a |
| notransferase | 2 | 19 | 0.28 | / | 0.18 | a | 17 | 0.34 | / | 0.20 | a | 19 | 0.34 | / | 0.16 | a | 17 | 0.27 | / | 0.12 | a |
| (µmol/L*s) | Δ | 19 | 0.02 | / | 0.07 | a | 17 | 0.01 | / | 0.09 | a | 19 | 0.00 | / | 0.11 | a | 17 | −0.03 | / | 0.04 | a |
| Aspartate | 0 | 19 | 0.33 | / | 0.09 | a | 17 | 0.31 | / | 0.11 | a | 19 | 0.36 | / | 0.11 | a | 17 | 0.35 | / | 0.16 | a |
| aminotrans- | 2 | 19 | 0.33 | / | 0.08 | a | 17 | 0.36 | / | 0.12 | a | 19 | 0.36 | / | 0.13 | a | 17 | 0.36 | / | 0.13 | a |
| ferase (s) | Δ | 19 | 0.01 | / | 0.08 | a | 17 | −0.01 | / | 0.09 | a | 19 | 0.00 | / | 0.06 | a | 17 | 0.00 | / | 0.06 | a |
| Cholin- | 0 | 19 | 114 | / | 39 | a | 17 | 114 | / | 18 | a | 19 | 120 | / | 19 | a | 17 | 117 | / | 32 | a |
| esterase | 2 | 19 | 110 | / | 34 | a | 17 | 116 | / | 22 | a | 19 | 111 | / | 18 | a | 17 | 115 | / | 31 | a |
| (µmol/L*s) | Δ | 19 | −4 | / | 10 | a,b | 17 | 1 | / | 8 | a | 19 | * −6 | / | 6 | b | 17 | 1 | / | 16 | a,b |
| γ-glutamyl- | 0 | 19 | 0.22 | / | 0.07 | a | 17 | 0.20 | / | 0.05 | a | 19 | 0.19 | / | 0.07 | a | 17 | 0.19 | / | 0.10 | a |
| transferase | 2 | 19 | 0.21 | / | 0.08 | a | 17 | 0.19 | / | 0.04 | a | 19 | 0.18 | / | 0.06 | a | 17 | 0.17 | / | 0.09 | a |
| (µmol/L*s) | Δ | 19 | 0.00 | / | 0.02 | a | 17 | 0.00 | / | 0.02 | a | 19 | −0.01 | / | 0.02 | a | 17 | −0.02 | / | 0.04 | a |
| Lactate de- | 0 | 19 | 2.50 | / | 0.44 | a | 17 | 2.53 | / | 0.51 | a | 19 | 2.68 | / | 0.34 | a | 17 | 2.56 | / | 0.40 | a |
| hydrogenase | 2 | 19 | 2.64 | / | 0.27 | a | 17 | 2.68 | / | 0.32 | a | 19 | 2.64 | / | 0.40 | a | 17 | 2.74 | / | 0.37 | a |
| (µmol/L*s) | Δ | 19 | 0.15 | / | 0.12 | a | 17 | 0.17 | / | 0.20 | a | 19 | 0.10 | / | 0.40 | a | 17 | 0.14 | / | 0.15 | a |
| Clotting | |||||||||||||||||||||
| Activated par- | 0 | 19 | 29.0 | / | 2.7 | a | 17 | 29.5 | / | 3.0 | a | 19 | 29.7 | / | 2.9 | a | 17 | 30.5 | / | 3.0 | a |
| tial thrombo- | 2 | 19 | 28.4 | / | 3.0 | a | 17 | 30.0 | / | 3.9 | a | 19 | 30.0 | / | 2.6 | a | 17 | 30.1 | / | 3.9 | a |
| plastin time (s) | Δ | 19 | −0.3 | / | 1.0 | a | 17 | 0.3 | / | 1.3 | a | 19 | 0.3 | / | 1.1 | a | 17 | 0.3 | / | 1.8 | a |
| Fibrinogen | 0 | 19 | 2.3 | / | 0.4 | a | 17 | 2.3 | / | 0.8 | a | 19 | 2.4 | / | 0.5 | a | 17 | 2.1 | / | 0.4 | a |
| (nmol/L) | 2 | 19 | 2.4 | / | 0.3 | a | 17 | 2.4 | / | 0.7 | a | 19 | 2.7 | / | 0.7 | a | 17 | 2.3 | / | 0.6 | a |
| Δ | 19 | 0.1 | / | 0.3 | a | 17 | 0.1 | / | 0.4 | a | 19 | * 0.2 | / | 0.5 | a | 17 | 0.2 | / | 0.4 | a | |
| Quick | 0 | 19 | 90 | / | 14 | a | 17 | 92 | / | 18 | a | 19 | 90 | / | 10 | a | 17 | 88 | / | 8 | a |
| (%) | 2 | 19 | 93 | / | 13 | a | 17 | 87 | / | 13 | a | 19 | 89 | / | 16 | a | 17 | 91 | / | 7 | a |
| Δ | 19 | 2 | / | 8 | a | 17 | −1 | / | 9 | a | 19 | −1 | / | 10 | a | 17 | 1 | / | 7 | a | |
| International | 0 | 19 | 1.1 | / | 0.1 | a | 17 | 1.1 | / | 0.2 | a | 19 | 1.1 | / | 0.1 | a | 17 | 1.1 | / | 0.0 | a |
| normalized | 2 | 19 | 1.1 | / | 0.1 | a | 17 | 1.1 | / | 0.1 | a | 19 | 1.1 | / | 0.1 | a | 17 | 1.1 | / | 0.1 | a |
| ratio | Δ | 19 | 0.0 | / | 0.1 | a | 17 | 0.0 | / | 0.1 | a | 19 | 0.0 | / | 0.0 | a | 17 | 0.0 | / | 0.0 | a |
| Blood count | |||||||||||||||||||||
| Hematocrit | 0 | 19 | 0.41 | / | 0.05 | a | 17 | 0.40 | / | 0.07 | a | 19 | 0.42 | / | 0.03 | a | 17 | 0.40 | / | 0.04 | a |
| (%) | 2 | 19 | 0.40 | / | 0.06 | a | 17 | 0.41 | / | 0.07 | a | 19 | 0.41 | / | 0.04 | a | 17 | 0.41 | / | 0.03 | a |
| Δ | 19 | 0.00 | / | 0.03 | a | 17 | 0.00 | / | 0.02 | a | 19 | 0.00 | / | 0.02 | a | 17 | 0.01 | / | 0.02 | a | |
| MCH | 0 | 19 | 1.81 | / | 0.15 | a | 17 | 1.84 | / | 0.12 | a | 19 | 1.85 | / | 0.10 | a | 17 | 1.85 | / | 0.10 | a |
| (fmol) | 2 | 19 | 1.84 | / | 0.13 | a | 17 | 1.87 | / | 0.12 | a | 19 | 1.88 | / | 0.13 | a | 17 | 1.86 | / | 0.12 | a |
| Δ | 19 | 0.01 | / | 0.03 | a | 17 | 0.01 | / | 0.03 | a | 19 | 0.00 | / | 0.05 | a | 17 | 0.01 | / | 0.04 | a | |
| MCHC | 0 | 19 | 20.7 | / | 0.5 | a | 17 | 20.9 | / | 0.6 | a | 19 | 21.0 | / | 0.9 | a | 17 | 20.8 | / | 0.7 | a |
| (mmol/L) | 2 | 19 | 20.7 | / | 0.55 | a | 17 | 20.9 | / | 0.5 | a | 19 | 21.0 | / | 0.7 | a | 17 | 20.8 | / | 0.7 | a |
| Δ | 19 | 0.0 | / | 0.3 | a | 17 | 0.0 | / | 0.5 | a | 19 | −0.1 | / | 0.3 | a | 17 | −0.2 | / | 0.3 | a | |
| MCV | 0 | 19 | 88 | / | 5 | a | 17 | 89 | / | 4 | a | 19 | 89 | / | 3 | a | 17 | 87 | / | 4 | a |
| (fl) | 2 | 19 | 89 | / | 5 | a | 17 | 89 | / | 4 | a | 19 | 90 | / | 5 | a | 17 | 89 | / | 3 | a |
| Δ | 19 | 0 | / | 1 | a | 17 | 0 | / | 1 | a | 19 | * 1 | / | 2 | a | 17 | * 1 | / | 1 | b | |
| Red cell | 0 | 19 | 12.2 | / | 0.7 | a | 17 | 12.4 | / | 0.3 | a | 19 | 12.3 | / | 0.7 | a | 17 | 12.4 | / | 1.0 | a |
| distribution | 2 | 19 | 12.2 | / | 0.8 | a | 17 | 12.4 | / | 0.7 | a | 19 | 12.3 | / | 0.5 | a | 17 | 12.3 | / | 1.1 | a |
| width (%) | Δ | 19 | −0.1 | / | 0.4 | a | 17 | 0.0 | / | 0.1 | a | 19 | 0.0 | / | 0.2 | a | 17 | 0.0 | / | 0.2 | a |
| Parameters in urine | |||||||||||||||||||||
| Albumin | 0 | 19 | 4 | / | 6 | a | 17 | 3 | / | 1 | a | 19 | 3 | / | 0 | a | 17 | 3 | / | 0 | a |
| (mg/L) | 2 | 19 | 3 | / | 1 | a | 17 | 3 | / | 0 | a | 19 | 3 | / | 0 | a | 17 | 3 | / | 2 | a |
| Δ | 19 | −2 | / | 7 | a | 17 | 0 | / | 0 | a | 19 | 0 | / | 1 | a | 17 | 0 | / | 0 | a | |
| Creatinine | 0 | 19 | 5.3 | / | 4.0 | a | 17 | 6.0 | / | 3.6 | a | 19 | 5.1 | / | 2.9 | a | 17 | 4.7 | / | 1.5 | a |
| (mmol/L) | 2 | 19 | 4.7 | / | 3.7 | a | 17 | 4.3 | / | 2.3 | a | 19 | 4.7 | / | 6.5 | a | 17 | 5.7 | / | 3.4 | a |
| Δ | 19 | −0.3 | / | 3.1 | a | 17 | −0.5 | / | 2.2 | a | 19 | −0.4 | / | 2.3 | a | 17 | 0.1 | / | 2.4 | a | |
| Control Group I | Control Group II | Intervention Group I | Intervention Group II | ||||||||||||||||||
|---|---|---|---|---|---|---|---|---|---|---|---|---|---|---|---|---|---|---|---|---|---|
| Weeks | n | Md | / | IQR | p | n | Md | / | IQR | p | n | Md | / | IQR | p | n | Md | / | IQR | p | |
| Cardiovascular factors | |||||||||||||||||||||
| Cholesterol | 1 | 19 | 4.16 | / | 0.80 | a | 17 | 4.20 | / | 1.21 | a | 19 | 4.44 | / | 0.72 | a | 17 | 4.06 | / | 1.12 | a |
| (mmol/L) | 2 | 19 | 4.25 | / | 0.45 | a | 17 | 3.69 | / | 1.10 | a,b | 19 | 3.45 | / | 0.70 | b | 17 | 3.85 | / | 1.06 | a,b |
| Δ | 19 | 0.0 | / | 0.52 | a | 17 | −0.39 | / | 0.53 | a | 19 | * −0.82 | / | 0.55 | b | 17 | −0.25 | / | 0.83 | a | |
| HDL | 1 | 19 | 1.71 | / | 0.72 | a | 17 | 1.76 | / | 0.89 | a | 19 | 1.71 | / | 0.59 | a | 17 | 1.70 | / | 0.26 | a |
| cholesterol | 2 | 19 | 1.47 | / | 0.54 | a | 17 | 1.79 | / | 0.84 | a | 19 | 1.44 | / | 0.47 | a | 17 | 1.52 | / | 0.57 | a |
| (mmol/L) | Δ | 19 | −0.11 | / | 0.23 | a | 17 | −0.07 | / | 0.28 | a | 19 | * −0.17 | / | 0.25 | a | 17 | −0.11 | / | 0.29 | a |
| LDL | 1 | 19 | 2.62 | / | 0.62 | a | 17 | 2.20 | / | 0.58 | a | 19 | 2.45 | / | 0.72 | a | 17 | 2.26 | / | 0.84 | a |
| cholesterol | 2 | 19 | 2.45 | / | 0.53 | a | 17 | 1.94 | / | 0.39 | b | 19 | 1.84 | / | 0.57 | b | 17 | 2.07 | / | 0.49 | b |
| (mmol/L) | Δ | 19 | 0.02 | / | 0.34 | a | 17 | −0.48 | / | 0.66 | a,b | 19 | * −0.71 | / | 0.40 | b | 17 | −0.27 | / | 0.76 | a,b |
| LDL choles- | 1 | 19 | 1.48 | / | 0.95 | a | 17 | 1.12 | / | 1.03 | a | 19 | 1.45 | / | 0.84 | a | 17 | 1.36 | / | 0.62 | a |
| terol/HDL | 2 | 19 | 1.62 | / | 1.05 | a | 17 | 1.07 | / | 0.69 | b | 19 | 1.25 | / | 0.61 | a,b | 17 | 1.34 | / | 0.60 | a,b |
| cholesterol | Δ | 19 | 0.07 | / | 0.23 | a | 17 | −0.14 | / | 0.41 | a,b | 19 | * −0.23 | / | 0.16 | b | 17 | −0.14 | / | 0.25 | a,b |
| non-HDL | 1 | 19 | 2.55 | / | 0.74 | a | 17 | 2.27 | / | 0.63 | a | 19 | 2.62 | / | 1.02 | a | 17 | 2.36 | / | 0.91 | a |
| cholesterol | 2 | 19 | 2.80 | / | 0.78 | a | 17 | 2.03 | / | 0.70 | a,b | 19 | 2.03 | / | 0.58 | b | 17 | 2.31 | / | 0.52 | a,b |
| (mmol/L) | Δ | 19 | 0.05 | / | 0.35 | a | 17 | −0.37 | / | 0.63 | a,b | 19 | * −0.61 | / | 0.44 | b | 17 | −0.07 | / | 0.25 | a,b |
| MDA LDL | 1 | 19 | 47.7 | / | 33.1 | a | 17 | 44.3 | / | 34.4 | a | 19 | 47.8 | / | 16.6 | a | 17 | 50.4 | / | 32.6 | a |
| cholesterol | 2 | 19 | 53.4 | / | 30.0 | a | 17 | 41.2 | / | 29.6 | a | 19 | 44.8 | / | 28.2 | a | 17 | 56.1 | / | 35.7 | a |
| (U/L) | Δ | 19 | 6.4 | / | 27.7 | a | 17 | 8.8 | / | 31.6 | a | 19 | −6.9 | / | 24.8 | a | 17 | −3.5 | / | 42.8 | a |
| Triglyceride | 1 | 19 | 0.69 | / | 0.24 | a | 17 | 0.63 | / | 0.44 | a | 19 | 0.72 | / | 0.49 | a | 17 | 0.68 | / | 0.26 | a |
| (mmol/L) | 2 | 19 | 0.74 | / | 0.69 | a | 17 | 0.69 | / | 0.37 | a | 19 | 0.64 | / | 0.29 | a | 17 | 0.71 | / | 0.39 | a |
| Δ | 19 | 0.00 | / | 0.21 | a | 17 | 0.06 | / | 0.17 | a | 19 | −0.03 | / | 0.19 | a | 17 | 0.01 | / | 0.19 | a | |
| Uric acid | 1 | 19 | 243 | / | 73 | a | 17 | 229 | / | 74 | a | 19 | 231 | / | 87 | a | 17 | 264 | / | 107 | a |
| (µmol/L) | 2 | 19 | 258 | / | 65 | a | 17 | 243 | / | 47 | a | 19 | 253 | / | 84 | a | 17 | 294 | / | 108 | a |
| Δ | 19 | −5 | / | 47 | a | 17 | 20 | / | 39 | a | 19 | * 29 | / | 46 | a | 17 | * 18 | / | 48 | a | |
| Uric acid in | 1 | 19 | 1424 | / | 1119 | a | 17 | 1459 | / | 781 | a | 19 | 1229 | / | 829 | a | 17 | 1058 | / | 502 | a |
| urine | 2 | 19 | 1423 | / | 613 | a | 17 | 1322 | / | 377 | a | 19 | 1286 | / | 852 | a | 17 | 1451 | / | 1449 | a |
| (µmol/L) | Δ | 19 | −1 | / | 748 | a | 17 | 34 | / | 818 | a | 19 | * 48 | / | 424 | a | 17 | * 361 | / | 845 | a |
| Diabetes factors | |||||||||||||||||||||
| Glucose | 1 | 19 | 4.9 | / | 0.4 | a | 17 | 5.0 | / | 0.4 | a | 19 | 4.9 | / | 0.5 | a | 17 | 5.1 | / | 0.3 | a |
| (mmol/L) | 2 | 19 | 5.1 | / | 0.5 | a | 17 | 5.1 | / | 0.6 | a | 19 | 5.0 | / | 0.6 | a | 17 | 5.0 | / | 0.8 | a |
| Δ | 19 | 0.1 | / | 0.3 | a | 17 | 0.2 | / | 0.6 | a | 19 | −0.2 | / | 0.6 | a | 17 | 0.1 | / | 0.4 | a | |
| Insulin | 1 | 19 | 6.1 | / | 4.9 | a | 17 | 6.6 | / | 6.5 | a | 19 | 7.0 | / | 4.2 | a | 17 | 6.1 | / | 5.5 | a |
| (mU/L) | 2 | 19 | 6.8 | / | 4.4 | a | 17 | 6.3 | / | 4.1 | a | 19 | 7.3 | / | 4.3 | a | 17 | 6.5 | / | 3.0 | a |
| Δ | 19 | 0.7 | / | 2.4 | a | 17 | 0.6 | / | 2.8 | a | 19 | 0.7 | / | 2.9 | a | 17 | 0.4 | / | 2.3 | a | |
| Hemoglobin | 1 | 19 | 5.10 | / | 0.20 | a | 17 | 5.00 | / | 0.30 | a | 19 | 5.10 | / | 0.35 | a | 17 | 5.00 | / | 0.40 | a |
| A1c (%) | 2 | 19 | 5.00 | / | 0.30 | a | 17 | 5.00 | / | 0.20 | a | 19 | 5.00 | / | 0.60 | a | 17 | 5.00 | / | 0.30 | a |
| Δ | 19 | −0.10 | / | 0.15 | a | 17 | 0.00 | / | 0.20 | a | 19 | * −0.10 | / | 0.20 | a | 17 | 0.00 | / | 0.40 | a | |
Disclaimer/Publisher’s Note: The statements, opinions and data contained in all publications are solely those of the individual author(s) and contributor(s) and not of MDPI and/or the editor(s). MDPI and/or the editor(s) disclaim responsibility for any injury to people or property resulting from any ideas, methods, instructions or products referred to in the content. |
© 2023 by the authors. Licensee MDPI, Basel, Switzerland. This article is an open access article distributed under the terms and conditions of the Creative Commons Attribution (CC BY) license (https://creativecommons.org/licenses/by/4.0/).
Share and Cite
Sandgruber, F.; Höger, A.-L.; Kunze, J.; Schenz, B.; Griehl, C.; Kiehntopf, M.; Kipp, K.; Kühn, J.; Stangl, G.I.; Lorkowski, S.; et al. Impact of Regular Intake of Microalgae on Nutrient Supply and Cardiovascular Risk Factors: Results from the NovAL Intervention Study. Nutrients 2023, 15, 1645. https://doi.org/10.3390/nu15071645
Sandgruber F, Höger A-L, Kunze J, Schenz B, Griehl C, Kiehntopf M, Kipp K, Kühn J, Stangl GI, Lorkowski S, et al. Impact of Regular Intake of Microalgae on Nutrient Supply and Cardiovascular Risk Factors: Results from the NovAL Intervention Study. Nutrients. 2023; 15(7):1645. https://doi.org/10.3390/nu15071645
Chicago/Turabian StyleSandgruber, Fabian, Anna-Lena Höger, Julia Kunze, Benjamin Schenz, Carola Griehl, Michael Kiehntopf, Kristin Kipp, Julia Kühn, Gabriele I. Stangl, Stefan Lorkowski, and et al. 2023. "Impact of Regular Intake of Microalgae on Nutrient Supply and Cardiovascular Risk Factors: Results from the NovAL Intervention Study" Nutrients 15, no. 7: 1645. https://doi.org/10.3390/nu15071645
APA StyleSandgruber, F., Höger, A.-L., Kunze, J., Schenz, B., Griehl, C., Kiehntopf, M., Kipp, K., Kühn, J., Stangl, G. I., Lorkowski, S., & Dawczynski, C. (2023). Impact of Regular Intake of Microalgae on Nutrient Supply and Cardiovascular Risk Factors: Results from the NovAL Intervention Study. Nutrients, 15(7), 1645. https://doi.org/10.3390/nu15071645