
Association of Vegetable Consumption with Stroke in China: A Longitudinal Study

 , ,
, , 
Abstract
1. Introduction
2. Materials and Methods
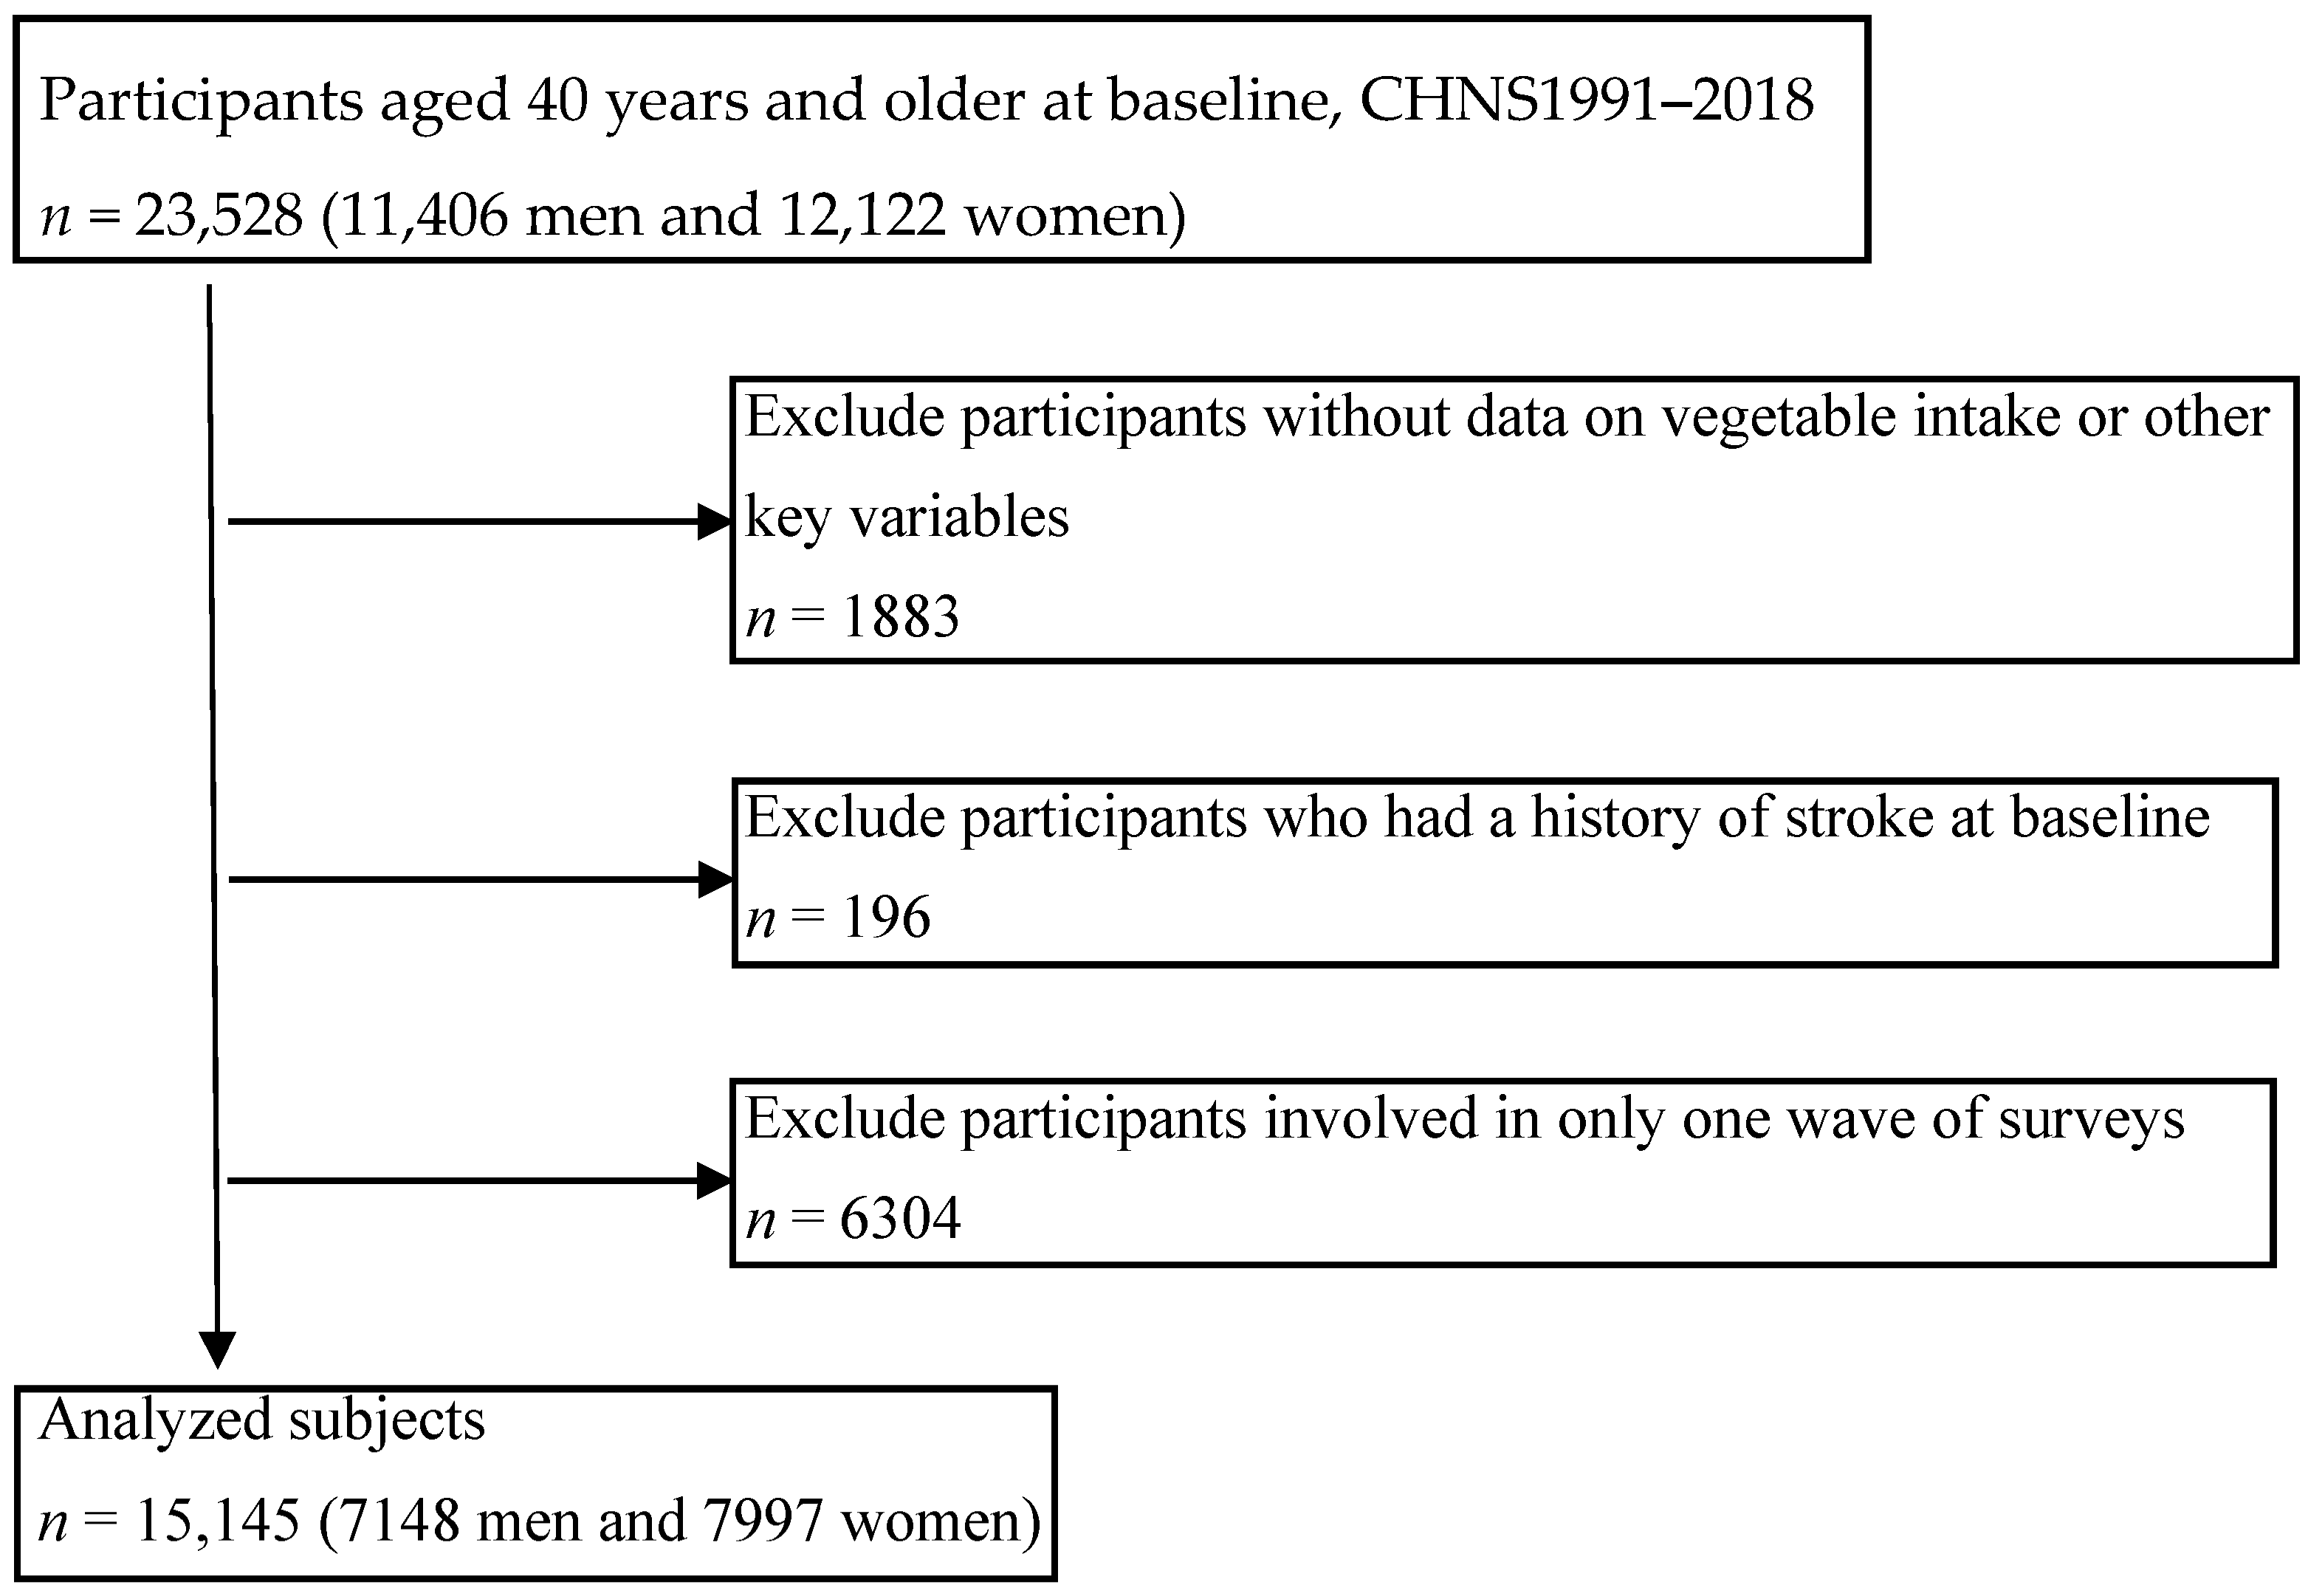
2.1. Study Population
2.2. Vegetable Intake and Other Measurements
2.3. Statistical Analysis
3. Results
4. Discussion
Strengthens and Limitations
5. Conclusions
Supplementary Materials
Author Contributions
Funding
Institutional Review Board Statement
Informed Consent Statement
Data Availability Statement
Acknowledgments
Conflicts of Interest
References
- Feigin, V.L.; Brainin, M.; Norrving, B.; Martins, S.; Sacco, R.L.; Hacke, W.; Fisher, M.; Pandian, J.; Lindsay, P. World Stroke Organization (WSO): Global Stroke Fact Sheet 2022. Int. J. Stroke 2022, 17, 18–29. [Google Scholar] [CrossRef] [PubMed]
- Boursin, P.; Paternotte, S.; Dercy, B.; Sabben, C.; Maïer, B. Semantics, epidemiology and semiology of stroke. Soins 2018, 63, 24–27. [Google Scholar] [CrossRef] [PubMed]
- Guzik, A.; Bushnell, C. Stroke Epidemiology and Risk Factor Management. Continuum Lifelong Learn. Neurol. 2017, 23, 15–39. [Google Scholar] [CrossRef] [PubMed]
- Della, C.F.; Vignazia, G.L.; Cavaglià, M.; La Mura, F.; Pelosi, G. Stroke patients, what to do and what to avoid. Minerva Anestesiol. 2002, 68, 273–277. [Google Scholar]
- Sun, Z.; Zheng, L.; Detrano, R.; Zhang, X.; Li, J.; Hu, D.; Sun, Y. An epidemiological survey of stroke among rural Chinese adults results from the Liaoning province. Int. J. Stroke 2013, 8, 701–706. [Google Scholar] [CrossRef]
- Wang, L.D.; Peng, B.; Zhang, H.Q.; Wang, Y.L.; Liu, M.; Shan, C.L.; Cao, L.; Wang, L.X.; Xie, W.; Wang, P.J.; et al. Brief report on stroke prevention and treatment in China, 2020. Chin. J. Cerebrovasc. Dis. 2022, 2, 136–144. [Google Scholar]
- Xiao, Y.; Su, C.; Ouyang, Y.; Zhang, B. Trends of vegetables and fruits consumption among Chinese adults aged 18 to 44 years old from 1991 to 2011. Chin. J. Epidemiol. 2015, 36, 232–236. [Google Scholar]
- Li, L.; Ouyang, Y.; Wang, H.; Huang, F.; Wang, Y.; Zhang, J.; Su, C.; Du, W.; Jia, X.; Jiang, H.; et al. Disparities in fresh fruit and vegetable intake by sociodemographic and behavioural factors among adults in China. Public Health Nutr. 2022, 25, 649–656. [Google Scholar] [CrossRef]
- Popkin, B.M.; Lu, B.; Zhai, F. Understanding the nutrition transition: Measuring rapid dietary changes in transitional countries. Public Health Nutr. 2002, 5, 947–953. [Google Scholar] [CrossRef]
- Zhai, F.; Wang, H.; Du, S.; He, Y.; Wang, Z.; Ge, K.; Popkin, B.M. Prospective study on nutrition transition in China. Nutr. Rev. 2009, 67 (Suppl. 1), S56–S61. [Google Scholar] [CrossRef]
- He, Y.; Zhao, L.; Yu, D.; Fang, H.; Yu, W.; Guo, Q.; Wang, X.; Yang, X.; Ma, G. Consumption of fruits and vegetables in Chinese adults from 2010 to 2012. Chin. J. Prev. Med. 2016, 50, 221–224. [Google Scholar]
- Ouyang, Y.; Zhang, B.; Wang, Z.; Su, C.; Zhang, J.; Du, W.; Jiang, H.; Huang, F.; Jia, X.; Wang, Y.; et al. Intake of vegetables and fruits among the Chinese aged 60 and above in 15 provinces (autonomous region and municipality) in 2015. J. Hyg. Res. 2019, 48, 23–27. [Google Scholar]
- Wang, S.S.; Lay, S.; Yu, H.N.; Shen, S.R. Dietary Guidelines for Chinese Residents (2016): Comments and comparisons. J. Zhejiang Univ. Sci. B 2016, 17, 649–656. [Google Scholar] [CrossRef] [PubMed]
- Alissa, E.M.; Ferns, G.A. Dietary fruits and vegetables and cardiovascular diseases risk. Crit. Rev. Food Sci. Nutr. 2017, 57, 1950–1962. [Google Scholar] [CrossRef] [PubMed]
- Wallace, T.C.; Bailey, R.L.; Blumberg, J.B.; Burton-Freeman, B.; Chen, C.O.; Crowe-White, K.M.; Drewnowski, A.; Hooshmand, S.; Johnson, E.; Lewis, R.; et al. Fruits, vegetables, and health: A comprehensive narrative, umbrella review of the science and recommendations for enhanced public policy to improve intake. Crit. Rev. Food Sci. Nutr. 2020, 60, 2174–2211. [Google Scholar] [CrossRef]
- Aune, D.; Giovannucci, E.; Boffetta, P.; Fadnes, L.T.; Keum, N.; Norat, T.; Greenwood, D.C.; Riboli, E.; Vatten, L.J.; Tonstad, S. Fruit and vegetable intake and the risk of cardiovascular disease, total cancer and all-cause mortality-a systematic review and dose-response meta-analysis of respective studies. Int. J. Epidemiol. 2017, 46, 1029–1056. [Google Scholar] [CrossRef]
- Guo, X.F.; Shao, X.F.; Li, J.M.; Li, S.; Li, K.L.; Li, D. Fruit and vegetable intake and liver cancer risk: A meta-analysis of prospective cohort studies. Food Funct. 2019, 10, 4478–4485. [Google Scholar] [CrossRef]
- Choi, Y.; Lee, J.E.; Bae, J.M.; Li, Z.M.; Kim, D.H.; Lee, M.S.; Ahn, Y.O.; Shin, M.H. Vegetable intake, but not fruit intake, is associated with a reduction in the risk of cancer incidence and mortality in middle-aged Korean men. J. Nutr. 2015, 145, 1249–1255. [Google Scholar] [CrossRef]
- Mori, N.; Shimazu, T.; Sasazuki, S.; Nozue, M.; Mutoh, M.; Sawada, N.; Iwasaki, M.; Yamaji, T.; Inoue, M.; Takachi, R.; et al. Cruciferous Vegetable Intake Is Inversely Associated with Lung Cancer Risk among Current Nonsmoking Men in the Japan Public Health Center (JPHC) Study. J. Nutr. 2017, 147, 841–849. [Google Scholar] [CrossRef]
- Liu, W.; Hu, B.; Dehghan, M.; Mente, A.; Wang, C.; Yan, R.; Rangarajan, S.; Tse, L.A.; Yusuf, S.; Liu, X.; et al. Fruit, vegetable, and legume intake and the risk of all-cause, cardiovascular, and cancer mortality: A prospective study. Clin. Nutr. 2021, 40, 4316–4323. [Google Scholar] [CrossRef]
- Rimm, E.B.; Ascherio, A.; Giovannucci, E.; Spiegelman, D.; Stampfer, M.J.; Willett, W.C. Vegetable, fruit, and cereal fiber intake and risk of coronary heart disease among men. J. Am. Med. Assoc. 1996, 275, 447–451. [Google Scholar] [CrossRef] [PubMed]
- Yoshizaki, T.; Ishihara, J.; Kotemori, A.; Yamamoto, J.; Kokubo, Y.; Saito, I.; Yatsuya, H.; Yamagishi, K.; Sawada, N.; Iwasaki, M.; et al. Association of Vegetable, Fruit, and Okinawan Vegetable Consumption with Incident Stroke and Coronary Heart Disease. J. Epidemiol. 2020, 30, 37–45. [Google Scholar] [CrossRef] [PubMed]
- Johnsen, S.P.; Overvad, K.; Stripp, C.; Tjønneland, A.; Husted, S.E.; Sørensen, H.T. Intake of fruit and vegetables and the risk of ischemic stroke in a cohort of Danish men and women. Am. J. Clin. Nutr. 2003, 78, 57–64. [Google Scholar] [CrossRef] [PubMed]
- Oude, G.L.; Verschuren, W.M.; Kromhout, D.; Ocké, M.C.; Geleijnse, J.M. Raw and processed fruit and vegetable consumption and 10-year stroke incidence in a population-based cohort study in the Netherlands. Eur. J. Clin. Nutr. 2011, 65, 791–799. [Google Scholar] [CrossRef] [PubMed]
- Larsson, S.C.; Virtamo, J.; Wolk, A. Total and specific fruit and vegetable consumption and risk of stroke: A prospective study. Atherosclerosis 2013, 227, 147–152. [Google Scholar] [CrossRef] [PubMed]
- Dauchet, L.; Amouyel, P.; Dallongeville, J. Fruit and vegetable consumption and risk of stroke: A meta-analysis of cohort studies. Neurology 2005, 65, 1193–1197. [Google Scholar] [CrossRef]
- Joshipura, K.J.; Ascherio, A.; Manson, J.E.; Stampfer, M.J.; Rimm, E.B.; Speizer, F.E.; Hennekens, C.H.; Spiegelman, D.; Willett, W.C. Fruit and vegetable intake in relation to risk of ischemic stroke. J. Am. Med. Assoc. 1999, 282, 1233–1239. [Google Scholar] [CrossRef]
- Miller, V.; Mente, A.; Dehghan, M.; Rangarajan, S.; Zhang, X.; Swaminathan, S.; Dagenais, G.; Gupta, R.; Mohan, V.; Lear, S.; et al. Fruit, vegetable, and legume intake, and cardiovascular disease and deaths in 18 countries (PURE): A prospective cohort study. Lancet 2017, 390, 2037–2049. [Google Scholar] [CrossRef]
- Popkin, B.M.; Du, S.; Zhai, F.; Zhang, B. Cohort Profile: The China Health and Nutrition Survey--monitoring and understanding socio-economic and health change in China, 1989–2011. Int. J. Epidemiol. 2010, 39, 1435–1440. [Google Scholar] [CrossRef]
- Zhang, B.; Zhai, F.Y.; Du, S.F.; Popkin, B.M. The China Health and Nutrition Survey, 1989–2011. Obes. Rev. 2014, 15 (Suppl. 1), 2–7. [Google Scholar] [CrossRef]
- Jia, X.; Wang, Z.; Zhang, B.; Su, C.; Du, W.; Zhang, J.; Zhang, J.; Jiang, H.; Huang, F.; Ouyang, Y.; et al. Food Sources and Potential Determinants of Dietary Vitamin C Intake in Chinese Adults: A Cross-Sectional Study. Nutrients 2018, 10, 320. [Google Scholar] [CrossRef] [PubMed]
- Zhang, J.; Wang, H.; Wang, Z.; Huang, F.; Zhang, X.; Du, W.; Su, C.; Ouyang, Y.; Li, L.; Bai, J.; et al. Trajectories of Dietary Patterns and Their Associations with Overweight/Obesity among Chinese Adults: China Health and Nutrition Survey 1991–2018. Nutrients 2021, 13, 2835. [Google Scholar] [CrossRef] [PubMed]
- Bai, J.; Wang, Y.; Zhang, X.F.; Ouyang, Y.F.; Zhang, B.; Wang, Z.H.; Du, S.F.; Wang, H.J. Associations of Sedentary Time and Physical Activity with Metabolic Syndrome among Chinese Adults: Results from the China Health and Nutrition Survey. Biomed. Environ. Sci. 2021, 34, 963–975. [Google Scholar]
- Zou, Q.; Su, C.; Du, W.; Wang, H.; Zhang, B.; Luo, S.; Tan, T.; Song, X.; Zhong, X.; Zhang, H.; et al. Longitudinal Association between Physical Activity, Blood Lipids, and Risk of Dyslipidemia among Chinese Adults: Findings from the China Health and Nutrition Surveys in 2009 and 2015. Nutrients 2023, 15, 341. [Google Scholar] [CrossRef] [PubMed]
- WS/T 428-2013; Criteria of Weight for Adults. Standards Press of China: Beijing, China, 2013.
- Gillman, M.W.; Cupples, L.A.; Gagnon, D.; Posner, B.M.; Ellison, R.C.; Castelli, W.P.; Wolf, P.A. Protective effect of fruits and vegetables on development of stroke in men. J. Am. Med. Assoc. 1995, 273, 1113–1117. [Google Scholar] [CrossRef]
- Bazzano, L.A.; He, J.; Ogden, L.G.; Loria, C.M.; Vupputuri, S.; Myers, L.; Whelton, P.K. Fruit and vegetable intake and risk of cardiovascular disease in US adults: The first National Health and Nutrition Examination Survey Epidemiologic Follow-up Study. Am. J. Clin. Nutr. 2002, 76, 93–99. [Google Scholar] [CrossRef]
- Oude, G.L.; Verschuren, W.M.; Kromhout, D.; Ocké, M.C.; Geleijnse, J.M. Variety in fruit and vegetable consumption and 10-year incidence of CHD and stroke. Public Health Nutr. 2012, 15, 2280–2286. [Google Scholar] [CrossRef]
- Steffen, L.M.; Jacobs, D.J.; Stevens, J.; Shahar, E.; Carithers, T.; Folsom, A.R. Associations of whole-grain, refined-grain, and fruit and vegetable consumption with risks of all-cause mortality and incident coronary artery disease and ischemic stroke: The Atherosclerosis Risk in Communities (ARIC) Study. Am. J. Clin. Nutr. 2003, 78, 383–390. [Google Scholar] [CrossRef]
- Terao, J. Dietary flavonoids as antioxidants. Forum Nutr. 2009, 61, 87–94. [Google Scholar]
- Cassidy, A.; Rimm, E.B.; O’Reilly, E.J.; Logroscino, G.; Kay, C.; Chiuve, S.E.; Rexrode, K.M. Dietary flavonoids and risk of stroke in women. Stroke 2012, 43, 946–951. [Google Scholar] [CrossRef]
- Goetz, M.E.; Judd, S.E.; Hartman, T.J.; McClellan, W.; Anderson, A.; Vaccarino, V. Flavanone Intake Is Inversely Associated with Risk of Incident Ischemic Stroke in the REasons for Geographic and Racial Differences in Stroke (REGARDS) Study. J. Nutr. 2016, 146, 2233–2243. [Google Scholar] [CrossRef] [PubMed]
- Cassidy, A.; Bertoia, M.; Chiuve, S.; Flint, A.; Forman, J.; Rimm, E.B. Habitual intake of anthocyanins and flavanones and risk of cardiovascular disease in men. Am. J. Clin. Nutr. 2016, 104, 587–594. [Google Scholar] [CrossRef] [PubMed]
- Slavin, J.L.; Lloyd, B. Health benefits of fruits and vegetables. Adv. Nutr. 2012, 3, 506–516. [Google Scholar] [CrossRef]
- Larsson, S.C.; Wolk, A. Dietary fiber intake is inversely associated with stroke incidence in healthy Swedish adults. J. Nutr. 2014, 144, 1952–1955. [Google Scholar] [CrossRef] [PubMed]
- Larsson, S.C.; Männistö, S.; Virtanen, M.J.; Kontto, J.; Albanes, D.; Virtamo, J. Dietary fiber and fiber-rich food intake in relation to risk of stroke in male smokers. Eur. J. Clin. Nutr. 2009, 63, 1016–1024. [Google Scholar] [CrossRef] [PubMed]
- Zhang, Z.; Xu, G.; Liu, D.; Zhu, W.; Fan, X.; Liu, X. Dietary fiber consumption and risk of stroke. Eur. J. Epidemiol. 2013, 28, 119–130. [Google Scholar] [CrossRef] [PubMed]
- Gariballa, S.E. Nutritional factors in stroke. Br. J. Nutr. 2000, 84, 5–17. [Google Scholar] [CrossRef]
- Cui, R.; Iso, H.; Date, C.; Kikuchi, S.; Tamakoshi, A. Dietary folate and vitamin b6 and B12 intake in relation to mortality from cardiovascular diseases: Japan collaborative cohort study. Stroke 2010, 41, 1285–1289. [Google Scholar] [CrossRef] [PubMed]
- Chang, C.Y.; Lai, Y.C.; Cheng, T.J.; Lau, M.T.; Hu, M.L. Plasma levels of antioxidant vitamins, selenium, total sulfhydryl groups and oxidative products in ischemic-stroke patients as compared to matched controls in Taiwan. Free Radic. Res. 1998, 28, 15–24. [Google Scholar] [CrossRef]
- Farashi, S.; Shahidi, S.; Sarihi, A.; Zarei, M. Association of vitamin A and its organic compounds with stroke—A systematic review and meta-analysis. Nutr. Neurosci. 2022, 1–15. [Google Scholar] [CrossRef]
- Chang, C.Y.; Chen, J.Y.; Ke, D.; Hu, M.L. Plasma levels of lipophilic antioxidant vitamins in acute ischemic stroke patients: Correlation to inflammation markers and neurological deficits. Nutrition 2005, 21, 987–993. [Google Scholar] [CrossRef] [PubMed]
- Yochum, L.A.; Folsom, A.R.; Kushi, L.H. Intake of antioxidant vitamins and risk of death from stroke in postmenopausal women. Am. J. Clin. Nutr. 2000, 72, 476–483. [Google Scholar] [CrossRef] [PubMed]


| Total | Vegetable Consumption (g/d) | p | |||||
|---|---|---|---|---|---|---|---|
| Q1 | Q2 | Q3 | Q4 | Q5 | |||
| Males (n = 7148) | |||||||
| Number of subjects | 7148 | 1234 | 1327 | 1407 | 1504 | 1676 | |
| Age (years) | 48.9(42.7, 59.2) | 53.7(44.4, 63.0) | 50.1(43.3, 60.8) | 48.7(42.5, 59.1) | 47.6(42.3, 57.5) | 46.6(42.2, 55.7) | <0.001 |
| Education level (%) | |||||||
| Primary school | 2944(41.2%) | 424(34.4%) | 482(36.3%) | 588(41.8%) | 628(41.8%) | 822(49.1%) | <0.001 |
| Middle school | 2173(30.4%) | 383(31.0%) | 420(31.7%) | 411(29.2%) | 469(31.2%) | 490(29.2%) | |
| High school and above | 2031(28.4%) | 427(34.6%) | 425(32.0%) | 408(29.0%) | 407(27.1%) | 364(21.7%) | |
| Geographic region (%) | <0.001 | ||||||
| Urban | 2842(39.8%) | 652(52.8%) | 618(46.6%) | 585(41.6%) | 546(36.3%) | 441(26.3%) | |
| Rural | 4306(60.2%) | 582(47.2%) | 709(53.4%) | 822(58.4%) | 958(63.7%) | 1235(73.7%) | |
| Working status | <0.001 | ||||||
| Employed | 5105(71.2%) | 728(59.0%) | 900(67.8%) | 1014(72.1%) | 1118(74.3%) | 1345(80.3%) | |
| Smoking | 4680(65.5%) | 803(65.1%) | 857(64.6%) | 929(66.0%) | 977(65.0%) | 1114(66.5%) | 0.799 |
| Drinking | 4532(63.4%) | 715(57.9%) | 817(61.6%) | 920(65.4%) | 984(65.4%) | 1096(65.4%) | <0.001 |
| Average per capita household income (EUR/year) | <0.001 | ||||||
| <1364.3 | 5223(73.1%) | 716(58.0%) | 896(67.5%) | 1085(77.1%) | 1174(78.1%) | 1352(80.7%) | |
| 1364.3–2728.6 | 977(13.7%) | 241(19.5%) | 214(16.1%) | 163(11.6%) | 170(11.3%) | 189(11.3%) | |
| >2728.6 | 948(13.3%) | 277(22.5%) | 217(16.4%) | 159(11.3%) | 160(10.6%) | 135(8.1%) | |
| Physical activity (met·hours/week) | <0.001 | ||||||
| <95 | 2435(34.1%) | 481(34.6%) | 528(37.5%) | 508(36.5%) | 474(33.1%) | 444(29.1%) | |
| 95–239 | 2364(33.1%) | 401(28.8%) | 461(32.8%) | 506(36.4%) | 503(35.1%) | 493(32.3%) | |
| >239 | 2349(32.9%) | 510(36.6%) | 418(29.7%) | 377(27.1%) | 456(31.8%) | 588(38.6%) | |
| Total vegetable (g/day) | 311.6(238.9, 391.7) | 175.1(144.3, 194.8) | 243.4(228.2, 258.3) | 300.0(286.5, 313.3) | 358.9(342.2, 376.8) | 466.2(426.7, 524.1) | <0.001 |
| Dark vegetable (g/day) | 66.7(33.3, 116.7) | 33.3(16.7, 59.0) | 50.3(26.7, 80.6) | 68.0(36.4, 106.4) | 84.5(45.7, 131.6) | 118.9(71.6, 175.2) | <0.001 |
| Meat intake (g/day) | 62.1(30.6, 100.0) | 46.2(20.3, 77.9) | 58.2(27.9, 91.7) | 63.9(33.3, 97.0) | 70.2(37.5, 108.6) | 73.9(34.6, 113.1) | <0.001 |
| Fish intake (g/day) | 20.0(0.0, 50.2) | 11.1(0.0, 40.0) | 19.2(0.0, 50.0) | 24.5(0.0, 53.9) | 21.3(0.0, 50.1) | 23.2(0.0, 57.7) | <0.001 |
| Fruit intake (g/day) | 13.3(0.0, 56.1) | 11.1(0.0, 53.3) | 17.9(0.0, 62.2) | 16.7(0.0, 64.2) | 16.2(0.0, 55.6) | 6.2(0.0, 46.8) | 0.002 |
| Sodium intake (mg/day) | 5203.6(4080.5, 6687.5) | 4702.6(3565.6, 6154.7) | 5044.0(3940.2, 6497.4) | 5189.8(4128.2, 6584.2) | 5236.1(4174.7, 6581.1) | 5674.0(4538.1, 7223.9) | <0.001 |
| Energy intake (kcal/day) | 2359.6(1882.2, 2856.0) | 2030.7(1626.1, 2499.9) | 2240.3(1777.5, 2708.1) | 2364.1(1905.6, 2831.1) | 2433.3(1980.5, 2944.6) | 2603.9(2141.7, 3120.0) | <0.001 |
| Fat intake (g/day) | 79.3(62.1, 99.6) | 72.2(55.6, 90.3) | 76.3(59.5, 94.8) | 78.1(62.8, 97.9) | 82.5(64.8, 102.2) | 86.7(66.7, 107.4) | <0.001 |
| Cholesterol intake (g/day) | 244.4(152.6, 346.9) | 221.9(128.5, 322.0) | 242.9(156.1, 344.7) | 241.8(163.9, 343.6) | 260.8(161.8, 363.3) | 249.9(153.2, 357.4) | <0.001 |
| BMI (kg/m2) | <0.001 | ||||||
| <18.5 | 353(4.9%) | 65(5.3%) | 53(4.0%) | 67(4.8%) | 76(5.1%) | 92(5.5%) | |
| 18.5~23.9 | 4091(57.2%) | 616(49.9%) | 697(52.5%) | 824(58.6%) | 896(59.6%) | 1058(63.1%) | |
| 24.0~27.9 | 2086(29.2%) | 422(34.2%) | 432(32.6%) | 416(29.6%) | 401(26.7%) | 415(24.8%) | |
| ≥28.0 | 618(8.7%) | 131(10.6%) | 145(10.9%) | 100(7.1%) | 131(8.7%) | 111(6.6%) | |
| History of disease (%) | |||||||
| Diabetes | 201(2.8%) | 55(4.5%) | 45(3.4%) | 31(2.2%) | 38(2.5%) | 32(1.9%) | <0.001 |
| Hypertension | 797(11.2%) | 203(16.5%) | 170(12.8%) | 146(10.4%) | 150(10.0%) | 128(7.6%) | <0.001 |
| Females (n = 7997) | |||||||
| Number of subjects | 7997 | 1795 | 1702 | 1622 | 1525 | 1353 | |
| Age (years) | 48.7(42.5, 59.1) | 52.7(43.6, 63.0) | 50.3(42.9, 60.7) | 48.1(42.4, 58.1) | 46.5(42.1, 56.5) | 45.9(41.9, 54.3) | <0.001 |
| Education level (%) | <0.001 | ||||||
| Primary school | 4565(57.1%) | 891(49.6%) | 949(55.8%) | 930(57.3%) | 928(60.9%) | 867(64.1%) | |
| Middle school | 1862(23.3%) | 462(25.7%) | 373(21.9%) | 388(23.9%) | 353(23.2%) | 286(21.1%) | |
| High school and above | 1570(19.6%) | 442(24.6%) | 380(22.3%) | 304(18.7%) | 244(16.0%) | 200(14.8%) | |
| Geographic region (%) | <0.001 | ||||||
| Urban | 3261(40.8%) | 938(52.3%) | 762(44.8%) | 678(41.8%) | 515(33.8%) | 368(27.2%) | |
| Rural | 4736(59.2%) | 857(47.7%) | 940(55.2%) | 944(58.2%) | 1010(66.2%) | 985(72.8%) | |
| Working status | <0.001 | ||||||
| Employed | 4345(54.3%) | 759(42.3%) | 852(50.1%) | 909(56.0%) | 931(61.1%) | 894(66.1%) | |
| Smoking | 390(4.9%) | 86(4.8%) | 110(6.5%) | 94(5.8%) | 64(4.2%) | 36(2.7%) | <0.001 |
| Drinking | 915(11.4%) | 176(9.8%) | 174(10.2%) | 201(12.4%) | 185(12.1%) | 179(13.2%) | 0.008 |
| Average per capita household income (EUR/year) | <0.001 | ||||||
| <1364.3 | 5776(72.2%) | 1066(59.4%) | 1202(70.6%) | 1236(76.2%) | 1177(77.2%) | 1095(80.9%) | |
| 1364.3–2728.6 | 1142(14.3%) | 339(18.9%) | 264(15.5%) | 185(11.4%) | 201(13.2%) | 153(11.3%) | |
| >2728.6 | 1079(13.5%) | 390(21.7%) | 236(13.9%) | 201(12.4%) | 147(9.6%) | 105(7.8%) | |
| Physical activity (met·hours/week) | <0.001 | ||||||
| <95 | 2611(32.7%) | 586(35.8%) | 558(34.4%) | 552(33.7%) | 526(32.9%) | 389(25.9%) | |
| 95–239 | 2685(33.6%) | 518(31.6%) | 572(35.3%) | 606(37.0%) | 516(32.3%) | 473(31.5%) | |
| >239 | 2701(33.8%) | 533(32.6%) | 492(30.3%) | 480(29.3%) | 555(34.8%) | 641(42.7%) | |
| Total vegetable (g/day) | 287.1(220.5, 363.1) | 170.8(140.2, 193.0) | 245.3(229.9, 258.8) | 297.5(283.9, 311.0) | 358.0(341.7, 376.6) | 463.9(424.3, 518.7) | <0.001 |
| Dark vegetable (g/day) | 65.5(32.5, 110.3) | 33.3(16.2, 56.7) | 54.4(29.0, 86.0) | 68.9(40.7, 105.8) | 89.5(51.0, 131.7) | 122.5(76.0, 183.4) | <0.001 |
| Meat intake (g/day) | 50.1(24.1, 82.3) | 34.8(15.0, 61.9) | 47.1(23.3, 77.2) | 56.0(28.2, 84.0) | 58.7(31.3, 92.3) | 60.5(29.2, 98.6) | <0.001 |
| Fish intake (g/day) | 16.7(0.0, 41.7) | 9.0(0.0, 33.3) | 16.7(0.0, 41.7) | 16.7(0.0, 40.2) | 19.0(0.0, 46.3) | 19.6(0.0, 50.0) | <0.001 |
| Fruit intake (g/day) | 23.0(0.0, 71.3) | 25.0(0.0, 76.9) | 28.0(0.0, 77.8) | 25.3(0.0, 75.0) | 20.0(0.0, 64.7) | 13.3(0.0, 57.5) | <0.001 |
| Sodium intake (mg/day) | 4573.7(3543.1, 5918.0) | 4058.5(3071.5, 5357.7) | 4447.2(3487.5, 5775.2) | 4543.3(3563.4, 5797.5) | 4722.1(3768.3, 6064.6) | 5235.6(4100.0, 6627.4) | <0.001 |
| Energy intake (kcal/day) | 1991.2(1574.6, 2462.8) | 1690.2(1363.4, 2135.1) | 1919.5(1534.8, 2383.1) | 2021.2(1649.9, 2441.3) | 2122.8(1673.7, 2589.0) | 2264.1(1857.9, 2746.9) | <0.001 |
| Fat intake (g/day) | 68.2(53.4, 85.6) | 61.0(47.7, 76.6) | 65.0(51.5, 82.2) | 69.3(54.5, 85.2) | 71.8(58.4, 89.0) | 76.5(58.3, 94.9) | <0.001 |
| Cholesterol intake (g/day) | 211.0(128.9, 307.9) | 194.4(110.1, 292.6) | 211.1(134.3, 304.4) | 214.7(134.7, 306.3) | 221.5(137.5, 317.5) | 216.0(127.5, 325.2) | <0.001 |
| BMI (kg/m2) | <0.001 | ||||||
| <18.5 | 424(5.3%) | 96(5.4%) | 84(4.9%) | 92(5.7%) | 72(4.7%) | 80(5.9%) | |
| 18.5~23.9 | 4246(53.1%) | 867(48.3%) | 873(51.3%) | 874(53.9%) | 846(55.5%) | 786(58.1%) | |
| 24.0~27.9 | 2486(31.1%) | 610(34.0%) | 565(33.2%) | 485(29.9%) | 453(29.7%) | 373(27.6%) | |
| ≥28.0 | 841(10.5%) | 222(12.4%) | 180(10.6%) | 171(10.5%) | 154(10.1%) | 114(8.4%) | |
| History of disease | |||||||
| Diabetes | 213(2.7%) | 66(3.7%) | 48(2.8%) | 28(1.7%) | 37(2.4%) | 34(2.5%) | 0.01 |
| Hypertension | 941(11.8%) | 275(15.3%) | 211(12.4%) | 196(12.1%) | 141(9.3%) | 118(8.7%) | <0.001 |
| Vegetable Consumption(g/d) | |||||
|---|---|---|---|---|---|
| Q1 | Q2 | Q3 | Q4 | Q5 | |
| Total | |||||
| Number of participants | 3029 | 3029 | 3029 | 3029 | 3029 |
| Person years | 19,793 | 29,200 | 32,753 | 33,777 | 35,067 |
| Number of cases | 70 | 120 | 125 | 99 | 90 |
| HR (95%CI) | |||||
| Model 1 | 1 | 0.93(0.69, 1.25) | 0.82(0.61, 1.10) | 0.62(0.45, 0.84) | 0.52(0.38, 0.71) |
| Model 2 | 1 | 1.14(0.84, 1.53) | 1.10(0.82, 1.49) | 0.90(0.65, 1.23) | 0.78(0.56, 1.09) |
| Model 3 | 1 | 1.18(0.87, 1.59) | 1.16(0.85, 1.57) | 0.95(0.69, 1.31) | 0.84(0.60, 1.18) |
| Model 4 | 1 | 1.16(0.86, 1.57) | 1.16(0.85, 1.57) | 0.93(0.67, 1.28) | 0.87(0.62, 1.22) |
| Males | |||||
| Number of participants | 1234 | 1327 | 1407 | 1504 | 1676 |
| Person years | 7624 | 12,108 | 14,800 | 16,480 | 19,224 |
| Number of cases | 32 | 67 | 71 | 69 | 64 |
| HR (95%CI) | |||||
| Model 1 | 1 | 1.01(0.66, 1.54) | 0.82(0.54, 1.26) | 0.70(0.46, 1.07) | 0.53(0.35, 0.82) |
| Model 2 | 1 | 1.32(0.86, 2.02) | 1.16(0.76, 1.78) | 1.13(0.73, 1.74) | 0.91(0.58, 1.42) |
| Model 3 | 1 | 1.41(0.92, 2.16) | 1.27(0.83, 1.95) | 1.26(0.81, 1.94) | 1.06(0.67, 1.66) |
| Model 4 | 1 | 1.38(0.90, 2.11) | 1.31(0.85, 2.01) | 1.24(0.80, 1.92) | 1.11(0.70, 1.75) |
| Females | |||||
| Number of participants | 1795 | 1702 | 1622 | 1525 | 1353 |
| Person years | 12,169 | 17,092 | 17,953 | 17,297 | 15,843 |
| Number of cases | 38 | 53 | 54 | 30 | 26 |
| HR (95%CI) | |||||
| Model 1 | 1 | 0.81(0.53, 1.23) | 0.75(0.49, 1.14) | 0.42(0.26, 0.69) | 0.39(0.23, 0.64) |
| Model 2 | 1 | 0.98 (0.64, 1.49) | 1.06(0.69, 1.63) | 0.64(0.39, 1.06) | 0.66(0.39, 1.11) |
| Model 3 | 1 | 0.96(0.63, 1.48) | 1.03(0.66, 1.59) | 0.61(0.37, 1.00) | 0.59(0.35, 1.03) |
| Model 4 | 1 | 0.99(0.65, 1.53) | 0.99(0.64, 1.53) | 0.60(0.36, 1.00) | 0.60(0.35, 1.04) |
| Dark Vegetable Consumption (g/d) | |||||
|---|---|---|---|---|---|
| Q1 | Q2 | Q3 | Q4 | Q5 | |
| Total | |||||
| Number of participants | 3029 | 3029 | 3029 | 3030 | 3028 |
| Person-years | 23,839 | 29,707 | 30,727 | 33,171 | 33,145 |
| Number of cases | 90 | 110 | 103 | 90 | 111 |
| HR (95%CI) | |||||
| Model 1 | 1 | 0.89(0.68, 1.18) | 0.78(0.59, 1.03) | 0.61(0.45, 0.82) | 0.75(0.56, 0.99) |
| Model 2 | 1 | 0.85(0.64, 1.13) | 0.74(0.55, 0.98) | 0.60(0.45, 0.81) | 0.79(0.59, 1.04) |
| Model 3 | 1 | 0.87(0.66, 1.16) | 0.77(0.57, 1.02) | 0.64(0.47, 0.87) | 0.85(0.63, 1.14) |
| Model 4 | 1 | 0.89(0.67, 1.18) | 0.80(0.60, 1.07) | 0.68(0.50, 0.92) | 1.01(0.75, 1.36) |
| Males | |||||
| Number of participants | 1392 | 1407 | 1391 | 1433 | 1525 |
| Person years | 10,923 | 13,598 | 13,541 | 15,385 | 16,789 |
| Number of cases | 52 | 63 | 58 | 59 | 71 |
| HR (95%CI) | |||||
| Model 1 | 1 | 0.89(0.62, 1.29) | 0.80(0.55, 1.16) | 0.68(0.47, 0.99) | 0.73(0.51, 1.05) |
| Model 2 | 1 | 0.83(0.57, 1.20) | 0.70(0.48, 1.02) | 0.66(0.46, 0.96) | 0.77(0.54, 1.10) |
| Model 3 | 1 | 0.88(0.60, 1.27) | 0.76(0.52, 1.12) | 0.75(0.51, 1.11) | 0.91(0.62, 1.32) |
| Model 4 | 1 | 0.90(0.62, 1.30) | 0.82(0.56, 1.20) | 0.81(0.55, 1.19) | 1.10(0.75, 1.60) |
| Females | |||||
| Number of participants | 1637 | 1622 | 1638 | 1597 | 1503 |
| Person years | 12,916 | 16,110 | 17,186 | 17,786 | 16,356 |
| Number of cases | 38 | 47 | 45 | 31 | 40 |
| HR (95%CI) | |||||
| Model 1 | 1 | 0.91(0,59, 1.39) | 0.78(0.51, 1.21) | 0.51(0.31, 0.81) | 0.71(0.46, 1.11) |
| Model 2 | 1 | 0.89(0.58, 1.37) | 0.78(0.50, 1.21) | 0.51(0.32, 0.82) | 0.80(0.51, 1.26) |
| Model 3 | 1 | 0.85(0.55, 1.32) | 0.74(0.47, 1.15) | 0.47(0.28, 0.76) | 0.72(0.45, 1.16) |
| Model 4 | 1 | 0.88(0.57, 1.36) | 0.72(0.46, 1.13) | 0.49(0.30, 0.80) | 0.82(0.50, 1.33) |
Disclaimer/Publisher’s Note: The statements, opinions and data contained in all publications are solely those of the individual author(s) and contributor(s) and not of MDPI and/or the editor(s). MDPI and/or the editor(s) disclaim responsibility for any injury to people or property resulting from any ideas, methods, instructions or products referred to in the content. |
© 2023 by the authors. Licensee MDPI, Basel, Switzerland. This article is an open access article distributed under the terms and conditions of the Creative Commons Attribution (CC BY) license (https://creativecommons.org/licenses/by/4.0/).
Share and Cite
Lv, M.; Su, C.; Huang, F.; Wang, H.; Wang, Z.; Zhang, B.; Du, W. Association of Vegetable Consumption with Stroke in China: A Longitudinal Study. Nutrients 2023, 15, 1583. https://doi.org/10.3390/nu15071583
Lv M, Su C, Huang F, Wang H, Wang Z, Zhang B, Du W. Association of Vegetable Consumption with Stroke in China: A Longitudinal Study. Nutrients. 2023; 15(7):1583. https://doi.org/10.3390/nu15071583
Chicago/Turabian StyleLv, Meiru, Chang Su, Feifei Huang, Huijun Wang, Zhihong Wang, Bing Zhang, and Wenwen Du. 2023. "Association of Vegetable Consumption with Stroke in China: A Longitudinal Study" Nutrients 15, no. 7: 1583. https://doi.org/10.3390/nu15071583
APA StyleLv, M., Su, C., Huang, F., Wang, H., Wang, Z., Zhang, B., & Du, W. (2023). Association of Vegetable Consumption with Stroke in China: A Longitudinal Study. Nutrients, 15(7), 1583. https://doi.org/10.3390/nu15071583