Author Contributions
Conceptualization, M.D., S.P., E.S., E.D.F., G.N., S.F.V. and L.C.; investigation, G.M., S.P., N.M., F.G. (Flavio Giavarini), F.G. (Francesca Genova), M.F. and C.P.; supervision, E.S., M.D. and E.D.F.; data analysis, G.M., S.P., F.G. (Francesca Genova), M.F. and C.P., writing and editing, S.P., M.D., E.S. and E.D.F. All authors have read and agreed to the published version of the manuscript.
Figure 1.
Effect of Castanea sativa Mill. leaf extracts on IL-8 release. GES-1 cells were treated for 6 h with TNFα (10 ng/mL) or H. pylori (ratio 50:1, bacteria/cell), in addition to leaf extracts before (A,B) and after in vitro simulated digestion (C,D). IL-8 was measured by ELISA assay. Results are expressed as the mean ± SEM (n = 3) of the relative percentage in comparison to stimulus (black bar), to which the value of 100% was arbitrarily assigned. * p < 0.05, ** p < 0.01, and *** p < 0.001 vs. stimulus. VR, Castanea sativa Mill. var. verdesa leaf extract; VN, Castanea sativa Mill. var. venegon leaf extract; dig., in vitro simulated digestion.
Figure 2.
Effect of ellagitannins from Castanea sativa Mill. on IL-8 release. GES-1 cells were treated for 6 h with TNFα (10 ng/mL) (A) or H. pylori (ratio 50:1, bacteria:cell) (B), in the presence of castalagin or vescalagin. IL-8 was measured by ELISA assay. Results are expressed as the mean ± SEM (n = 3) of the relative percentage in comparison to stimulus (black bar), to which the value of 100% was arbitrarily assigned. ** p < 0.01, and *** p < 0.001 vs. stimulus.
Figure 3.
Effect of Castanea sativa Mill. leaf extracts on NF-κB (p65) nuclear translocation induced by TNFα. GES-1 cells were treated for 1 h with TNFα (10 ng/mL) in addition to leaf extracts (200 μg/mL) before and after in vitro simulated digestion. NF-κB (red) nuclear translocation from the cell cytoplasm into the nuclei (DAPI, blue) was detected by confocal immunofluorescence microscopy (63× objective). Merged images include β-actin staining (green). VR, Castanea sativa Mill. var. verdesa leaf extract; VN, Castanea sativa Mill. var. venegon leaf extract; dig., in vitro simulated digestion.
Figure 4.
Effect of Castanea sativa Mill. leaf extracts on NF-κB (p65) nuclear translocation induced by H. pylori. GES-1 cells were treated for 1 h with H. pylori (ratio 50:1, bacteria/cell) in addition to leaf extracts (200 μg/mL) before and after in vitro simulated digestion. NF-κB (red) nuclear translocation from the cell cytoplasm into the nuclei (blue) was detected by confocal immunofluorescence microscopy (63× objective). Merged images include β-actin (green) and bacterial DNA (CFSE, white) staining. VR, Castanea sativa Mill. var. verdesa leaf extract; VN, Castanea sativa Mill. var. venegon leaf extract; dig., in vitro simulated digestion.
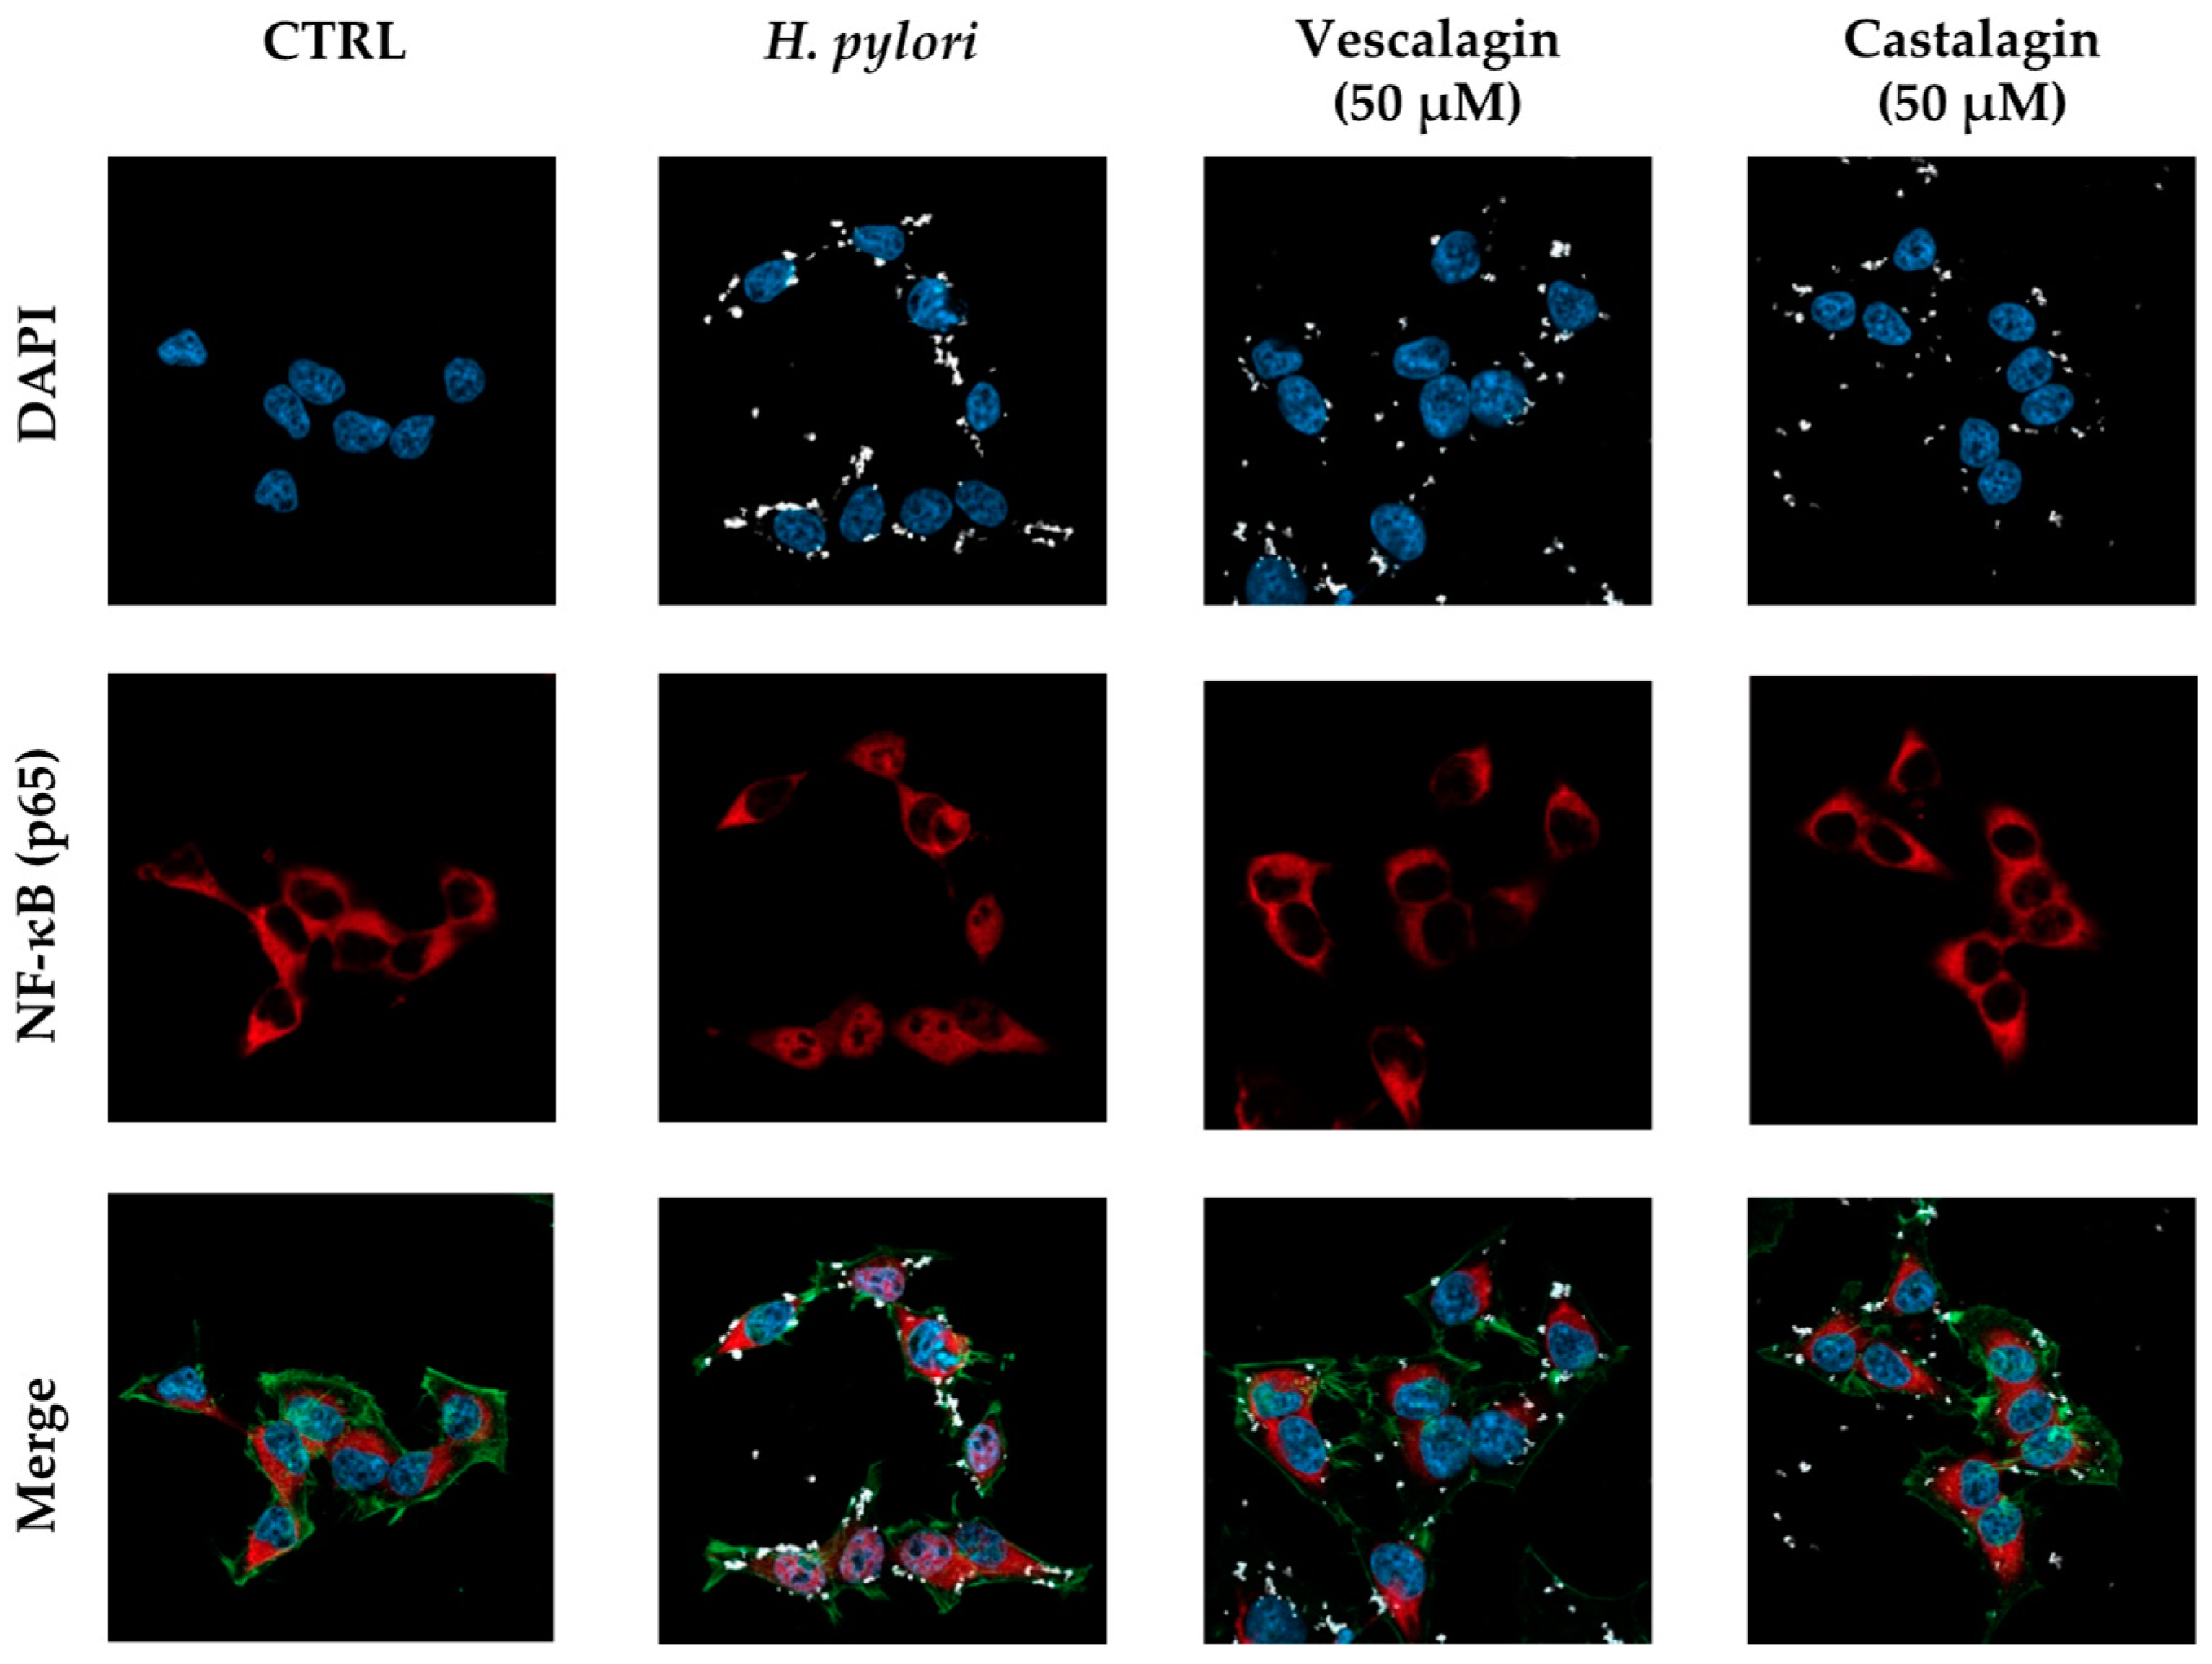
Figure 5.
Effect of ellagitannins from Castanea sativa Mill. on NF-κB (p65) nuclear translocation induced by H. pylori. GES-1 cells were treated for 1 h with H. pylori (ratio 50:1, bacteria/cell) in addition to the ellagitannin isomers castalagin and vescalagin (50 μM). NF-κB (red) nuclear translocation from the cell cytoplasm into the nuclei (blue) was detected by confocal immunofluorescence microscopy (63× objective). Merged images include β-actin (green) and bacterial DNA (CFSE, white) staining. Cast., castalagin; Vesc., vescalagin.
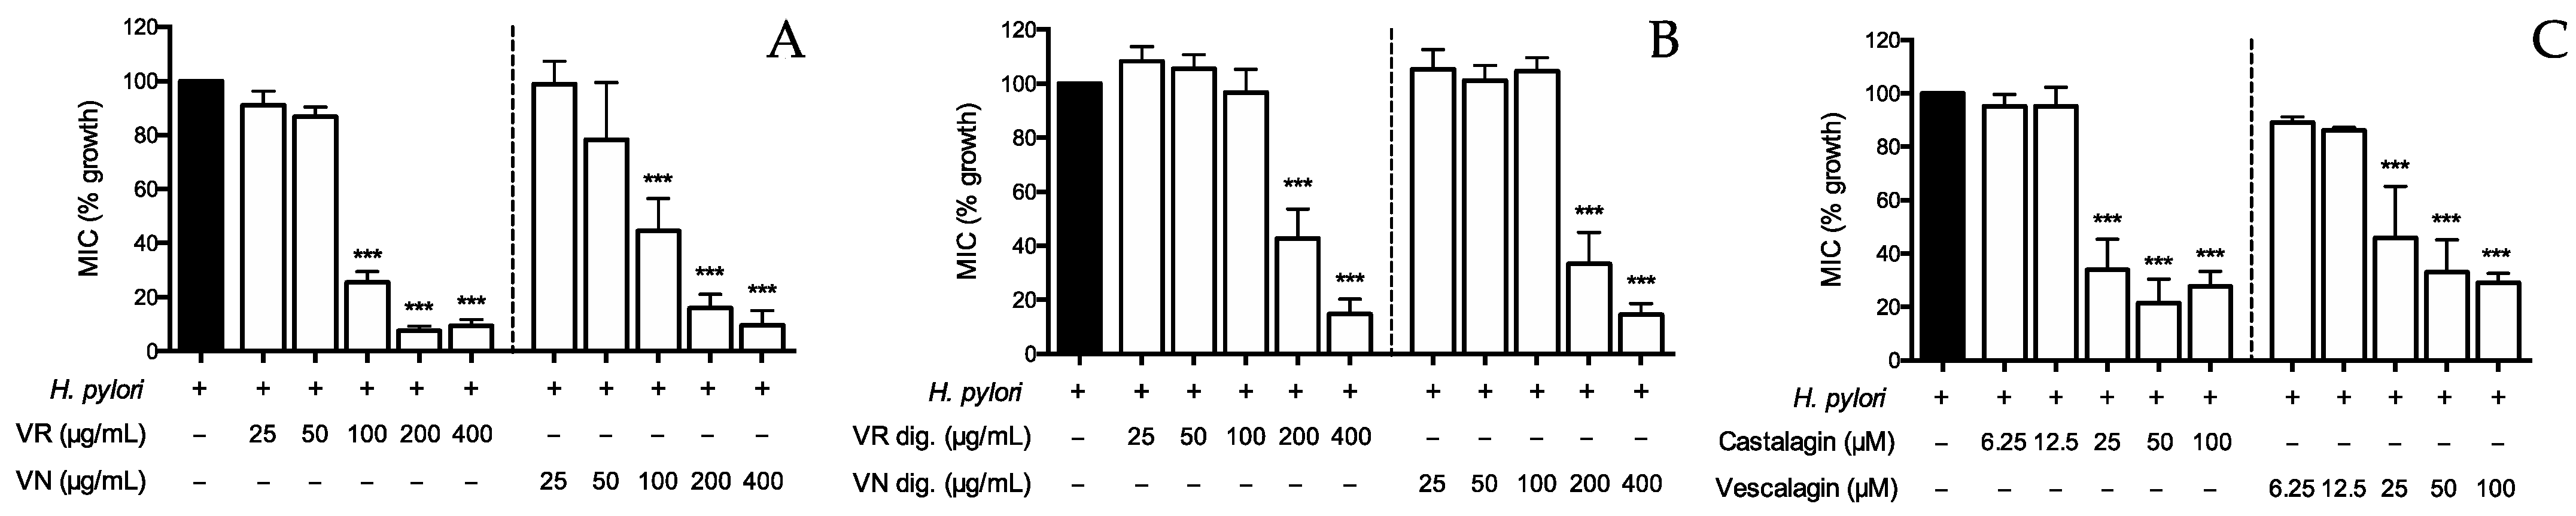
Figure 6.
Effect of Castanea sativa Mill. leaf extracts and ellagitannins on H. pylori growth. H. pylori (OD = 0.1) was treated for 72 h with leaf extracts before (A) and after (B) in vitro simulated digestion, or ellagitannins (C). The rate of bacterial growth was measured as optical density (600 nm) using a photometer. Results are expressed as the mean ± SEM (n = 3) of the relative percentage in comparison to H. pylori growth (black bar), to which the value of 100% was arbitrarily assigned. *** p < 0.001 vs. H. pylori. MIC, minimum inhibitory concentration; VR, Castanea sativa Mill. var. verdesa leaf extract; VN, Castanea sativa Mill. var. venegon leaf extract; dig., in vitro simulated digestion.
Figure 7.
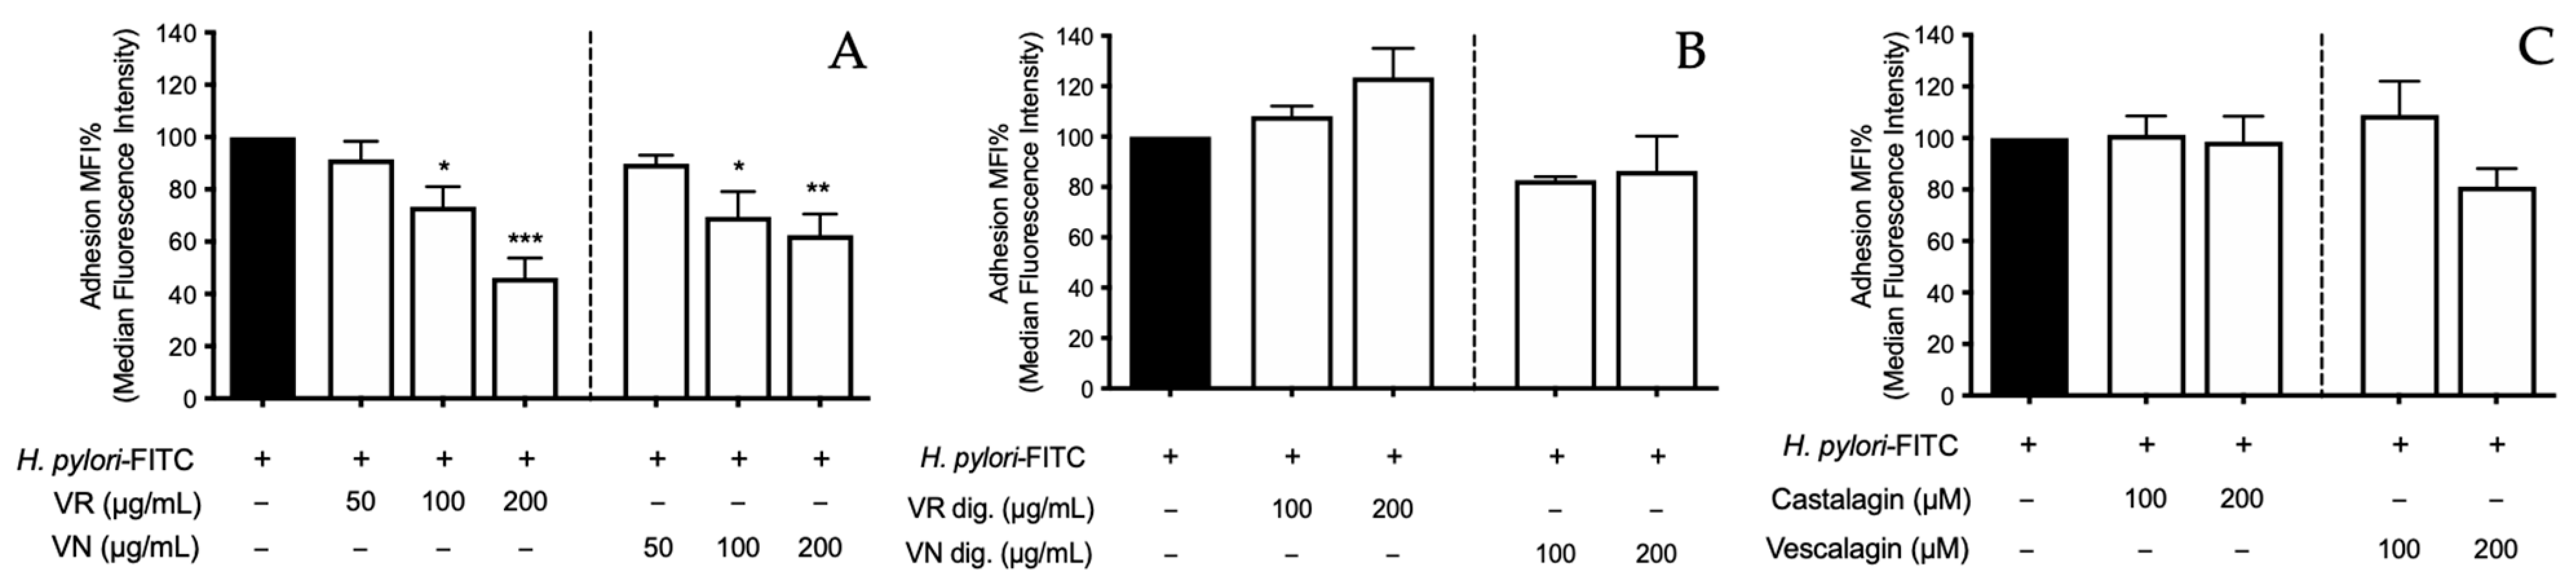
Effect of Castanea sativa Mill. leaf extracts and pure ellagitannins on H. pylori adhesion. GES-1 cells were treated for 1 h with H. pylori-FITC (ratio 50:1, bacteria/cell), in addition to leaf extracts before (A) and after (B) in vitro simulated digestion, or ellagitannins (C). The bacterial adhesion to GES-1 cells was measured as fluorescence intensity using a cytofluorimeter. Results re expressed as the mean ± SEM (n = 3) of the relative percentage in comparison to H. pylori infection (black bar), to which the value of 100% was arbitrarily assigned. * p < 0.05, ** p < 0.01, and *** p < 0.001 vs. H. pylori. MFI%, median fluorescence intensity; FITC, fluorescein isothiocyanate; VR, Castanea sativa Mill. var. verdesa leaf extract; VN, Castanea sativa Mill. var. venegon leaf extract; dig., in vitro simulated digestion.
Figure 7.
Effect of Castanea sativa Mill. leaf extracts and pure ellagitannins on H. pylori adhesion. GES-1 cells were treated for 1 h with H. pylori-FITC (ratio 50:1, bacteria/cell), in addition to leaf extracts before (A) and after (B) in vitro simulated digestion, or ellagitannins (C). The bacterial adhesion to GES-1 cells was measured as fluorescence intensity using a cytofluorimeter. Results re expressed as the mean ± SEM (n = 3) of the relative percentage in comparison to H. pylori infection (black bar), to which the value of 100% was arbitrarily assigned. * p < 0.05, ** p < 0.01, and *** p < 0.001 vs. H. pylori. MFI%, median fluorescence intensity; FITC, fluorescein isothiocyanate; VR, Castanea sativa Mill. var. verdesa leaf extract; VN, Castanea sativa Mill. var. venegon leaf extract; dig., in vitro simulated digestion.
Figure 8.
Preventive effect of Castanea sativa Mill. leaf extracts and ellagitannins on H. pylori adhesion. GES-1 cells were treated for 1 h with leaf extracts before (A) and after (B), or ellagitannins (C) in vitro simulated digestion, prior to H. pylori-FITC infection (ratio 50:1, bacteria/cell). The bacterial adhesion to GES-1 cells was measured as fluorescence intensity by cytofluorimeter. Results are expressed as the mean ± SEM (n = 3) of the relative percentage in comparison to H. pylori growth (black bar), to which the value of 100% was arbitrarily assigned. * p < 0.05, ** p < 0.01, and *** p < 0.001 vs. H. pylori. MFI%, median fluorescence intensity; FITC, fluorescein isothiocyanate; VR, Castanea sativa Mill. var. verdesa leaves extract; VN, Castanea sativa Mill. var. venegon leaves extract; dig., in vitro simulated digestion.
Figure 9.
Heatmap showing the trend of the 36 differentially expressed genes between samples treated with H. pylori and samples treated with both H. pylori and castalagin (A). Volcano plot representing the downregulated and upregulated genes with blue and red dots, respectively (B).
Figure 9.
Heatmap showing the trend of the 36 differentially expressed genes between samples treated with H. pylori and samples treated with both H. pylori and castalagin (A). Volcano plot representing the downregulated and upregulated genes with blue and red dots, respectively (B).
Table 1.
Results of linear regression analysis of the LC-MS/MS.
Table 1.
Results of linear regression analysis of the LC-MS/MS.
| Compound | Equation | R2 | LOD (ng/μL) | LOQ (ng/μL) |
|---|
| Castalagin | y = 74284x − 727.79 | 0.9999 | 0.012 | 0.015 |
| Vescalagin | y = 7929.8x − 46.85 | 0.9998 | 0.026 | 0.053 |
Table 2.
Total phenolic content (wt.% GA eq./wt.% d.e.) of extracts from Castanea sativa Mill. leaves.
Table 2.
Total phenolic content (wt.% GA eq./wt.% d.e.) of extracts from Castanea sativa Mill. leaves.
| | Before Gastric Digestion | After Gastric Digestion |
|---|
| Total Phenol Content | GA eq. (% w/w) ± SEM | GA eq. (% w/w) ± SEM |
| VR | 28.97 ± 0.47 | 19.1 ± 0.81 *** |
| VN | 26.59 ± 1.05 | 23.26 ± 1.28 |
Table 3.
Characterization of ellagitannins from Castanea sativa Mill. leaf extracts.
Table 3.
Characterization of ellagitannins from Castanea sativa Mill. leaf extracts.
| | Before Gastric Digestion | After Gastric Digestion |
|---|
| Ellagitannins (Castalagin) | Mean ± SEM (μg/mg) | Mean ± SEM (μg/mg) |
| VR | 5.79 ± 0.2 | 2.26 ± 0.04 *** |
| VN | 5.88 ± 0.1 | 4.07 ± 0.08 *** |
| Ellagitannins (Vescalagin) | Mean ± SEM (μg/mg) | Mean ± SEM (μg/mg) |
| VR | 4.90 ± 0.27 | N.D. *** |
| VN | 6.48 ± 0.27 | N.D. *** |
Table 4.
IC50 (μg/mL) of the Castanea sativa Mill. extracts on IL-8 release.
Table 4.
IC50 (μg/mL) of the Castanea sativa Mill. extracts on IL-8 release.
| | Before Gastric Digestion | After Gastric Digestion |
|---|
| Extracts vs. TNFα | IC50 (μg/mL) | CI (95%) | IC50 (μg/mL) | CI (95%) |
| VR | 6.81 | 4.64 to 9.99 | 9.31 | 6.51 to 13.33 |
| VN | 4.30 | 2.11 to 8.79 | 7.09 | 2.96 to 16.74 |
| Extracts vs. H. pylori | IC50 (μg/mL) | CI (95%) | IC50 (μg/mL) | CI (95%) |
| VR | 28.22 | 19.77 to 40.28 | 70.76 | 52.14 to 96.03 |
| VN | 27.76 | 18.14 to 42.48 | 60.57 | 49.94 to 73.47 |
Table 5.
IC50 (μM) of IL-8 release: ellagitannins from Castanea sativa Mill.
Table 5.
IC50 (μM) of IL-8 release: ellagitannins from Castanea sativa Mill.
| Ellagitannins vs. TNFα | IC50 (μM) | CI (95%) |
| Castalagin | 0.27 | 0.20 to 0.38 |
| Vescalagin | 0.22 | 0.07 to 0.66 |
| Ellagitannins vs. H. pylori | IC50 (μM) | CI (95%) |
| Castalagin | 11.70 | 7.65 to 17.89 |
| Vescalagin | 10.86 | 5.28 to 22.35 |
Table 6.
Table showing the 36 DEGs from RNA-seq analysis. Genes are reported with both the Ensembl ID and Gene Symbol.
Table 6.
Table showing the 36 DEGs from RNA-seq analysis. Genes are reported with both the Ensembl ID and Gene Symbol.
| | H. pylori vs. Castalagin | H. pylori vs. CTRL |
|---|
| Gene ID | Gene Symbol | Log2FoldChange | Padj | Log2FoldChange | Padj |
|---|
| ENSG00000169715 | MT1E | −1.725 | 0.000 | 1.142 | 0.000 |
| ENSG00000118523 | CCN2 | −0.853 | 0.000 | 1.069 | 0.000 |
| ENSG00000120738 | EGR1 | −1.190 | 0.000 | 3.966 | 0.000 |
| ENSG00000187193 | MT1X | −1.377 | 0.000 | 0.777 | 0.000 |
| ENSG00000125968 | ID1 | −0.823 | 0.000 | No change | - |
| ENSG00000072274 | TFRC | 0.814 | 0.000 | −0.682 | 0.000 |
| ENSG00000148677 | ANKRD1 | −1.087 | 0.000 | 0.956 | 0.000 |
| ENSG00000116285 | ERRFI1 | −0.669 | 0.000 | 2.540 | 0.000 |
| ENSG00000187678 | SPRY4 | −1.181 | 0.000 | 2.585 | 0.000 |
| ENSG00000175592 | FOSL1 | −0.677 | 0.000 | 3.425 | 0.000 |
| ENSG00000142627 | EPHA2 | −0.659 | 0.000 | 1.805 | 0.000 |
| ENSG00000120875 | DUSP4 | −0.808 | 0.000 | 1.559 | 0.000 |
| ENSG00000115844 | DLX2 | −0.757 | 0.000 | 1.947 | 0.000 |
| ENSG00000171617 | ENC1 | −0.675 | 0.000 | 0.699 | 0.000 |
| ENSG00000117228 | GBP1 | −0.902 | 0.000 | 1.952 | 0.000 |
| ENSG00000275342 | PRAG1 | −0.848 | 0.000 | No change | - |
| ENSG00000185022 | MAFF | −0.586 | 0.000 | 4.396 | 0.000 |
| ENSG00000138166 | DUSP5 | −0.663 | 0.000 | 2.125 | 0.000 |
| ENSG00000139211 | AMIGO2 | −0.612 | 0.000 | 0.892 | 0.000 |
| ENSG00000125148 | MT2A | −0.773 | 0.000 | 0.856 | 0.000 |
| ENSG00000170345 | FOS | −0.767 | 0.000 | 0.954 | 0.000 |
| ENSG00000163435 | ELF3 | 0.731 | 0.000 | No change | - |
| ENSG00000101665 | SMAD7 | −0.670 | 0.000 | No change | - |
| ENSG00000168389 | MFSD2A | −0.663 | 0.000 | 2.679 | 0.000 |
| ENSG00000170385 | SLC30A1 | −0.969 | 0.000 | 2.064 | 0.000 |
| ENSG00000127124 | HIVEP3 | −0.626 | 0.000 | 1.717 | 0.000 |
| ENSG00000176907 | TCIM | −0.636 | 0.000 | 1.969 | 0.000 |
| ENSG00000132334 | PTPRE | −0.620 | 0.000 | 1.424 | 0.000 |
| ENSG00000117226 | GBP3 | −0.593 | 0.000 | 1.082 | 0.000 |
| ENSG00000139318 | DUSP6 | −0.791 | 0.000 | No change | - |
| ENSG00000240891 | PLCXD2 | −0.632 | 0.001 | 0.796 | 0.000 |
| ENSG00000159167 | STC1 | −0.720 | 0.004 | 1.767 | 0.000 |
| ENSG00000282057 | ENSG00000282057 | −0.641 | 0.005 | No change - | - |
| ENSG00000162692 | VCAM1 | 0.650 | 0.007 | 2.183 | 0.000 |
| ENSG00000186567 | CEACAM19 | −0.632 | 0.018 | 2.463 | 0.000 |
| ENSG00000273136 | NBPF26 | −0.604 | 0.027 | No change | - |
Table 7.
Table showing the identified enriched pathways using the 33 downregulated DEGs.
Table 7.
Table showing the identified enriched pathways using the 33 downregulated DEGs.
| Term | Overlap | p Value | Padj | Genes |
|---|
| Cellular divalent inorganic cation homeostasis (GO:0072503) | 5 | 1.01 × 10⁻⁸ | 8.93 × 10⁻⁹ | MT2A; STC1; MT1X; SLC30A1; MT1E |
| Cellular response to cytokine stimulus (GO:0071345) | 7 | 1.12 × 10⁻⁹ | 0.0005 | EGR1; MT2A; ANKRD1; MT1X; FOS; GBP1; GBP3 |
| Regulation of ERK1 and ERK2 cascade (GO:0070372) | 5 | 4.14 × 10⁻⁹ | 0.001 | DUSP4; CCN2; GBP1; DUSP6; EPHA2 |
| Regulation of transcription, DNA-templated (GO:0006355) | 10 | 0.002 | 0.025 | FOSL1; EGR1; DLX2; TCIM; ID1; MAFF; ANKRD1; HIVEP3; FOS; SMAD7 |
| Regulation of transcription by RNA polymerase II (GO:0006357) | 9 | 0.008 | 0.055 | FOSL1; EGR1; DLX2; ID1; MAFF; ANKRD1; HIVEP3; FOS; SMAD7 |
| Positive regulation of transcription, DNA-templated (GO:0045893) | 6 | 0.012 | 0.062 | FOSL1; EGR1; MAFF; HIVEP3; FOS; SMAD7 |
| Positive regulation of transcription by RNA polymerase II (GO:0045944) | 5 | 0.012 | 0.066 | FOSL1; EGR1; MAFF; FOS; SMAD7 |
| Cellular protein modification process (GO:0006464) | 5 | 0.025 | 0.081 | DUSP4; DUSP5; PTPRE; PRAG1; DUSP6 |

 ,
, 


