
Comparison of the Activity of Fecal Enzymes and Concentration of SCFA in Healthy and Overweight Children

 , ,
, ,  ,
,  ,
,  and
and
Abstract
1. Introduction
2. Materials and Methods
2.1. Biological Material
2.2. Activity of Fecal Enzymes
2.3. Concentration of Lactic Acid, SCFAs and BCFAs
2.4. Statistical Analysis
3. Results
3.1. Analysis of Metabolites
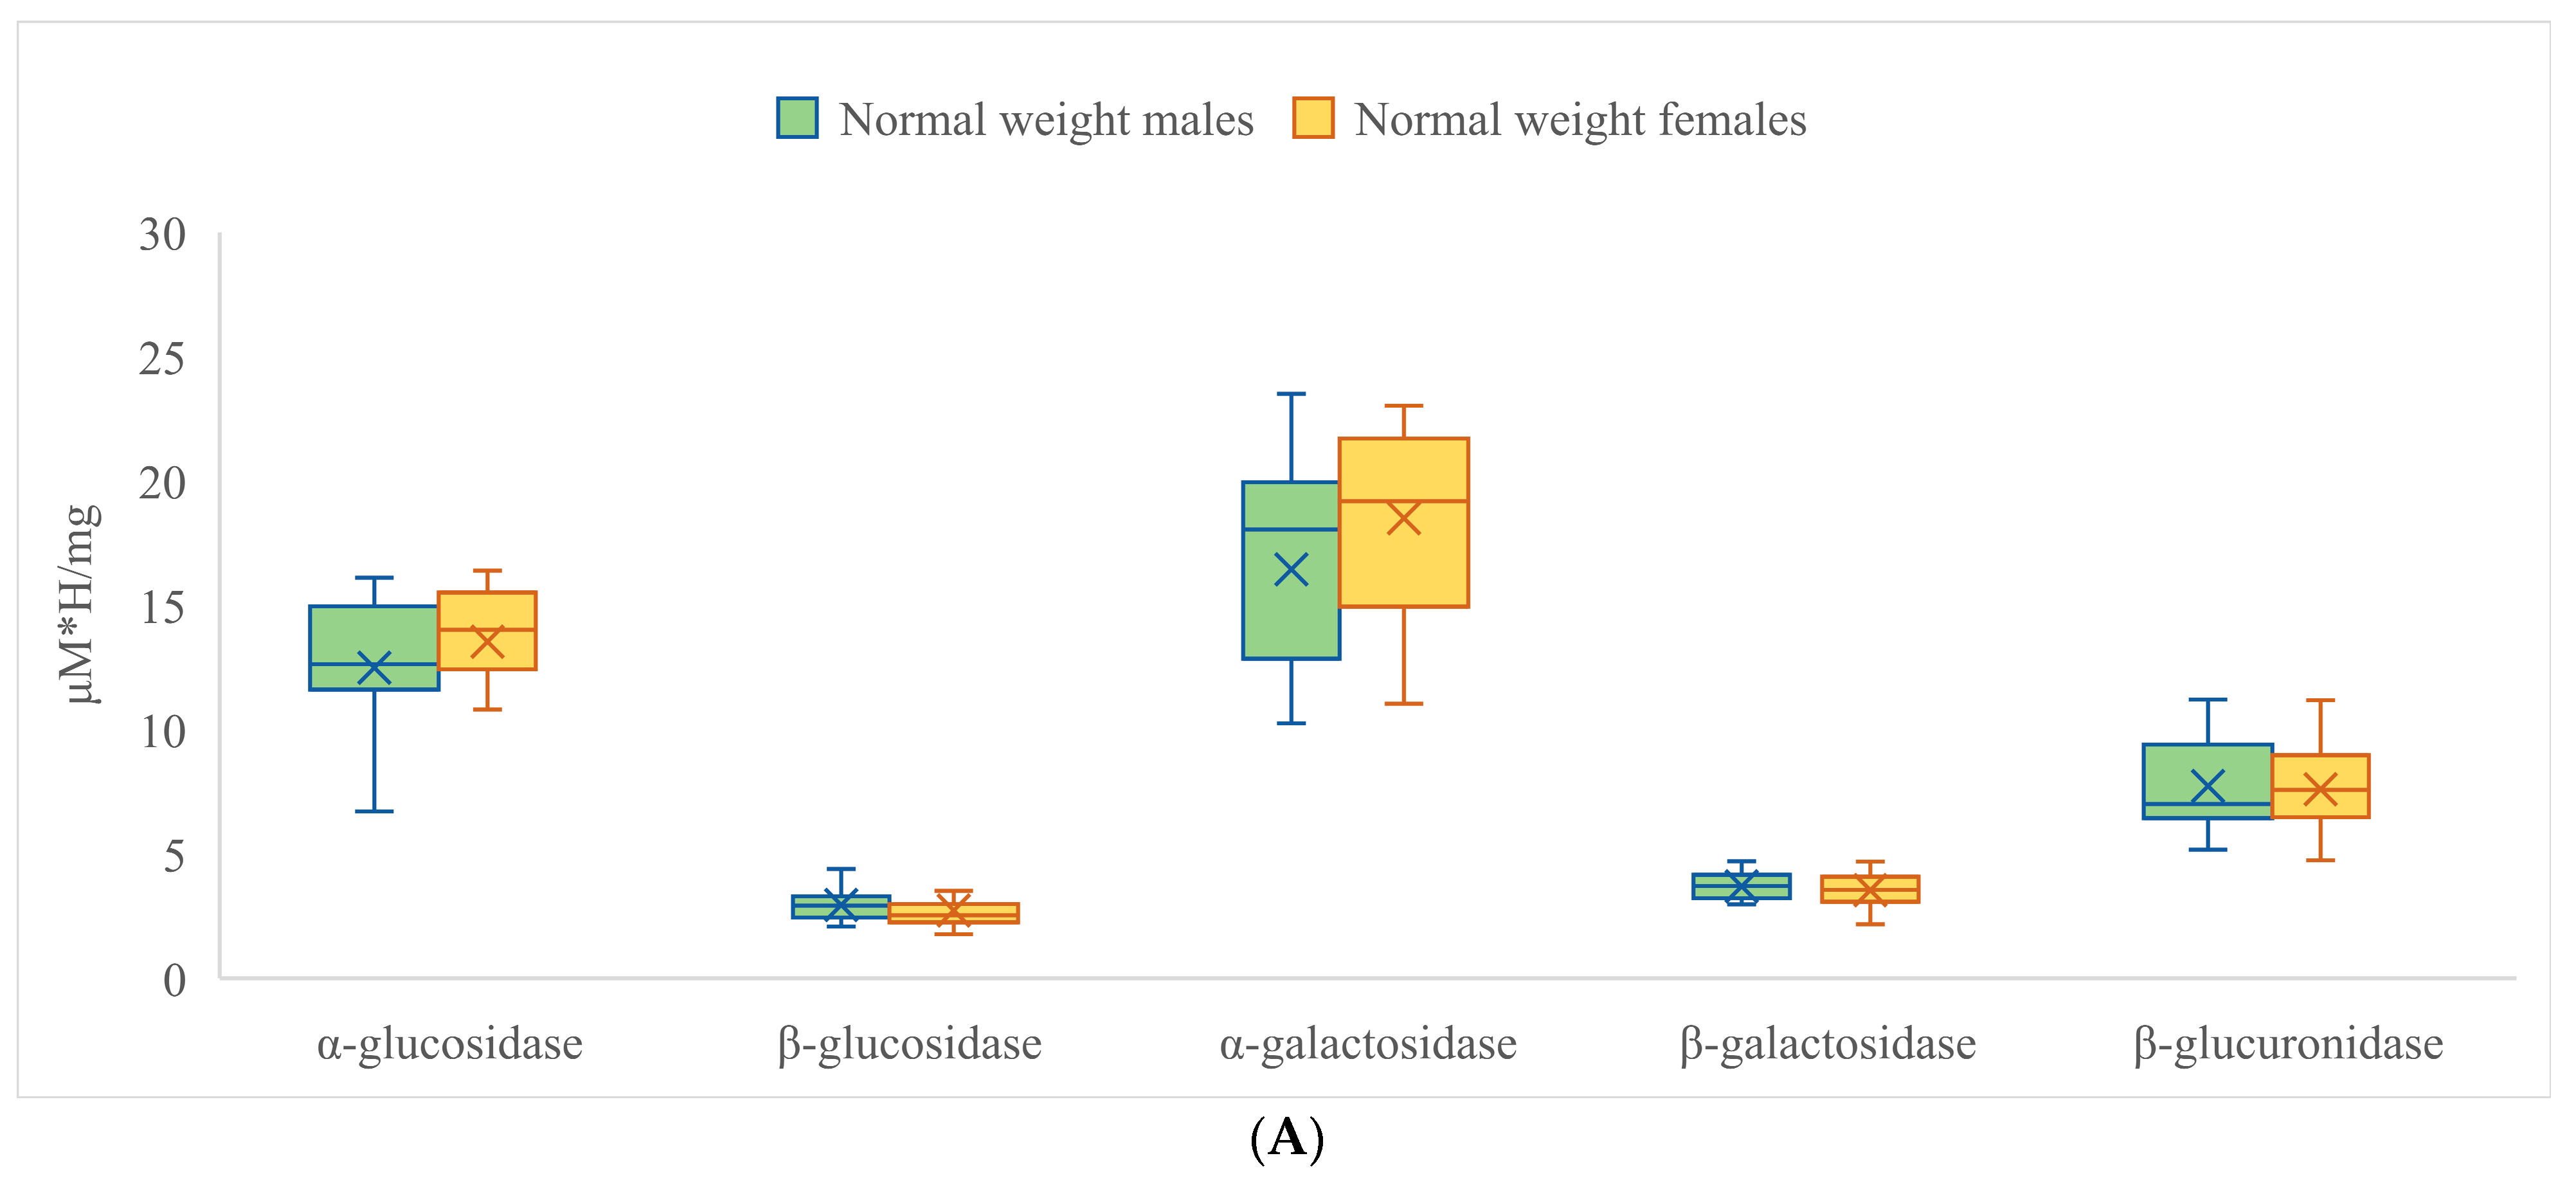
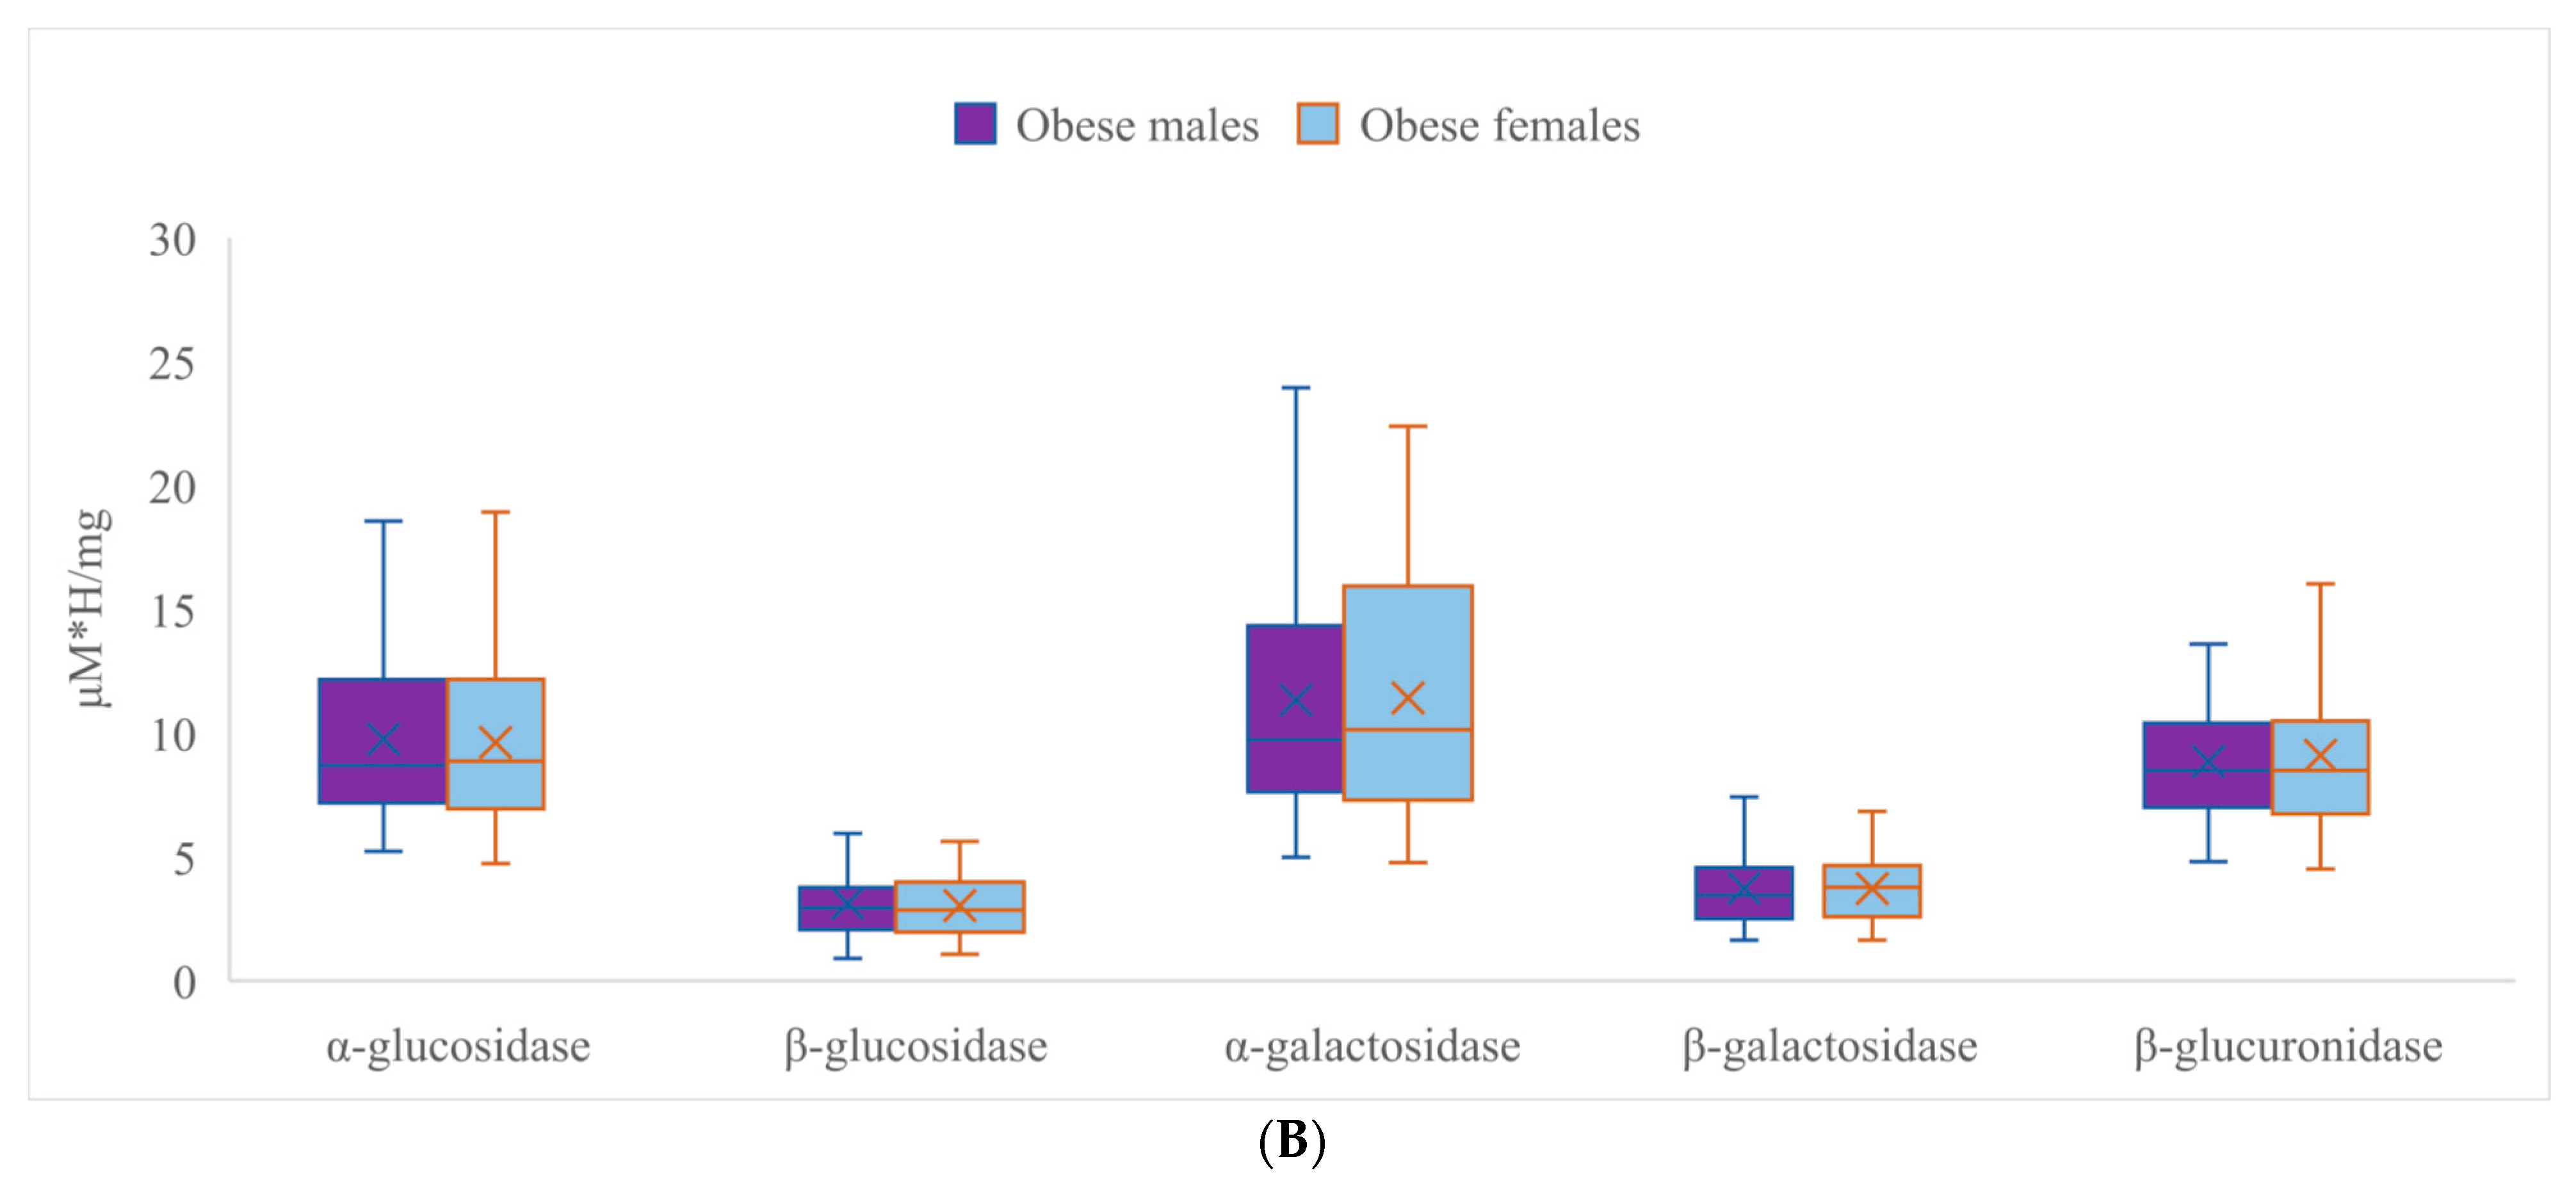
3.2. Activities of Fecal Enzymes
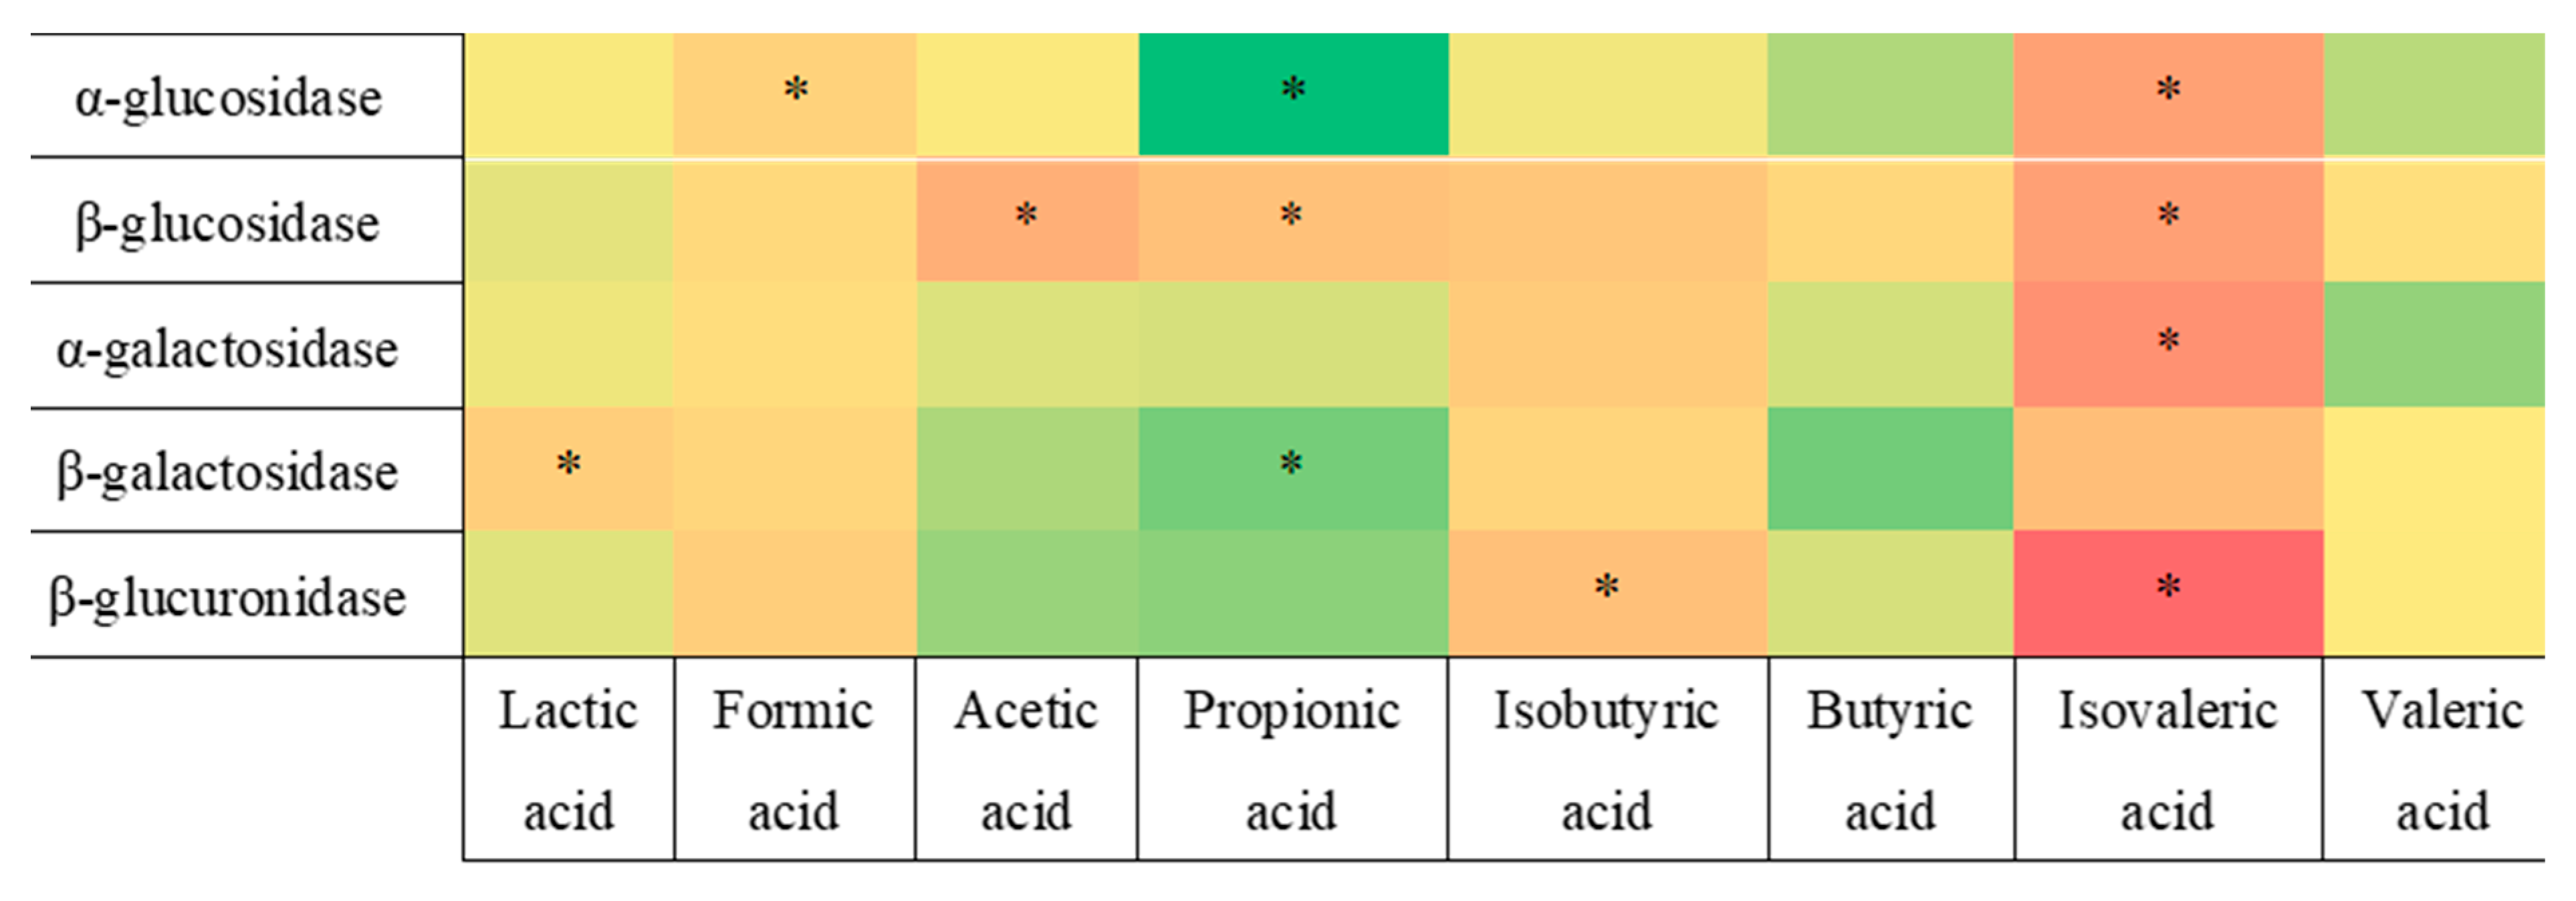
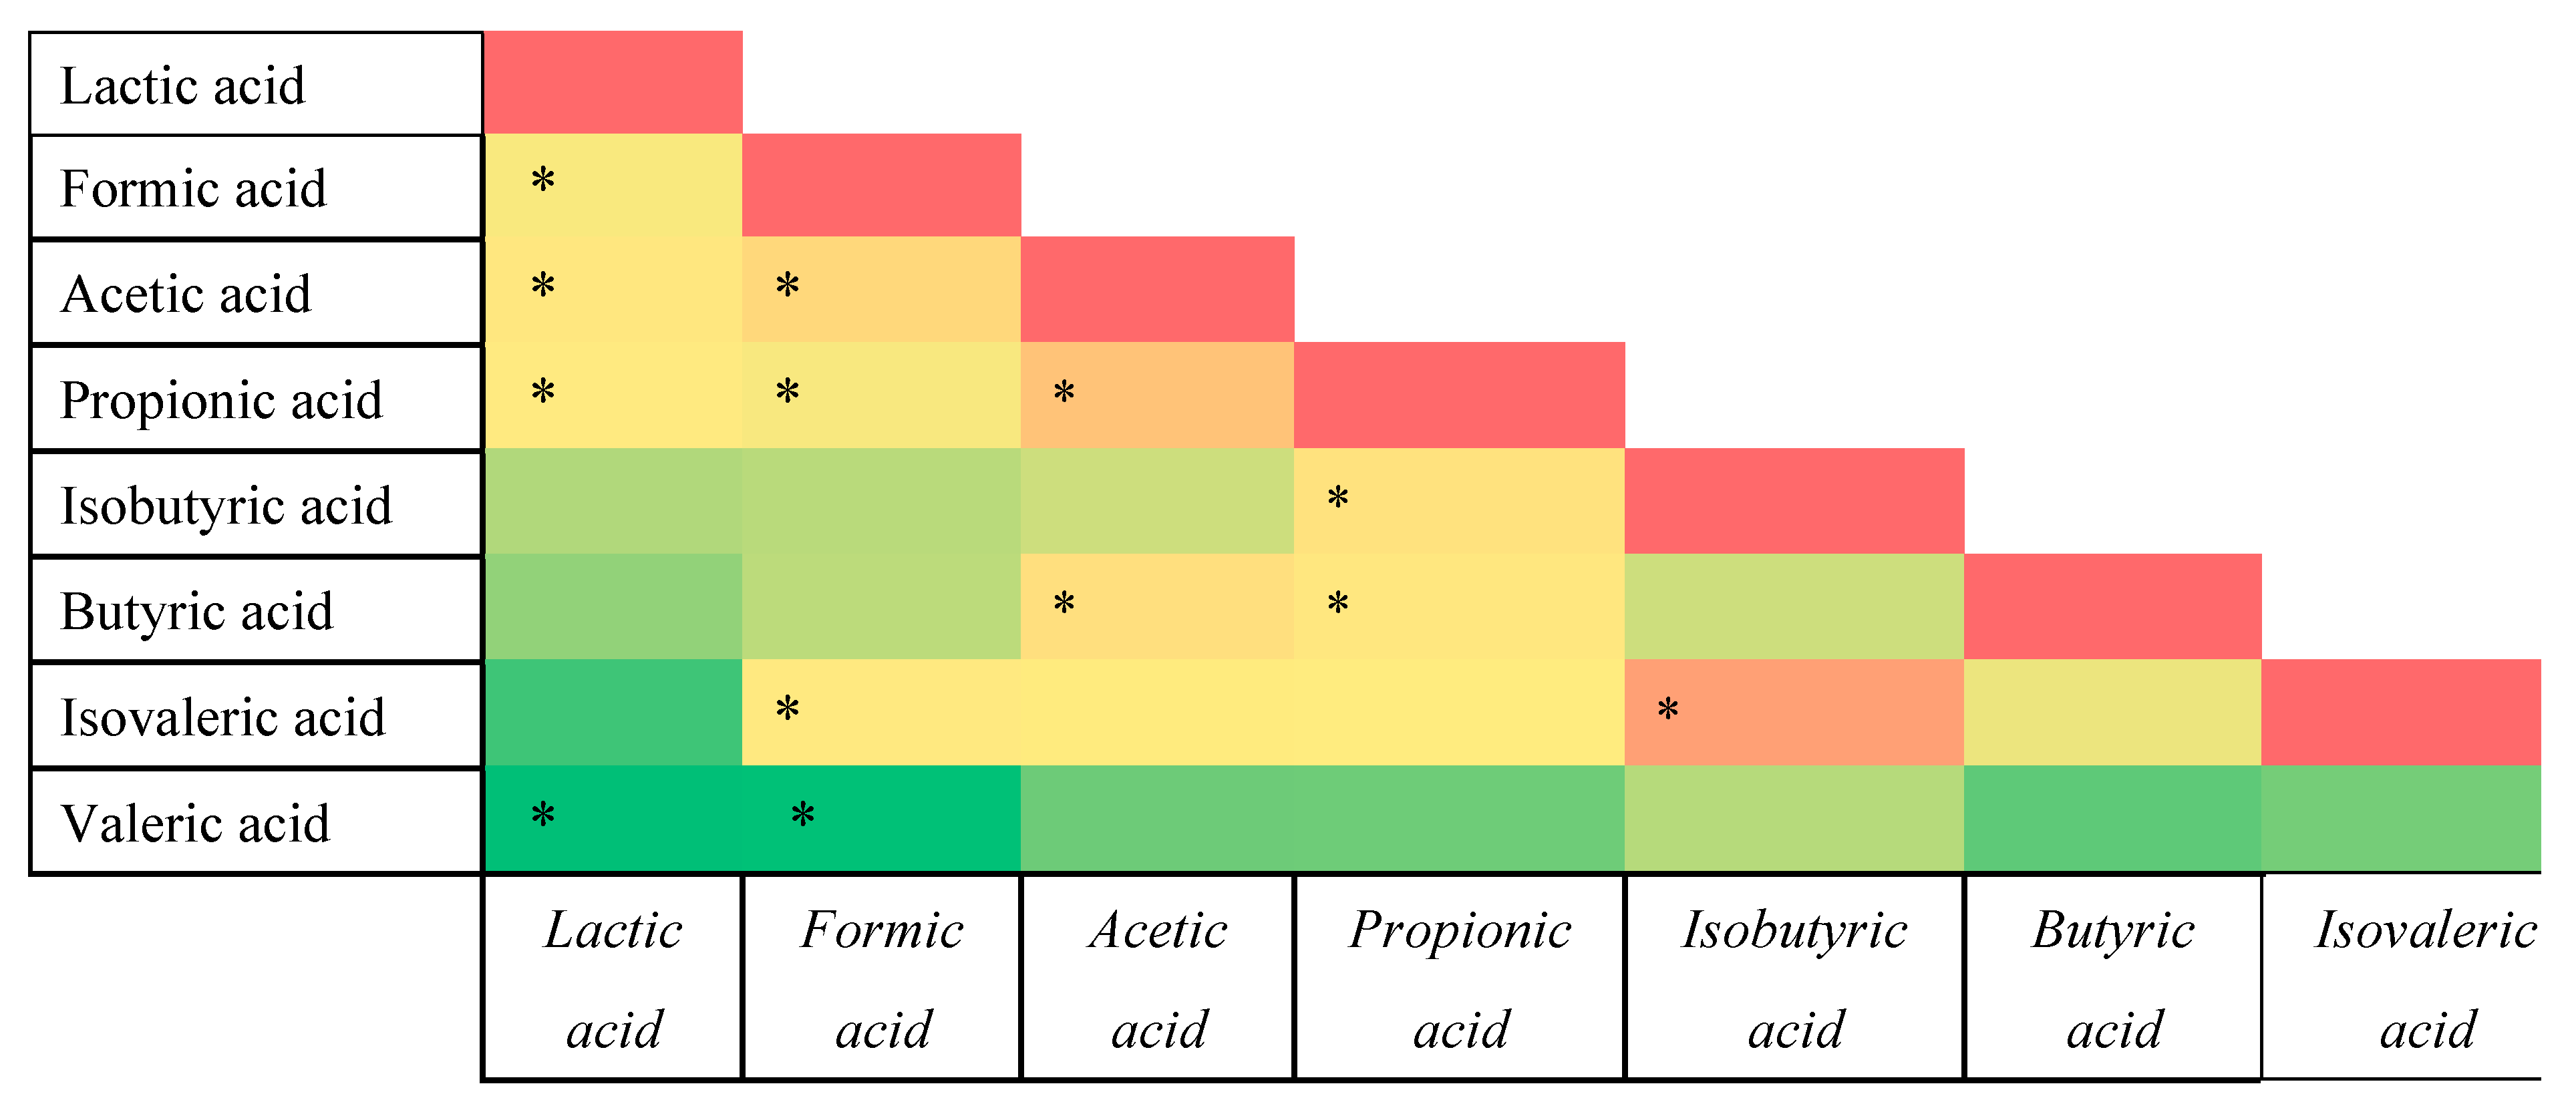
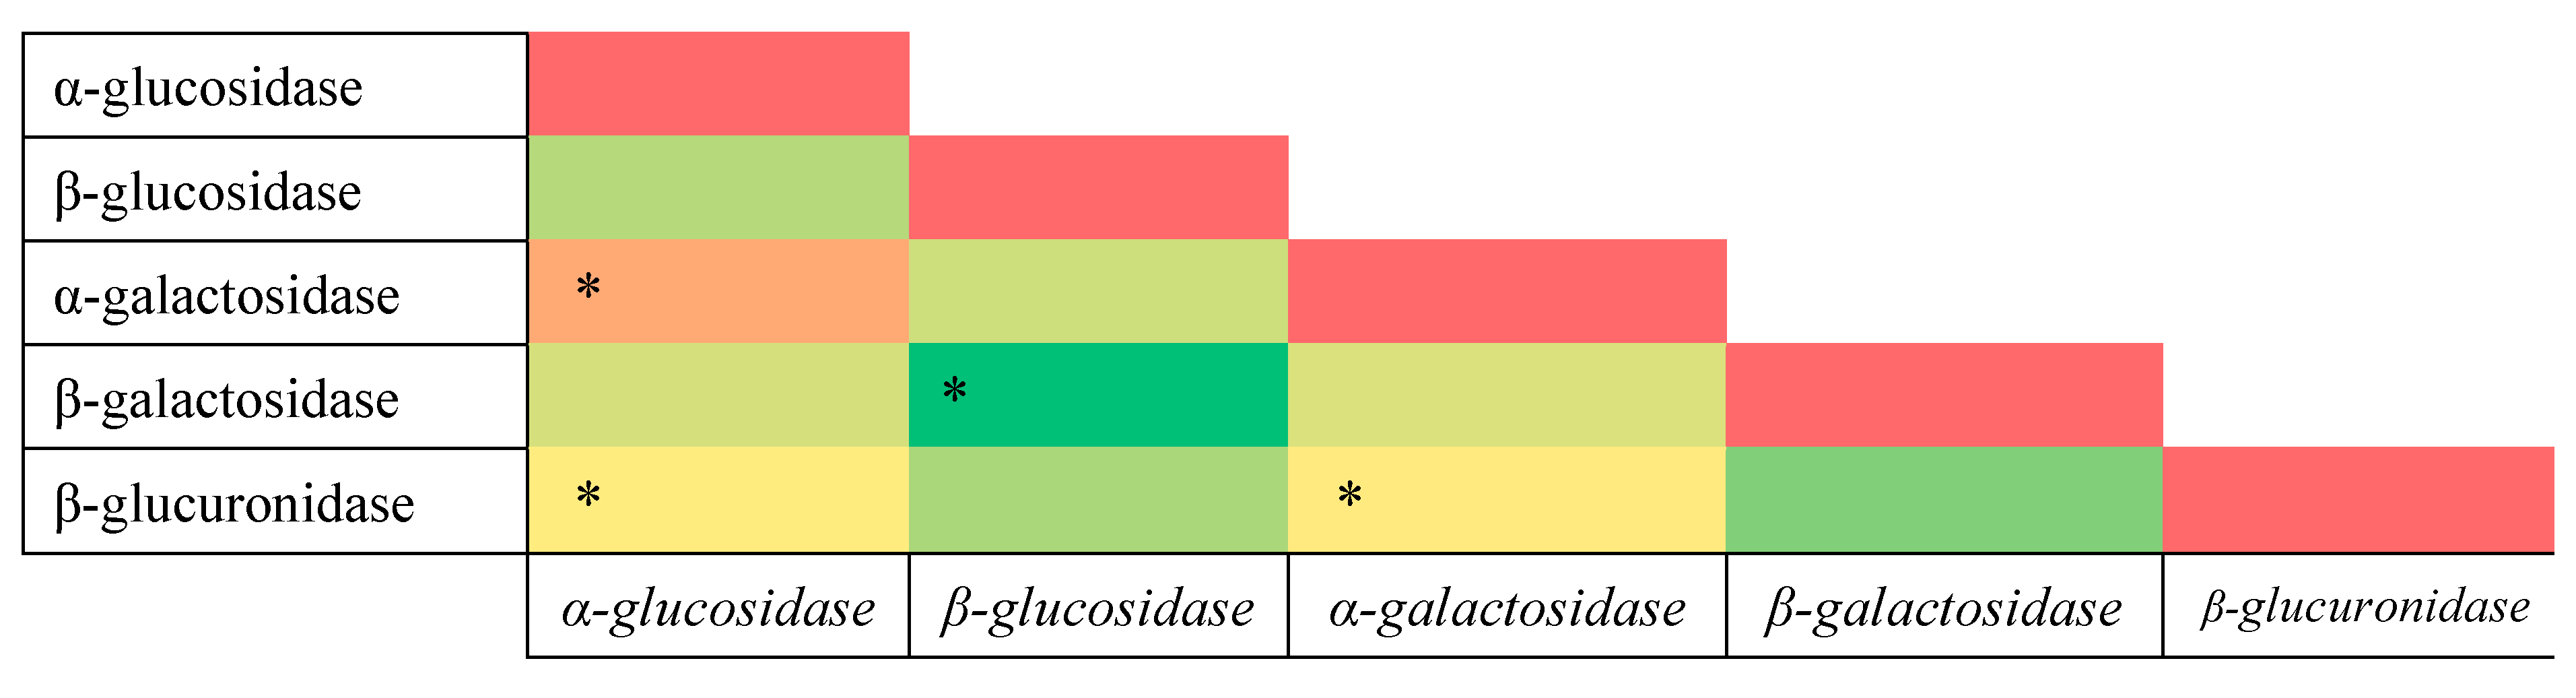
3.3. Correlation Analysis
4. Discussion
5. Conclusions
Author Contributions
Funding
Institutional Review Board Statement
Informed Consent Statement
Data Availability Statement
Acknowledgments
Conflicts of Interest
Abbreviations
| SCFA | short-chain fatty acid |
| BCFA | branched-chain fatty acid |
References
- World Health Organization. WHO Methods and Data Sources for Country-Level Causes of Death 2000–2016; WHO: Geneva, Switzerland, 2018.
- Rodriguez-Martinez, A.; Zhou, B.; Sophiea, M.K.; Bentham, J.; Paciorek, C.J.; Iurilli, M.L.; Carrillo-Larco, R.M.; E Bennett, J.; Di Cesare, M.; Taddei, C.; et al. Height and body-mass index trajectories of school-aged children and adolescents from 1985 to 2019 in 200 countries and territories: A pooled analysis of 2181 population-based studies with 65 million participants. Lancet 2020, 396, 1511–1524. [Google Scholar] [CrossRef]
- Vaamonde, J.G.; Álvarez-Món, M. Obesidad y sobrepeso. Med. Programa De Form. Médica Contin. Acreditado 2020, 13, 767–776. [Google Scholar] [CrossRef]
- World Health Organization. Obesity and Overweight, June 2021. Available online: http://www.who.int/news-room/fact-sheets/detail/obesity-and-overweight (accessed on 3 January 2023).
- Simmonds, M.; Llewellyn, A.; Owen, C.G.; Woolacott, N. Predicting adult obesity from childhood obesity: A systematic review and meta-analysis. Obes. Rev. 2015, 17, 95–107. [Google Scholar] [CrossRef] [PubMed]
- Janssen, F.; Bardoutsos, A.; Vidra, N. Obesity Prevalence in the Long-Term Future in 18 European Countries and in the USA. Obes. Facts 2020, 13, 514–527. [Google Scholar] [CrossRef] [PubMed]
- Finkelstein, E.A.; Khavjou, O.A.; Thompson, H.; Trogdon, J.G.; Pan, L.; Sherry, B.; Dietz, W. Obesity and Severe Obesity Forecasts Through 2030. Am. J. Prev. Med. 2012, 42, 563–570. [Google Scholar] [CrossRef]
- Włodarczyk, M.; Śliżewska, K. Obesity as the 21st Century’s major disease: The role of probiotics and prebiotics in prevention and treatment. Food Biosci. 2021, 42, 101115. [Google Scholar] [CrossRef]
- Li, W.-Z.; Stirling, K.; Yang, J.-J.; Zhang, L. Gut microbiota and diabetes: From correlation to causality and mechanism. World J. Diabetes 2020, 11, 293–308. [Google Scholar] [CrossRef]
- Brusaferro, A.; Cozzali, R.; Orabona, C.; Biscarini, A.; Farinelli, E.; Cavalli, E.; Grohmann, U.; Principi, N.; Esposito, S. Is It Time to Use Probiotics to Prevent or Treat Obesity? Nutrients 2018, 10, 1613. [Google Scholar] [CrossRef]
- Tokarek, J.; Gadzinowska, J.; Młynarska, E.; Franczyk, B.; Rysz, J. What Is the Role of Gut Microbiota in Obesity Prevalence? A Few Words about Gut Microbiota and Its Association with Obesity and Related Diseases. Microorganisms 2021, 10, 52. [Google Scholar] [CrossRef]
- Pinart, M.; Dötsch, A.; Schlicht, K.; Laudes, M.; Bouwman, J.; Forslund, S.K.; Pischon, T.; Nimptsch, K. Gut Microbiome Composition in Obese and Non-Obese Persons: A Systematic Review and Meta-Analysis. Nutrients 2021, 14, 12. [Google Scholar] [CrossRef]
- Duan, M.; Wang, Y.; Zhang, Q.; Zou, R.; Guo, M.; Zheng, H. Characteristics of gut microbiota in people with obesity. PLoS ONE 2021, 16, e0255446. [Google Scholar] [CrossRef] [PubMed]
- Frampton, J.; Murphy, K.G.; Frost, G.; Chambers, E.S. Short-chain fatty acids as potential regulators of skeletal muscle metabolism and function. Nat. Metab. 2020, 2, 840–848. [Google Scholar] [CrossRef] [PubMed]
- Butel, M.-J. Probiotics, gut microbiota and health. Med. Mal. Infect. 2014, 44, 1–8. [Google Scholar] [CrossRef] [PubMed]
- Markowiak, P.; Śliżewska, K. Effects of Probiotics, Prebiotics, and Synbiotics on Human Health. Nutrients 2017, 9, 1021. [Google Scholar] [CrossRef] [PubMed]
- Palmas, V.; Pisanu, S.; Madau, V.; Casula, E.; Deledda, A.; Cusano, R.; Uva, P.; Vascellari, S.; Loviselli, A.; Manzin, A.; et al. Gut microbiota markers associated with obesity and overweight in Italian adults. Sci. Rep. 2021, 11, 5532. [Google Scholar] [CrossRef]
- Cerdó, T.; García-Santos, J.A.; Bermúdez, M.G.; Campoy, C. The Role of Probiotics and Prebiotics in the Prevention and Treatment of Obesity. Nutrients 2019, 11, 635. [Google Scholar] [CrossRef]
- Sivaprakasam, S.; Bhutia, Y.D.; Yang, S.; Ganapathy, V. Short-Chain Fatty Acid Transporters: Role in Colonic Homeostasis. In Comprehensive Physiology; Wiley: New York, NY, USA, 2017; Volume 8, pp. 299–314. [Google Scholar] [CrossRef]
- Mäkeläinen, H.; Mäkivuokko, H.; Salminen, S.; Rautonen, N.; Ouwehand, A. The Effects of Polydextrose and Xylitol on Microbial Community and Activity in a 4-Stage Colon Simulator. J. Food Sci. 2007, 72, M153–M159. [Google Scholar] [CrossRef]
- Rowland, I.; Gibson, G.; Heinken, A.; Scott, K.; Swann, J.; Thiele, I.; Tuohy, K. Gut microbiota functions: Metabolism of nutrients and other food components. Eur. J. Nutr. 2018, 57, 1–24. [Google Scholar] [CrossRef]
- Rendic, S.; Guengerich, F.P. Contributions of Human Enzymes in Carcinogen Metabolism. Chem. Res. Toxicol. 2012, 25, 1316–1383. [Google Scholar] [CrossRef]
- De Onis, M.; Onyango, A.W.; Borghi, E.; Siyam, A.; Nishida, C.; Siekmann, J. Development of a WHO growth reference for school-aged children and adolescents. Bull. World Health Organ. 2007, 85, 660–667. [Google Scholar] [CrossRef]
- Mroczyńska, M.; Galecka, M.; Szachta, P.; Kamoda, D.; Libudzisz, Z.; Roszak, D. Beta-glucuronidase and Beta-glucosidase activity in stool specimens of children with inflammatory bowel disease. Pol. J. Microbiol. 2013, 62, 319–325. [Google Scholar] [CrossRef] [PubMed]
- van den Heuvel, E.G.H.M.; Wils, D.; Pasman, W.J.; Saniez, M.-H.; Kardinaal, A.F.M. Dietary supplementation of different doses of NUTRIOSE®FB, a fermentable dextrin, alters the activity of faecal enzymes in healthy men. Eur. J. Nutr. 2005, 44, 445–451. [Google Scholar] [CrossRef] [PubMed]
- Włodarczyk, M.; Śliżewska, K.; Barczyńska, R.; Kapuśniak, J. Effects of Resistant Dextrin from Potato Starch on the Growth Dynamics of Selected Co-Cultured Strains of Gastrointestinal Bacteria and the Activity of Fecal Enzymes. Nutrients 2022, 14, 2158. [Google Scholar] [CrossRef] [PubMed]
- Śliżewska, K.; Markowiak-Kopeć, P.; Śliżewska, W. The Role of Probiotics in Cancer Prevention. Cancers 2020, 13, 20. [Google Scholar] [CrossRef]
- Azcarate-Peril, M.A.; Sikes, M.; Bruno-Bárcena, J.M. The intestinal microbiota, gastrointestinal environment and colorectal cancer: A putative role for probiotics in prevention of colorectal cancer? Am. J. Physiol. Liver Physiol. 2011, 301, G401–G424. [Google Scholar] [CrossRef]
- Zhu, Q.; Gao, R.; Wu, W.; Qin, H. The role of gut microbiota in the pathogenesis of colorectal cancer. Tumor Biol. 2013, 34, 1285–1300. [Google Scholar] [CrossRef]
- Li, Z.; Xu, D.; Tong, X.; Shan, C. Inhibition of β-glucosidase overcomes gastric cancer chemoresistance through inducing lysosomal dysfunction. Clin. Res. Hepatol. Gastroenterol. 2020, 45, 101456. [Google Scholar] [CrossRef]
- Kyriachenko, Y.; Falalyeyeva, T.; Korotkyi, O.; Molochek, N.; Kobyliak, N. Crosstalk between Gut Microbiota and Antidiabetic Drug Action. World J. Diabetes 2019, 10, 154. [Google Scholar] [CrossRef]
- Zhao, Y.; Wang, Y.; Lou, H.; Shan, L. Alpha-Glucosidase Inhibitors and Risk of Cancer in Patients with Diabetes Mellitus: A Systematic Review and Meta-Analysis. Oncotarget 2017, 8, 81027. [Google Scholar] [CrossRef]
- Zhang, L.; Song, P.; Zhang, X.; Metea, C.; Schleisman, M.; Karstens, L.; Leung, E.; Zhang, J.; Xu, Q.; Liu, Y.; et al. Alpha-Glucosidase Inhibitors Alter Gut Microbiota and Ameliorate Collagen-Induced Arthritis. Front. Pharmacol. 2020, 10, 1684. [Google Scholar] [CrossRef]
- Ormazabal, V.; Nair, S.; Elfeky, O.; Aguayo, C.; Salomon, C.; Zuñiga, F.A. Association between Insulin Resistance and the Development of Cardiovascular Disease. Cardiovasc. Diabetol. 2018, 17, 122. [Google Scholar] [CrossRef] [PubMed]
- Röder, P.V.; Wu, B.; Liu, Y.; Han, W. Pancreatic Regulation of Glucose Homeostasis. Exp. Mol. Med. 2016, 48, e219. [Google Scholar] [CrossRef] [PubMed]
- Joshi, S.R.; Standl, E.; Tong, N.; Shah, P.; Kalra, S.; Rathod, R. Therapeutic Potential of α-Glucosidase Inhibitors in Type 2 Diabetes Mellitus: An Evidence-Based Review. Expert Opin. Pharmacother. 2015, 16, 1959–1981. [Google Scholar] [CrossRef] [PubMed]
- Pais, R.; Gribble, F.M.; Reimann, F. Stimulation of Incretin Secreting Cells. Ther. Adv. Endocrinol. Metab. 2016, 7, 24–42. [Google Scholar] [CrossRef] [PubMed]
- Yan, J.; Zhao, J.; Yang, R.; Zhao, W. Bioactive Peptides with Antidiabetic Properties: A Review. Int. J. Food Sci. Technol. 2019, 54, 1909–1919. [Google Scholar] [CrossRef]
- Peredo-Lovillo, A.; Romero-Luna, H.; Jiménez-Fernández, M. Health promoting microbial metabolites produced by gut microbiota after prebiotics metabolism. Food Res. Int. 2020, 136, 109473. [Google Scholar] [CrossRef]
- Gomes, A.C.; Hoffmann, C.; Mota, J.F. Gut microbiota is associated with adiposity markers and probiotics may impact specific genera. Eur. J. Nutr. 2019, 59, 1751–1762. [Google Scholar] [CrossRef]
- Martin, A.M.; Sun, E.W.; Rogers, G.B.; Keating, D.J. The Influence of the Gut Microbiome on Host Metabolism through the Regulation of Gut Hormone Release. Front. Physiol. 2019, 10, 428. [Google Scholar] [CrossRef]
- Teitelbaum, A.A.; Gareau, M.G.; Jury, J.; Yang, P.C.; Perdue, M.H. Chronic Peripheral Administration of Corticotropin-Releasing Factor Causes Colonic Barrier Dysfunction Similar to Psychological Stress. Am. J. Physiol. Liver Physiol. 2008, 295, G452–G459. [Google Scholar] [CrossRef]
- Song, Q.; Zhang, X. The Role of Gut–Liver Axis in Gut Microbiome Dysbiosis Associated NAFLD and NAFLD-HCC. Biomedicines 2022, 10, 524. [Google Scholar] [CrossRef]
- Taormina, V.M.; Unger, A.L.; Schiksnis, M.R.; Torres-Gonzalez, M.; Kraft, J. Branched-Chain Fatty Acids—An Underexplored Class of Dairy-Derived Fatty Acids. Nutrients 2020, 12, 2875. [Google Scholar] [CrossRef] [PubMed]
- Mika, A.; Stepnowski, P.; Kaska, L.; Proczko, M.; Wisniewski, P.; Sledzinski, M.; Sledzinski, T. A comprehensive study of serum odd- and branched-chain fatty acids in patients with excess weight. Obesity 2016, 24, 1669–1676. [Google Scholar] [CrossRef] [PubMed]
- Rios-Covian, D.; González, S.; Nogacka, A.M.; Arboleya, S.; Salazar, N.; Gueimonde, M.; de Los Reyes-Gavilán, C.G. An Overview on Fecal Branched Short-Chain Fatty Acids Along Human Life and as Related With Body Mass Index: Associated Dietary and Anthropometric Factors. Front. Microbiol. 2020, 11, 973. [Google Scholar] [CrossRef] [PubMed]
- Singh, R.K.; Chang, H.-W.; Yan, D.; Lee, K.M.; Ucmak, D.; Wong, K.; Abrouk, M.; Farahnik, B.; Nakamura, M.; Zhu, T.H.; et al. Influence of diet on the gut microbiome and implications for human health. J. Transl. Med. 2017, 15, 73. [Google Scholar] [CrossRef]
- Dabek, M.; McCrae, S.I.; Stevens, V.J.; Duncan, S.; Louis, P. Distribution of β-glucosidase and β-glucuronidase activity and of β-glucuronidase gene gus in human colonic bacteria. FEMS Microbiol. Ecol. 2008, 66, 487–495. [Google Scholar] [CrossRef]
- Flint, H.J.; Scott, K.P.; Duncan, S.H.; Louis, P.; Forano, E. Microbial degradation of complex carbohydrates in the gut. Gut Microbes 2012, 3, 289–306. [Google Scholar] [CrossRef]
- Bedada, T.L.; Feto, T.K.; Awoke, K.S.; Garedew, A.D.; Yifat, F.T.; Birri, D.J. Probiotics for cancer alternative prevention and treatment. Biomed. Pharmacother. 2020, 129, 110409. [Google Scholar] [CrossRef]
- Kasai, C.; Sugimoto, K.; Moritani, I.; Tanaka, J.; Oya, Y.; Inoue, H.; Tameda, M.; Shiraki, K.; Ito, M.; Takei, Y.; et al. Comparison of the gut microbiota composition between obese and non-obese individuals in a Japanese population, as analyzed by terminal restriction fragment length polymorphism and next-generation sequencing. BMC Gastroenterol. 2015, 15, 100. [Google Scholar] [CrossRef]
- Marchesi, J.R.; Adams, D.H.; Fava, F.; Hermes, G.D.A.; Hirschfield, G.M.; Hold, G.; Quraishi, M.N.; Kinross, J.; Smidt, H.; Tuohy, K.M.; et al. The gut microbiota and host health: A new clinical frontier. Gut 2016, 65, 330–339. [Google Scholar] [CrossRef]
- Szczesniak, O.; Hestad, K.A.; Hanssen, J.F.; Rudi, K. Isovaleric acid in stool correlates with human depression. Nutr. Neurosci. 2015, 19, 279–283. [Google Scholar] [CrossRef]
- Skonieczna-Żydecka, K.; Grochans, E.; Maciejewska, D.; Szkup, M.; Schneider-Matyka, D.; Jurczak, A.; Łoniewski, I.; Kaczmarczyk, M.; Marlicz, W.; Czerwińska-Rogowska, M.; et al. Faecal Short Chain Fatty Acids Profile is Changed in Polish Depressive Women. Nutrients 2018, 10, 1939. [Google Scholar] [CrossRef] [PubMed]
- de Clercq, N.C.; Frissen, M.N.; Davids, M.; Groen, A.K.; Nieuwdorp, M. Weight Gain after Fecal Microbiota Transplantation in a Patient with Recurrent Underweight following Clinical Recovery from Anorexia Nervosa. Psychother. Psychosom. 2019, 88, 58–60. [Google Scholar] [CrossRef] [PubMed]


| Participants of the Study | ||||
|---|---|---|---|---|
| Overweight and Obese Children | Normal-Weight Children | |||
| Gender | Male | Female | Male | Female |
| 46 | 51 | 13 | 13 | |
| Age [years] | 8.67 ± 1.05 | 8.26 ± 1.33 | 7.85 ± 1.65 | 7.77 ± 1.57 |
| Weight [kg] | 51.55 ± 11.16 | 44.53 ± 10.76 | 26.27 ± 6.97 | 25.23 ± 5.02 |
| Height [m] | 1.43 ± 0.10 | 1.37 ± 0.10 | 1.35 ± 0.14 | 1.32 ± 0.13 |
| BMI [kg·m−2] | 25.06 ± 3.67 | 23.49 ± 3.45 | 14.04 ± 1.94 | 14.36 ± 1.25 |
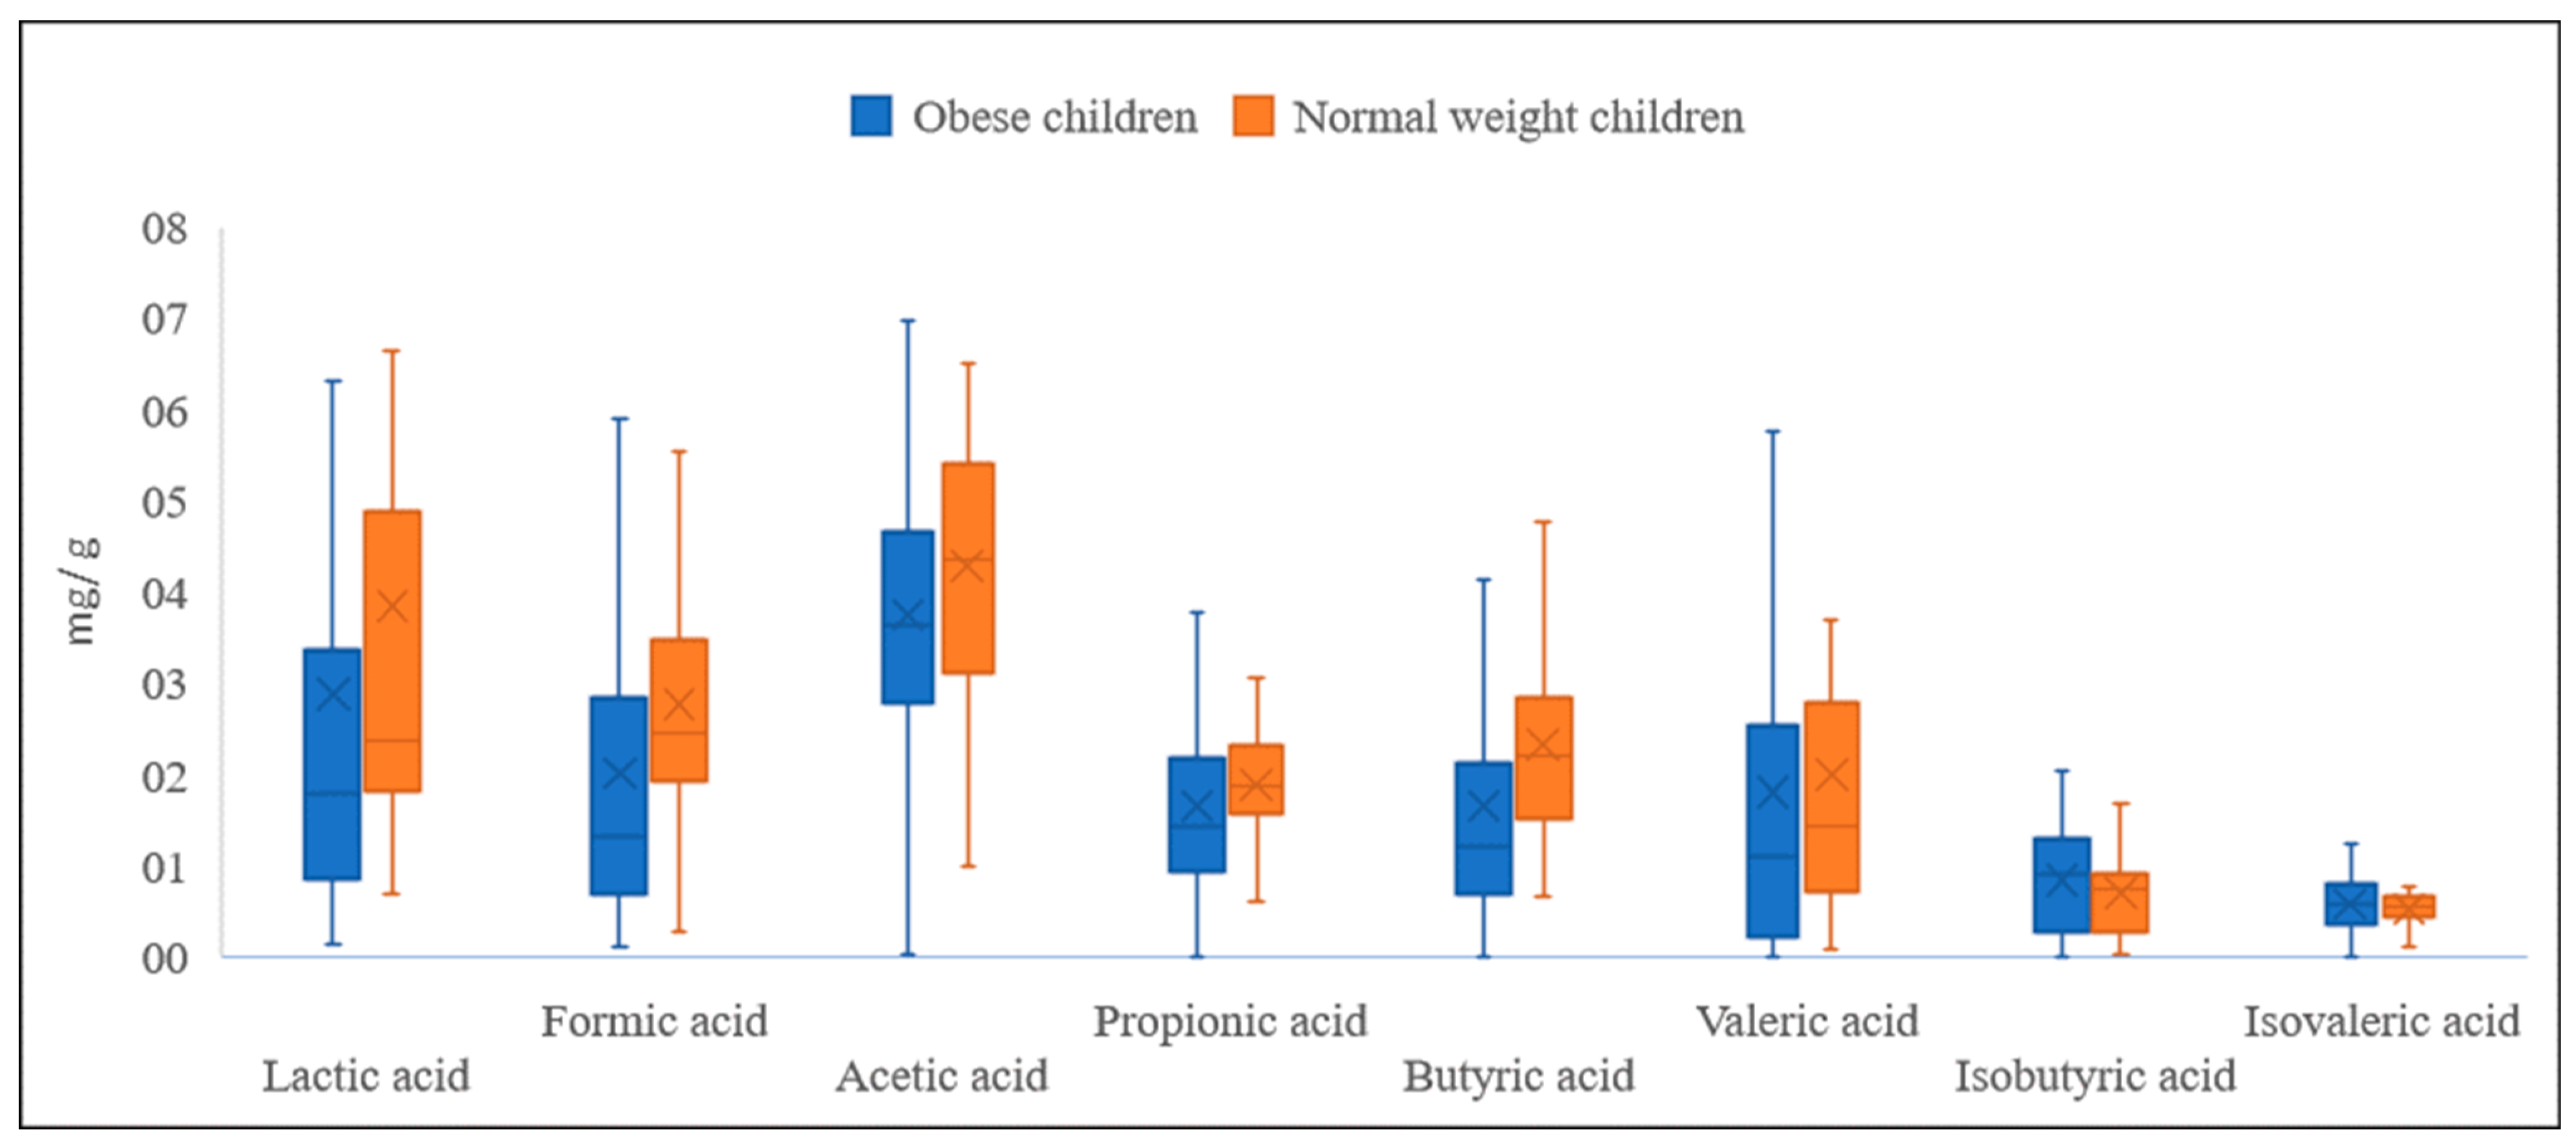
| Lactic Acid | Formic Acid | Acetic Acid | Propionic Acid | |||||
|---|---|---|---|---|---|---|---|---|
| Obese | Normal Weight | Obese | Normal Weight | Obese | Normal Weight | Obese | Normal Weight | |
| Mean | 2.877 * | 3.840 ** | 2.007 * | 2.759 ** | 3.743 * | 4.285 ** | 1.648 * | 1.877 ** |
| SD | 3.401 | 3.334 | 1.870 | 1.293 | 1.452 | 1.394 | 1.105 | 0.803 |
| Range | 20.483 | 10.345 | 9.814 | 5.257 | 7.959 | 5.513 | 6.980 | 3.364 |
| Min | 0.142 | 0.673 | 0.116 | 0.273 | 0.027 | 1.001 | 0.008 | 0.410 |
| Max | 20,625 | 11.018 | 9.929 | 5.531 | 7.987 | 6.514 | 6.988 | 3.774 |
| Butyric acid | Valeric acid | Isobutyric acid | Isovaleric acid | |||||
| Obese | Normal weight | Obese | Normal weight | Obese | Normal weight | Obese | Normal weight | |
| Mean | 1.651 * | 2.327 ** | 1.796 | 1.998 | 0.830 * | 0.703 ** | 0.572 | 0.524 |
| SD | 1.757 | 1.124 | 2.436 | 1.727 | 0.572 | 0.475 | 0.302 | 0.224 |
| Range | 15.127 | 4.710 | 15.718 | 6.535 | 2.025 | 1.645 | 1.238 | 1.000 |
| Min | 0.000 | 0.666 | 0.000 | 0.069 | 0.000 | 0.024 | 0.000 | 0.033 |
| Max | 15.127 | 5.376 | 15.718 | 6.605 | 2.025 | 1.669 | 1.238 | 1.034 |
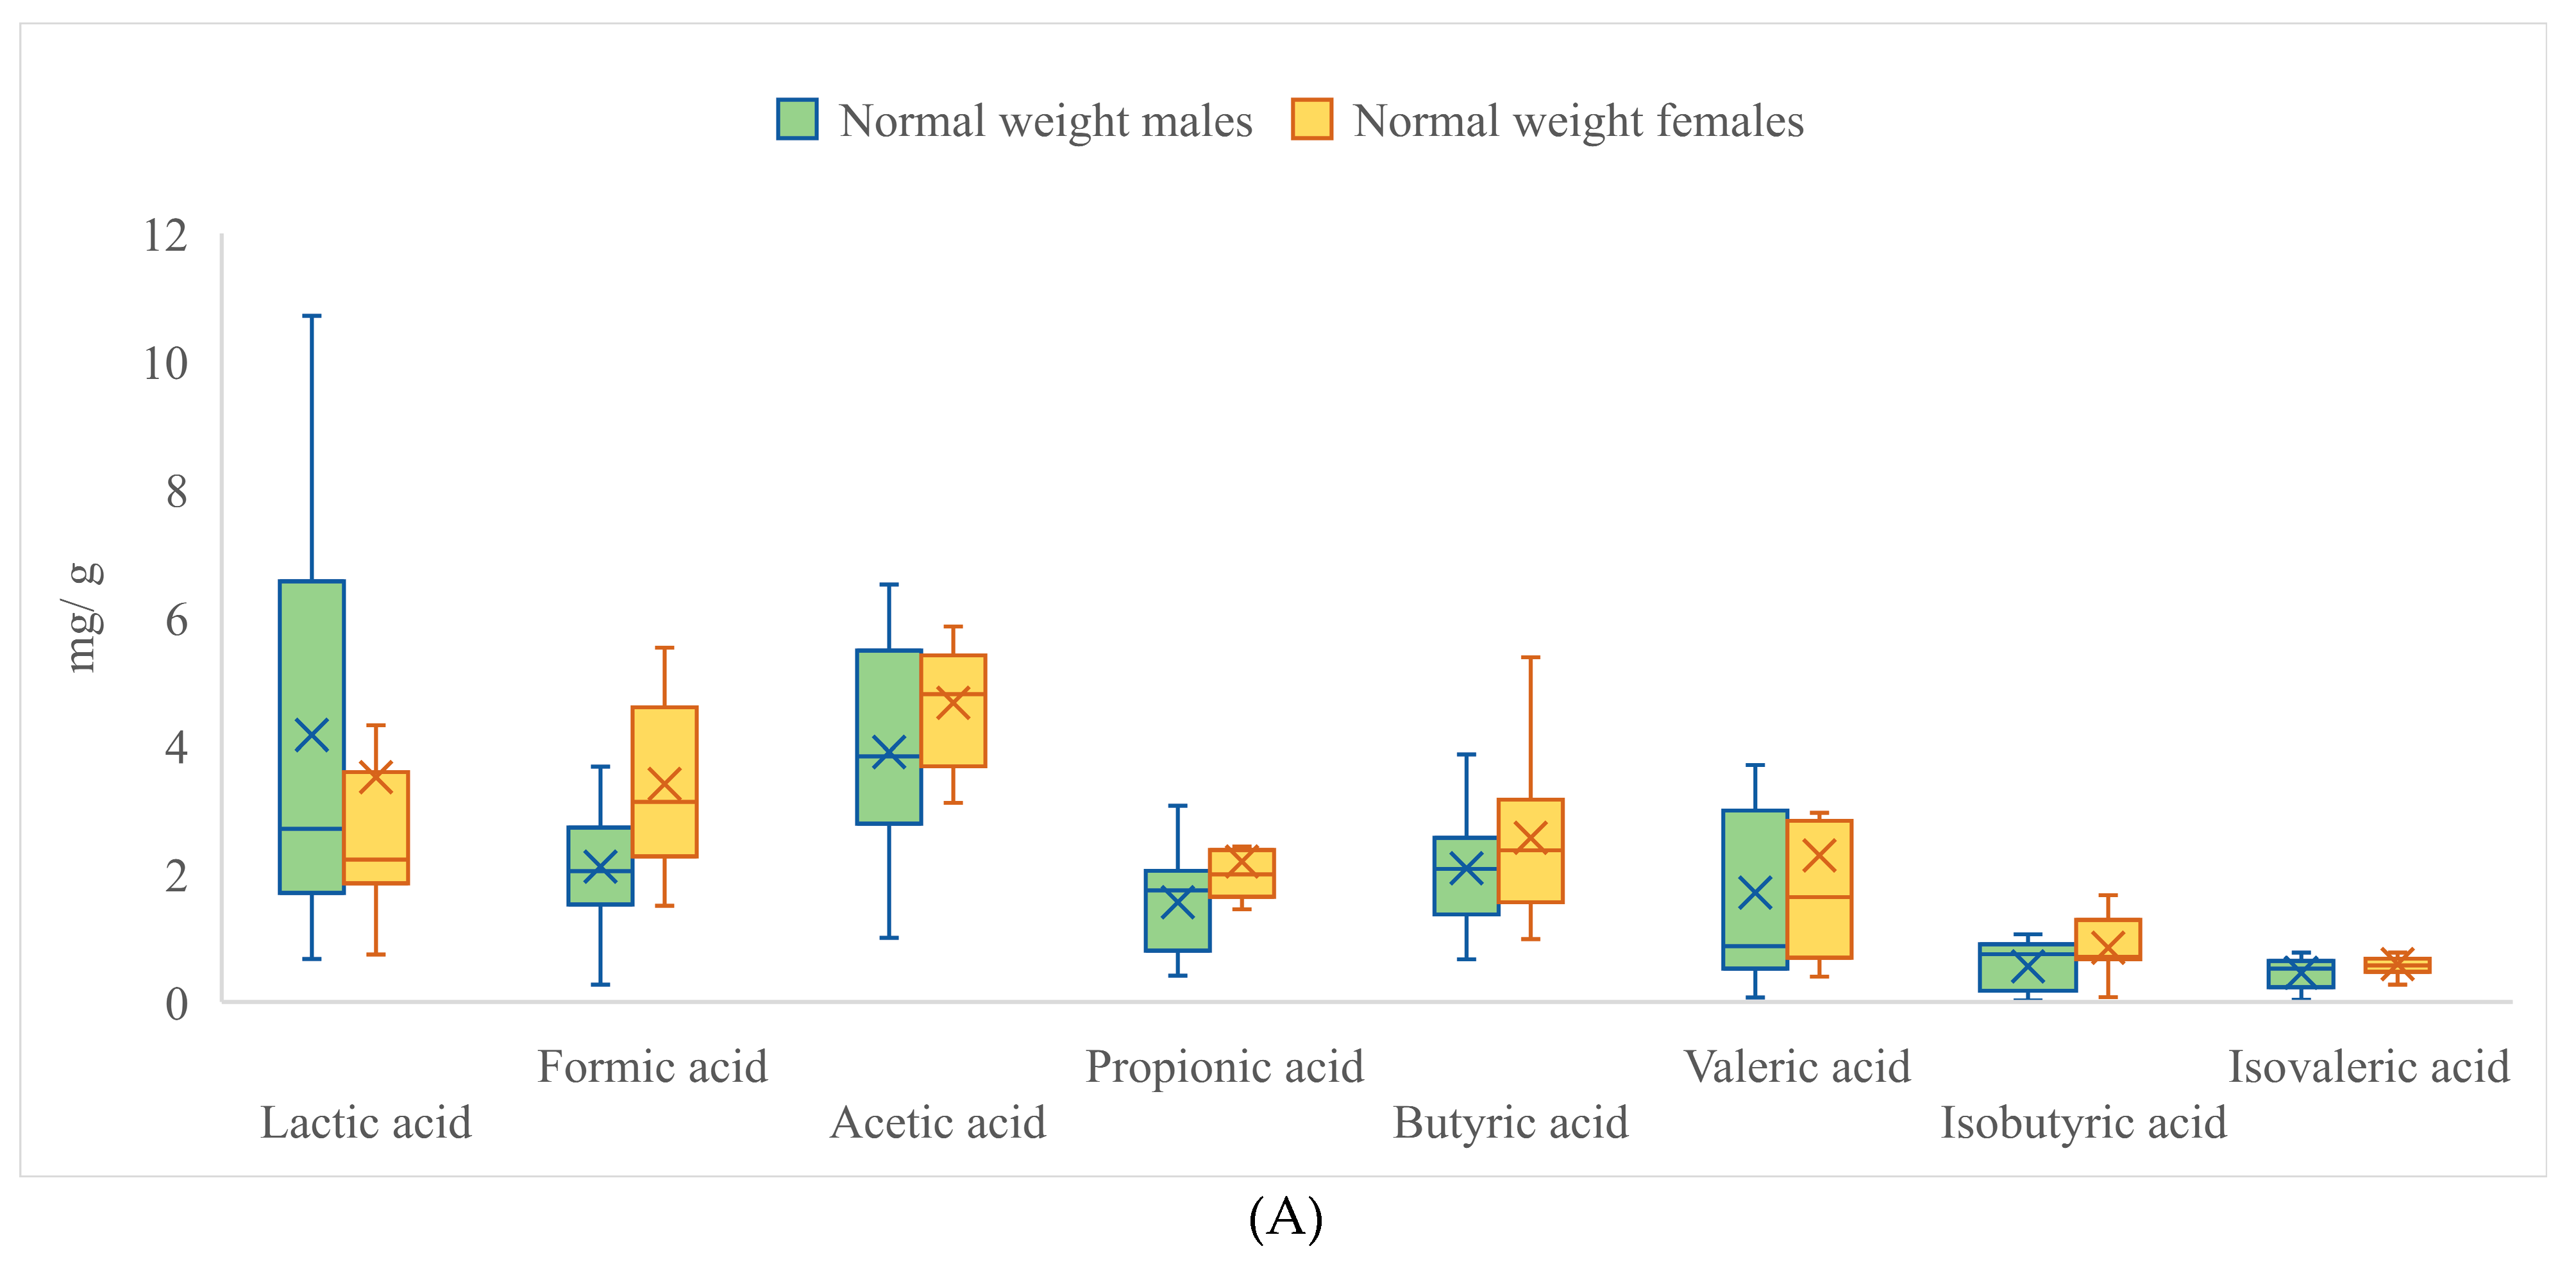
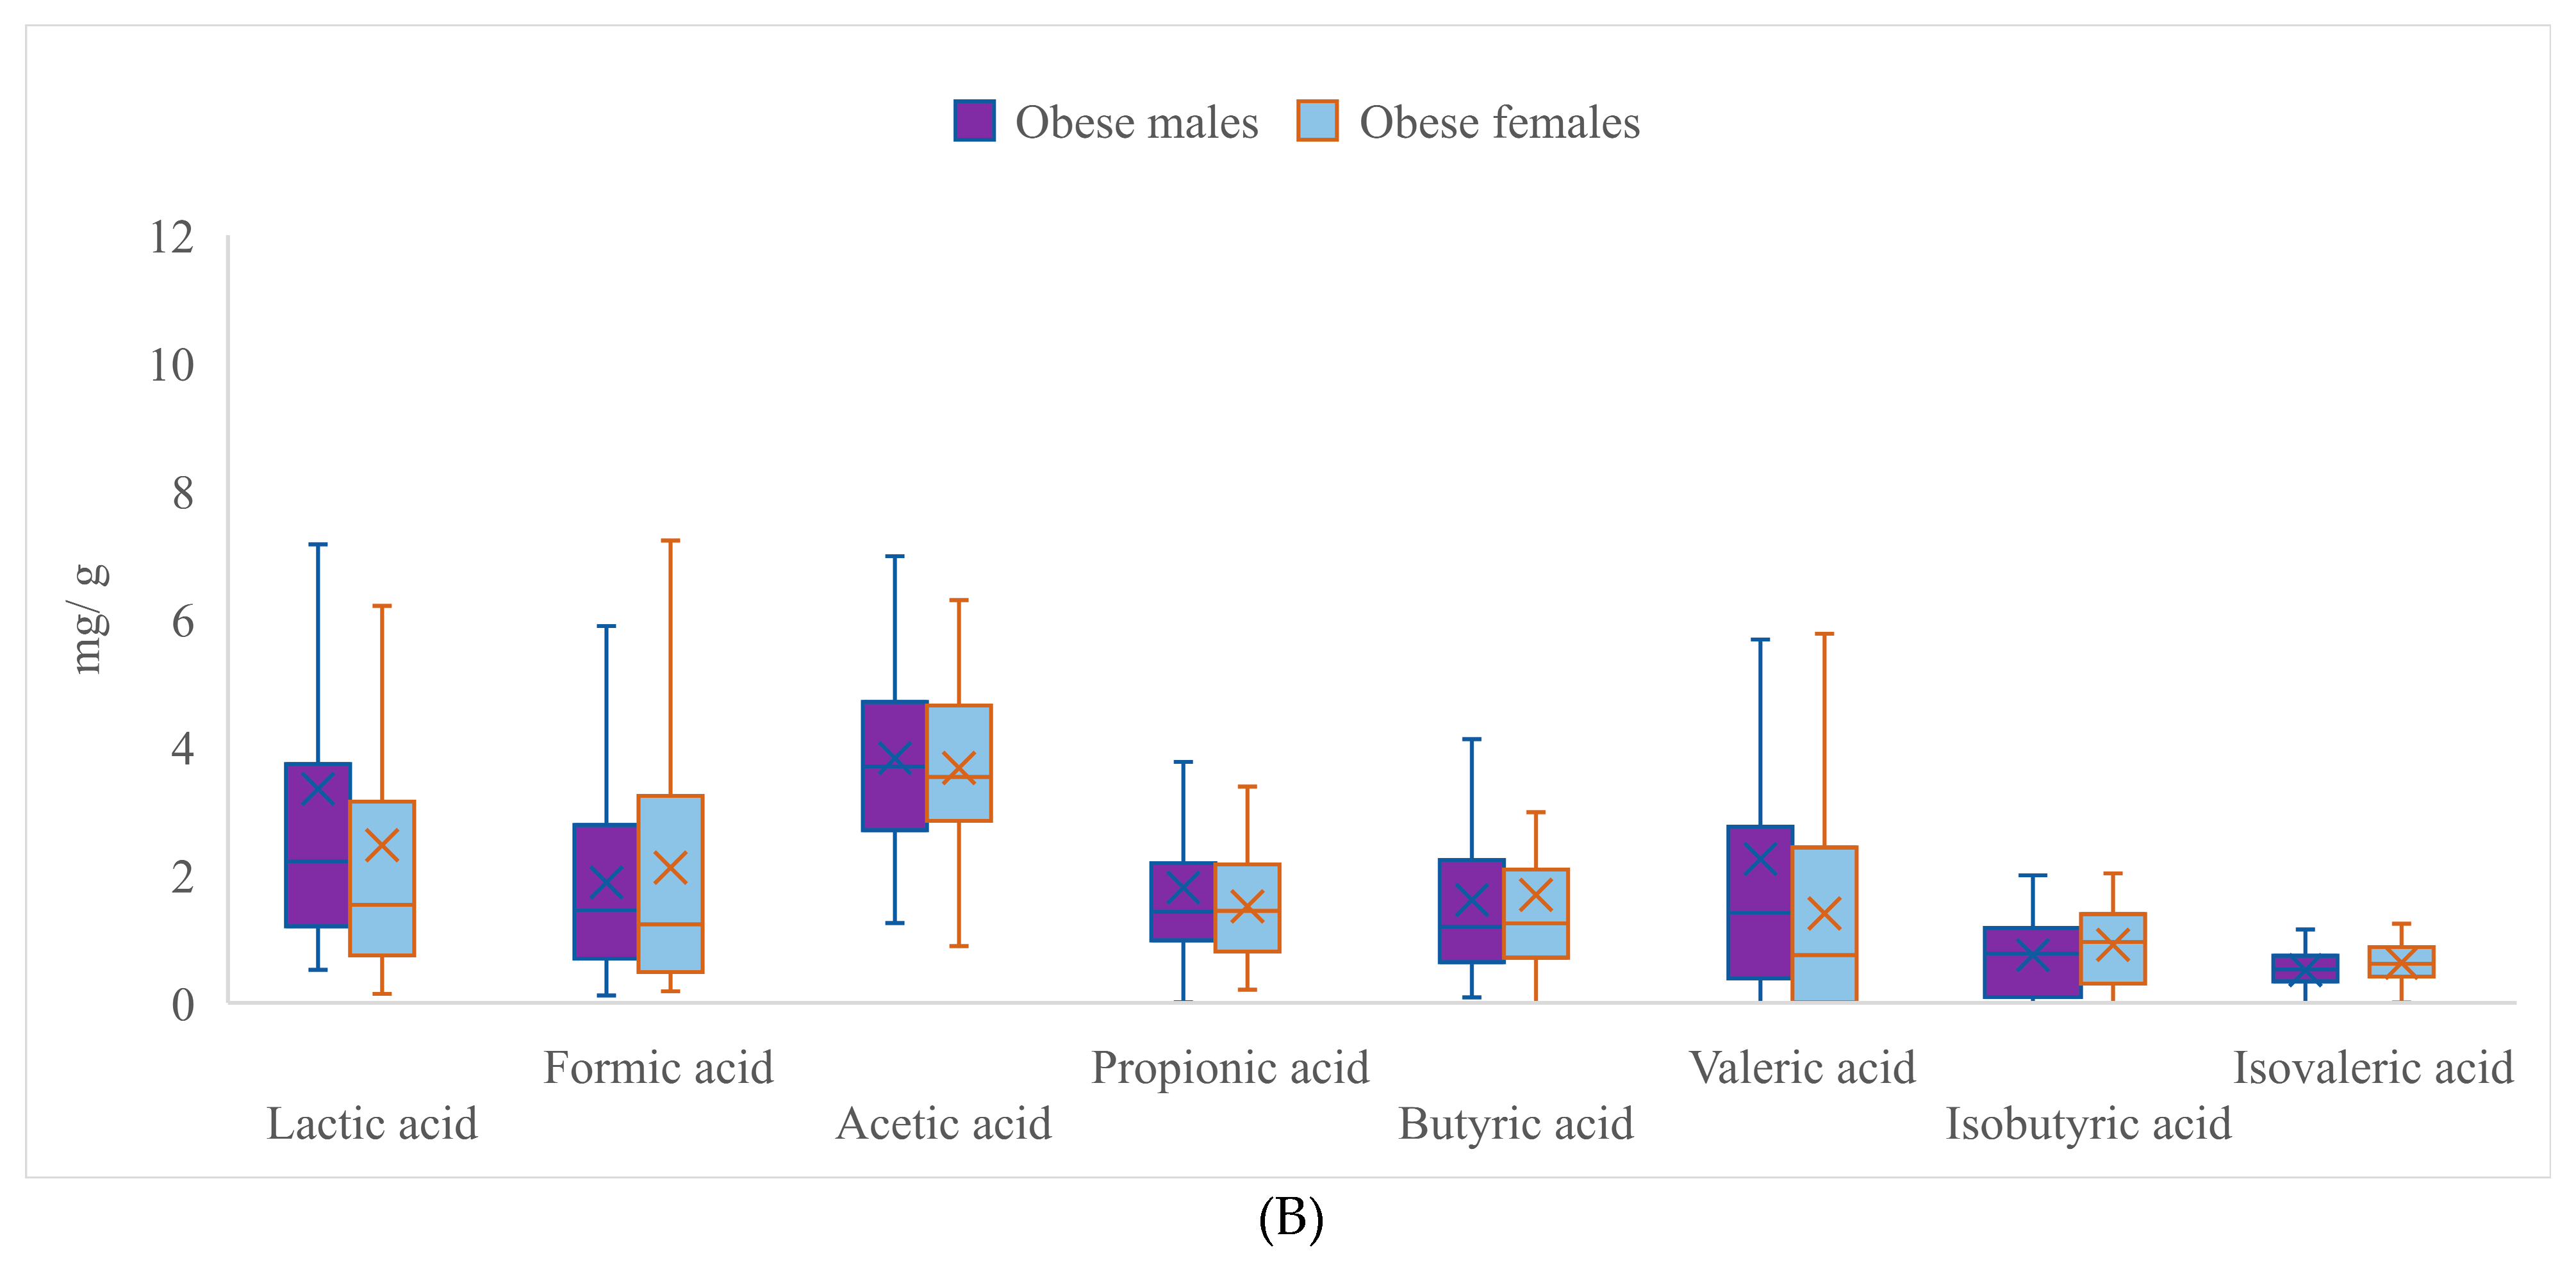
| Lactic Acid | Formic Acid | Acetic Acid | Propionic Acid | |||||
|---|---|---|---|---|---|---|---|---|
| Male | Female | Male | Female | Male | Female | Male | Female | |
| Mean | 3.528 * | 2.672 ** | 1.935 * | 2.373 ** | 3.843 | 3.869 | 1.750 | 1.647 |
| SD | 3.520 | 3.200 | 1.394 | 2.045 | 1.444 | 1.446 | 1.229 | 0.843 |
| Range | 18.312 | 20.483 | 6.805 | 9.747 | 5.978 | 7.959 | 6.980 | 3.568 |
| Min | 0.517 | 0.142 | 0.116 | 0.182 | 1.001 | 0.027 | 0.008 | 0.206 |
| Max | 18.829 | 20.625 | 6.921 | 9.929 | 6.979 | 7.987 | 6.988 | 3.774 |
| Butyric acid | Valeric acid | Isobutyric acid | Isovaleric acid | |||||
| Male | Female | Male | Female | Male | Female | Male | Female | |
| Mean | 1.713 | 1.865 | 2.128 * | 1.575 ** | 0.703 * | 0.894 ** | 0.500 * | 0.618 ** |
| SD | 1.155 | 2.003 | 2.704 | 1.799 | 0.531 | 0.554 | 0.284 | 0.277 |
| Range | 5.041 | 15.127 | 15.718 | 8.332 | 1.995 | 2.023 | 1.147 | 1.231 |
| Min | 0.086 | 0.000 | 0.000 | 0.000 | 0.000 | 0.001 | 0.000 | 0.007 |
| Max | 5.127 | 15.127 | 15.718 | 8.332 | 1.995 | 2.025 | 1.147 | 1.238 |
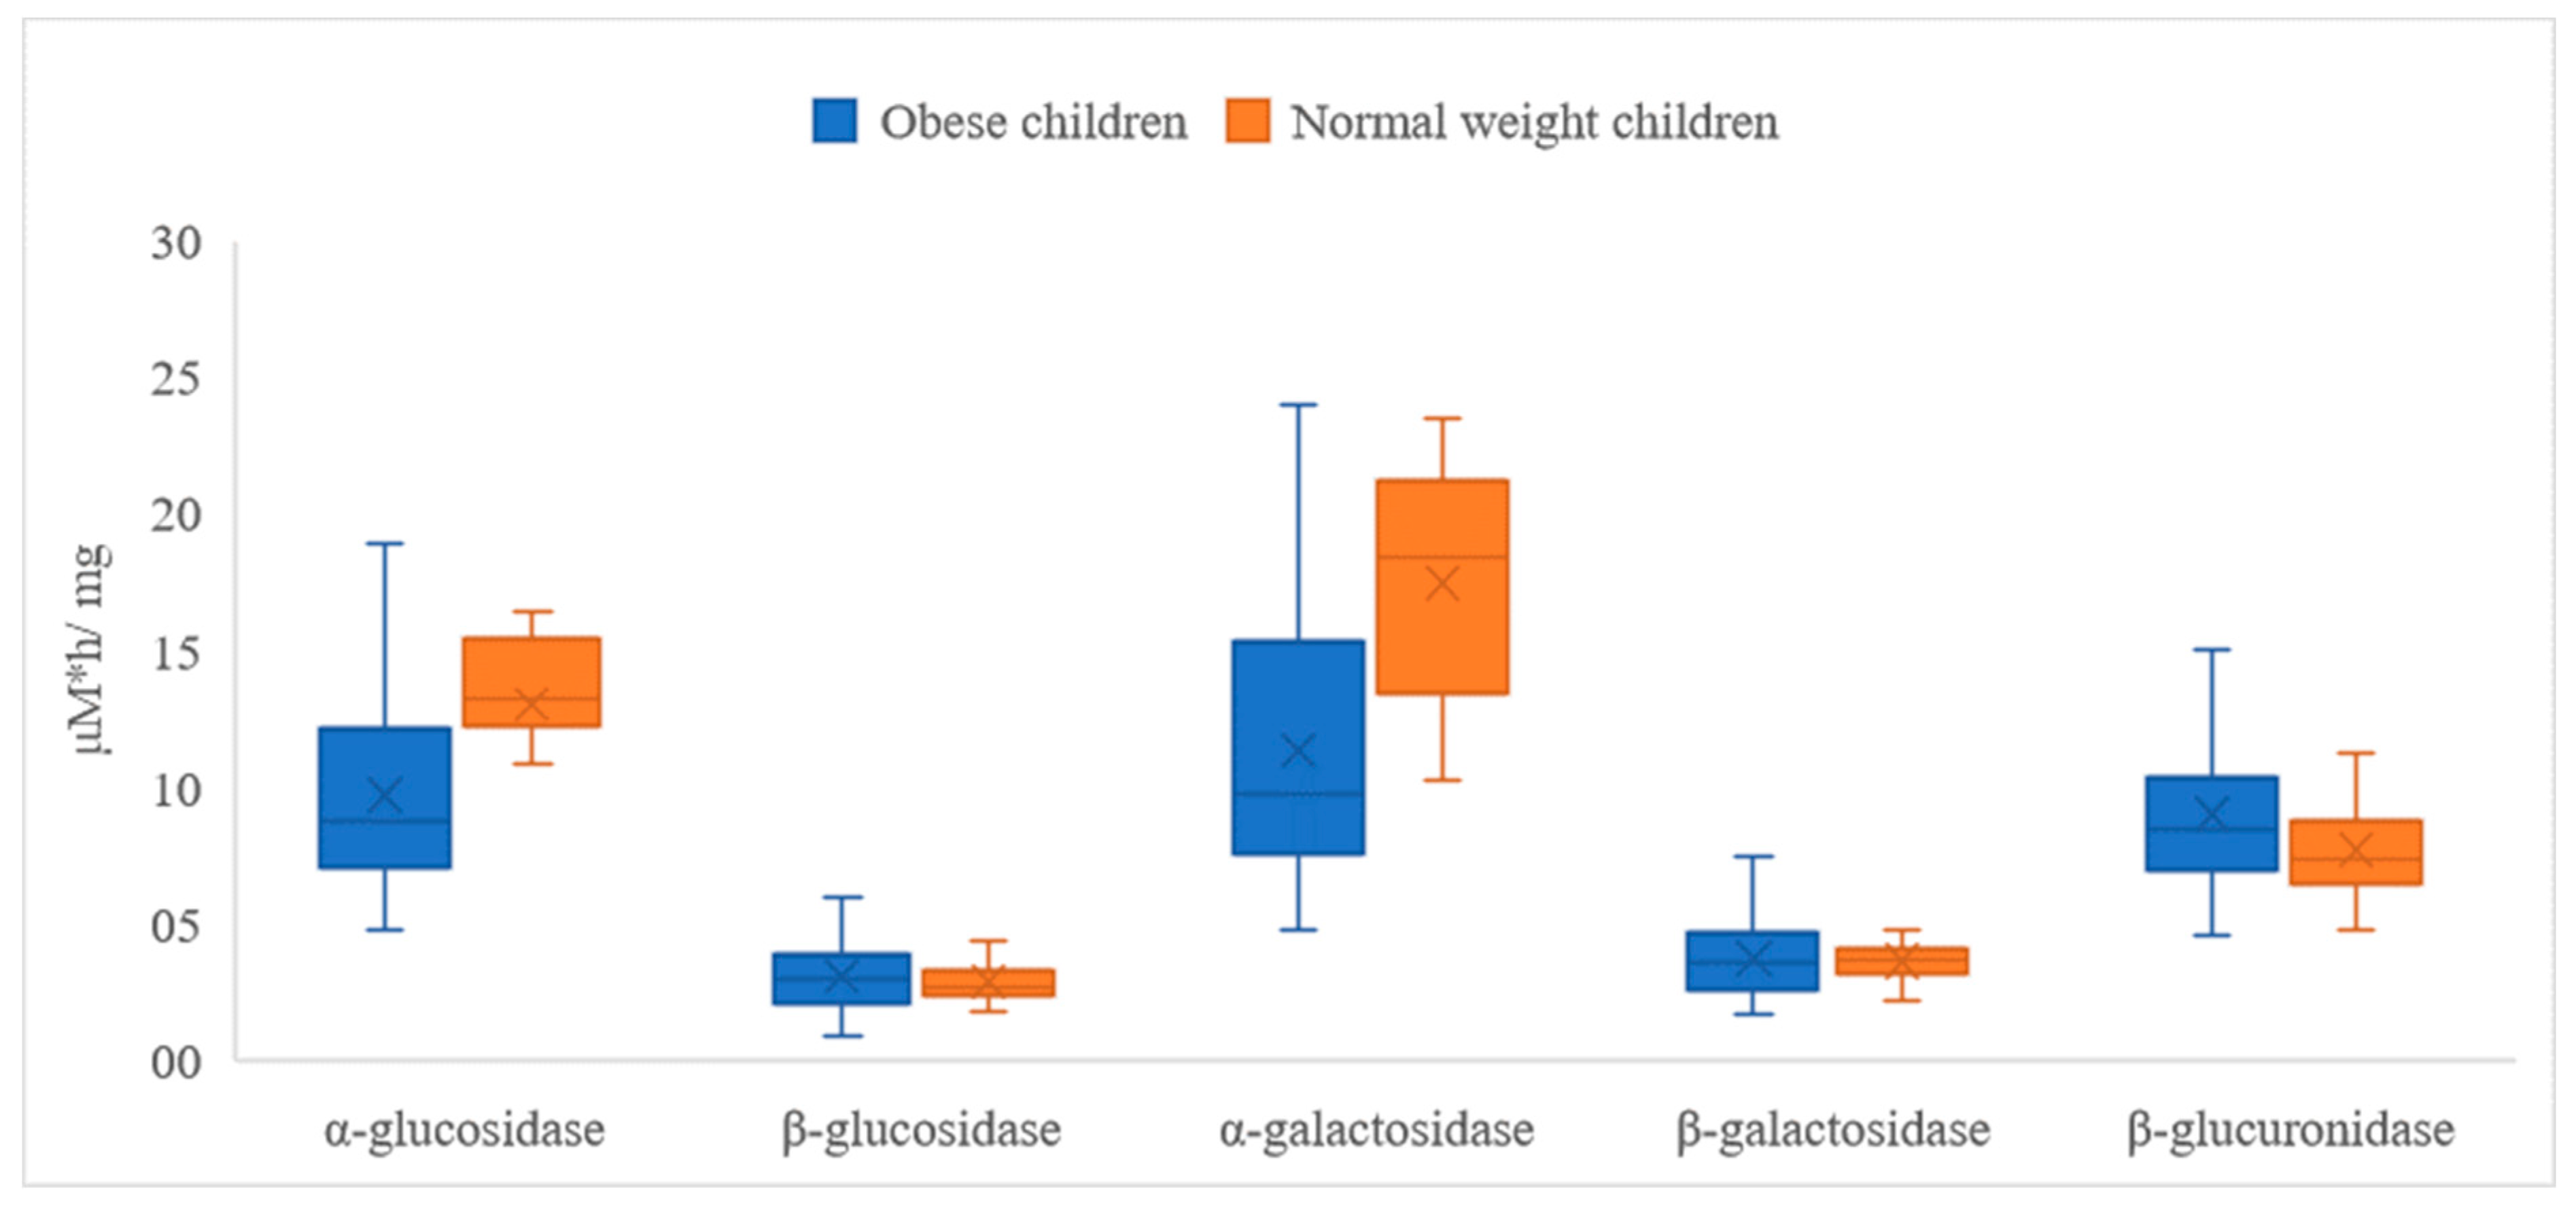
| α-Glucosidase | β-Glucosidase | α-Galactosidase | ||||
|---|---|---|---|---|---|---|
| Obese | Normal Weight | Obese | Normal Weight | Obese | Normal Weight | |
| Mean | 9.660 * | 13.015 ** | 3.077 | 2.845 | 11.348 * | 17.474 ** |
| SD | 3.373 | 2.810 | 1.289 | 0.759 | 5.004 | 4.124 |
| Range | 14.175 | 9.772 | 7.848 | 3.410 | 19.160 | 13.246 |
| Min | 4.745 | 6.621 | 0.913 | 1.779 | 4.780 | 10.258 |
| Max | 18.920 | 16.393 | 8.760 | 5.190 | 23.941 | 23.504 |
| β-galactosidase | β-glucuronidase | |||||
| Obese | Normal weight | Obese | Normal weight | |||
| Mean | 3.718 | 3.628 | 8.975 * | 7.674 ** | ||
| SD | 1.303 | 0.651 | 2.917 | 1.825 | ||
| Range | 5.786 | 2.529 | 12.981 | 6.464 | ||
| Min | 1.645 | 2.176 | 4.516 | 4.743 | ||
| Max | 7.430 | 4.705 | 17.497 | 11.207 | ||
| α-Glucosidase | β-Glucosidase | α-Galactosidase | ||||
|---|---|---|---|---|---|---|
| Male | Female | Male | Female | Male | Female | |
| Mean | 10.369 | 10.408 | 3.093 | 2.987 | 12.467 | 12.842 |
| SD | 3.507 | 3.514 | 1.293 | 1.097 | 5.376 | 5.430 |
| Range | 13.336 | 14.175 | 7.848 | 4.555 | 18.940 | 18.242 |
| Min | 5.231 | 4.745 | 0.913 | 1.078 | 5.000 | 4.780 |
| Max | 18.567 | 18.920 | 8.760 | 5.633 | 23.941 | 23.022 |
| β-galactosidase | β-glucuronidase | |||||
| Male | Female | Male | Female | |||
| Mean | 3.731 | 3.690 | 8.614 | 8.811 | ||
| SD | 1.215 | 1.167 | 2.556 | 2.943 | ||
| Range | 5.781 | 5.206 | 11.092 | 12.981 | ||
| Min | 1.650 | 1.645 | 4.815 | 4.516 | ||
| Max | 7.430 | 6.851 | 15.907 | 17.497 | ||
Disclaimer/Publisher’s Note: The statements, opinions and data contained in all publications are solely those of the individual author(s) and contributor(s) and not of MDPI and/or the editor(s). MDPI and/or the editor(s) disclaim responsibility for any injury to people or property resulting from any ideas, methods, instructions or products referred to in the content. |
© 2023 by the authors. Licensee MDPI, Basel, Switzerland. This article is an open access article distributed under the terms and conditions of the Creative Commons Attribution (CC BY) license (https://creativecommons.org/licenses/by/4.0/).
Share and Cite
Śliżewska, K.; Włodarczyk, M.; Sobczak, M.; Barczyńska, R.; Kapuśniak, J.; Socha, P.; Wierzbicka-Rucińska, A.; Kotowska, A. Comparison of the Activity of Fecal Enzymes and Concentration of SCFA in Healthy and Overweight Children. Nutrients 2023, 15, 987. https://doi.org/10.3390/nu15040987
Śliżewska K, Włodarczyk M, Sobczak M, Barczyńska R, Kapuśniak J, Socha P, Wierzbicka-Rucińska A, Kotowska A. Comparison of the Activity of Fecal Enzymes and Concentration of SCFA in Healthy and Overweight Children. Nutrients. 2023; 15(4):987. https://doi.org/10.3390/nu15040987
Chicago/Turabian StyleŚliżewska, Katarzyna, Michał Włodarczyk, Martyna Sobczak, Renata Barczyńska, Janusz Kapuśniak, Piotr Socha, Aldona Wierzbicka-Rucińska, and Aneta Kotowska. 2023. "Comparison of the Activity of Fecal Enzymes and Concentration of SCFA in Healthy and Overweight Children" Nutrients 15, no. 4: 987. https://doi.org/10.3390/nu15040987
APA StyleŚliżewska, K., Włodarczyk, M., Sobczak, M., Barczyńska, R., Kapuśniak, J., Socha, P., Wierzbicka-Rucińska, A., & Kotowska, A. (2023). Comparison of the Activity of Fecal Enzymes and Concentration of SCFA in Healthy and Overweight Children. Nutrients, 15(4), 987. https://doi.org/10.3390/nu15040987