
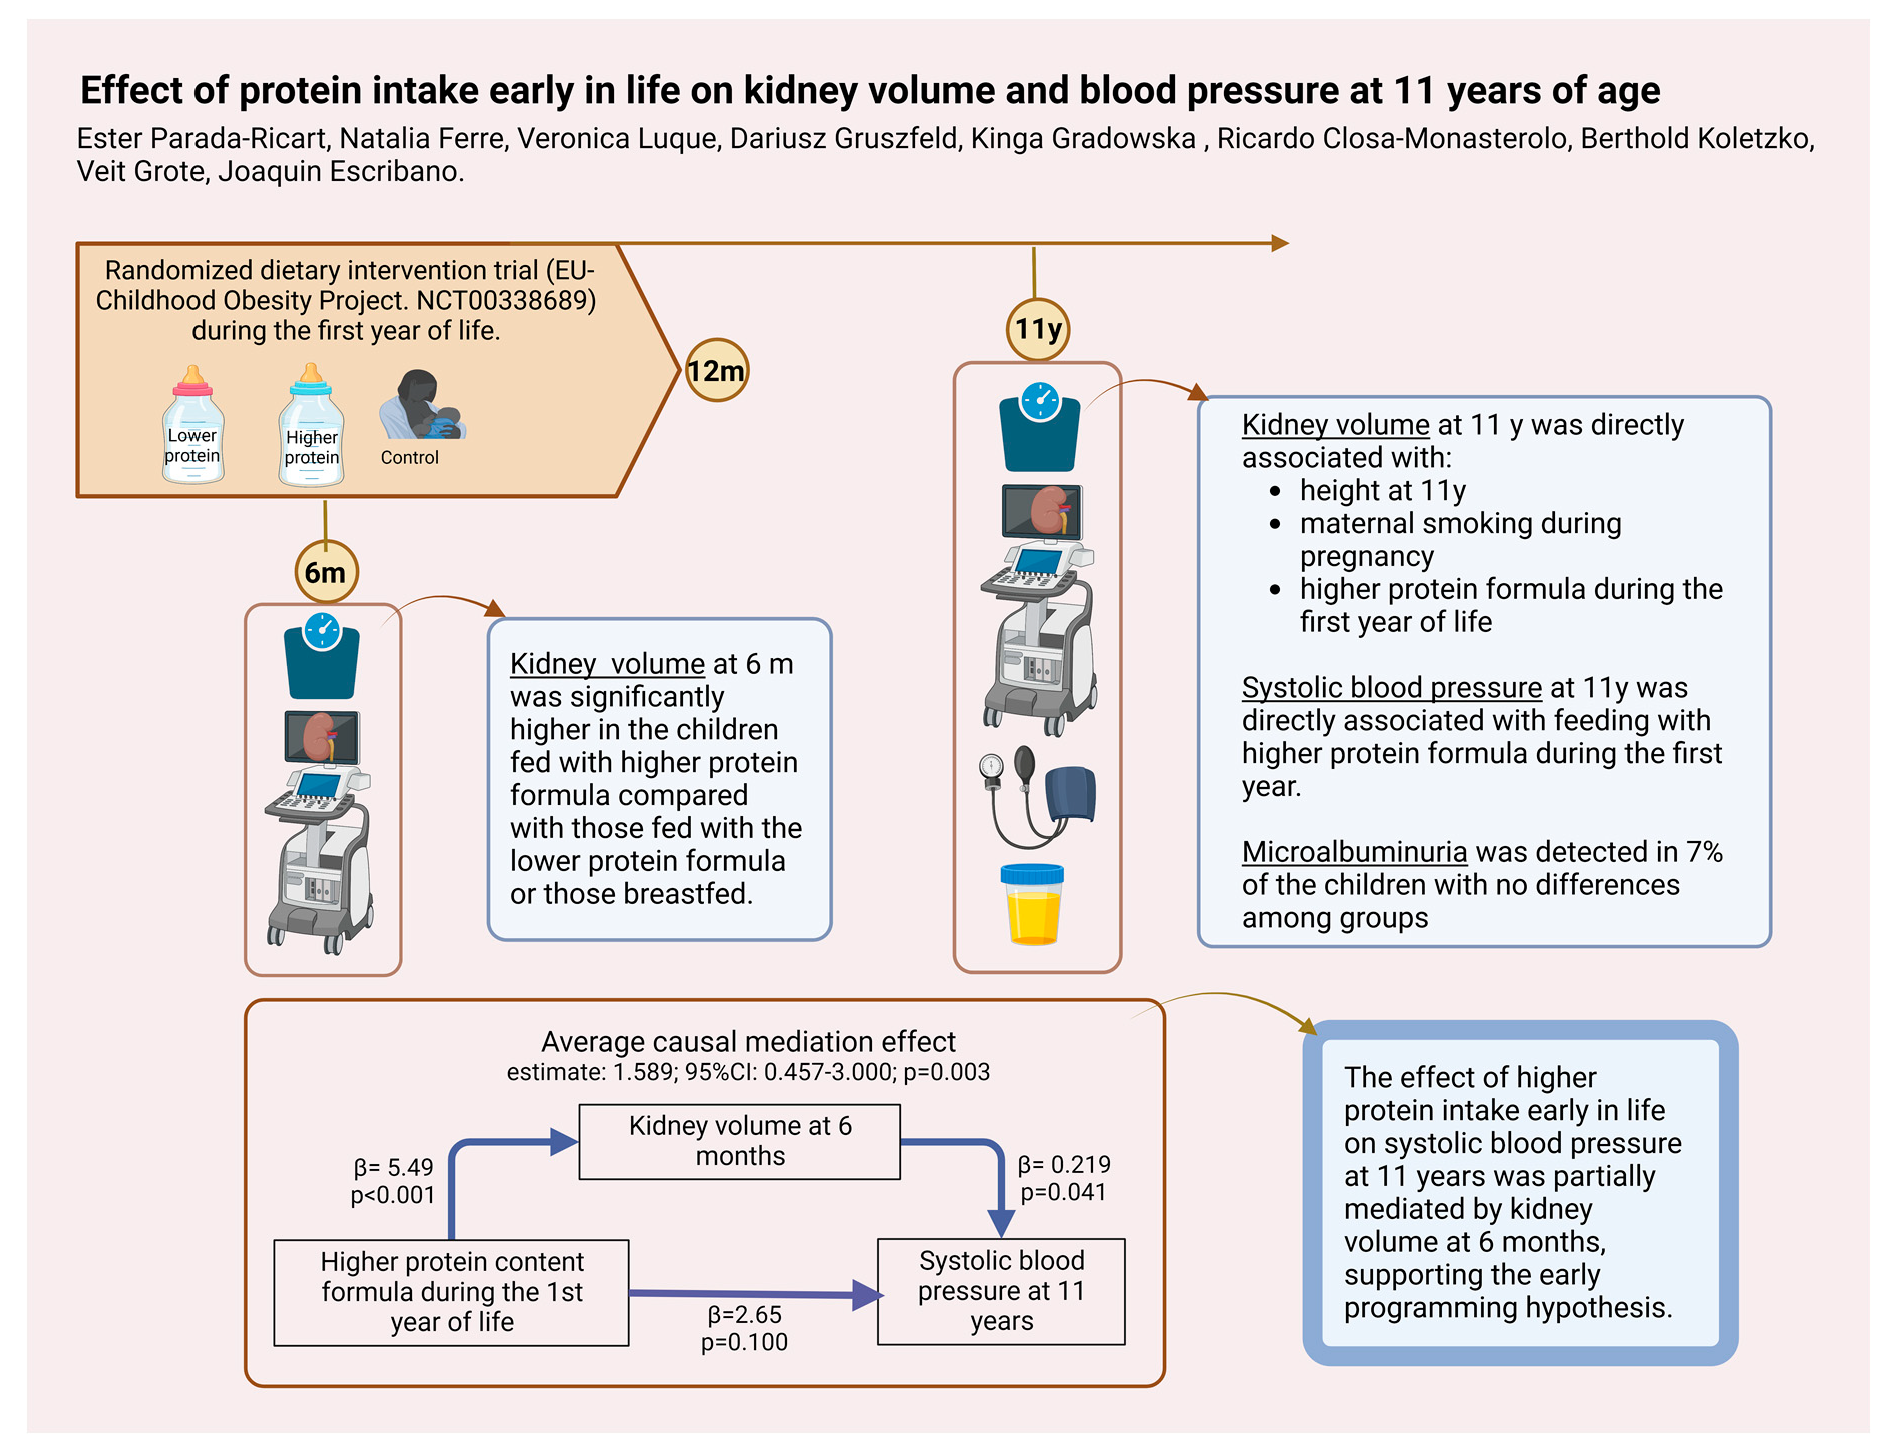
Effect of Protein Intake Early in Life on Kidney Volume and Blood Pressure at 11 Years of Age

 , , , , , and
Abstract

1. Introduction
2. Materials and Methods
2.1. Measurements
2.2. Data Analysis
3. Results
3.1. Anthropometry
3.2. Kidney Size
3.3. Microalbuminuria and Proteinuria at 11 Years
3.4. Blood Pressure
4. Discussion
4.1. Kidney Volume
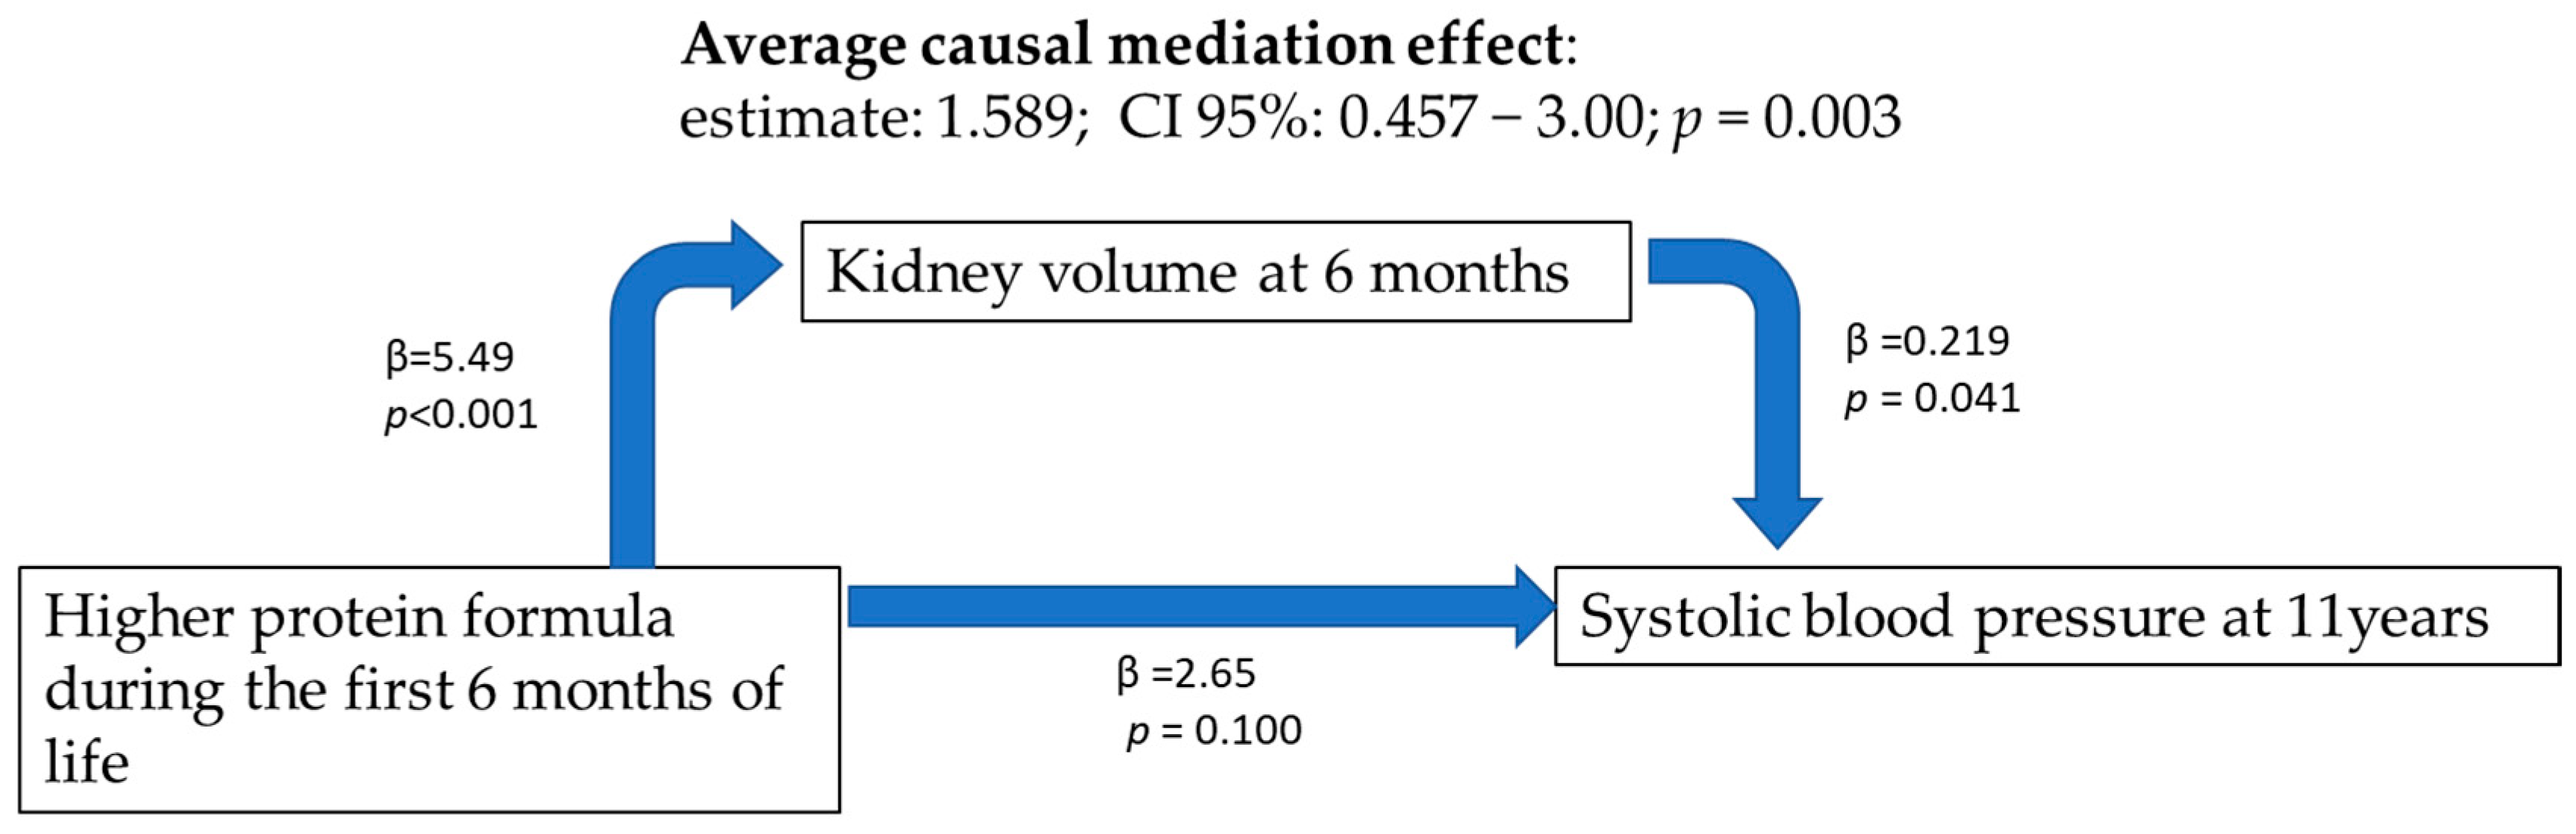
4.2. Blood Pressure
5. Conclusions
Supplementary Materials
Author Contributions
Funding
Institutional Review Board Statement
Informed Consent Statement
Data Availability Statement
Conflicts of Interest
References
- Barker, D.J.P. The origins of the developmental origins theory. J. Intern. Med. 2007, 261, 412–417. [Google Scholar] [CrossRef] [PubMed]
- Luyckx, V.A.; Brenner, B.M. Low birth weight, nephron number, and kidney disease. Kidney Int. 2005, 68, S68–S77. [Google Scholar] [CrossRef] [PubMed]
- Brenner, B.M.; Charlton, J.; Luyckx, V.; Manfellotto, D.; Perico, N.; Remuzzi, G.; Somaschini, M.; Valensise, H.; Allegaert, K.; Benedetto, C. The Low Birth Weight and Nephron Number Working Group The Impact of Kidney Development on the Life Course: A Consensus Document for Action. Nephron 2017, 136, 3–49. [Google Scholar] [CrossRef]
- Luyckx, V.A.; Perico, N.; Somaschini, M.; Manfellotto, D.; Valensise, H.; Cetin, I.; Simeoni, U.; Allegaert, K.; Vikse, B.E.; Steegers, E.A.; et al. A developmental approach to the prevention of hypertension and kidney disease: A report from the Low Birth Weight and Nephron Number Working Group. Lancet 2017, 390, 424–428. [Google Scholar] [CrossRef]
- Langley-Evans, S.C. Nutritional programming of disease: Unravelling the mechanism. J. Anat. 2009, 215, 36–51. [Google Scholar] [CrossRef]
- Ko, G.-J.; Rhee, C.M.; Kalantar-Zadeh, K.; Joshi, S. The Effects of High-Protein Diets on Kidney Health and Longevity. J. Am. Soc. Nephrol. 2020, 31, 1667–1679. [Google Scholar] [CrossRef]
- Hostetter, T.H.; Meyer, T.W.; Rennke, H.G.; Brenner, B.M.; Noddin, J.A.; Sandstrom, D.J. Chronic effects of dietary protein in the rat with intact and reduced renal mass. Kidney Int. 1986, 30, 509–517. [Google Scholar] [CrossRef]
- Escribano, J.; Luque, V.; Ferre, N.; Zaragoza-Jordana, M.; Grote, V.; Koletzko, B.; Gruszfeld, D.; Socha, P.; Dain, E.; Van Hees, J.-N.; et al. Increased protein intake augments kidney volume and function in healthy infants. Kidney Int. 2011, 79, 783–790. [Google Scholar] [CrossRef]
- Koletzko, B.; von Kries, R.; Closa, R.; Escribano, J.; Scaglioni, S.; Giovannini, M.; Beyer, J.; Demmelmair, H.; Gruszfeld, D.; Dobrzanska, A.; et al. Lower protein in infant formula is associated with lower weight up to age 2 y: A randomized clinical trial. Am. J. Clin. Nutr. 2009, 89, 1836–1845. [Google Scholar] [CrossRef]
- Luque, V.; Escribano, J.; Grote, V.; Ferre, N.; Koletzko, B.; Gruszfeld, D.; Socha, P.; Langhendries, J.-P.; Goyens, P.; Closa-Monasterolo, R.; et al. Does insulin-like growth factor-1 mediate protein-induced kidney growth in infants?: A secondary analysis from a randomized controlled trial. Pediatr. Res. 2013, 74, 223–229. [Google Scholar] [CrossRef]
- De Onis, M.; Onyango, A.W.; Borghi, E.; Siyam, A.; Nishida, C.; Siekmann, J. Development of a WHO growth reference for school-aged children and adolescents. Bull. World Health Organ. 2007, 85, 660–667. [Google Scholar] [CrossRef] [PubMed]
- Flynn, J.T.; Falkner, B.E. New Clinical Practice Guideline for the Management of High Blood Pressure in Children and Adolescents. Hypertension 2017, 70, 683–686. [Google Scholar] [CrossRef] [PubMed]
- Tingley, D.; Yamamoto, T.; Hirose, K.; Keele, L.; Imai, K. mediation: R Package for Causal Mediation Analysis. J. Stat. Softw. 2014, 59, 1–38. [Google Scholar] [CrossRef]
- Schmidt, I.M.; Damgaard, I.N.; Boisen, K.A.; Mau, C.; Chellakooty, M.; Olgaard, K.; Main, K.M. Increased kidney growth in formula-fed versus breast-fed healthy infants. Pediatr. Nephrol. 2004, 19, 1137–1144. [Google Scholar] [CrossRef] [PubMed]
- Miliku, K.; Voortman, T.; Bakker, H.; Hofman, A.; Franco, O.H.; Jaddoe, V.W. Infant Breastfeeding and Kidney Function in School-Aged Children. Am. J. Kidney Dis. 2015, 66, 421–428. [Google Scholar] [CrossRef]
- Bakker, H.; Gaillard, R.; Franco, O.H.; Hofman, A.; van der Heijden, A.J.; Steegers, E.A.; Taal, H.R.; Jaddoe, V.W. Fetal and Infant Growth Patterns and Kidney Function at School Age. J. Am. Soc. Nephrol. 2014, 25, 2607–2615. [Google Scholar] [CrossRef]
- Al-Odat, I.; Chen, H.; Chan, Y.L.; Amgad, S.; Wong, M.G.; Gill, A.; Pollock, C.; Saad, S. The Impact of Maternal Cigarette Smoke Exposure in a Rodent Model on Renal Development in the Offspring. PLoS ONE 2014, 9, e103443. [Google Scholar] [CrossRef]
- Al-Sawalha, N.A.; Almahmmod, Y.; Awawdeh, M.S.; Alzoubi, K.H.; Khabour, O.F. Effect of waterpipe tobacco smoke exposure on the development of metabolic syndrome in adult male rats. PLoS ONE 2020, 15, e0234516. [Google Scholar] [CrossRef]
- De Smidt, J.J.A.; Odendaal, H.J.; Nel, D.G.; Nolan, H.; Du Plessis, C.; Brink, L.T.; Oelofse, A. The effects of in utero exposure to teratogens on organ size: A prospective paediatric study. J. Dev. Orig. Health Dis. 2020, 12, 748–757. [Google Scholar] [CrossRef]
- Taal, H.R.; Geelhoed, J.J.M.; Steegers, E.A.P.; Hofman, A.; Moll, H.A.; Lequin, M.; Van Der Heijden, A.J.; Jaddoe, V.W.V. Maternal smoking during pregnancy and kidney volume in the offspring: The Generation R Study. Pediatr. Nephrol. 2011, 26, 1275–1283. [Google Scholar] [CrossRef]
- Juvet, C.; Siddeek, B.; Yzydorczyk, C.; Vergely, C.; Nardou, K.; Armengaud, J.-B.; Benahmed, M.; Simeoni, U.; Cachat, F.; Chehade, H. Renal Programming by Transient Postnatal Overfeeding: The Role of Senescence Pathways. Front. Physiol. 2020, 11, 511. [Google Scholar] [CrossRef] [PubMed]
- Brenner, B.M.; Garcia, D.L.; Anderson, S. Glomeruli and Blood Pressure: Less of One, More the Other? Am. J. Hypertens. 1988, 1, 335–347. [Google Scholar] [CrossRef] [PubMed]
- Keller, G.; Zimmer, G.; Mall, G.; Ritz, E.; Amann, K. Nephron Number in Patients with Primary Hypertension. N. Engl. J. Med. 2003, 348, 101–108. [Google Scholar] [CrossRef] [PubMed]
- Lizarraga-Mollinedo, E.; Martínez-Calcerrada, J.-M.; Padrós-Fornieles, C.; Mas-Pares, B.; Xargay-Torrent, S.; Riera-Pérez, E.; Prats-Puig, A.; Carreras-Badosa, G.; de Zegher, F.; Ibáñez, L.; et al. Renal size and cardiovascular risk in prepubertal children. Sci. Rep. 2019, 9, 5265. [Google Scholar] [CrossRef] [PubMed]
- Bakker, H.; Kooijman, M.N.; Van Der Heijden, A.J.; Hofman, A.; Franco, O.; Taal, H.R.; Jaddoe, V.W.V. Kidney size and function in a multi-ethnic population-based cohort of school-age children. Pediatr. Nephrol. 2014, 29, 1589–1598. [Google Scholar] [CrossRef] [PubMed]


| Lower Protein N = 83 | Higher Protein N = 80 | Breastfeeding N = 69 | p. Overall | |
|---|---|---|---|---|
| Country (Poland/Spain) | 22/61 | 20/60 | 24/45 | 0.371 |
| Sex (female) a | 39 (47.0) | 39 (49.8) | 39 (56.5) | 0.470 |
| Birth weight (kg) | 3.25 (0.33) | 3.20 (0.34) | 3.27 (0.36) | 0.417 |
| Smoking during preg a | 34 (40.9) | 18 (22.5) | 7 (10.1) | <0.001 |
| Weight at 6 m (kg) | 7.74 (0.86) | 7.89 (0.83) ** | 7.43 (0.86) | 0.004 |
| Length at 6 m (cm) | 67.4 (2.04) | 67.4 (2.40) | 66.6 (2.63) | 0.080 |
| BMI at 6 m (kg/m2) | 17.0 (1.39) | 17.4 (1.36) ** | 16.7 (1.34) | 0.013 |
| Weight z-score at 6 m | 0.09 (0.92) | 0.27 (0.88) ** | −0.20 (0.91) | 0.007 |
| Length z-score at 6 m | 0.33 (0.90) | 0.34 (1.04) | 0.06 (1.10) | 0.164 |
| BMI z-score at 6 m | −0.14 (0.94) | 0.11 (0.91) * | −0.31 (0.91) | 0.020 |
| Weight at 11 years (kg) | 41.3 (9.6) | 42.4 (11.6) | 40.7 (10.4) | 0.621 |
| Height at 11 years (cm) | 147 (6) | 147 (7) | 148 (8) | 0.741 |
| BMI at 11 years (kg/m2) | 19.0 (3.5) | 19.4 (4.0) | 18.5 (3.3) | 0.322 |
| Height z-score at 11 years | 0.35 (0.90) | 0.39 (1.07) | 0.47 (1.18) | 0.788 |
| BMI z-score at 11 years | 0.50 (1.25) | 0.61 (1.25) | 0.30 (1.20) | 0.309 |
| SBP at 11 years (mm Hg) | 105 (10.6) | 108 (9.28) | 105 (10.3) | 0.137 |
| SBP percentile at 11 years | 54.7 (29.5) | 65.3 (24.8) † | 57.0 (28.7) | 0.042 |
| DBP at 11 years (mm Hg) | 58.0 (6.4) | 58.6 (6.2) | 57.6 (6.7) | 0.609 |
| DBP percentile at 11 years | 36.9 (6.9) | 38.8 (19.6) | 35.2 (19.6) | 0.532 |
| Lower Protein N = 83 | Higher Protein N = 80 | Breastfeeding N = 69 | |
|---|---|---|---|
| Left kidney length at 6 m (cm) | 5.44 (0.45) | 5.65 (0.46) **,† | 5.30 (0.41) |
| Right kidney length at 6 m (cm) | 5.41 (0.45) * | 5.61 (0.41) **,† | 5.23 (0.41) |
| Left kidney volume at 6 m (cm3) | 18.6 (4.7) | 21.2 (5.1) **,† | 18.0 (4.2) |
| Right kidney volume at 6 m (cm3) | 18.7 (4.9) | 21.2 (5.1) **,† | 17.5 (4.5) |
| Total kidney volume at 6 m (cm3) | 37.4 (8.9) | 42.4 (9.3) **,† | 35.6 (7.8) |
| Left kidney length at 11 years (cm) | 9.11 (0.68) | 9.23 (0.63) * | 8.95 (0.83) |
| Right kidney length at 11 years (cm) | 8.92 (0.83) | 9.14 (0.75) ** | 8.73 (0.84) |
| Left kidney volume at 11 years (cm3) | 77.5 (16.2) | 80.7 (17.9) | 77.0 (18.4) |
| Right kidney volume at 11 years (cm3) | 73.3 (22.0) | 77.2 (16.6) | 72.3 (14.2) |
| Total kidney volume at 11 years (cm3) | 151 (34.7) | 158 (31.9) | 149 (30.1) |
| Total kidney volume/weight at 11 years (cm3/kg) | 3.75 (0.86) | 3.84 (0.67) | 3.75 (0.67) |
| Total kidney volume/height at 11 years (cm3/cm) | 1.02 (0.22) | 1.07 (0.19) | 1.01 (0.18) |
| Total kidney volume/BMI at 11 years (cm3/kg/m2) | 8.08 (1.94) | 8.26 (1.29) | 8.17 (1.47) |
| Total Kidney Volume at 11y | |||
|---|---|---|---|
| Predictors | β | CI | p |
| (Intercept) | −221.65 | −300.20–−143.11 | <0.001 |
| Country (Spain) | 0.30 | −7.80–8.39 | 0.942 |
| Sex (female) | 4.97 | −2.51–12.44 | 0.192 |
| Birth weight (kg) | 8.23 | −3.04–19.51 | 0.152 |
| Smoking during pregnancy (yes) | 9.58 | 0.96–18.21 | 0.030 |
| Feeding type/intervention first year Higher protein formula | 8.71 | 0.09–17.33 | 0.048 |
| Feeding: breastfeeding | −1.33 | −10.52–7.87 | 0.777 |
| Height at 11 years (cm) | 2.31 | 1.79–2.83 | <0.001 |
| R2/R2 adjusted | 0.315/0.294 | ||
| SBP at 11 Years (a) | SBP at 11 Years (b) | SBP at 11 Years (c) | |||||||
|---|---|---|---|---|---|---|---|---|---|
| Predictors | β | CI | p | β | CI | p | β | CI | p |
| (Intercept) | 91.53 | 79.19–103.87 | <0.001 | 90.28 | 77.67–102.88 | <0.001 | 88.47 | 75.05–101.88 | <0.001 |
| Country (Spain) | 1.85 | −0.64–4.33 | 0.144 | 1.86 | −0.62–4.35 | 0.141 | 1.87 | −0.61–4.35 | 0.139 |
| Sex (female) | 0.75 | −1.53–3.03 | 0.517 | 0.88 | −1.41–3.17 | 0.450 | 0.57 | −1.73–2.86 | 0.627 |
| Smoke during pregnancy | 4.04 | 1.36–6.71 | 0.003 | 3.92 | 1.24–6.60 | 0.004 | 3.88 | 1.20–6.57 | 0.005 |
| Birth weight | 2.40 | −1.10–5.89 | 0.178 | 2.03 | −1.55–5.61 | 0.265 | 2.28 | −1.22–5.78 | 0.201 |
| Feeding | |||||||||
| LP formula | baseline | ||||||||
| HP formula | 3.43 | 0.78–6.08 | 0.011 | 3.06 | 0.30–5.82 | 0.030 | 3.25 | 0.58–5.92 | 0.017 |
| Breastfeeding | 1.96 | −0.88–4.81 | 0.175 | 2.05 | −0.80–4.90 | 0.157 | 1.98 | −0.86–4.82 | 0.171 |
| BMI z-score at 11 years | 2.87 | 1.89–3.84 | <0.001 | 2.79 | 1.81–3.78 | <0.001 | 2.65 | 1.61–3.69 | <0.001 |
| Height z-score at 11 years | 2.52 | 1.36–3.67 | <0.001 | 2.49 | 1.33–3.65 | <0.001 | 2.22 | 0.95–3.48 | 0.001 |
| Kidney volume at 6 m | 0.07 | −0.07–0.20 | 0.335 | ||||||
| Kidney volume at 11 years | 0.03 | −0.02–0.07 | 0.253 | ||||||
| Observations | 229 | 229 | 229 | ||||||
| R2/R2 adjusted | 0.341/0.317 | 0.343/0.316 | 0.344/0.318 | ||||||
Disclaimer/Publisher’s Note: The statements, opinions and data contained in all publications are solely those of the individual author(s) and contributor(s) and not of MDPI and/or the editor(s). MDPI and/or the editor(s) disclaim responsibility for any injury to people or property resulting from any ideas, methods, instructions or products referred to in the content. |
© 2023 by the authors. Licensee MDPI, Basel, Switzerland. This article is an open access article distributed under the terms and conditions of the Creative Commons Attribution (CC BY) license (https://creativecommons.org/licenses/by/4.0/).
Share and Cite
Parada-Ricart, E.; Ferre, N.; Luque, V.; Gruszfeld, D.; Gradowska, K.; Closa-Monasterolo, R.; Koletzko, B.; Grote, V.; Escribano Subías, J. Effect of Protein Intake Early in Life on Kidney Volume and Blood Pressure at 11 Years of Age. Nutrients 2023, 15, 874. https://doi.org/10.3390/nu15040874
Parada-Ricart E, Ferre N, Luque V, Gruszfeld D, Gradowska K, Closa-Monasterolo R, Koletzko B, Grote V, Escribano Subías J. Effect of Protein Intake Early in Life on Kidney Volume and Blood Pressure at 11 Years of Age. Nutrients. 2023; 15(4):874. https://doi.org/10.3390/nu15040874
Chicago/Turabian StyleParada-Ricart, Ester, Natalia Ferre, Veronica Luque, Dariusz Gruszfeld, Kinga Gradowska, Ricardo Closa-Monasterolo, Berthold Koletzko, Veit Grote, and Joaquin Escribano Subías. 2023. "Effect of Protein Intake Early in Life on Kidney Volume and Blood Pressure at 11 Years of Age" Nutrients 15, no. 4: 874. https://doi.org/10.3390/nu15040874
APA StyleParada-Ricart, E., Ferre, N., Luque, V., Gruszfeld, D., Gradowska, K., Closa-Monasterolo, R., Koletzko, B., Grote, V., & Escribano Subías, J. (2023). Effect of Protein Intake Early in Life on Kidney Volume and Blood Pressure at 11 Years of Age. Nutrients, 15(4), 874. https://doi.org/10.3390/nu15040874