

The Impact of Nutrient Supply on Prostate Cancer Risk Worldwide

Abstract
:1. Introduction
2. Materials and Methods
2.1. Data Resources
2.2. Risk Factors
2.3. Statistical Analysis
3. Results
3.1. Characteristic Description of Nutritional Supply and Prostate Cancer Incidence by Countries
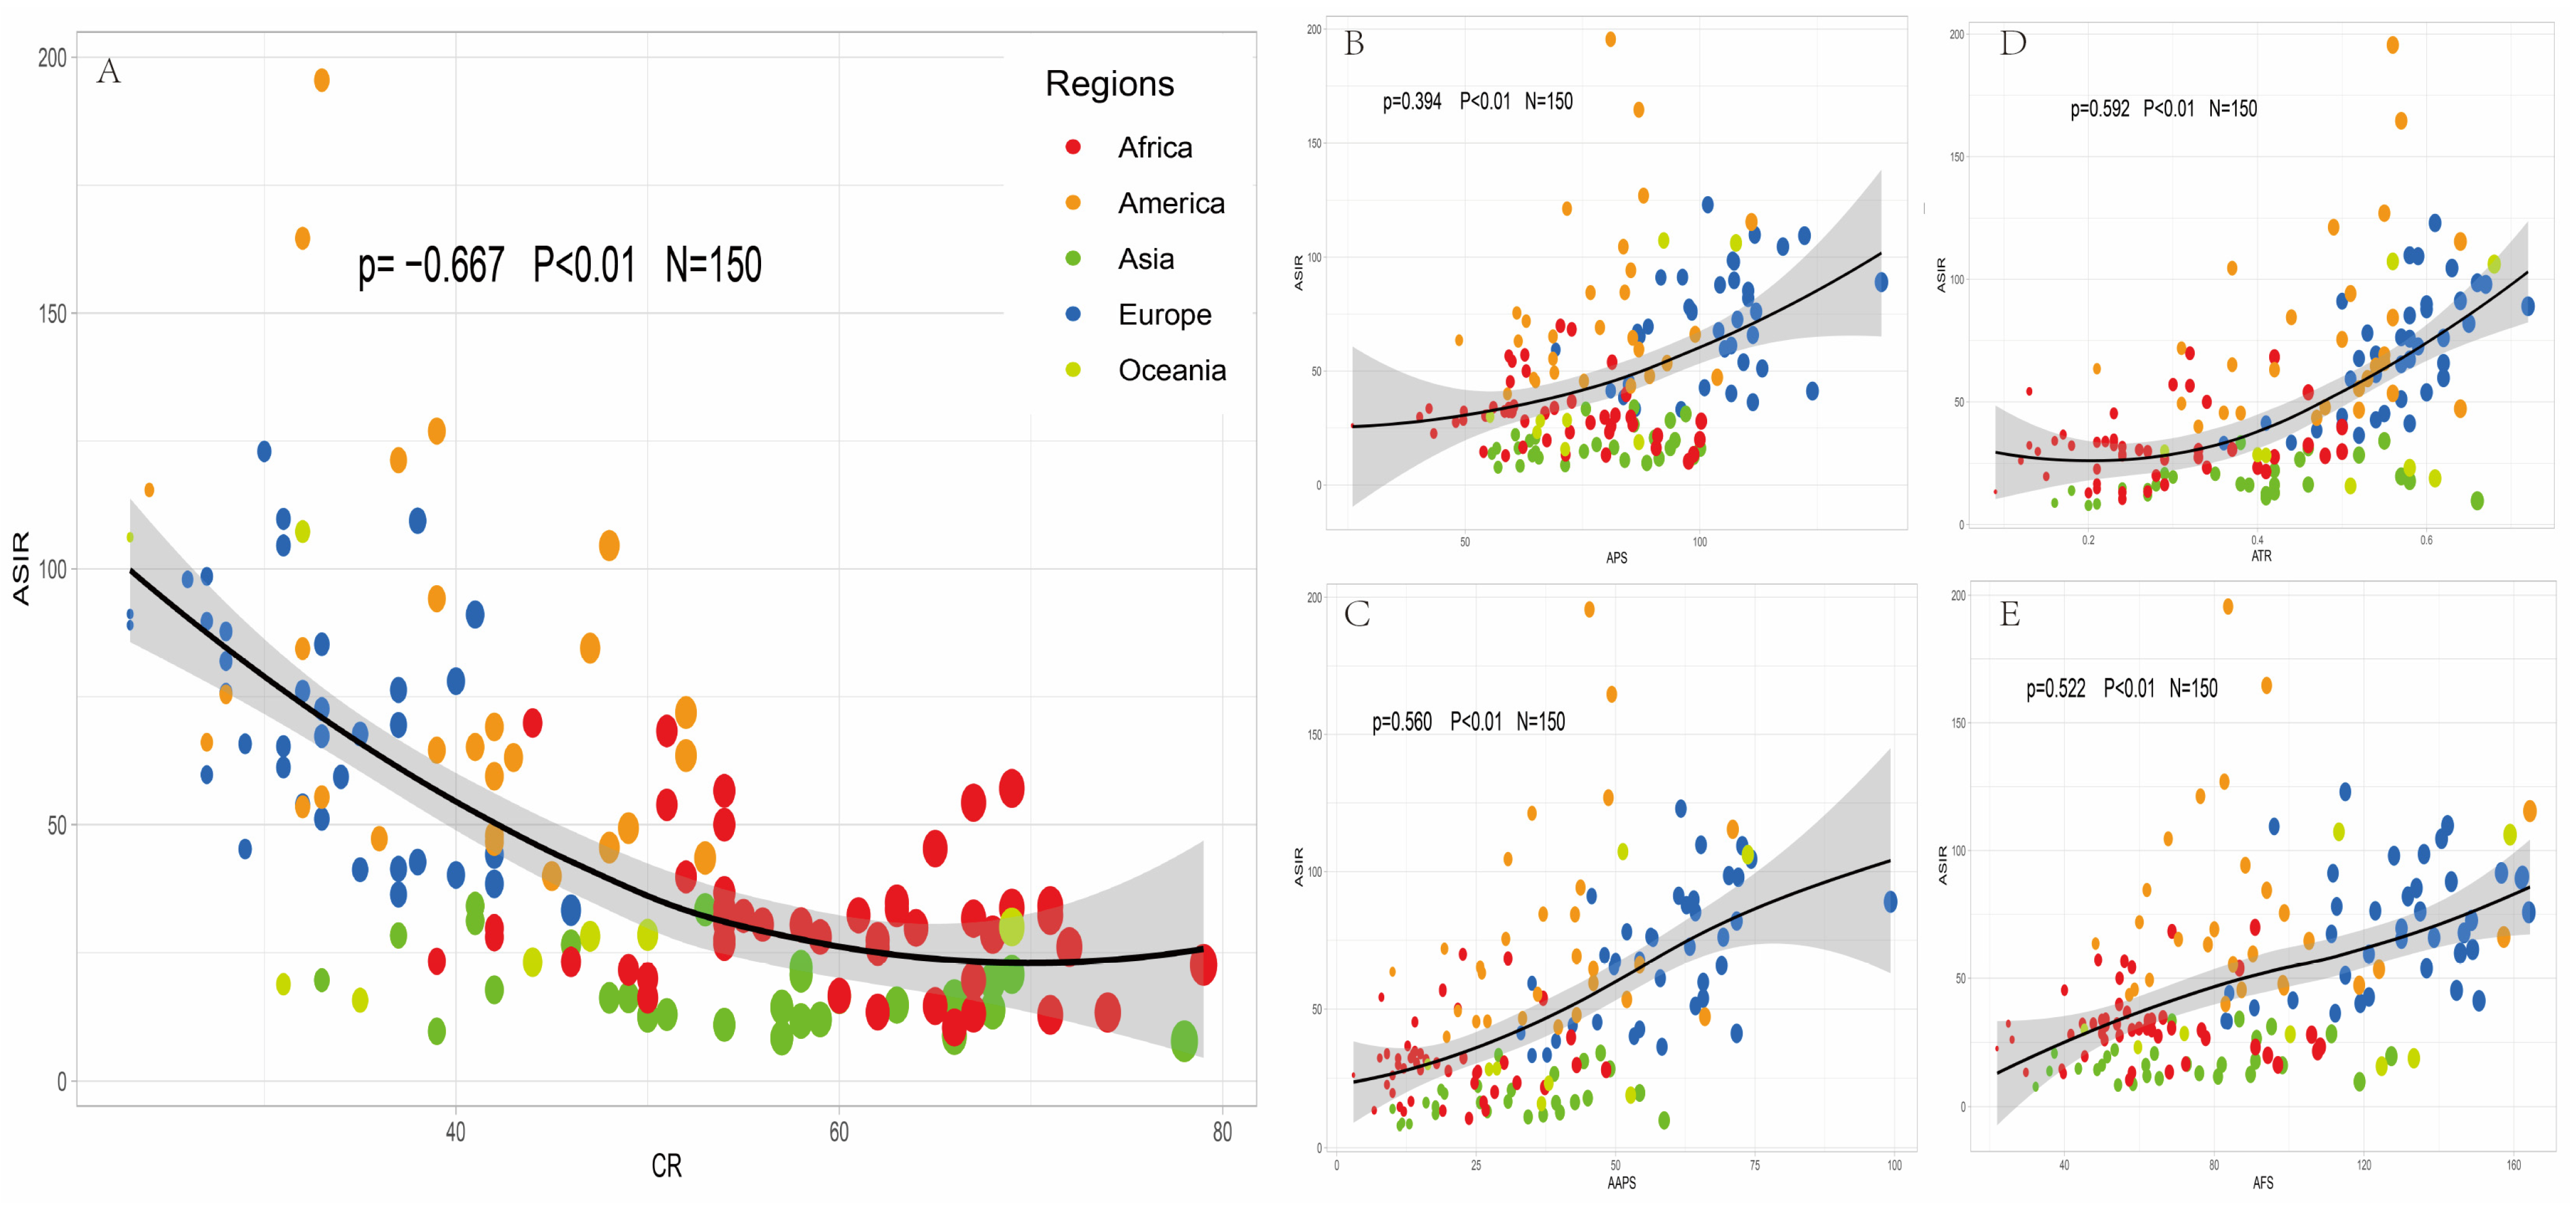
3.2. Correlation Analysis between Incidence of Prostate Cancer and Nutritional Supply Worldwide
3.3. Regression Analysis of Nutritional Supply and Prostate Cancer Incidence
3.4. Subgroup Analysis of Nutritional Supply and Prostate Cancer Incidence Based on SDI Level
4. Discussion
5. Conclusions
Author Contributions
Funding
Institutional Review Board Statement
Informed Consent Statement
Data Availability Statement
Conflicts of Interest
References
- Sung, H.; Ferlay, J.; Siegel, R.L.; Laversanne, M.; Soerjomataram, I.; Jemal, A.; Bray, F. Global Cancer Statistics 2020: GLOBOCAN Estimates of Incidence and Mortality Worldwide for 36 Cancers in 185 Countries. CA Cancer J. Clin. 2021, 71, 209–249. [Google Scholar] [CrossRef] [PubMed]
- Le, G.M.; Gomez, S.L.; Clarke, C.A.; Glaser, S.L.; West, D.W. Cancer incidence patterns among Vietnamese in the United States and Ha Noi, Vietnam. Int. J. Cancer 2002, 102, 412–417. [Google Scholar] [CrossRef] [PubMed]
- Lee, J.; Demissie, K.; Lu, S.-E.; Rhoads, G.G. Cancer incidence among Korean-American immigrants in the United States and native Koreans in South Korea. Cancer Control 2007, 14, 78–85. [Google Scholar] [CrossRef] [PubMed]
- Alzahrani, M.A.; Ahmad, M.S.; Alkhamees, M.; Aljuhayman, A.; Binsaleh, S.; Tiwari, R.; Almannie, R. Dietary protein intake and prostate cancer risk in adults: A systematic review and dose-response meta-analysis of prospective cohort studies. Complement. Ther. Med. 2022, 70, 102851. [Google Scholar] [CrossRef] [PubMed]
- Wu, J.; Wilson, K.M.; Stampfer, M.J.; Willett, W.C.; Giovannucci, E.L. A 24-year prospective study of dietary α-linolenic acid and lethal prostate cancer. Int. J. Cancer 2018, 142, 2207–2214. [Google Scholar] [CrossRef] [PubMed]
- Stoykova, G.E.; Schlaepfer, I.R. Lipid Metabolism and Endocrine Resistance in Prostate Cancer, and New Opportunities for Therapy. Int. J. Mol. Sci. 2019, 20, 2626. [Google Scholar] [CrossRef] [PubMed]
- Labbé, D.P.; Zadra, G.; Yang, M.; Reyes, J.M.; Lin, C.Y.; Cacciatore, S.; Ebot, E.M.; Creech, A.L.; Giunchi, F.; Fiorentino, M.; et al. High-fat diet fuels prostate cancer progression by rewiring the metabolome and amplifying the MYC program. Nat. Commun. 2019, 10, 4358. [Google Scholar] [CrossRef] [PubMed]
- Xu, C.; Han, F.-F.; Zeng, X.-T.; Liu, T.-Z.; Li, S.; Gao, Z.-Y. Fat Intake Is Not Linked to Prostate Cancer: A Systematic Review and Dose-Response Meta-Analysis. PLoS ONE 2015, 10, e0131747. [Google Scholar] [CrossRef]
- Schmidhuber, J.; Sur, P.; Fay, K.; Huntley, B.; Salama, J.; Lee, A.; Cornaby, L.; Horino, M.; Murray, C.; Afshin, A. The Global Nutrient Database: Availability of macronutrients and micronutrients in 195 countries from 1980 to 2013. Lancet Planet. Health 2018, 2, e353–e368. [Google Scholar] [CrossRef]
- Murray, C.J.L. The Global Burden of Disease Study at 30 years. Nat. Med. 2022, 28, 2019–2026. [Google Scholar] [CrossRef]
- GBD 2017 Disease and Injury Incidence and Prevalence Collaborators. Global, regional, and national incidence, prevalence, and years lived with disability for 354 diseases and injuries for 195 countries and territories, 1990–2017: A systematic analysis for the Global Burden of Disease Study 2017. Lancet 2018, 392, 1789–1858. [Google Scholar] [CrossRef]
- GBD 2019 Healthcare Access and Quality Collaborators. Assessing performance of the Healthcare Access and Quality Index, overall and by select age groups, for 204 countries and territories, 1990–2019: A systematic analysis from the Global Burden of Disease Study 2019. Lancet Glob. Health 2022, 10, e1715–e1743. [Google Scholar] [CrossRef] [PubMed]
- United Nations, Department of Economic and Social Affairs, Population Division. World Population Prospects 2022; Online Edition; United Nations, Department of Economic and Social Affairs, Population Division: New York, NY, USA, 2022. [Google Scholar]
- Pernar, C.H.; Ebot, E.M.; Wilson, K.M.; Mucci, L.A. The Epidemiology of Prostate Cancer. Cold Spring Harb. Perspect. Med. 2018, 8, a030361. [Google Scholar] [CrossRef] [PubMed]
- Ferlay, J.; Soerjomataram, I.; Dikshit, R.; Eser, S.; Mathers, C.; Rebelo, M.; Parkin, D.M.; Forman, D.; Bray, F. Cancer incidence and mortality worldwide: Sources, methods and major patterns in GLOBOCAN 2012. Int. J. Cancer 2015, 136, E359–E386. [Google Scholar] [CrossRef] [PubMed]
- Li, N.; Deng, Y.; Zhou, L.; Tian, T.; Yang, S.; Wu, Y.; Zheng, Y.; Zhai, Z.; Hao, Q.; Song, D.; et al. Global burden of breast cancer and attributable risk factors in 195 countries and territories, from 1990 to 2017: Results from the Global Burden of Disease Study 2017. J. Hematol. Oncol. 2019, 12, 140. [Google Scholar] [CrossRef]
- Renehan, A.G.; Zwahlen, M.; Minder, C.; O’Dwyer, S.T.; Shalet, S.M.; Egger, M. Insulin-like growth factor (IGF)-I, IGF binding protein-3, and cancer risk: Systematic review and meta-regression analysis. Lancet 2004, 363, 1346–1353. [Google Scholar] [CrossRef] [PubMed]
- Siech, C.; Rutz, J.; Maxeiner, S.; Grein, T.; Sonnenburg, M.; Tsaur, I.; Chun, F.K.-H.; Blaheta, R.A. Insulin-like Growth Factor-1 Influences Prostate Cancer Cell Growth and Invasion through an Integrin α3, α5, αV, and β1 Dependent Mechanism. Cancers 2022, 14, 363. [Google Scholar] [CrossRef]
- Loeb, S.; Fu, B.C.; Bauer, S.R.; Pernar, C.H.; Chan, J.M.; Van Blarigan, E.L.; Giovannucci, E.L.; Kenfield, S.A.; Mucci, L.A. Association of plant-based diet index with prostate cancer risk. Am. J. Clin. Nutr. 2021, 115, 662–670. [Google Scholar] [CrossRef]
- Parra-Soto, S.; Ahumada, D.; Petermann-Rocha, F.; Boonpoor, J.; Gallegos, J.L.; Anderson, J.; Sharp, L.; Malcomson, F.C.; Livingstone, K.M.; Mathers, J.C.; et al. Association of meat, vegetarian, pescatarian and fish-poultry diets with risk of 19 cancer sites and all cancer: Findings from the UK Biobank prospective cohort study and meta-analysis. BMC Med. 2022, 20, 79. [Google Scholar] [CrossRef]
- Liss, M.A.; Al-Bayati, O.; Gelfond, J.; Goros, M.; Ullevig, S.; DiGiovanni, J.; Hamilton-Reeves, J.; O’Keefe, D.; Bacich, D.; Weaver, B.; et al. Higher baseline dietary fat and fatty acid intake is associated with increased risk of incident prostate cancer in the SABOR study. Prostate Cancer Prostatic Dis. 2019, 22, 244–251. [Google Scholar] [CrossRef]
- Ngo, T.H.; Barnard, R.J.; Cohen, P.; Freedland, S.; Tran, C.; DeGregorio, F.; Elshimali, Y.I.; Heber, D.; Aronson, W.J. Effect of isocaloric low-fat diet on human LAPC-4 prostate cancer xenografts in severe combined immunodeficient mice and the in-sulin-like growth factor axis. Clin. Cancer Res. 2003, 9, 2734–2743. [Google Scholar] [PubMed]
- Hayashi, T.; Fujita, K.; Nojima, S.; Hayashi, Y.; Nakano, K.; Ishizuya, Y.; Wang, C.; Yamamoto, Y.; Kinouchi, T.; Matsuzaki, K.; et al. High-Fat Diet-Induced Inflammation Accelerates Prostate Cancer Growth via IL6 Signaling. Clin. Cancer Res. 2018, 24, 4309–4318. [Google Scholar] [CrossRef] [PubMed]
- Baron, A.; Mancini, M.; Caldwell, E.; Cabrelle, A.; Bernardi, P.; Pagano, F. Serenoa repensextract targets mitochondria and activates the intrinsic apoptotic pathway in human prostate cancer cells. BJU Int. 2009, 103, 1275–1283. [Google Scholar] [CrossRef] [PubMed]
- Epstein, M.M.; Kasperzyk, J.L.; Mucci, L.A.; Giovannucci, E.; Price, A.; Wolk, A.; Håkansson, N.; Fall, K.; Andersson, S.-O.; Andrén, O. Dietary fatty acid intake and prostate cancer survival in Örebro county, Sweden. Am. J. Epidemiol. 2012, 176, 240–252. [Google Scholar] [CrossRef] [PubMed]
- Terry, P.; Lichtenstein, P.; Feychting, M.; Ahlbom, A.; Wolk, A. Fatty fish consumption and risk of prostate cancer. Lancet 2001, 357, 1764–1766. [Google Scholar] [CrossRef] [PubMed]
- Platz, E.A. Energy imbalance and prostate cancer. J. Nutr. 2002, 132 (Suppl. 11), 3471S–3481S. [Google Scholar] [CrossRef]
- Hsieh, L.J.; Carter, H.; Landis, P.K.; Tucker, K.L.; Metter, E.; Newschaffer, C.J.; Platz, E.A. Association of energy intake with prostate cancer in a long-term aging study: Baltimore Longitudinal Study of Aging (United States). Urology 2003, 61, 297–301. [Google Scholar] [CrossRef]
- Großkopf, A.; Simm, A. Carbohydrates in nutrition: Friend or foe? Kohlenhydrate in der Ernährung: Freund oder Feind? Z. Gerontol. Geriatr. 2020, 53, 290–294. [Google Scholar] [CrossRef]


| Regions | Nation | APS (g/cap/day) | AAPS (g/cap/day) | ATR | AFS (g/cap/day) | CR (%) | SDI | ASIR (per 100,000) |
|---|---|---|---|---|---|---|---|---|
| Europe | ||||||||
| Central Europe | ||||||||
| Albania | 111.3 | 58.3 | 0.52 | 112.3 | 37 | 0.66 | 36.35 | |
| Bosnia and Herzegovina | 96.0 | 35.0 | 0.36 | 83.6 | 46 | 0.70 | 33.18 | |
| Bulgaria | 83.7 | 39.3 | 0.47 | 90.7 | 42 | 0.75 | 38.44 | |
| Croatia | 86.7 | 50.0 | 0.58 | 111.3 | 33 | 0.78 | 67.30 | |
| Czechia | 87.3 | 49.7 | 0.57 | 130.0 | 31 | 0.82 | 65.33 | |
| Hungary | 85.0 | 46.7 | 0.55 | 144.7 | 29 | 0.78 | 45.24 | |
| Montenegro | 109.3 | 65.7 | 0.60 | 136.7 | 32 | 0.78 | 53.89 | |
| North Macedonia | 81.0 | 33.0 | 0.41 | 101.0 | 37 | 0.73 | 41.36 | |
| Poland | 101.0 | 54.3 | 0.54 | 121.3 | 38 | 0.79 | 42.70 | |
| Romania | 106.7 | 53.3 | 0.50 | 119.0 | 40 | 0.74 | 40.18 | |
| Serbia | 84.7 | 42.3 | 0.50 | 84.0 | 42 | 0.75 | 44.16 | |
| Slovakia | 69.3 | 35.0 | 0.51 | 121.3 | 34 | 0.80 | 59.34 | |
| Slovenia | 97.7 | 52.0 | 0.53 | 112.7 | 40 | 0.83 | 78.06 | |
| Eastern Europe | ||||||||
| Belarus | 89.0 | 48.0 | 0.54 | 130.0 | 37 | 0.73 | 69.49 | |
| Estonia | 101.7 | 61.7 | 0.61 | 115.0 | 30 | 0.82 | 122.97 | |
| Latvia | 98.3 | 56.3 | 0.57 | 123.0 | 37 | 0.81 | 76.34 | |
| Lithuania | 122.3 | 72.7 | 0.59 | 96.0 | 38 | 0.82 | 109.41 | |
| Ukraine | 86.3 | 37.7 | 0.44 | 83.0 | 46 | 0.73 | 33.38 | |
| Western Europe | ||||||||
| Austria | 107.3 | 64.0 | 0.60 | 162.3 | 27 | 0.84 | 89.79 | |
| Belgium | 98.3 | 56.7 | 0.58 | 164.0 | 28 | 0.84 | 75.78 | |
| Cyprus | 91.7 | 45.7 | 0.50 | 111.7 | 41 | 0.83 | 91.07 | |
| Denmark | 110.3 | 71.7 | 0.65 | 131.7 | 28 | 0.88 | 81.98 | |
| Finland | 117.7 | 74.3 | 0.63 | 140.7 | 31 | 0.84 | 104.58 | |
| France | 108.0 | 63.3 | 0.59 | 148.7 | 33 | 0.82 | 72.61 | |
| Germany | 104.3 | 62.7 | 0.60 | 143.3 | 28 | 0.89 | 87.78 | |
| Greece | 106.7 | 58.0 | 0.54 | 149.0 | 31 | 0.79 | 61.20 | |
| Iceland | 138.7 | 99.3 | 0.72 | 162.0 | 23 | 0.85 | 89.00 | |
| Ireland | 110.3 | 64.3 | 0.58 | 134.0 | 33 | 0.85 | 85.26 | |
| Israel | 124.0 | 71.7 | 0.58 | 150.7 | 35 | 0.79 | 41.20 | |
| Italy | 104.0 | 54.3 | 0.52 | 146.7 | 35 | 0.79 | 67.71 | |
| Luxembourg | 111.3 | 69.0 | 0.62 | 138.7 | 29 | 0.89 | 65.81 | |
| Malta | 113.3 | 64.3 | 0.57 | 115.0 | 33 | 0.78 | 51.13 | |
| Netherlands | 107.3 | 72.0 | 0.67 | 128.0 | 26 | 0.87 | 97.94 | |
| Norway | 111.7 | 65.3 | 0.58 | 142.3 | 31 | 0.90 | 109.78 | |
| Portugal | 112.0 | 69.3 | 0.62 | 135.0 | 32 | 0.73 | 76.09 | |
| Spain | 105.3 | 65.7 | 0.62 | 145.7 | 27 | 0.76 | 59.77 | |
| Sweden | 107.0 | 70.3 | 0.66 | 136.0 | 27 | 0.86 | 98.56 | |
| Switzerland | 96.3 | 61.3 | 0.64 | 156.7 | 23 | 0.92 | 91.19 | |
| Asia | ||||||||
| Central Asia | ||||||||
| Armenia | 97.0 | 44.3 | 0.46 | 95.3 | 41 | 0.68 | 31.18 | |
| Azerbaijan | 90.3 | 31.3 | 0.35 | 64.0 | 58 | 0.67 | 20.67 | |
| Georgia | 75.7 | 29.0 | 0.38 | 68.7 | 53 | 0.83 | 33.38 | |
| Kazakhstan | 94.7 | 54.3 | 0.57 | 127.3 | 33 | 0.71 | 19.62 | |
| Kyrgyzstan | 84.0 | 34.3 | 0.41 | 65.3 | 54 | 0.58 | 10.94 | |
| Mongolia | 88.7 | 58.7 | 0.66 | 118.8 | 39 | 0.59 | 9.68 | |
| Tajikistan | 65.7 | 17.7 | 0.27 | 62.0 | 59 | 0.52 | 11.98 | |
| Turkmenistan | 91.3 | 37.0 | 0.41 | 81.0 | 58 | 0.65 | 11.70 | |
| Uzbekistan | 98.7 | 40.0 | 0.41 | 89.7 | 50 | 0.61 | 12.54 | |
| High-income Asia Pacific | ||||||||
| Japan | 86.0 | 47.3 | 0.55 | 86.7 | 41 | 0.86 | 34.11 | |
| Republic of Korea | 93.7 | 49.0 | 0.52 | 111.3 | 37 | 0.54 | 28.34 | |
| South Asia | ||||||||
| Bangladesh | 57.0 | 11.3 | 0.20 | 32.3 | 78 | 0.45 | 7.78 | |
| India | 61.7 | 13.0 | 0.21 | 54.3 | 57 | 0.53 | 8.40 | |
| Nepal | 71.3 | 11.7 | 0.16 | 58.3 | 66 | 0.39 | 8.78 | |
| Pakistan | 64.3 | 27.0 | 0.42 | 76.0 | 51 | 0.42 | 12.95 | |
| East Asia | ||||||||
| China | 100.1 | 39.3 | 0.39 | 98.2 | 50 | 0.66 | 16.09 | |
| Democratic People’s Republic of Korea | 55.7 | 10.0 | 0.18 | 36.0 | 68 | 0.86 | 13.83 | |
| Southeast Asia | ||||||||
| Cambodia | 65.0 | 18.7 | 0.29 | 37.3 | 69 | 0.44 | 20.75 | |
| Indonesia | 63.7 | 19.3 | 0.30 | 51.4 | 68 | 0.63 | 19.39 | |
| Lao People’s Democratic Republic | 75.3 | 17.7 | 0.24 | 43.7 | 63 | 0.46 | 14.78 | |
| Malaysia | 78.0 | 45.0 | 0.58 | 91.0 | 42 | 0.72 | 17.74 | |
| Mauritius | 86.0 | 39.0 | 0.45 | 91.3 | 46 | 0.69 | 26.53 | |
| Myanmar | 93.7 | 42.7 | 0.46 | 82.0 | 49 | 0.49 | 16.30 | |
| Philippines | 60.7 | 25.3 | 0.42 | 53.4 | 58 | 0.60 | 22.07 | |
| Sri Lanka | 65.0 | 17.7 | 0.27 | 48.7 | 57 | 0.67 | 14.37 | |
| Thailand | 61.3 | 25.7 | 0.42 | 61.7 | 48 | 0.67 | 16.18 | |
| Timor-Leste | 56.7 | 16.0 | 0.28 | 50.0 | 66 | 0.50 | 16.12 | |
| Vietnam | 81.7 | 30.7 | 0.38 | 72.7 | 60 | 0.59 | 16.52 | |
| Africa | ||||||||
| North Africa and Middle East | ||||||||
| Afghanistan | 58.6 | 12.0 | 0.20 | 39.7 | 71 | 0.31 | 12.89 | |
| Algeria | 90.7 | 26.3 | 0.29 | 97.0 | 50 | 0.63 | 16.24 | |
| Egypt | 97.6 | 23.7 | 0.24 | 57.3 | 66 | 0.63 | 10.41 | |
| Iran | 85.7 | 25.0 | 0.29 | 77.7 | 54 | 0.65 | 26.67 | |
| Iraq | 62.3 | 13.3 | 0.21 | 72.4 | 60 | 0.63 | 16.58 | |
| Jordan | 72.3 | 24.7 | 0.34 | 91.0 | 46 | 0.71 | 23.19 | |
| Kuwait | 100.3 | 48.3 | 0.48 | 106.0 | 42 | 0.83 | 28.02 | |
| Lebanon | 70.3 | 22.6 | 0.32 | 90.9 | 44 | 0.69 | 69.87 | |
| Morocco | 98.7 | 26.7 | 0.27 | 68.0 | 62 | 0.52 | 13.43 | |
| Oman | 85.3 | 43.0 | 0.50 | 76.6 | 42 | 0.76 | 29.73 | |
| Saudi Arabia | 91.0 | 37.3 | 0.41 | 107.6 | 49 | 0.78 | 21.61 | |
| Tunisia | 100.0 | 28.3 | 0.28 | 94.3 | 50 | 0.65 | 19.95 | |
| United Arab Emirates | 80.7 | 32.3 | 0.40 | 108.3 | 39 | 0.87 | 23.30 | |
| Yemen | 53.9 | 11.3 | 0.21 | 39.3 | 65 | 0.41 | 14.59 | |
| Eastern Sub-Saharan Africa | ||||||||
| Comoros | 54.7 | 14.3 | 0.26 | 62.0 | 56 | 0.43 | 30.46 | |
| Djibouti | 69.0 | 15.0 | 0.22 | 63.3 | 54 | 0.43 | 33.83 | |
| Ethiopia | 71.4 | 6.7 | 0.09 | 29.7 | 74 | 0.30 | 13.34 | |
| Kenya | 62.7 | 15.0 | 0.24 | 41.7 | 59 | 0.48 | 28.04 | |
| Madagascar | 43.3 | 9.0 | 0.21 | 22.0 | 79 | 0.37 | 22.61 | |
| Malawi | 67.4 | 10.0 | 0.15 | 45.4 | 67 | 0.36 | 19.60 | |
| Rwanda | 59.3 | 7.7 | 0.13 | 25.0 | 54 | 0.40 | 32.27 | |
| United Republic of Tanzania | 60.0 | 11.0 | 0.18 | 54.0 | 55 | 0.39 | 32.16 | |
| Zambia | 59.3 | 13.7 | 0.23 | 50.0 | 69 | 0.47 | 33.71 | |
| Southern Sub-Saharan Africa | ||||||||
| Botswana | 72.7 | 30.7 | 0.42 | 68.7 | 51 | 0.61 | 68.31 | |
| Eswatini | 59.3 | 19.0 | 0.32 | 56.0 | 54 | 0.56 | 56.62 | |
| Lesotho | 62.7 | 19.0 | 0.30 | 49.0 | 69 | 0.48 | 57.09 | |
| Namibia | 63.0 | 21.7 | 0.34 | 54.7 | 54 | 0.59 | 49.99 | |
| South Africa | 81.3 | 37.0 | 0.46 | 86.7 | 51 | 0.66 | 53.89 | |
| Western Sub-Saharan Africa | ||||||||
| Benin | 67.0 | 16.0 | 0.24 | 51.0 | 67 | 0.32 | 31.63 | |
| Burkina Faso | 79.7 | 11.0 | 0.14 | 63.3 | 64 | 0.24 | 29.77 | |
| Cameroon | 72.7 | 12.7 | 0.17 | 56.7 | 54 | 0.46 | 36.65 | |
| Chad | 76.7 | 25.3 | 0.33 | 65.0 | 62 | 0.22 | 27.40 | |
| Cote d’Ivoire | 58.4 | 13.3 | 0.23 | 47.7 | 71 | 0.38 | 32.30 | |
| Ghana | 59.6 | 14.0 | 0.23 | 40.0 | 65 | 0.52 | 45.33 | |
| Guinea-Bissau | 42.3 | 9.0 | 0.21 | 62.3 | 63 | 0.33 | 33.54 | |
| Liberia | 40.3 | 11.0 | 0.27 | 58.0 | 64 | 0.34 | 29.85 | |
| Mali | 80.0 | 19.0 | 0.24 | 58.0 | 67 | 0.24 | 13.15 | |
| Mauritania | 82.0 | 30.0 | 0.37 | 68.6 | 54 | 0.47 | 30.61 | |
| Niger | 81.1 | 10.0 | 0.12 | 50.7 | 62 | 0.14 | 25.97 | |
| Nigeria | 60.0 | 8.0 | 0.13 | 58.0 | 67 | 0.49 | 54.30 | |
| Senegal | 60.4 | 14.0 | 0.23 | 66.3 | 63 | 0.36 | 34.71 | |
| Sierra Leone | 49.6 | 12.0 | 0.24 | 50.0 | 68 | 0.32 | 28.51 | |
| Togo | 56.0 | 9.0 | 0.16 | 51.0 | 71 | 0.39 | 34.11 | |
| Central Sub-Saharan Africa | ||||||||
| Angola | 54.3 | 17.9 | 0.33 | 59.9 | 58 | 0.43 | 30.42 | |
| Central African Republic | 48.0 | 20.0 | 0.42 | 54.7 | 54 | 0.26 | 27.58 | |
| Congo | 49.7 | 22.7 | 0.46 | 44.8 | 61 | 0.34 | 32.29 | |
| Democratic Republic of the Congo | 26.0 | 3.0 | 0.12 | 26.0 | 72 | 0.54 | 26.08 | |
| Gabon | 84.3 | 42.0 | 0.50 | 54.6 | 52 | 0.62 | 39.78 | |
| America | ||||||||
| High-income North America | ||||||||
| Canada | 99.0 | 54.3 | 0.55 | 157.3 | 27 | 0.86 | 66.09 | |
| United States of America | 111.0 | 71.0 | 0.64 | 164.3 | 24 | 0.85 | 115.42 | |
| Southern Latin America | ||||||||
| Argentina | 103.7 | 66.0 | 0.64 | 118.7 | 36 | 0.69 | 47.25 | |
| Chile | 87.0 | 46.0 | 0.53 | 90.3 | 42 | 0.74 | 59.48 | |
| Uruguay | 85.7 | 46.0 | 0.54 | 105.3 | 39 | 0.68 | 64.56 | |
| Andean Latin America | ||||||||
| Ecuador | 64.6 | 33.3 | 0.52 | 98.6 | 42 | 0.62 | 46.65 | |
| Peru | 85.3 | 39.7 | 0.47 | 57.3 | 53 | 0.63 | 43.49 | |
| Caribbean | ||||||||
| Barbados | 87.0 | 49.3 | 0.57 | 94.0 | 32 | 0.73 | 164.64 | |
| Belize | 68.7 | 25.7 | 0.37 | 70.4 | 41 | 0.59 | 65.17 | |
| Cuba | 83.7 | 30.7 | 0.37 | 67.7 | 48 | 0.65 | 104.56 | |
| Dominica | 81.0 | 45.3 | 0.56 | 83.7 | 33 | 0.72 | 195.56 | |
| Dominican Republic | 61.0 | 30.3 | 0.50 | 98.7 | 28 | 0.57 | 75.49 | |
| Guyana | 84.0 | 37.0 | 0.44 | 62.0 | 47 | 0.60 | 84.51 | |
| Haiti | 48.7 | 10.0 | 0.21 | 48.3 | 52 | 0.42 | 63.52 | |
| Jamaica | 71.7 | 35.0 | 0.49 | 76.3 | 37 | 0.67 | 121.25 | |
| Saint Vincent and the Grenadines | 88.0 | 48.7 | 0.55 | 82.7 | 39 | 0.61 | 126.95 | |
| Suriname | 61.3 | 26.0 | 0.42 | 78.3 | 43 | 0.62 | 63.14 | |
| Trinidad and Tobago | 85.3 | 43.7 | 0.51 | 88.3 | 39 | 0.75 | 94.19 | |
| Central Latin America | ||||||||
| Colombia | 68.7 | 36.0 | 0.52 | 85.0 | 33 | 0.61 | 55.39 | |
| Costa Rica | 76.7 | 42.7 | 0.56 | 94.0 | 32 | 0.66 | 84.40 | |
| El Salvador | 75.3 | 27.0 | 0.36 | 58.7 | 48 | 0.55 | 45.57 | |
| Guatemala | 69.0 | 21.7 | 0.31 | 62.7 | 49 | 0.50 | 49.33 | |
| Honduras | 59.0 | 19.7 | 0.33 | 83.0 | 45 | 0.48 | 39.95 | |
| Mexico | 89.3 | 43.0 | 0.48 | 98.3 | 42 | 0.63 | 47.82 | |
| Nicaragua | 63.0 | 19.3 | 0.31 | 60.0 | 52 | 0.50 | 71.91 | |
| Panama | 78.7 | 43.0 | 0.55 | 80.0 | 42 | 0.66 | 69.11 | |
| Tropical Latin America | ||||||||
| Brazil | 93.0 | 52.0 | 0.56 | 124.0 | 32 | 0.62 | 53.49 | |
| Paraguay | 65.0 | 25.0 | 0.38 | 87.3 | 48 | 0.62 | 45.46 | |
| Oceania | ||||||||
| Oceania | ||||||||
| Fiji | 71.7 | 28.7 | 0.40 | 72.0 | 50 | 0.64 | 28.44 | |
| Kiribati | 71.3 | 36.7 | 0.51 | 124.7 | 35 | 0.51 | 15.73 | |
| Papua New Guinea | 65.3 | 38.0 | 0.58 | 59.6 | 44 | 0.38 | 23.12 | |
| Samoa | 87.0 | 52.7 | 0.61 | 133.3 | 31 | 0.63 | 18.82 | |
| Solomon Islands | 55.3 | 16.3 | 0.29 | 45.3 | 69 | 0.39 | 29.99 | |
| Vanuatu | 66.0 | 27.3 | 0.41 | 100.3 | 47 | 0.47 | 28.18 | |
| Australasia | ||||||||
| Australia | 107.7 | 73.7 | 0.68 | 159.0 | 23 | 0.83 | 106.18 | |
| New Zealand | 92.3 | 51.3 | 0.56 | 113.3 | 32 | 0.83 | 107.29 |
| Incidence of Prostate Cancer | ||||
|---|---|---|---|---|
| Crude Model | Adjusted Model | |||
| β (±SD) | p Value | β (±SD) | p Value | |
| APS | 0.669 (±0.12) | <0.01 | −0.030 (±0.194) | 0.483 |
| AAPS | 0.939 (±0.11) | <0.01 | 0.605 (±0.215) | 0.006 |
| ATR | 120.86 (±14.34) | <0.01 | 70.76 (±24.68) | 0.005 |
| AFS | 0.447 (±0.07) | <0.01 | 0.237 (±0.11) | 0.405 |
| CR | −1.49 (±0.15) | <0.01 | −1.451 (±0.30) | <0.01 |
| Crude Model | Adjusted Model | |||
|---|---|---|---|---|
| β (±SD) | p Value | β (±SD) | p Value | |
| APS | ||||
| Low SDI | −0.0324 (±0.18) | 0.076 | −0.246 (±0.22) | 0.275 |
| Low-middle SDI | −0.328 (±0.273) | 0.239 | −0.416 (±0.369) | 0.27 |
| Middle SDI | −0.380 (±0.422) | 0.375 | −0.662 (±0.417) | 0.125 |
| High-middle SDI | 0.232 (±0.532) | 0.666 | 0.183 (±0.576) | 0.754 |
| High SDI | 1.184 (±0.338) | 0.002 | 0.891 (±0.414) | 0.043 |
| AAPS | ||||
| Low SDI | −0.180 (±0.309) | 0.564 | −0.584 (±0.293) | 0.058 |
| Low-middle SDI | −0.257 (±0.334) | 0.447 | −0.697 (±0.50) | 0.176 |
| Middle SDI | −0.904 (±0.524) | 0.095 | 0.583 (±0.558) | 0.306 |
| High-middle SDI | 0.307 (±0.568) | 0.593 | 0.596 (±0.578) | 0.313 |
| High SDI | 1.225 (±0.228) | <0.01 | 1.079 (±0.388) | 0.011 |
| ATR | ||||
| Low SDI | 2.498 (±19.303) | 0.898 | −31.475 (±20.199) | 0.133 |
| Low-middle SDI | −4.944 (±33.371) | 0.883 | −46.748 (±50.242) | 0.361 |
| Middle SDI | 153.726 (±48.558) | 0.004 | 125.29 (±49.966) | 0.019 |
| High-middle SDI | 125.965 (±84.489) | 0.147 | 123.216 (±88.264) | 0.175 |
| High SDI | 241.99 (±50.08) | <0.01 | 271.24 (±81.122) | 0.003 |
| AFS | ||||
| Low SDI | 0.150 (±0.160) | 0.355 | 0.057 (±0.156) | 0.717 |
| Low-middle SDI | −0.112 (±0.172) | 0.518 | −0.45 (±0.259) | 0.095 |
| Middle SDI | 0.069 (±0.286) | 0.811 | −0.247 (±0.335) | 0.468 |
| High-middle SDI | −0.134 (±0.305) | 0.665 | 0.157 (±0.371) | 0.676 |
| High SDI | 0.479 (±0.191) | 0.019 | 0.244 (±0.300) | 0.425 |
| CR | ||||
| Low SDI | −0.569 (±0.234) | 0.022 | −0.300 (±0.268) | 0.274 |
| Low-middle SDI | −0.434 (±0.365) | 0.244 | −0.417 (±0.6) | 0.493 |
| Middle SDI | −1.722(±0.521) | 0.003 | −1.699 (±0.638) | 0.013 |
| High-middle SDI | −2.796 (±1.124) | 0.019 | −3.267 (±1.156) | 0.009 |
| High SDI | −2.246 (±0.594) | 0.001 | −2.493 (±1.020) | 0.023 |
Disclaimer/Publisher’s Note: The statements, opinions and data contained in all publications are solely those of the individual author(s) and contributor(s) and not of MDPI and/or the editor(s). MDPI and/or the editor(s) disclaim responsibility for any injury to people or property resulting from any ideas, methods, instructions or products referred to in the content. |
© 2023 by the authors. Licensee MDPI, Basel, Switzerland. This article is an open access article distributed under the terms and conditions of the Creative Commons Attribution (CC BY) license (https://creativecommons.org/licenses/by/4.0/).
Share and Cite
Jiang, J.; Yang, J.; Chen, B.; Li, J.; Zhang, T.; Tan, D.; Tang, B.; Wei, Q. The Impact of Nutrient Supply on Prostate Cancer Risk Worldwide. Nutrients 2023, 15, 5131. https://doi.org/10.3390/nu15245131
Jiang J, Yang J, Chen B, Li J, Zhang T, Tan D, Tang B, Wei Q. The Impact of Nutrient Supply on Prostate Cancer Risk Worldwide. Nutrients. 2023; 15(24):5131. https://doi.org/10.3390/nu15245131
Chicago/Turabian StyleJiang, Jinjiang, Jie Yang, Bo Chen, Jinze Li, Ting Zhang, Daqing Tan, Bo Tang, and Qiang Wei. 2023. "The Impact of Nutrient Supply on Prostate Cancer Risk Worldwide" Nutrients 15, no. 24: 5131. https://doi.org/10.3390/nu15245131
APA StyleJiang, J., Yang, J., Chen, B., Li, J., Zhang, T., Tan, D., Tang, B., & Wei, Q. (2023). The Impact of Nutrient Supply on Prostate Cancer Risk Worldwide. Nutrients, 15(24), 5131. https://doi.org/10.3390/nu15245131