Article

Effect of Continuous Ingestion of Bifidobacteria and Inulin on Reducing Body Fat: A Randomized, Double-Blind, Placebo-Controlled, Parallel-Group Comparison Study

1
Dairy Business Division, Ezaki Glico Co., Ltd., 4-6-5 Utajima, Nishiyodogawa-Ku, Osaka 555-8502, Japan
2
R&D Laboratory, Ezaki Glico Co., Ltd., 4-6-5 Utajima, Nishiyodogawa-Ku, Osaka 555-8502, Japan
3
Shinagawa Season Terrace Health Care Clinic, Shinagawa Season Terrace (5F), 1-2-70 Konan, Minato-Ku, Tokyo 108-0075, Japan
*
Author to whom correspondence should be addressed.
Nutrients 2023, 15(24), 5025; https://doi.org/10.3390/nu15245025
Submission received: 2 November 2023 / Revised: 22 November 2023 / Accepted: 5 December 2023 / Published: 7 December 2023

Abstract

:
Bifidobacterium animalis subsp. lactis GCL2505 has been shown to have several positive health effects, including improved defecation frequency and reduced visceral fat. It is known that combined intake of GCL2505 and inulin increases the total number of bifidobacteria compared with ingestion of GCL2505 alone. This randomized, double-blind, placebo-controlled, parallel-group study was conducted to confirm that consumption of GCL2505 and inulin reduces abdominal fat (n = 120). Participants consumed a test beverage containing 1 × 10¹⁰ colony-forming units of GCL2505 per 100 g and 2.0 g of inulin per 100 g for 12 weeks. A change in the visceral fat area (VFA) was set as the primary endpoint. There were significant reductions in VFA and total fat area. The intervention significantly increased the total number of bifidobacteria and affected the levels of several lipid markers. Regression analysis of bifidobacteria and measured parameters showed that total bifidobacteria correlated with VFA and body mass index (BMI), while endogenous bifidobacteria and Bifidobacterium animalis subsp. lactis correlated only with BMI, suggesting that increases in both contributed to the decrease in VFA. These results suggest that combined intake of GCL2505 and inulin improves the intestinal environment and reduces abdominal fat in association with the SCFA-mediated pathway.

1. Introduction

The World Health Organization defines overweight and obesity as abnormal or excessive fat accumulation that has the potential to negatively impact health. Obesity is a risk factor for lifestyle diseases such as hypertension, dyslipidemia and diabetes, as well as noncommunicable diseases such as cardiovascular diseases (mainly heart disease and stroke), musculoskeletal diseases (especially osteoarthritis) and some cancers. The worldwide prevalence of obesity nearly tripled between 1975 and 2016, with more than 650 million adults becoming obese. Overweight and obesity are linked to more deaths worldwide compared with underweight [1]. Thus, the obesity epidemic is one of the greatest public health challenges of the twenty-first century. Abdominal visceral fat accumulation (abdominal obesity) is a form of obesity related to environmental factors such as diet and physical inactivity and is also an underlying component of metabolic syndrome, which is a risk factor for coronary heart disease, hypertension, type-2 diabetes and impaired glucose tolerance. Furthermore, accumulation of abdominal visceral fat is considered to have greater negative health implications compared with obesity in general [2]. Caloric restriction and exercise are commonly used to treat obesity. For severe obesity, bariatric surgery and pharmacotherapy may also be used, but these have issues such as invasiveness and continuity. Therefore, there is a need for treatments such as functional foods, which do not require major lifestyle changes and are easier to apply to daily life [3].
The fundamental cause of overweight and obesity is an energy imbalance between calories ingested and calories expended [1]. In addition, it has been reported that the gut microbiota and obesity are closely related, with the composition and diversity of gut microbiota altered in overweight and diabetes [4]. Accordingly, probiotics and prebiotics may offer one approach to treating overweight and obesity by regulating the gut microbiota. Probiotics are defined as “live microorganisms that, when administered in adequate amounts, confer a health benefit on the host” [5]. Lactic acid bacteria (especially Lactobacillus spp.) and bifidobacteria have been reported as probiotics in the treatment of obesity. Consumption of Lactobacillus gasseri SBT2055 has been shown to reduce body weight, body fat percentage, body fat mass, visceral fat mass, subcutaneous fat mass, waist circumference, hip circumference, waist-to-hip ratio (WHR) and triglycerides (TG) [6,7], while consumption of strain BNR17 has been shown to reduce visceral fat mass [8]. Consumption of Lactiplantibacillus plantarum DAD-13 has been shown to reduce body weight and body mass index (BMI) [9], while strain K50 has been shown to reduce total cholesterol (TC) and TG [10], and strain LMT-1-40 has been shown to reduce body fat mass and abdominal VFA and to change insulin-related parameters [11]. In addition, it has been reported that consumption of Bifidobacterium breve B-3 decreases body fat mass, body fat percentage and abdominal VFA [12]. Consumption of Bifidobacterium animalis subsp. lactis CECT8145 decreases BMI, waist circumference and waist circumference/height [13], while consumption of strain GCL 2505 decreases visceral fat [14]. Furthermore, several meta-analyses have suggested an association of probiotics with glucose metabolism, lipid metabolism, body fat mass, body weight, visceral adipose tissue and hepatic adiposity [15,16,17]. Meanwhile, prebiotics are nonviable food components that confer a health benefit on the host and are associated with modulation of the gut microbiota [18]. Multiple meta-analyses [19,20,21] have shown that prebiotics reduce body weight, BMI, body fat, fasting glucose, insulin and fasting TG. However, the efficacy of a single probiotic depends on various factors, including diet and indigenous bacteria [22,23,24]. In addition, the effect of prebiotics is influenced by the gut microbiota of the individual and its sugar capitalization [24,25]. For these reasons, there may be limitations to using single probiotics or prebiotics to treat obesity in diverse populations. The combination of probiotics and prebiotics is called synbiotics [26], and it has been reported that intake of synbiotics increases gut bifidobacteria [27,28]; even in subjects with low probiotic strain growth, total bifidobacteria counts increased due to an increase in endogenous bifidobacteria [29]. Furthermore, several animal studies have reported that intake of synbiotics acts synergistically against obesity [30,31]. Clinical trials investigating the health benefits of synbiotics in a variety of areas found the following benefits. For intestinal health, there was a reduction in abdominal pain frequency [32] as well as an overall improvement in symptoms of irritable bowel syndrome [33]. For obesity and metabolic diseases, reductions in body weight, BMI [34] and body fat percentage [35] as well as improvements in inflammatory markers [36] have been reported. Improvements in the stress response [37] as well as reductions in tension and drowsiness [38] have also been reported. Therefore, it may be beneficial to consider a synbiotic or multi-strain probiotic approach with a view toward providing benefits to a broader population.
Bifidobacterium animalis subsp. lactis, a probiotic strain, is commonly used in fermented dairy products and has shown numerous health benefits related to gastrointestinal and immune health [39,40]. Bifidobacterium animalis subsp. lactis GCL2505 is a probiotic strain isolated from the feces of healthy adults that can grow in the gut [41,42] and it is used in fermented milk products in Japan. In clinical trials, daily consumption of fermented milk containing 8 × 10¹⁰ colony-forming units (CFU) of GCL2505, which contains higher numbers of bifidobacteria compared with regular fermented milk, reduced abdominal VFA [14]. Also, combined intake of GCL2505 and inulin was shown to be more effective in increasing the total number of bifidobacteria compared with ingestion of GCL2505 alone [29]. Based on these findings, this study evaluated the effects of the synbiotic intake of GCL2505 and inulin on abdominal fat accumulation in overweight Japanese adults in a placebo-controlled, randomized, double-blind, parallel-group study.

2. Materials and Methods

2.1. Participants

Participants were Japanese men and women between the ages of 20 and 65 years at the time of consent, who satisfied the inclusion criteria, did not satisfy any of the exclusion criteria and were deemed eligible to participate by the principal investigator. The inclusion criteria were as follows: (1) BMI of 23 or higher and less than 30 at the screening test; (2) able to abstain from alcohol for 2 days before each measurement; and (3) fully informed of the purpose and content of the study, deemed to have the capacity to consent, volunteered of their own accord to participate in the study based on a thorough understanding of the purpose and content of the study and provided written informed consent to participate in the study. Exclusion criteria were as follows: (1) regularly taking medications that affect obesity, hyperlipidemia or lipid metabolism; (2) treatment for severe kidney disease, heart disease, respiratory disease, endocrine disease, diabetes or other illness (excluding transient illnesses such as colds); (3) unable to stop intake of health foods or supplements that affect obesity, hyperlipidemia or lipid metabolism; (4) unable to restrict the intake of foods that might affect the intestinal microbiota; (5) use of antibiotics within 1 month prior to the start of the study; (6) regularly use intestinal drugs and laxatives (including strong laxatives); (7) history of digestive surgery (excluding appendectomy); (8) history of allergy to any of the study food ingredients; (9) current or former drug or alcohol dependence; (10) presence of metal (e.g., surgical implants) that precludes computed tomography (CT) scans of the measurement site; (11) implanted medical devices such as cardiac pacemakers and cardioverter-defibrillators; (12) claustrophobia; (13) pregnant or lactating, or expecting to become pregnant during the study; (14) participation in research involving the ingestion of other foods or the use of pharmaceuticals, the application of cosmetics or pharmaceuticals or participation in other research while participating in this study; and (15) deemed ineligible by the principal investigator.

2.2. Test Foods

The test products were a dairy drink (active drink) containing inulin (Orafti GR; BENEO GmbH, Mannheim, Germany) and GCL2505 or placebo. The active drink contained 1 × 10¹⁰ CFU of GCL2505 and 2.0 g of inulin per 100 g. The placebo was prepared using the same ingredients as the active drink, with the addition of food-grade acetic acid and lactic acid to adjust the flavor and pH; the basic ingredients were skim milk powder, fructose, dextrose, sucrose, yeast extract, acidifier, stabilizer and flavoring. The nutritional details of the test products are shown in Table 1.

2.3. Experimental Design

This was a randomized, placebo-controlled, double-blind, parallel-group study. Participants were randomized by computer-generated randomization into two groups (1:1), with age at screening, sex, body weight, body fat rate and VFA serving as stratification factors for randomization in block sizes of four. The controller (allocation manager) assigned the two groups to the test drink intake group and the control food intake group. For the sample size, the final target number of subjects was set at 60, referring to previous reports on visceral fat reduction with probiotics [14,43,44]. Participants in the active and placebo groups consumed 100 g of dairy beverage once daily for 12 weeks. Both the participants and observers were blinded to the group allocation for the duration of the study. Double blinding was accomplished by labeling the test drink with only an identification number. The change in VFA between weeks 0 and 12 was set as the primary endpoint. The secondary endpoints were VFA between weeks 0 and 8, subcutaneous fat area (SFA) between weeks 0, 8 and 12, total fat area (TFA) between weeks 0, 8 and 12, body weight, BMI, body fat rate, waist circumference, hip circumference, WHR, TC, low-density lipoprotein cholesterol (LDL-C), HDL-C, triglyceride, free fatty acid and fecal bifidobacteria. The study was conducted at the Shinagawa Season Terrace Health Care Clinic (Tokyo, Japan) from October 2022 to April 2023 by K.S.O. Corporation (Tokyo, Japan), a contract research organization, and was registered with the University Hospital Medical Information Network Clinical Trials Registry (UMIN-CTR) “http://www.umin.ac.jp/ctr/index.htm (accessed on 26 October 2022)” as UMIN000049328. This article conforms to the Consolidated Standards of Reporting Trials (CONSORT) 2010 guidelines (Supplementary Materials, Table S1).

2.4. Abdominal Fat Area

Abdominal VFA and SFA were measured using CT. Four-slice CT images (120 kVp, 400 mAs tube current, 5.0 mm slice thickness and 420 mm field of view) were acquired at the level of the lumbar 4 vertebra. Abdominal VFA, SFA and TFA (i.e., visceral + subcutaneous) were measured using Fat Scan ver. 4 (East Japan Institute of Technology Co., Ltd., Hitachi, Japan). To avoid unnecessary radiation exposure, CT scans were conducted only once at each measurement point (0, 8 and 12 weeks). The measurement of VFA by CT is reported to be easily affected by the slice site as well as the respiration phase of the subject [45]. Therefore, to investigate the time course changes in VFA accurately, the scanner and principal investigator strictly assessed a series of CT images obtained from the same subjects at each measurement point, treating any inappropriate data as missing values.

2.5. Anthropometric Measures and Body Composition

Weight and height were measured to the nearest 0.1 kg and 0.1 cm, respectively, with the participant standing. BMI was calculated in the standard way: weight (kg) divided by the square of height (m). Waist and hip circumferences were measured to the nearest 0.1 cm in a standing position. Waist circumference was measured around the abdomen at the level of the umbilicus. Hip circumference was measured at the level of maximum extension of the buttocks posteriorly in a horizontal plane.

2.6. Clinical Parameters

Blood pressure, pulse rate and the concentrations of biochemical and hematological parameters in plasma were measured at weeks 0, 4, 8 and 12. The concentrations of urinary parameters were also measured at weeks 0 and 12. Blood samples were drawn from each participant after 10 h of no food or drink except water (fasting) prior to testing. Clinical parameters included hematological tests (white blood cell count, red blood cell count, hemoglobin, hematocrit, platelet count and leukogram), biochemical tests (total protein, albumin, total bilirubin, aspartate aminotransferase, alanine aminotransferase, lactate dehydrogenase, alkaline phosphatase, gamma-glutamyltransferase, urea nitrogen, creatinine, uric acid, sodium, chlorine, potassium, calcium, TC, LDL-C, HDL-C, TG, glucose and HbA1c [NGSP]) and urinalysis (protein, sugar, bilirubin, urinary ketone bodies, occult blood reaction, urobilinogen, pH and specific gravity). All of these tests were performed at LSI Medience Corporation (Tokyo, Japan).

2.7. Fecal Samples

Fecal samples were submitted at weeks 0, 8 and 12. Fecal samples were collected at home between 7 and 2 days before the specified visit. The submitted samples were promptly transported to the Kyoto Institute of Nutrition and Pathology (Kyoto, Japan) by refrigerated transport at temperatures below −15°C.

2.8. Fecal DNA Extraction

Bacterial DNA was extracted from fecal samples, using the ISOSPIN Fecal DNA Kit (Nippon Gene Co., Ltd., Tokyo, Japan), following the procedure of Tourlousse et al. [46]. Specifically, a 0.2 g fecal sample, 700 μL of FE1 buffer and 10 μL of RNase were added to a tube with attached beads. A bead-beating homogenizer (FastPrep-24; MP Biomedicals, Irvine, CA, USA) was used at a rate of 6 m/s for 1 min to crush the cells. The process was repeated three times, during which the sample was kept at room temperature for 5 min. Then, 90 µL of FE2 buffer was added and the samples were centrifuged at 12,000× g for 15 min. The supernatant (up to 500 µL) was collected and mixed with FB buffer and isopropanol, each at 0.4× the volume of the supernatant obtained. Finally, the sample was loaded onto a spin column and washed according to the manufacturer’s instructions. Purified DNA was eluted with 50 µL of Tris-EDTA buffer (pH 8.0).

2.9. Fecal Bifidobacteria

Bacterial DNA was extracted from 10-fold dilutions of the fecal samples, and the number of gut bifidobacteria was determined by quantitative real-time PCR using bifidobacteria species- and subspecies-specific primers according to a procedure described previously [47]. Total counts of bifidobacteria in the fecal samples are represented as the sum of 10 species (B. longum subsp. longum, B. adolescentis, B. catenulatum, B. pseudocatenulatum, B. breve, B. bifidum, B. longum subsp. infantis, B. dentium, B. angulatum and B. animalis subsp. lactis). Endogenous bifidobacteria were regarded as the sum of nine species, without B. animalis subsp. lactis. The detection limit of each species or subspecies was 2.0 × 10⁵ cells per gram of feces.

2.10. Statistical Analysis

All measurements are expressed as mean, standard deviation (SD) and standard error (SE). Statistical analyses were performed using IBM® SPSS® Statistics 27 (IBM Corp., Armonk, NY, USA) or R® 4.2.1 (R Foundation for Statistical Computing, Vienna, Austria). A p-value < 0.05 was used as the threshold for determining significance. As basic statistics, means, SDs and SEs are expressed to the nearest significant digit and percentages are expressed to one decimal place, with digits adjusted by rounding. Missing data were treated as missing values and no surrogate values were used. Statistical analysis of VFA, SFA, TFA and fecal bifidobacterium was performed with unpaired t-tests, using the Benjamini–Hochberg procedure in order to compare between the active and placebo groups at each examination time. In addition, statistical analyses were performed with paired t-tests, using the Benjamini–Hochberg procedure in order to compare the test results at the start of intake (week 0) with those at 8 and 12 weeks after intake. Fecal bifidobacteria counts were converted to ordinary logarithms before performing statistical analysis. For VFA, SFA and TFA, an intergroup comparison was performed using two-factor repeated-measures analysis of variance (ANOVA) with the actual values. For the other items, comparisons between the active and placebo groups at each examination time were statistically analyzed with an unpaired t-test (two-tailed). In addition, statistical analysis was performed with paired t-tests to compare the test results at the start of the intake with those at 4, 8 and 12 weeks after intake. Regression analysis to correlate bifidobacteria counts with body composition parameters and biomarkers of obesity were performed by applying ANOVA to a mixed linear model, with bifidobacteria count as the objective variable, sex, age, BMI, VFA, SFA, TG, TC, LDL-C, HDL-C, treatment group (active or placebo) and time point (0, 8 and 12 weeks) as explanatory variables and participant ID as a random variable. The lmer function of the R package lmerTest, version 3.1-3, was used for these analyses.

3. Results

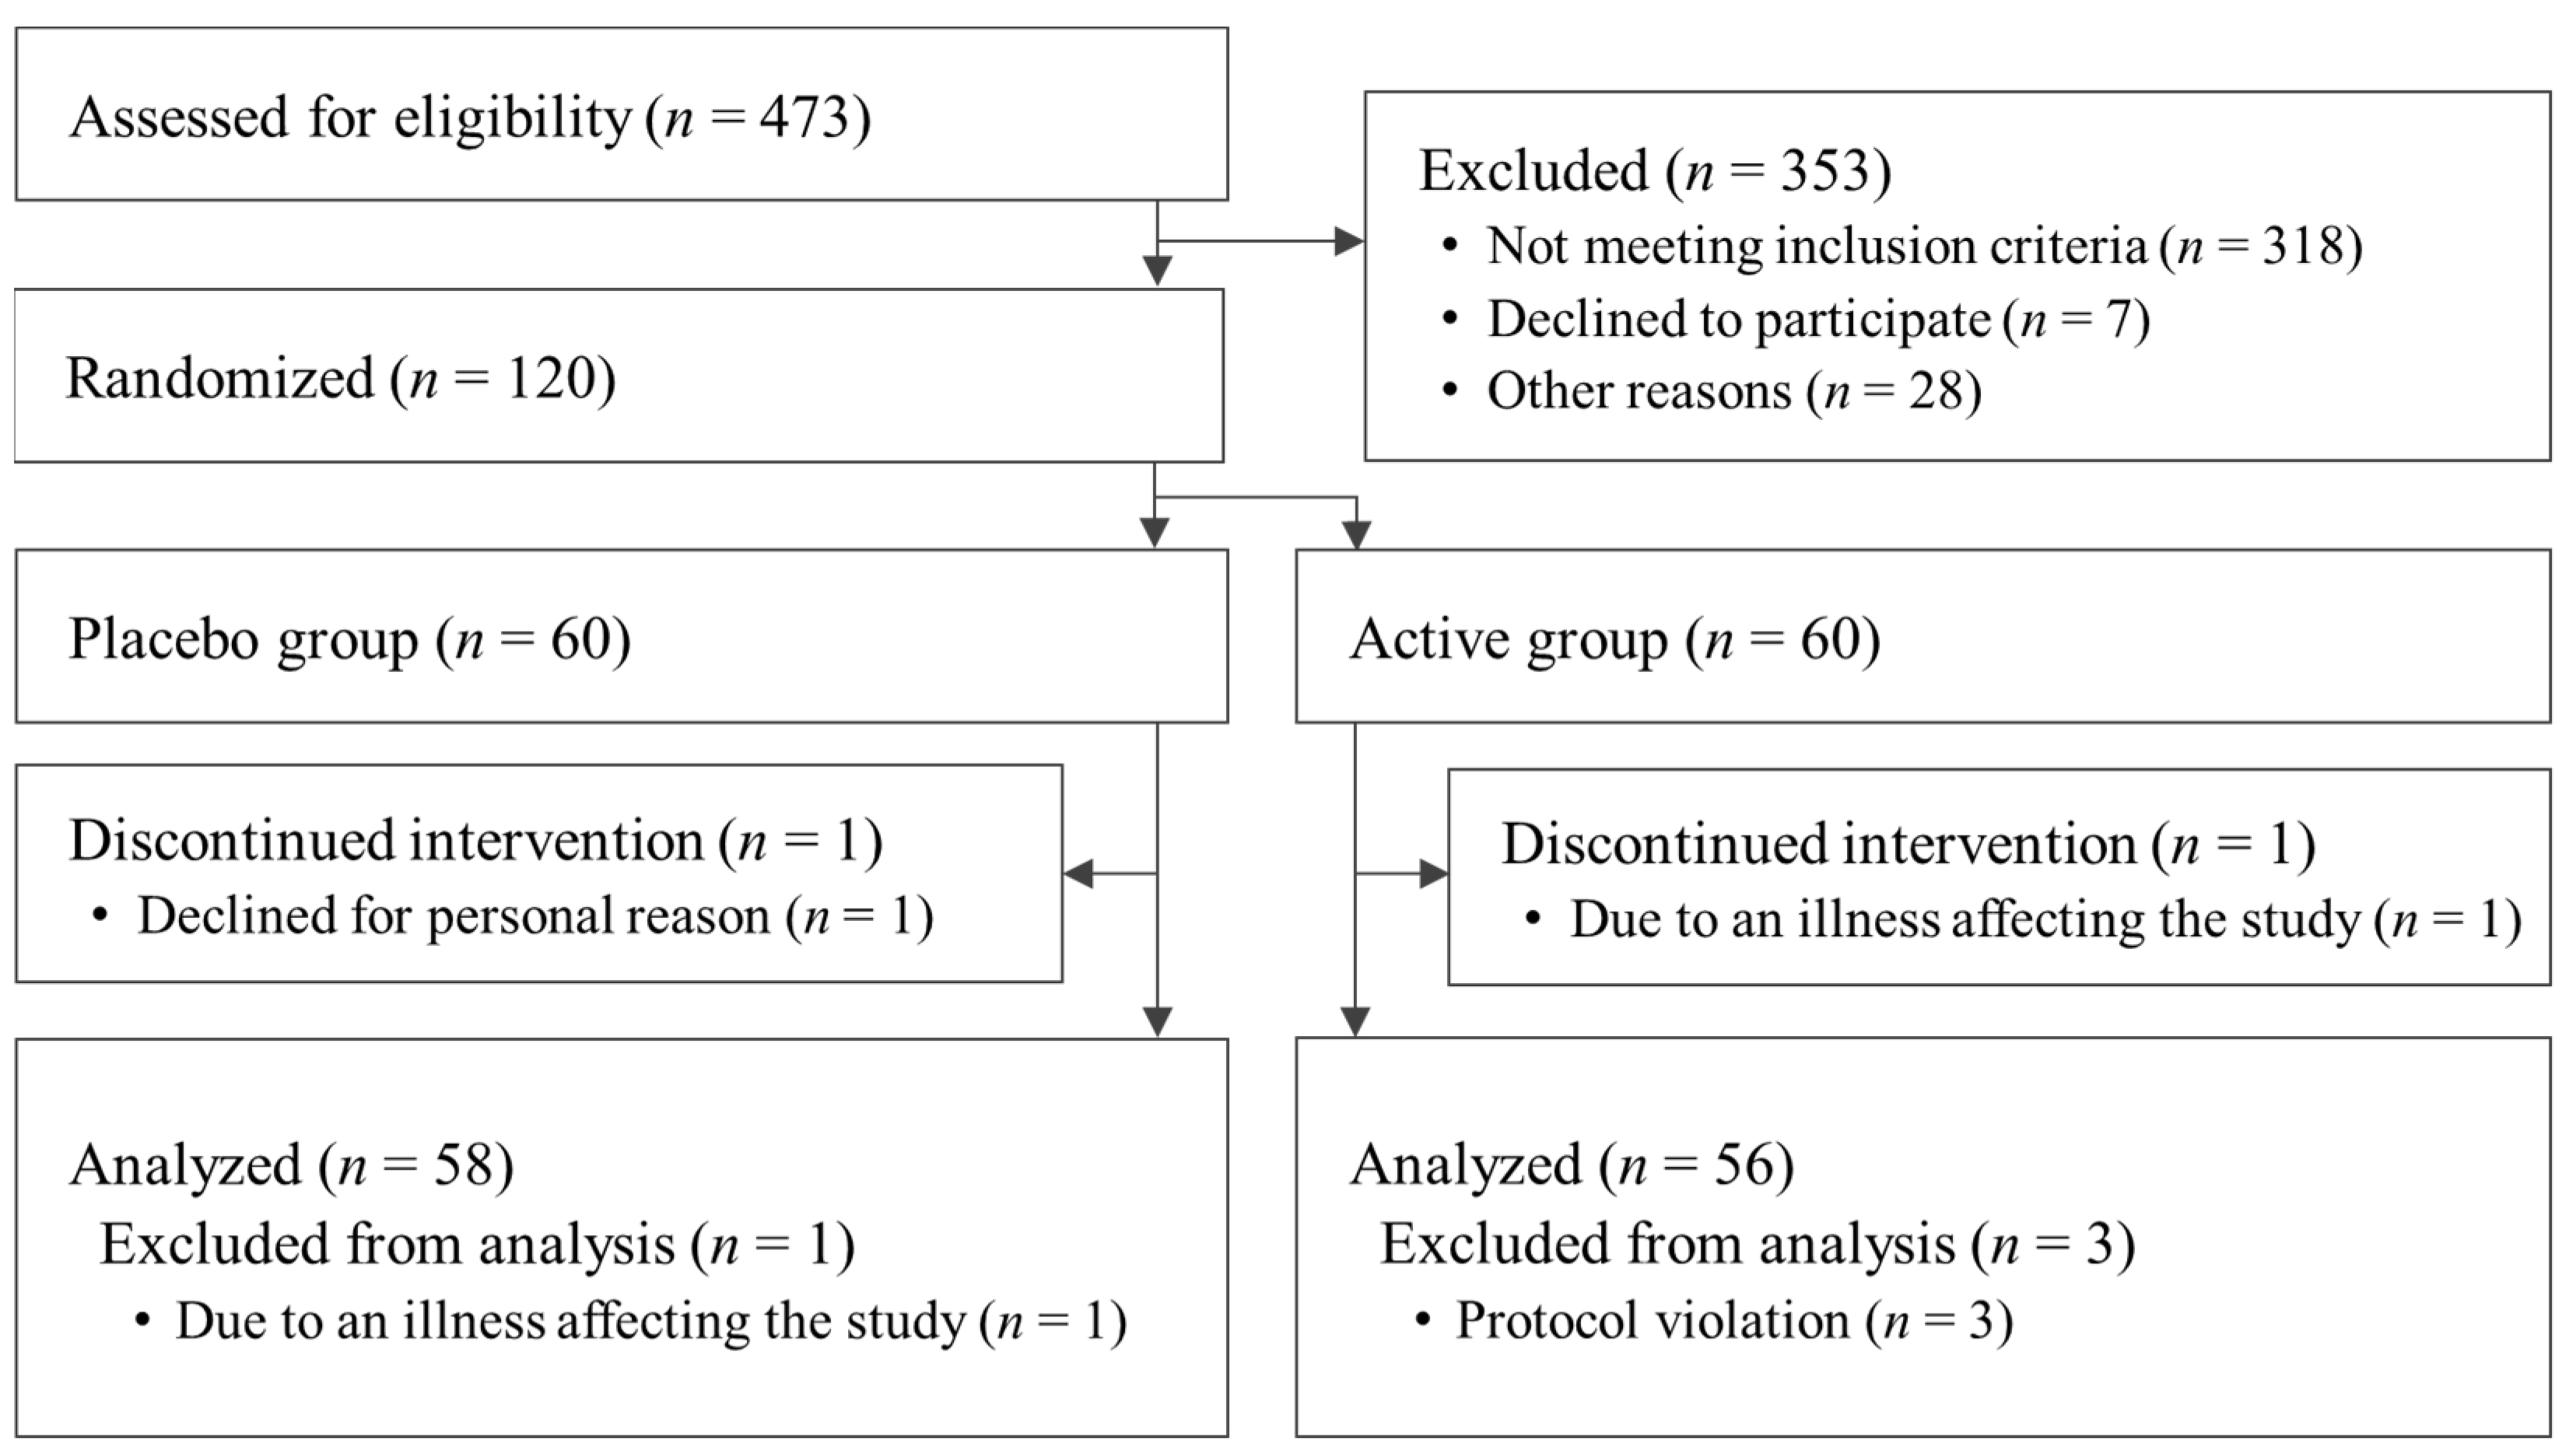
3.1. Analysis of the Participant Population

The flow chart of study participation is shown in Figure 1. A total of 473 participants were screened for this study. After screening, 120 participants were eligible: 60 were assigned to the active group and 60 were assigned to the placebo. A significant difference in basophil ratio between the active and placebo groups was observed at the beginning of the study but was deemed acceptable because it was within the reference range. For the other items, there were no differences in the baseline characteristics of the participants’ data (Table 2). Dietary consumption for the three days prior to the measurement is summarized in Table 3. It was concluded that the results of dietary consumption did not significantly affect the results of this study. The fat intake of the active group at week 12 was significantly less than that of the placebo group. The difference in mean fat intake between the active and placebo groups was 8.2 g/day or 73.8 kcal/day in terms of calories. Considering the energy intake recommended for the participants in this study [48], this change was only 2.8–3.8% of the daily energy intake. In addition, the difference between groups in the degree of change in VFA, discussed below, was confirmed from week 8; it was determined that this difference between groups, confirmed at week 12, did not have a significant impact on the study. Also, energy and protein intakes at week 12 were significantly reduced compared with week 0 in both the active and placebo groups. Changes in energy and protein intake from baseline in the active and placebo groups were determined not to have affected the study results because there were no significant differences between the groups. Carbohydrate and fiber intakes at week 12 in the placebo group were significantly reduced compared with baseline but this was determined not to have affected the study results because there were no significant differences between groups. By the end of the study, one participant from the active group withdrew due to an illness unrelated to the study that may have affected the results, and one participant from the placebo group withdrew for personal reasons. After the completion of the entire study, one participant from the placebo group was excluded due to a confirmed illness unrelated to the study that may have affected the results. In addition, three participants were excluded because they were found to have consumed drugs or foods during the study period that might have affected the results (n = 1 from the active group and n = 2 from the placebo group). Thus, a total of 114 patients (58 in the active group and 56 in the placebo group) were included in the analysis. There were no reported harms or unintended effects in either group.

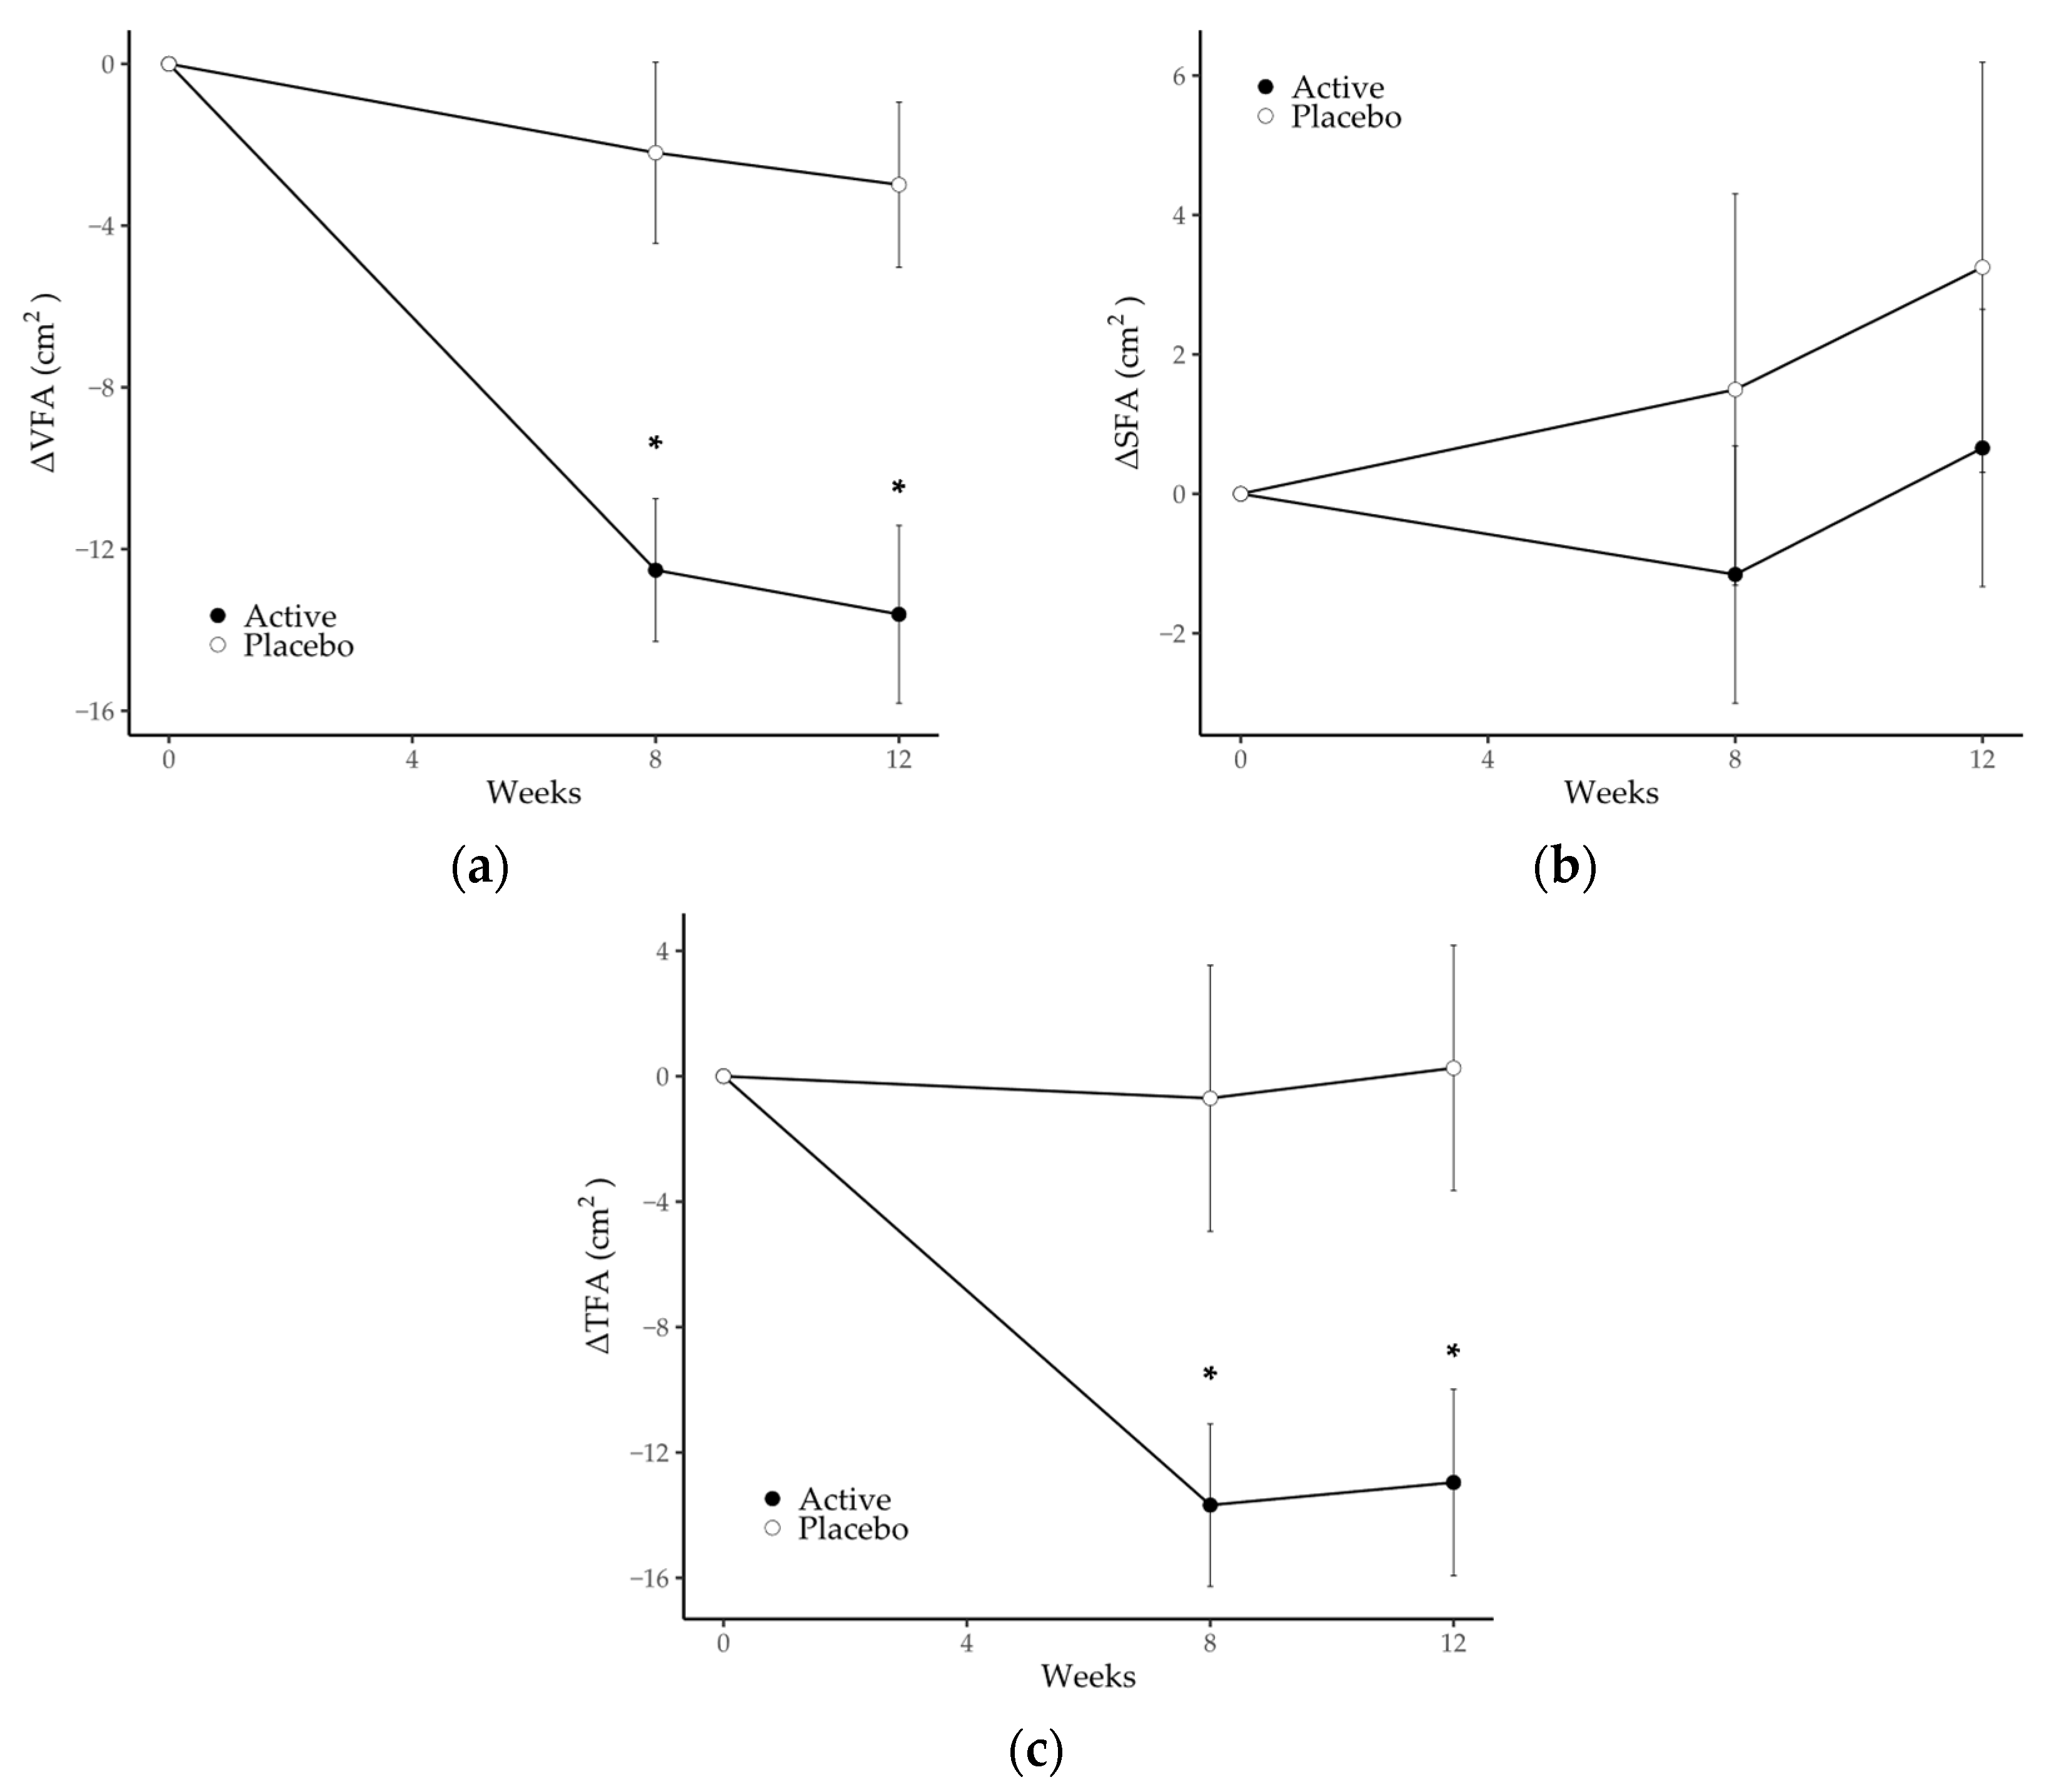
3.2. Abdominal Fat Area

From the viewpoint of the accuracy of the CT data described in Section 2.4, we assessed a series of CT images obtained from the same participants at each measurement point, treating any inappropriate data as missing values. Data from 16 participants (1 in the active group and 15 in the placebo group) were treated as missing values in part or in whole due to overestimation of VFA, caused mainly by compression of the abdominal cavity during inspiration, and 6 participants (all in the active group) were treated as missing values in part or in whole due to underestimation of VFA, caused mainly by the inclusion of an internal organ or gas in the CT scan images. Consequently, data from 102 participants at week 0 (55 in the active group and 47 in the placebo group), data from 100 participants at week 8 (54 in the active group and 46 in the placebo group) and data from 94 participants at week 12 (52 in the active group and 42 in the placebo group) were analyzed. The mean decreases in VFA from baseline to 8 and 12 weeks, respectively, were significantly greater in the active group (−12.5 ± 1.8 cm2 and −13.6 ± 2.2 cm2) compared with the placebo group (−3.0 ± 2.0 cm2 and −2.2 ± 2.2 cm2). In addition, the mean reduction in TFA from baseline to 8 and 12 weeks, respectively, was significantly greater in the active group (−13.7 ± 2.6 cm2 and −13.0 ± 3.0 cm2) compared with the placebo group (−0.7 ± 4.2 cm2 and 0.3 ± 3.9 cm2). There were no statistically significant differences in SFA between the two groups and no changes within either group (Figure 2). The actual values of VFA, SFA and TFA are summarized in Table 4; VFA and TFA in the active group at weeks 8 and 12 were significantly reduced compared with baseline. There was a significant group-by-time interaction in VFA and TFA from baseline.

3.3. Anthropometric Parameters

Body weight, BMI and WHR values are summarized in Table 5; there were no statistically significant differences in body weight, BMI or WHR between the two groups. Body weight and BMI in the active group at week 12 were significantly lower compared with baseline. The values for waist and hip circumference that were used to calculate WHR are presented in Table S2 of the Supplementary Materials.

3.4. Biochemical Parameters in Plasma

The values of TC, LDL-C, HDL-C, TG and free fatty acids in plasma are summarized in Table 6. TG in the active group at weeks 4 and 8 was significantly lower compared with the placebo group. TC, LDL-C and HDL-C in the active group at week 8 were significantly lower compared with baseline. Free fatty acids in the active and placebo groups at week 12 were significantly increased compared with baseline.

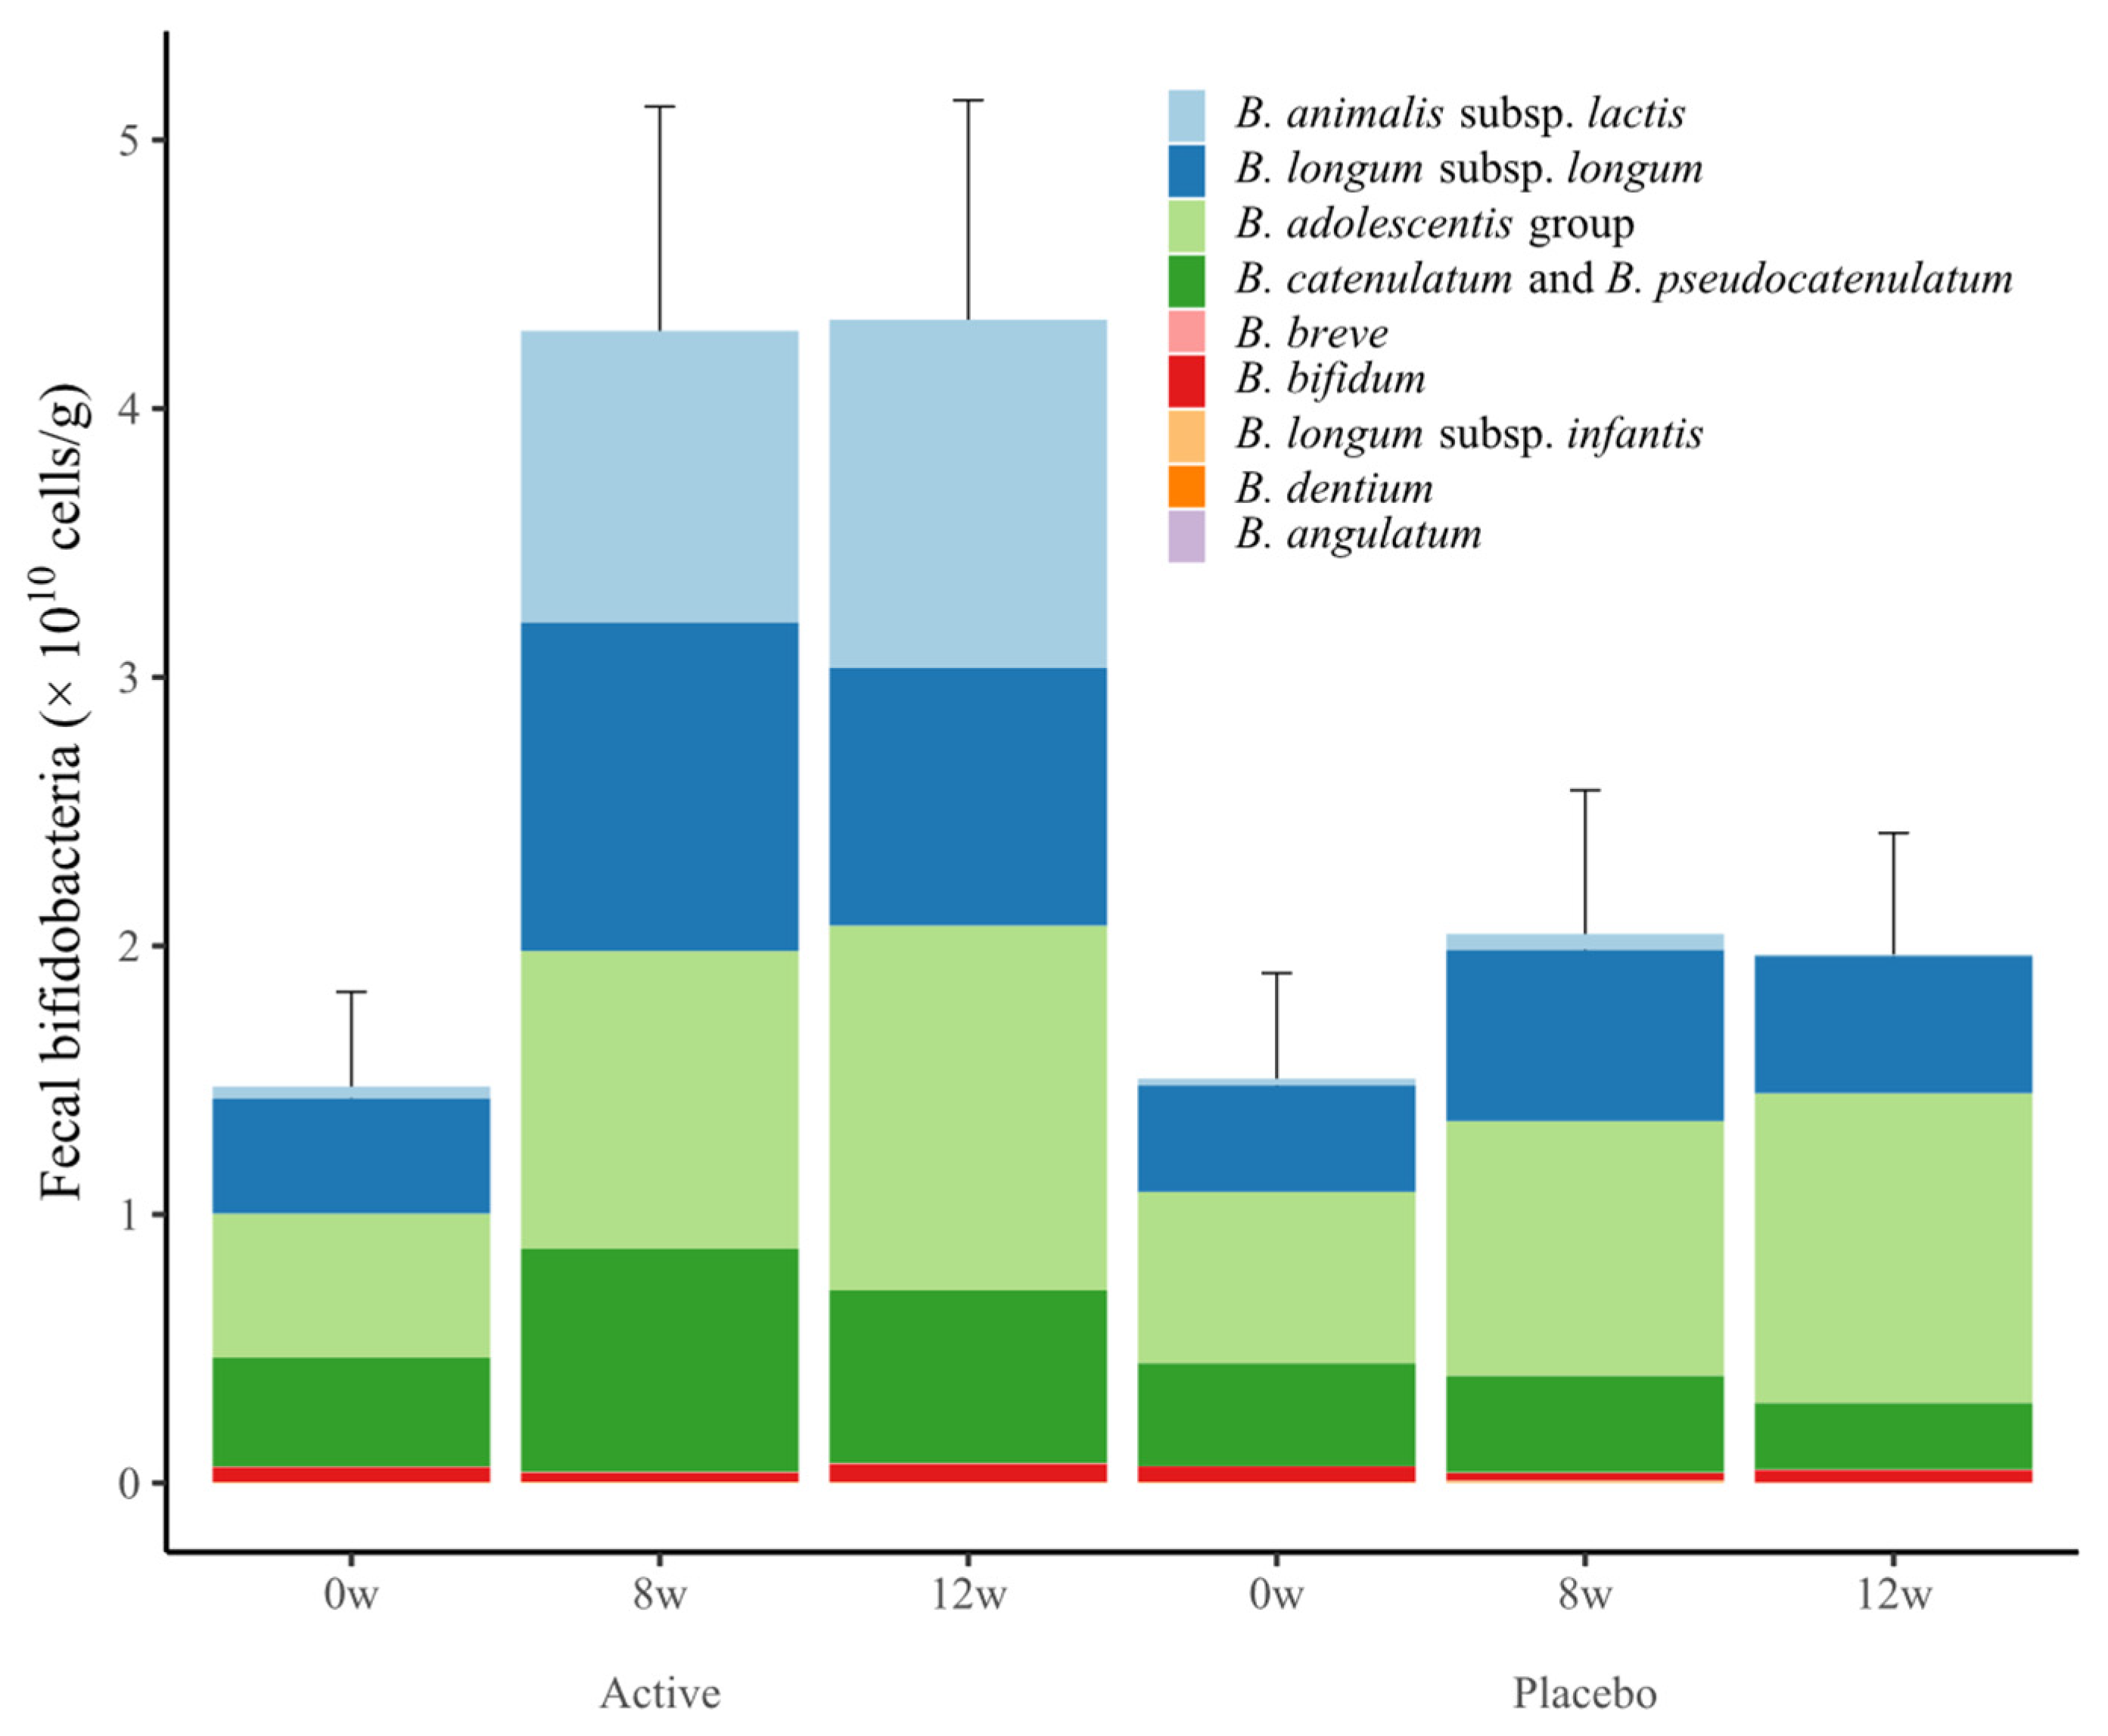
3.5. Fecal Bifidobacteria

Changes in the number of fecal bifidobacteria are shown in Figure 3 and Table 7. Total bifidobacteria, B. animalis subsp. lactis, B. catenulatum and B. pseudovatenulatum counts in the active group at weeks 8 and 12 were significantly higher compared with the placebo group. In addition, total bifidobacteria, B. animalis subsp. lactis, B. longum subsp. longum, B. adolescentis group, B. catenulatum and B. pseudovatenulatum in the active group at 8 and 12 weeks were significantly increased compared with baseline.

3.6. Regression Analysis with Fecal Bifidobacteria and Measured Parameters

Table 8 shows the results of the regression analysis performed to examine the association of total bifidobacteria, endogenous bifidobacteria and B. animalis subsp. lactis bacteria counts with the participants’ characteristics, body compositions and plasma parameters. Regression analysis showed that an increase in the number of total bifidobacteria was significantly associated with a decrease in BMI and VFA, while an increase in the number of B. animalis subsp. lactis and endogenous bifidobacteria was significantly associated with a decrease in BMI.

4. Discussion

We investigated the effects of consuming a dairy drink containing a synbiotic comprising Bifidobacterium animalis subsp. lactis GCL2505 and inulin on abdominal fat in overweight adults. The results showed that the consumption of the test beverage resulted in a reduction in abdominal visceral fat and total abdominal fat. In abdominal adipose tissue, visceral and subcutaneous adipose tissue have very different effects on metabolic disorders [49], and several studies have reported that excess VFA, rather than SFA, body weight or BMI, is correlated with metabolic disorders [45,50]. Therefore, abdominal VFA was set as the primary endpoint in this study.
After 12 weeks of consuming a dairy beverage containing GCL2505 and inulin, the reduction in VFA from week 0 to weeks 8 and 12 in the active group was significantly greater than that in the placebo group. Although there was no significant group difference in the reduction in SFA, the reduction in TFA was significantly greater compared with the placebo group, thus confirming the reduction in overall abdominal fat due to ingestion of the synbiotic. In addition, quantification of fecal bifidobacteria showed that total bifidobacteria, B. animalis subsp. lactis, B. catenulatum and B. pseudocatenulatum in the active group at weeks 8 and 12 were significantly greater compared with the placebo group. This confirmed an increase in endogenous bifidobacteria due to inulin, as well as an increase in B. animalis subsp. lactis due to ingestion of GCL2505. In the active group, the total number of endogenous bifidobacteria, B. longum subsp. longum and B. adolescentis was significantly increased at weeks 8 and 12 compared with baseline. These results are in line with a previous study showing that intake of GCL2505 and inulin increases endogenous bifidobacteria (especially B. longum subsp. longum and B. adolescentis) as well as total bifidobacteria counts more compared with GCL2505 alone [29].
At weeks 4 and 8, TG in the active group was significantly lower compared with the placebo group, suggesting an effect of GCL2505 and inulin intake on lipid parameters in plasma. In addition, body weight and BMI at week 12 as well as TC, LDL-C and HDL-C at week 8 in the active group were significantly lower compared with baseline. Changes in body weight and BMI were also reported in a meta-analysis by Koutnikova et al. [17], along with changes in VFA, which showed significant differences between groups. In addition, changes in body weight, BMI, TC and LDL-C were reported in a meta-analysis on synbiotics by Musazadeh et al. [51], along with changes in TG, which showed significant differences between groups. Although further studies are needed because of the absence of differences between groups, it is possible that the changes in these parameters were due to the intake of GCL2505 and inulin. However, the differences between groups in TG at week 12 as well as the differences in TC, LDL-C and HDL-C at week 12 compared with baseline were not significant. In addition, there was a significant increase in free fatty acids at week 12 compared to baseline in both groups. These results might be associated with an increase in the mean changes in TFA from baseline in both groups from weeks 8 to 12. It is hypothesized that intake of GCL2505 and inulin reduced visceral and body fat through a mechanism involving two steps. In the first step, intake of GCL2505 and inulin increases bifidobacteria and production of short-chain fatty acids (SCFAs) in the gut. In this study, total bifidobacteria counts increased significantly in the active group compared with the placebo group. In animal studies, the intake of GCL2505 alone contributed to an increase in the number of fecal bifidobacteria along with a corresponding increase in the concentration of acetic acid in feces and blood [52,53]. In clinical studies, intake of GCL2505 and inulin increased total bifidobacteria counts in feces [29], while intake of inulin alone increased SCFAs such as acetic acid [54] by increasing the number of bifidobacteria in the gut. Thus, in the present study, it was suggested that GCL2505 and inulin in the gut increased acetic acid, one of the SCFAs, by increasing the number of total bifidobacteria. In the second step, the increase in SCFAs in the gut improved glucose tolerance and systemic fatty acid oxidation through their receptor, G protein-coupled receptor 43 (GPR43), leading to a reduction in visceral and body fat. Previous studies in animals showed that increased production of acetic acid improves glucose tolerance, promotes systemic fatty acid oxidation and suppresses body fat accumulation via GPR43 [53]. In addition, intake of inulin led to a reduction in VFA [55]. In clinical studies, it was shown that daily consumption of a test beverage containing a higher amount of GCL2505 (8 × 10¹⁰ CFU) compared with standard fermented milk reduced abdominal VFA [14]. Taken together, the findings suggest that combined intake of GCL2505 and inulin may increase the concentration of SCFAs in the gut by increasing the total bifidobacteria count, thereby reducing visceral fat and body fat via GPR43.
The differences in TG between groups at week 8 may be due to the action of SCFAs. It was suggested that SCFAs promote lipid clearance in the liver by downregulating angiopoietin-like protein 4, which inhibits lipoprotein lipase [56]. In fact, the reduction in TG associated with Lactiplantibacillus plantarum consumption [10] is thought to be due to SCFA-mediated mechanisms of action. In the present study, VFA at baseline in the active group (124.0 ± 31.3 cm2) was lower than that reported in a previous study [14] in which GCL2505 alone was ingested eight times (133.4 ± 29.6 cm2) and the participants had low visceral fat from the start. Nevertheless, the change in VFA (−13.6 ± 2.2 cm2) was greater than that reported in previous trials (−5.1 ± 1.8 cm2). In addition, the degree of change was greater than that reported in a meta-analysis [17] (−6.30 cm2, 95% CI −9.05, −3.56). In addition, as noted above, combined intake of GCL2505 and inulin was shown in clinical studies to increase the total number of intestinal bifidobacteria more compared with consumption of GCL2505 alone [29]. It is possible that the combined intake of GCL2505 and inulin might have reduced VFA and TFA more effectively in the present study by increasing total bifidobacteria.
The relationship between parameters such as VFA and TG (which changed in this study) as well as the number of bifidobacteria were estimated by regression analysis and applying analysis of variance to a mixed effects model. The results suggest that an increase in total bifidobacteria count is significantly associated with a decrease in BMI and VFA, whereas an increase in B. animalis subsp. lactis and endogenous bifidobacteria is associated only with a decrease in BMI and not with a decrease in VFA. Because the increase in B. animalis subsp. lactis and endogenous bifidobacteria does not correlate with the decrease in VFA, it is possible that increases in both B. animalis subsp. lactis and endogenous bifidobacteria contributed to the reduction in VFA that appeared when inulin was ingested in addition to GCL2505. In addition, parameters related to lipids such as TG, TC, LDL-C and HDL-C showed no significant correlation with total bifidobacteria, endogenous bifidobacteria and B. animalis subsp. lactis. In some lactic acid bacteria, effects on blood lipids were also reported for pathways that were not mediated by SCFAs [57]. It is possible that the changes in the present parameters may have been caused by a pathway that is not mediated by SCFAs derived from bifidobacteria. This study quantified bifidobacteria but did not investigate other intestinal bacteria. Therefore, further research is needed to understand how intestinal microbiota other than bifidobacteria change and affect body composition and blood parameters.
Accumulation of visceral fat induces chronic inflammation. Recent studies have reported that intake of GCL2505 and inulin suppresses chronic inflammation, thereby improving cognitive and vascular function [58,59]. Further research is needed to determine the mechanism by which the intake of GCL2505 and inulin suppresses chronic inflammation by suppressing visceral fat accumulation.

5. Conclusions

In conclusion, the results suggest that the combined intake of GCL2505 and inulin suppresses the accumulation of visceral fat more compared with the intake of GCL2505 alone. Visceral adipose tissue has endocrine functions and it secretes a variety of bioactive substances, including adipocytokines, which affect the risk of developing metabolic abnormalities. In terms of preventing the development of metabolic abnormalities, reducing visceral fat is relatively more important than weight or body fat. It is thought that the combined intake of GCL2505 and inulin, which are functional food components that can be easily applied to daily life, may help to prevent the development of metabolic abnormalities in overweight adults.

Supplementary Materials

The following supporting information can be downloaded at: https://www.mdpi.com/article/10.3390/nu15245025/s1, Table S1: CONSORT 2010 checklist; Table S2: Changes in waist and hip circumference during the treatment period.

Author Contributions

Conceptualization, Y.B.; methodology, Y.B.; validation, Y.B.; formal analysis, Y.B.; investigation, Y.B. and M.K.; writing—original draft preparation, Y.B., N.A. and Y.S.; writing—review and editing, Y.B., N.A. and Y.S.; visualization, Y.B.; supervision, D.T. All authors have read and agreed to the published version of the manuscript.

Funding

This research received no external funding.

Institutional Review Board Statement

The study was conducted in accordance with the Declaration of Helsinki and approved by the Ethical Committee of Kobuna Orthopedics Clinic (approval date: 5 October 2022; approval number: MK-2210-01).

Informed Consent Statement

Informed consent was obtained from all subjects involved in the study.

Data Availability Statement

Datasets generated during the current study and/or analyzed during the current study are available from the responsible author upon reasonable request.

Acknowledgments

We would like to express our sincere appreciation to the team members involved in the production of the test foods for this research.

Conflicts of Interest

Y.B., M.K., N.A. and Y.S. are employees of Ezaki Glico Co., Ltd. The other author, D.T. reports no conflict of interest in this work.

References

  1. World Health Organization. Obesity and Overweight. Available online: https://www.who.int/news-room/fact-sheets/detail/obesity-and-overweight (accessed on 19 October 2023).
  2. Shuster, A.; Patlas, M.; Pinthus, J.H.; Mourtzakis, M. The clinical importance of visceral adiposity: A critical review of methods for visceral adipose tissue analysis. Br. J. Radiol. 2012, 85, 1-e25. [Google Scholar] [CrossRef] [PubMed]
  3. Green, M.; Arora, K.; Prakash, S. Microbial medicine: Prebiotic and probiotic functional foods to target obesity and metabolic syndrome. Int. J. Mol. Sci. 2020, 21, 2890. [Google Scholar] [CrossRef] [PubMed]
  4. Pedroza Matute, S.; Iyavoo, S. Exploring the Gut Microbiota: Lifestyle Choices, Disease Associations, and Personal Genomics. Front. Nutr. 2023, 10, 1225120. [Google Scholar] [CrossRef] [PubMed]
  5. Hill, C.; Guarner, F.; Reid, G.; Gibson, G.R.; Merenstein, D.J.; Pot, B.; Morelli, L.; Canani, R.B.; Flint, H.J.; Salminen, S.; et al. The International Scientific Association for Probiotics and Prebiotics consensus statement on the Scope and appropriate use of the term probiotic. Nat. Rev. Gastroenterol. Hepatol. 2014, 11, 506–514. [Google Scholar] [CrossRef]
  6. Kadooka, Y.; Sato, M.; Imaizumi, K.; Ogawa, A.; Ikuyama, K.; Akai, Y.; Okano, M.; Kagoshima, M.; Tsuchida, T. Regulation of abdominal adiposity by probiotics (Lactobacillus gasseri SBT2055) in adults with obese tendencies in a randomized controlled trial. Eur. J. Clin. Nutr. 2010, 64, 636–643. [Google Scholar] [CrossRef] [PubMed]
  7. Ogawa, A.; Kadooka, Y.; Kato, K.; Shirouchi, B.; Sato, M. Lactobacillus gasseri SBT2055 reduces postprandial and fasting serum non-esterified fatty acid levels in Japanese hypertriacylglycerolemic subjects. Lipids Health Dis. 2014, 13, 36. [Google Scholar] [CrossRef]
  8. Kim, J.; Yun, J.M.; Kim, M.K.; Kwon, O.; Cho, B. Lactobacillus gasseri BNR17 supplementation reduces the visceral fat accumulation and waist circumference in obese adults: A randomized, double-blind, placebo-controlled trial. J. Med. Food 2018, 21, 454–461. [Google Scholar] [CrossRef]
  9. Rahayu, E.S.; Mariyatun, M.; Putri Manurung, N.E.; Hasan, P.N.; Therdtatha, P.; Mishima, R.; Komalasari, H.; Mahfuzah, N.A.; Pamungkaningtyas, F.H.; Yoga, W.K.; et al. Effect of probiotic Lactobacillus plantarum Dad-13 powder consumption on the gut microbiota and intestinal health of overweight adults. World J. Gastroenterol. 2021, 27, 107–128. [Google Scholar] [CrossRef]
  10. Sohn, M.; Na, G.Y.; Chu, J.; Joung, H.; Kim, B.-K.; Lim, S. Efficacy and safety of Lactobacillus plantarum K50 on lipids in Koreans with obesity: A randomized, double-blind controlled clinical trial. Front. Endocrinol. 2021, 12, 790046. [Google Scholar] [CrossRef]
  11. Sohn, M.; Jung, H.; Lee, W.S.; Kim, T.H.; Lim, S. Effect of Lactobacillus plantarum LMT1-48 on body fat in overweight subjects: A randomized, double-blind, placebo-controlled trial. Diabetes Metab. J. 2023, 47, 92–103. [Google Scholar] [CrossRef]
  12. Minami, J.; Iwabuchi, N.; Tanaka, M.; Yamauchi, K.; Xiao, J.-Z.; Abe, F.; Sakane, N. Effects of Bifidobacterium breve B-3 on body fat reductions in pre-obese adults: A randomized, double-blind, placebo-controlled trial. Biosci. Microbiota Food Health 2018, 37, 67–75. [Google Scholar] [CrossRef]
  13. Pedret, A.; Valls, R.M.; Calderón-Pérez, L.; Llauradó, E.; Companys, J.; Pla-Pagà, L.; Moragas, A.; Martín-Luján, F.; Ortega, Y.; Giralt, M.; et al. Effects of daily consumption of the probiotic Bifidobacterium animalis subsp. lactis CECT 8145 on anthropometric adiposity biomarkers in abdominally obese subjects: A randomized controlled trial. Int. J. Obes. 2019, 43, 1863–1868. [Google Scholar] [CrossRef]
  14. Takahashi, S.; Anzawa, D.; Takami, K.; Ishizuka, A.; Mawatari, T.; Kamikado, K.; Sugimura, H.; Nishijima, T. Effect of Bifidobacterium animalis ssp. lactis GCL2505 on visceral fat accumulation in healthy Japanese adults: A randomized controlled trial. Biosci. Microbiota Food Health 2016, 35, 163–171. [Google Scholar] [CrossRef] [PubMed]
  15. Sun, J.; Buys, N. Effects of probiotics consumption on lowering lipids and CVD risk factors: A systematic review and meta-analysis of randomized controlled trials. Ann. Med. 2015, 47, 430–440. [Google Scholar] [CrossRef] [PubMed]
  16. Zhang, Q.; Wu, Y.; Fei, X. Effect of probiotics on body weight and body-mass index: A systematic review and meta-analysis of randomized, controlled trials. Int. J. Food Sci. Nutr. 2015, 67, 571–580. [Google Scholar] [CrossRef] [PubMed]
  17. Koutnikova, H.; Genser, B.; Monteiro-Sepulveda, M.; Faurie, J.-M.; Rizkalla, S.; Schrezenmeir, J.; Clément, K. Impact of bacterial probiotics on obesity, diabetes and mon-alcoholic fatty liver disease related variables: A systematic review and meta-analysis of randomised controlled trials. BMJ Open 2019, 9, e017995. [Google Scholar] [CrossRef] [PubMed]
  18. Pineiro, M.; Asp, N.-G.; Reid, G.; Macfarlane, S.; Morelli, L.; Brunser, O.; Tuohy, K. FAO Technical Meeting on Prebiotics. J. Clin. Gastroenterol. 2008, 42 Pt 2 (Suppl. S3), S156–S159. [Google Scholar] [CrossRef]
  19. Beserra, B.T.S.; Fernandes, R.; do Rosario, V.A.; Mocellin, M.C.; Kuntz, M.G.F.; Trindade, E.B.S.M. A systematic review and meta-analysis of the prebiotics and synbiotics effects on glycaemia, insulin concentrations and lipid parameters in adult patients with overweight or obesity. Clin. Nutr. 2015, 34, 845–858. [Google Scholar] [CrossRef]
  20. Thompson, S.V.; Hannon, B.A.; An, R.; Holscher, H.D. Effects of isolated soluble fiber supplementation on body weight, glycemia, and insulinemia in adults with overweight and obesity: A systematic review and meta-analysis of randomized controlled trials. Am. J. Clin. Nutr. 2017, 106, 1514–1528. [Google Scholar] [CrossRef] [PubMed]
  21. Huwiler, V.V.; Schönenberger, K.A.; Segesser von Brunegg, A.; Reber, E.; Mühlebach, S.; Stanga, Z.; Balmer, M.L. Prolonged isolated soluble dietary fibre supplementation in overweight and obese patients: A systematic review with meta-analysis of randomised controlled trials. Nutrients 2022, 14, 2627. [Google Scholar] [CrossRef]
  22. Larsen, I.S.; Choi, B.S.-Y.; Föh, B.; Kristensen, N.N.; Ouellette, A.; Haller, R.F.; Olsen, P.B.; Saulnier, D.; Sina, C.; Jensen, B.A.H.; et al. Experimental diets dictate the metabolic benefits of probiotics in obesity. Gut Microbes 2023, 15, 2192547. [Google Scholar] [CrossRef]
  23. Wastyk, H.C.; Perelman, D.; Topf, M.; Fragiadakis, G.K.; Robinson, J.L.; Sonnenburg, J.L.; Gardner, C.D.; Sonnenburg, E.D. Randomized controlled trial demonstrates response to a probiotic intervention for metabolic syndrome that may correspond to diet. Gut Microbes 2023, 15, 2178794. [Google Scholar] [CrossRef]
  24. Ojima, M.N.; Yoshida, K.; Sakanaka, M.; Jiang, L.; Odamaki, T.; Katayama, T. Ecological and molecular perspectives on responders and non-responders to probiotics and prebiotics. Curr. Opin. Biotechnol. 2022, 73, 108–120. [Google Scholar] [CrossRef]
  25. Kovatcheva-Datchary, P.; Nilsson, A.; Akrami, R.; Lee, Y.S.; De Vadder, F.; Arora, T.; Hallen, A.; Martens, E.; Björck, I.; Bäckhed, F. Dietary fiber-induced improvement in glucose metabolism is associated with increased abundance of prevotella. Cell Metab. 2015, 22, 971–982. [Google Scholar] [CrossRef] [PubMed]
  26. Swanson, K.S.; Gibson, G.R.; Hutkins, R.; Reimer, R.A.; Reid, G.; Verbeke, K.; Scott, K.P.; Holscher, H.D.; Azad, M.B.; Delzenne, N.M.; et al. The International Scientific Association for Probiotics and Prebiotics (ISAPP) consensus statement on the definition and scope of synbiotics. Nat. Rev. Gastroenterol. Hepatol. 2020, 17, 687–701. [Google Scholar] [CrossRef] [PubMed]
  27. Childs, C.E.; Röytiö, H.; Alhoniemi, E.; Fekete, A.A.; Forssten, S.D.; Hudjec, N.; Lim, Y.N.; Steger, C.J.; Yaqoob, P.; Tuohy, K.M.; et al. Xylo-oligosaccharides alone or in synbiotic combination with Bifidobacterium animalis subsp. lactis induce bifidogenesis and modulate markers of immune function in healthy adults: A double-blind, placebo-controlled, randomised, factorial cross-over study. Br. J. Nutr. 2014, 111, 1945–1956. [Google Scholar] [CrossRef] [PubMed]
  28. Krumbeck, J.A.; Rasmussen, H.E.; Hutkins, R.W.; Clarke, J.; Shawron, K.; Keshavarzian, A.; Walter, J. Probiotic Bifidobacterium strains and galactooligosaccharides improve intestinal barrier function in obese adults but show no synergism when used together as synbiotics. Microbiome 2018, 6, 121. [Google Scholar] [CrossRef] [PubMed]
  29. Anzawa, D.; Mawatari, T.; Tanaka, Y.; Yamamoto, M.; Genda, T.; Takahashi, S.; Nishijima, T.; Kamasaka, H.; Suzuki, S.; Kuriki, T. Effects of synbiotics containing Bifidobacterium animalis subsp. lactis GCL2505 and inulin on intestinal bifidobacteria: A randomized, placebo-controlled, crossover study. Food Sci. Nutr. 2019, 7, 1828–1837. [Google Scholar] [CrossRef] [PubMed]
  30. Oh, Y.J.; Kim, H.J.; Kim, T.S.; Yeo, I.H.; Ji, G.E. Effects of Lactobacillus plantarum PMO 08 alone and combined with chia seeds on metabolic syndrome and parameters related to gut health in high-fat diet-induced obese mice. J. Med. Food 2019, 22, 1199–1207. [Google Scholar] [CrossRef] [PubMed]
  31. Li, Y.; Liu, M.; Liu, H.; Wei, X.; Su, X.; Li, M.; Yuan, J. Oral supplements of combined Bacillus licheniformis Zhengchangsheng® and xylooligosaccharides improve high-fat diet-induced obesity and modulate the gut microbiota in rats. Biomed. Res. Int. 2020, 2020, 9067821. [Google Scholar] [CrossRef]
  32. Rogha, M.; Esfahani, M.Z.; Zargarzadeh, A.H. The efficacy of a synbiotic containing Bacillus coagulans in treatment of irritable bowel syndrome: A randomized placebo-controlled trial. Gastroenterol. Hepatol. Bed Bench 2014, 7, 156–163. [Google Scholar]
  33. Skrzydło-Radomańska, B.; Prozorow-Król, B.; Cichoż-Lach, H.; Majsiak, E.; Bierła, J.B.; Kosikowski, W.; Szczerbiński, M.; Gantzel, J.; Cukrowska, B. The effectiveness of synbiotic preparation containing Lactobacillus and Bifidobacterium probiotic strains and short chain fructooligosaccharides in patients with diarrhea predominant irritable bowel syndrome-a randomized double-blind, placebo-controlled study. Nutrients 2020, 12, 1999. [Google Scholar]
  34. Ipar, N.; Aydogdu, S.D.; Yildirim, G.K.; Inal, M.; Gies, I.; Vandenplas, Y.; Dinleyici, E.C. Effects of synbiotic on anthropometry, lipid profile and oxidative stress in obese children. Benef. Microbes 2015, 6, 775–782. [Google Scholar] [CrossRef]
  35. Mohammadi-Sartang, M.; Bellissimo, N.; Totosy de Zepetnek, J.O.; Brett, N.R.; Mazloomi, S.M.; Fararouie, M.; Bedeltavana, A.; Famouri, M.; Mazloom, Z. The effect of daily fortified yogurt consumption on weight loss in adults with metabolic syndrome: A 10-week randomized controlled trial. Nutr. Metab. Cardiovasc. Dis. 2018, 28, 565–574. [Google Scholar] [CrossRef]
  36. Eslamparast, T.; Poustchi, H.; Zamani, F.; Sharafkhah, M.; Malekzadeh, R.; Hekmatdoost, A. Synbiotic supplementation in nonalcoholic fatty liver disease: A randomized, double-blind, placebo-controlled pilot study. Am. J. Clin. Nutr. 2014, 99, 535–542. [Google Scholar] [CrossRef] [PubMed]
  37. Lalitsuradej, E.; Sirilun, S.; Sittiprapaporn, P.; Sivamaruthi, B.S.; Pintha, K.; Tantipaiboonwong, P.; Khongtan, S.; Fukngoen, P.; Peerajan, S.; Chaiyasut, C. The effects of synbiotics administration on stress-related parameters in Thai subjects-a preliminary study. Foods 2022, 11, 759. [Google Scholar] [CrossRef] [PubMed]
  38. Valle, M.C.P.R.; Vieira, I.A.; Fino, L.C.; Gallina, D.A.; Esteves, A.M.; da Cunha, D.T.; Cabral, L.; Benatti, F.B.; Marostica Junior, M.R.; Batista, Â.G.; et al. Immune status, well-being and gut microbiota in military supplemented with synbiotic ice cream and submitted to field training: A randomised clinical trial. Br. J. Nutr. 2021, 126, 1794–1808. [Google Scholar] [CrossRef] [PubMed]
  39. Chiu, Y.-H.; Lin, S.-L.; Tsai, J.-J.; Lin, M.-Y. Probiotic actions on diseases: Implications for therapeutic treatments. Food Funct. 2014, 5, 625–634. [Google Scholar] [CrossRef] [PubMed]
  40. Taipale, T.J.; Pienihäkkinen, K.; Isolauri, E.; Jokela, J.T.; Söderling, E.M. Bifidobacterium animalis subsp. lactis BB-12 in reducing the risk of infections in early childhood. Pediatr. Res. 2016, 79, 65–69. [Google Scholar] [CrossRef] [PubMed]
  41. Ishizuka, A.; Tomizuka, K.; Aoki, R.; Nishijima, T.; Saito, Y.; Inoue, R.; Ushida, K.; Mawatari, T.; Ikeda, T. Effects of administration of Bifidobacterium animalis subsp. lactis GCL2505 on defecation frequency and bifidobacterial microbiota composition in humans. J. Biosci. Bioeng. 2012, 113, 587–591. [Google Scholar] [CrossRef]
  42. Aoki, R.; Tsuchida, S.; Arai, Y.; Ohno, K.; Nishijima, T.; Mawatari, T.; Mikami, Y.; Ushida, K. Effect of Bifidobacterium animalis subsp. lactis GCL2505 on the physiological function of intestine in a rat model. Food Sci. Nutr. 2016, 4, 782–790. [Google Scholar] [CrossRef] [PubMed]
  43. Lim, S.; Moon, J.H.; Shin, C.M.; Jeong, D.; Kim, B. Effect of Lactobacillus sakei, a probiotic derived from kimchi, on body fat in Koreans with obesity: A randomized controlled study. Endocrinol. Metab. 2020, 35, 425–434. [Google Scholar] [CrossRef] [PubMed]
  44. Cho, Y.G.; Yang, Y.J.; Yoon, Y.S.; Lee, E.S.; Lee, J.H.; Jeong, Y.; Kang, C.H. Effect of MED-02 containing two probiotic strains, Limosilactobacillus fermentum MG4231 and MG4244, on body fat reduction in overweight or obese subjects: A randomized, multicenter, double-blind, placebo-controlled study. Nutrients 2022, 14, 3583. [Google Scholar] [CrossRef]
  45. Ryo, M.; Kishida, K.; Nakamura, T.; Yoshizumi, T.; Funahashi, T.; Shimomura, I. Clinical significance of visceral adiposity assessed by computed tomography: A Japanese perspective. World J. Radiol. 2014, 6, 409–416. [Google Scholar] [CrossRef] [PubMed]
  46. Tourlousse, D.M.; Narita, K.; Miura, T.; Sakamoto, M.; Ohashi, A.; Shiina, K.; Matsuda, M.; Miura, D.; Shimamura, M.; Ohyama, Y.; et al. Validation and standardization of DNA extraction and library construction methods for metagenomics-based human fecal microbiome measurements. Microbiome 2021, 9, 95. [Google Scholar] [CrossRef]
  47. Tanaka, Y.; Takami, K.; Nishijima, T.; Aoki, R.; Mawatari, T.; Ikeda, T. Short- and long-term dynamics in the intestinal microbiota following ingestion of Bifidobacterium animalis subsp. lactis GCL2505. Biosci. Microbiota Food Health 2015, 34, 77–85. [Google Scholar] [CrossRef]
  48. Ministry of Health, Labour and Welfare. Dietary Reference Intakes for Japanese (2020); Ministry of Health, Labour and Welfare: Tokyo, Japan, 2019; Available online: https://www.mhlw.go.jp/content/001151422.pdf (accessed on 26 October 2023).
  49. Ibrahim, M.M. Subcutaneous and visceral adipose tissue: Structural and functional differences. Obes. Rev. 2010, 11, 11–18. [Google Scholar] [CrossRef]
  50. Chaston, T.B.; Dixon, J.B. Factors associated with percent change in visceral versus subcutaneous abdominal fat during weight loss: Findings from a systematic review. Int. J. Obes. 2008, 32, 619–628. [Google Scholar] [CrossRef]
  51. Musazadeh, V.; Mohammadi Anilou, M.; Vajdi, M.; Karimi, A.; Sedgh Ahrabi, S.; Dehghan, P. Effects of synbiotics supplementation on anthropometric and lipid profile parameters: Finding from an umbrella meta-analysis. Front. Nutr. 2023, 10, 1121541. [Google Scholar] [CrossRef]
  52. Aoki, R.; Kamikado, K.; Suda, W.; Takii, H.; Mikami, Y.; Suganuma, N.; Hattori, M.; Koga, Y. A proliferative probiotic Bifidobacterium strain in the gut ameliorates progression of metabolic disorders via microbiota modulation and acetate elevation. Sci. Rep. 2017, 7, 43522. [Google Scholar] [CrossRef]
  53. Horiuchi, H.; Kamikado, K.; Aoki, R.; Suganuma, N.; Nishijima, T.; Nakatani, A.; Kimura, I. Bifidobacterium animalis subsp. lactis GCL2505 modulates host energy metabolism via the short-chain fatty acid receptor GPR43. Sci. Rep. 2020, 10, 4158. [Google Scholar] [CrossRef] [PubMed]
  54. Birkeland, E.; Gharagozlian, S.; Birkeland, K.I.; Valeur, J.; Måge, I.; Rud, I.; Aas, A.-M. Prebiotic effect of inulin-type fructans on faecal microbiota and short-chain fatty acids in type 2 diabetes: A randomised controlled Trial. Eur. J. Nutr. 2020, 59, 3325–3338. [Google Scholar] [CrossRef] [PubMed]
  55. Nakajima, H.; Nakanishi, N.; Miyoshi, T.; Okamura, T.; Hashimoto, Y.; Senmaru, T.; Majima, S.; Ushigome, E.; Asano, M.; Yamaguchi, M.; et al. Inulin reduces visceral adipose tissue mass and improves glucose tolerance through altering gut metabolites. Nutr. Metab. 2022, 19, 50. [Google Scholar] [CrossRef] [PubMed]
  56. He, M.; Shi, B. Gut microbiota as a potential target of metabolic syndrome: The role of probiotics and prebiotics. Cell Biosci. 2017, 7, 54. [Google Scholar] [CrossRef]
  57. Ogawa, A.; Kobayashi, T.; Sakai, F.; Kadooka, Y.; Kawasaki, Y. Lactobacillus gasseri SBT2055 suppresses fatty acid release through enlargement of fat emulsion size in vitro and promotes fecal fat excretion in healthy Japanese subjects. Lipids Health Dis. 2015, 14, 20. [Google Scholar] [CrossRef]
  58. Azuma, N.; Mawatari, T.; Saito, Y.; Tsukamoto, M.; Sampei, M.; Iwama, Y. Effect of continuous ingestion of bifidobacteria and dietary fiber on improvement in cognitive function: A randomized, double-blind, placebo-controlled trial. Nutrients 2023, 15, 4175. [Google Scholar] [CrossRef]
  59. Azuma, N.; Saito, Y.; Nishijima, T.; Aoki, R.; Nishihira, J. Effect of daily ingestion of Bifidobacterium and dietary fiber on vascular endothelial function: A randomized, double-blind, placebo-controlled, parallel-group comparison study. Biosci. Biotechnol. Biochem. 2023, zbad148. [Google Scholar] [CrossRef]
Figure 1. Flowchart of participant selection.
Nutrients 15 05025 g001
Figure 2. Changes in (a) visceral fat area, (b) subcutaneous fat area and (c) total fat area in the placebo and active groups during the study period. Values are the means, with error bars as standard error. Asterisks (*) indicate a p-value < 0.05 as a result of inter-group difference (the placebo group vs. the active group; unpaired t-test with Benjamini–Hochberg procedure). SFA, subcutaneous fat area; TFA, total fat area; VFA, visceral fat area.
Nutrients 15 05025 g002
Figure 3. Changes in the number of fecal bifidobacteria in the placebo and active groups during the study period. Values are expressed as the sum of the mean ± standard error values of each species.
Nutrients 15 05025 g003
Table 1. Nutritional details of the test drinks.
ParameterPlacebo GroupActive Group
Energy, kcal/100 g47.052.0
Moisture, g/100 g87.084.8
Protein, g/100 g2.82.8
Fat, g/100 g0.10.1
Carbohydrate, g/100 g9.011.2
Ash, g/100 g1.11.1
The active drink contained 2.0 g inulin and 1.0 × 10¹⁰ colony-forming units GCL2505.
Table 2. Baseline characteristics of the participants (placebo group: n = 60; active group: n = 60).
CharacteristicPlacebo GroupActive Groupp-Value
Clinical findingsAge, years50.6 (8.0)50.6 (8.4)0.973
Height, cm165.9 (8.2)167.8 (8.5)0.221
Body weight, kg73.6 (7.9)73.8 (8.2)0.873
Body mass index, kg/m226.7 (1.5)26.2 (2.0)0.129
Waist circumference, cm92.5 (5.1)92.4 (6.2)0.902
Hip circumference, cm98.0 (3.6)98.2 (4.5)0.840
Waist-to-hip ratio0.9 (0.04)0.9 (0.04)0.720
Visceral fat area, cm2124.9 (31.0)124.0 (31.3)0.864
Subcutaneous fat area, cm2206.0 (58.1)207.7 (65.2)0.881
Total fat area, cm2330.9 (61.6)331.7 (69.8)0.953
Systolic blood pressure, mmHg127.7 (11.2)132.4 (15.1)0.055
Diastolic blood pressure, mmHg79.0 (10.6)82.3 (11.7)0.108
Heartbeat, bpm77.5 (10.5)78.4 (10.8)0.644
Laboratory findingsWhite blood cell count, /µL6185.0 (1449)6076.7 (1077)0.643
Red blood cell count, ×104/µL495.8 (45.4)489.0 (43.8)0.405
Hemoglobin, g/dL15.0 (1.3)14.7 (1.2)0.214
Hematocrit, %47.2 (3.6)46.6 (3.2)0.351
Platelet count, ×104/μL26.7 (4.5)28.0 (6.0)0.164
Neutrophil ratio, %58.3 (7.2)57.8 (5.9)0.675
Lymphocyte ratio, %32.2 (6.8)32.6 (5.7)0.678
Monocyte ratio, %5.6 (1.3)5.3 (1.0)0.193
Eosinophil ratio, %3.2 (2.0)3.4 (2.7)0.652
Basophil ratio, %0.7 (0.3)0.9 (0.3)0.047
Total serum protein, g/dL7.2 (0.4)7.3 (0.3)0.237
Albumin, g/dL4.4 (0.3)4.5 (0.3)0.120
Aspartate aminotransferase, U/L24.8 (10.8)23.5 (6.7)0.430
Alanine aminotransferase, U/L30.4 (21.2)26.6 (17.1)0.280
Lactate dehydrogenase, U/L183.0 (29.6)188.9 (32.7)0.308
Total bilirubin, mg/dL0.8 (0.2)0.9 (0.3)0.228
Alkaline phosphatase, U/L75.7 (19.9)76.8 (17.3)0.758
Laboratory findingsγ-Glutamyl transpeptidase, U/L40.4 (31.3)44.7 (36.6)0.485
Blood urea nitrogen, mg/dL13.3 (2.8)13.8 (3.2)0.356
Creatinine, mg/dL0.8 (0.15)0.8 (0.16)0.894
Uric acid, mg/dL5.8 (1.3)5.8 (1.3)0.746
Sodium (Na), mEq/L141.3 (1.7)141.4 (1.4)0.726
Chlorine (Cl), mEq/L104.1 (2.2)103.9 (1.7)0.645
Potassium (K), mEq/L4.2 (0.3)4.2 (0.2)0.145
Calcium (Ca), mg/dL9.5 (0.3)9.5 (0.3)0.294
Total cholesterol, mg/dL218.0 (30.2)217.8 (31.9)0.967
LDL cholesterol, mg/dL140.0 (27.5)137.9 (30.0)0.694
HDL cholesterol, mg/dL55.3 (12.4)58.6 (14.7)0.185
Triglycerides, mg/dL131.6 (65.8)121.4 (49.7)0.338
Glucose, mg/dL89.8 (9.2)89.1 (9.6)0.677
HbA1c (NGSP), %5.5 (0.3)5.5 (0.3)0.926
Free fatty acid, mEq/L0.4 (0.2)0.5 (0.2)0.077
Urine pH6.2 (0.5)6.2 (0.6)0.560
Urine specific gravity1.0 (0.007)1.0 (0.007)0.491
Compliance rate of the test sample, % *99.80 (0.50)99.88(0.42)0.349
All data are presented as the mean (standard deviation). Comparisons of value between placebo and active groups were tested by analysis of variance. HDL, high-density lipoprotein; LDL, low-density lipoprotein. * The compliance rate of test sample intake is shown excluding participants who dropped out.
Table 3. Dietary composition during the treatment period.
Parameter0 Weeks4 Weeks8 Weeks12 Weeks
Energy, kcalActive1820.9 (385.4)1816.5 (428.4)1792.3 (399.5)1704.8 (413.2) *
Placebo1925.3 (360.3)1929.8 (411.4)1880.7 (414.8)1820.1 (366.6) *
Protein, g Active68.7 (15.7)67.3 (17.8)66.0 (16.2)64.9 (17.5) *
Placebo72.5 (15.3)72.1 (15.4)69.7 (19.0)68.6 (14.9) *
Fat, gActive63.8 (17.9)61.4 (19.2)60.7 (20.0)55.9 (19.1) *#
Placebo67.9 (20.0)66.9 (20.4)65.3 (20.6)64.1 (18.7)
Carbohydrate, gActive229.7 (53.0)236.2 (57.4)233.3 (52.8)222.6 (54.8)
Placebo243.3 (56.2)247.1 (59.4)240.4 (53.5)230.2 (50.6) *
Dietary fiber, gActive10.8 (3.3)10.7 (3.1)10.6 (3.1)10.1 (3.2)
Placebo10.9 (2.9)11.0 (3.0)10.4 (3.0)9.9 (2.7) *
All data are presented as the mean (standard deviation). * p < 0.05 compared with week 0, paired t-test. # p < 0.05 compared with placebo, unpaired t-test.
Table 4. Changes in abdominal fat area by CT scan during the treatment period.
Parameter0 Weeks8 Weeks12 WeeksTime × Group
Visceral fat area, cm2Active124.0 (4.1)111.1 (4.2) *106.8 (3.6) *<0.0001
Placebo119.8 (3.9)117.5 (4.9)114.9 (4.0)
Subcutaneous fat area, cm2Active206.9 (8.3)207.2 (8.3)206.7 (8.6)0.379
Placebo211.9 (8.8)212.2 (8.6)215.8 (9.4)
Total fat area, cm2Active331.0 (9.3)318.4 (9.9) *313.5 (9.5) *0.001
Placebo331.7 (9.1)329.7 (10.2)330.7 (10.3)
All data are presented as the mean (standard error). * p < 0.05 compared with week 0, paired t-test. p-value represented as a group-by-time interaction effect by two-factor repeated-measures analysis of variance.
Table 5. Changes in anthropometric parameters during the treatment period.
Parameter0 Weeks4 Weeks8 Weeks12 Weeks
Body weight, kgActive74.9 (1.1)74.8 (1.1)74.7 (1.1)74.6 (1.1) *
Placebo74.8 (1.1)74.8 (1.1)74.6 (1.1)74.3 (1.1)
Body mass index, kg/m2Active26.5 (0.3)26.4 (0.3)26.4 (0.3)26.3 (0.3) *
Placebo27.0 (0.2)27.0 (0.2)26.9 (0.2)26.9 (0.2)
Waist-to-hip ratioActive0.9 (0.005)0.9 (0.005)0.9 (0.005)0.9 (0.005)
Placebo0.9 (0.006)0.9 (0.005)0.9 (0.005)0.9 (0.005)
All data are presented as the mean (standard error). * p < 0.05 compared with week 0, paired t-test.
Table 6. Changes in plasma biochemistry parameters during the treatment period.
Parameter0 Weeks4 Weeks8 Weeks12 Weeks
Total cholesterol, mg/dLActive219.4 (4.2)217.6 (4.1)211.6 (4.2) *217.5 (4.6)
Placebo219.2 (4.2)219.0 (3.7)216.2 (4.2)219.4 (4.3)
LDL cholesterol, mg/dLActive139.9 (4.2)136.3 (3.8)135.3 (3.9) *136.5 (4.3)
Placebo136.3 (3.8)139.0 (3.4)138.7 (3.7)138.1 (4.0)
HDL cholesterol, mg/dLActive57.9 (2.1)59.0 (1.9)55.8 (1.7) *56.2 (1.7)
Placebo55.5 (1.7)54.6 (1.8)54.2 (1.9)54.5 (1.8)
Triglycerides, mg/dLActive113.6 (7.0)116.2 (6.3) #113.6 (5.4) #118.3 (8.8)
Placebo130.2 (8.3)141.7 (11.1)138.5 (10.1)143.1 (15.8)
Free fatty acid, mEq/LActive0.53 (0.03)0.50 (0.02)0.53 (0.02)0.61 (0.03) *
Placebo0.48 (0.03)0.50 (0.02)0.48 (0.02)0.55 (0.03) *
All data are presented as the mean (standard error). HDL, high-density lipoprotein; LDL, low-density lipoprotein. * p < 0.05 compared with week 0, paired t-test. # p < 0.05 compared with placebo, unpaired t-test.
Table 7. Changes in the number of fecal bifidobacterial during the treatment period.
Bifidobacteria0 Weeks8 Weeks12 Weeks
Total bifidobacteriaActive9.62 (0.14)10.35 (0.08) *#10.41 (0.07) *#
Placebo9.48 (0.17)9.60 (0.17)9.61 (0.17)
B. animalis subsp. lactisActive5.70 (0.15)9.67 (0.09) *#9.77 (0.08) *#
Placebo5.70 (0.14)5.72 (0.15)5.50 (0.10)
B. longum subsp. longumActive8.62 (0.20)8.86 (0.23) *8.96 (0.23) *
Placebo8.26 (0.23)8.35 (0.24)8.37 (0.23)
B. adolescentis groupActive7.81 (0.28)8.14 (0.31) *8.18 (0.31) *
Placebo7.73 (0.29)8.09 (0.29)8.19 (0.30)
B. catenulatum and B. pseudocatenulatumActive8.22 (0.25)8.40 (0.27) *#8.37 (0.27) *#
Placebo7.89 (0.26)7.87 (0.26)7.90 (0.25)
B. breveActive5.66 (0.11)5.77 (0.12)5.74 (0.12)
Placebo5.62 (0.11)5.62 (0.11)5.68 (0.12)
B. bifidumActive6.02 (0.20)6.08 (0.20)6.14 (0.21)
Placebo5.89 (0.18)5.98 (0.19)5.98 (0.19)
B. longum subsp. infantisActive5.53 (0.09)5.59 (0.11)5.57 (0.10)
Placebo5.51 (0.09)5.51 (0.10)5.52 (0.09)
B. dentiumActive5.64 (0.11)5.66 (0.10)5.63 (0.10)
Placebo5.63 (0.09)5.71 (0.10)5.64 (0.09)
B. angulatumActiven.d.n.d.n.d.
Placebon.d.n.d.n.d.
Endogenous bifidobacteriaActive9.60 (0.14)9.89 (0.16) *9.92 (0.16) *
Placebo9.45 (0.17)9.57 (0.17)9.61 (0.17)
All data are presented as the mean (standard error) of common logarithms of the number of bacteria per 1 g feces. The detection limit of quantitative PCR was 2.0 × 10⁵ cells per gram of feces. n.d., not detected. * p < 0.05 compared with placebo, unpaired t-test with Benjamini–Hochberg procedure. # p < 0.05 compared with week 0, paired t-test with Benjamini–Hochberg procedure.
Table 8. Association of changes over time in body composition and metabolic parameters with changes in bifidobacteria.
Object VariableRatio of Change from Week 0 to 12Explanatory VariableChange from Week 0 to 12, %p-Value
Total bifidobacteria33.46 (12.51)BMI−0.5 (0.2)0.010
VFA−7.2 (1.3)0.012
Endogenous bifidobacteria27,875.92 (5977.64)BMI−0.5 (0.2)0.025
B. animalis subsp. lactis8.07 (2.63)BMI−0.5 (0.2)0.025
All data are presented as the mean (standard error). Data were generated by applying analysis of variance to a mixed linear model. BMI, body mass index; VFA, visceral fat area.
Disclaimer/Publisher’s Note: The statements, opinions and data contained in all publications are solely those of the individual author(s) and contributor(s) and not of MDPI and/or the editor(s). MDPI and/or the editor(s) disclaim responsibility for any injury to people or property resulting from any ideas, methods, instructions or products referred to in the content.

