
Dietary Intake of Masters Athletes: A Systematic Review


 ,
,  and
and 
Abstract
1. Introduction
2. Materials and Methods
3. Results
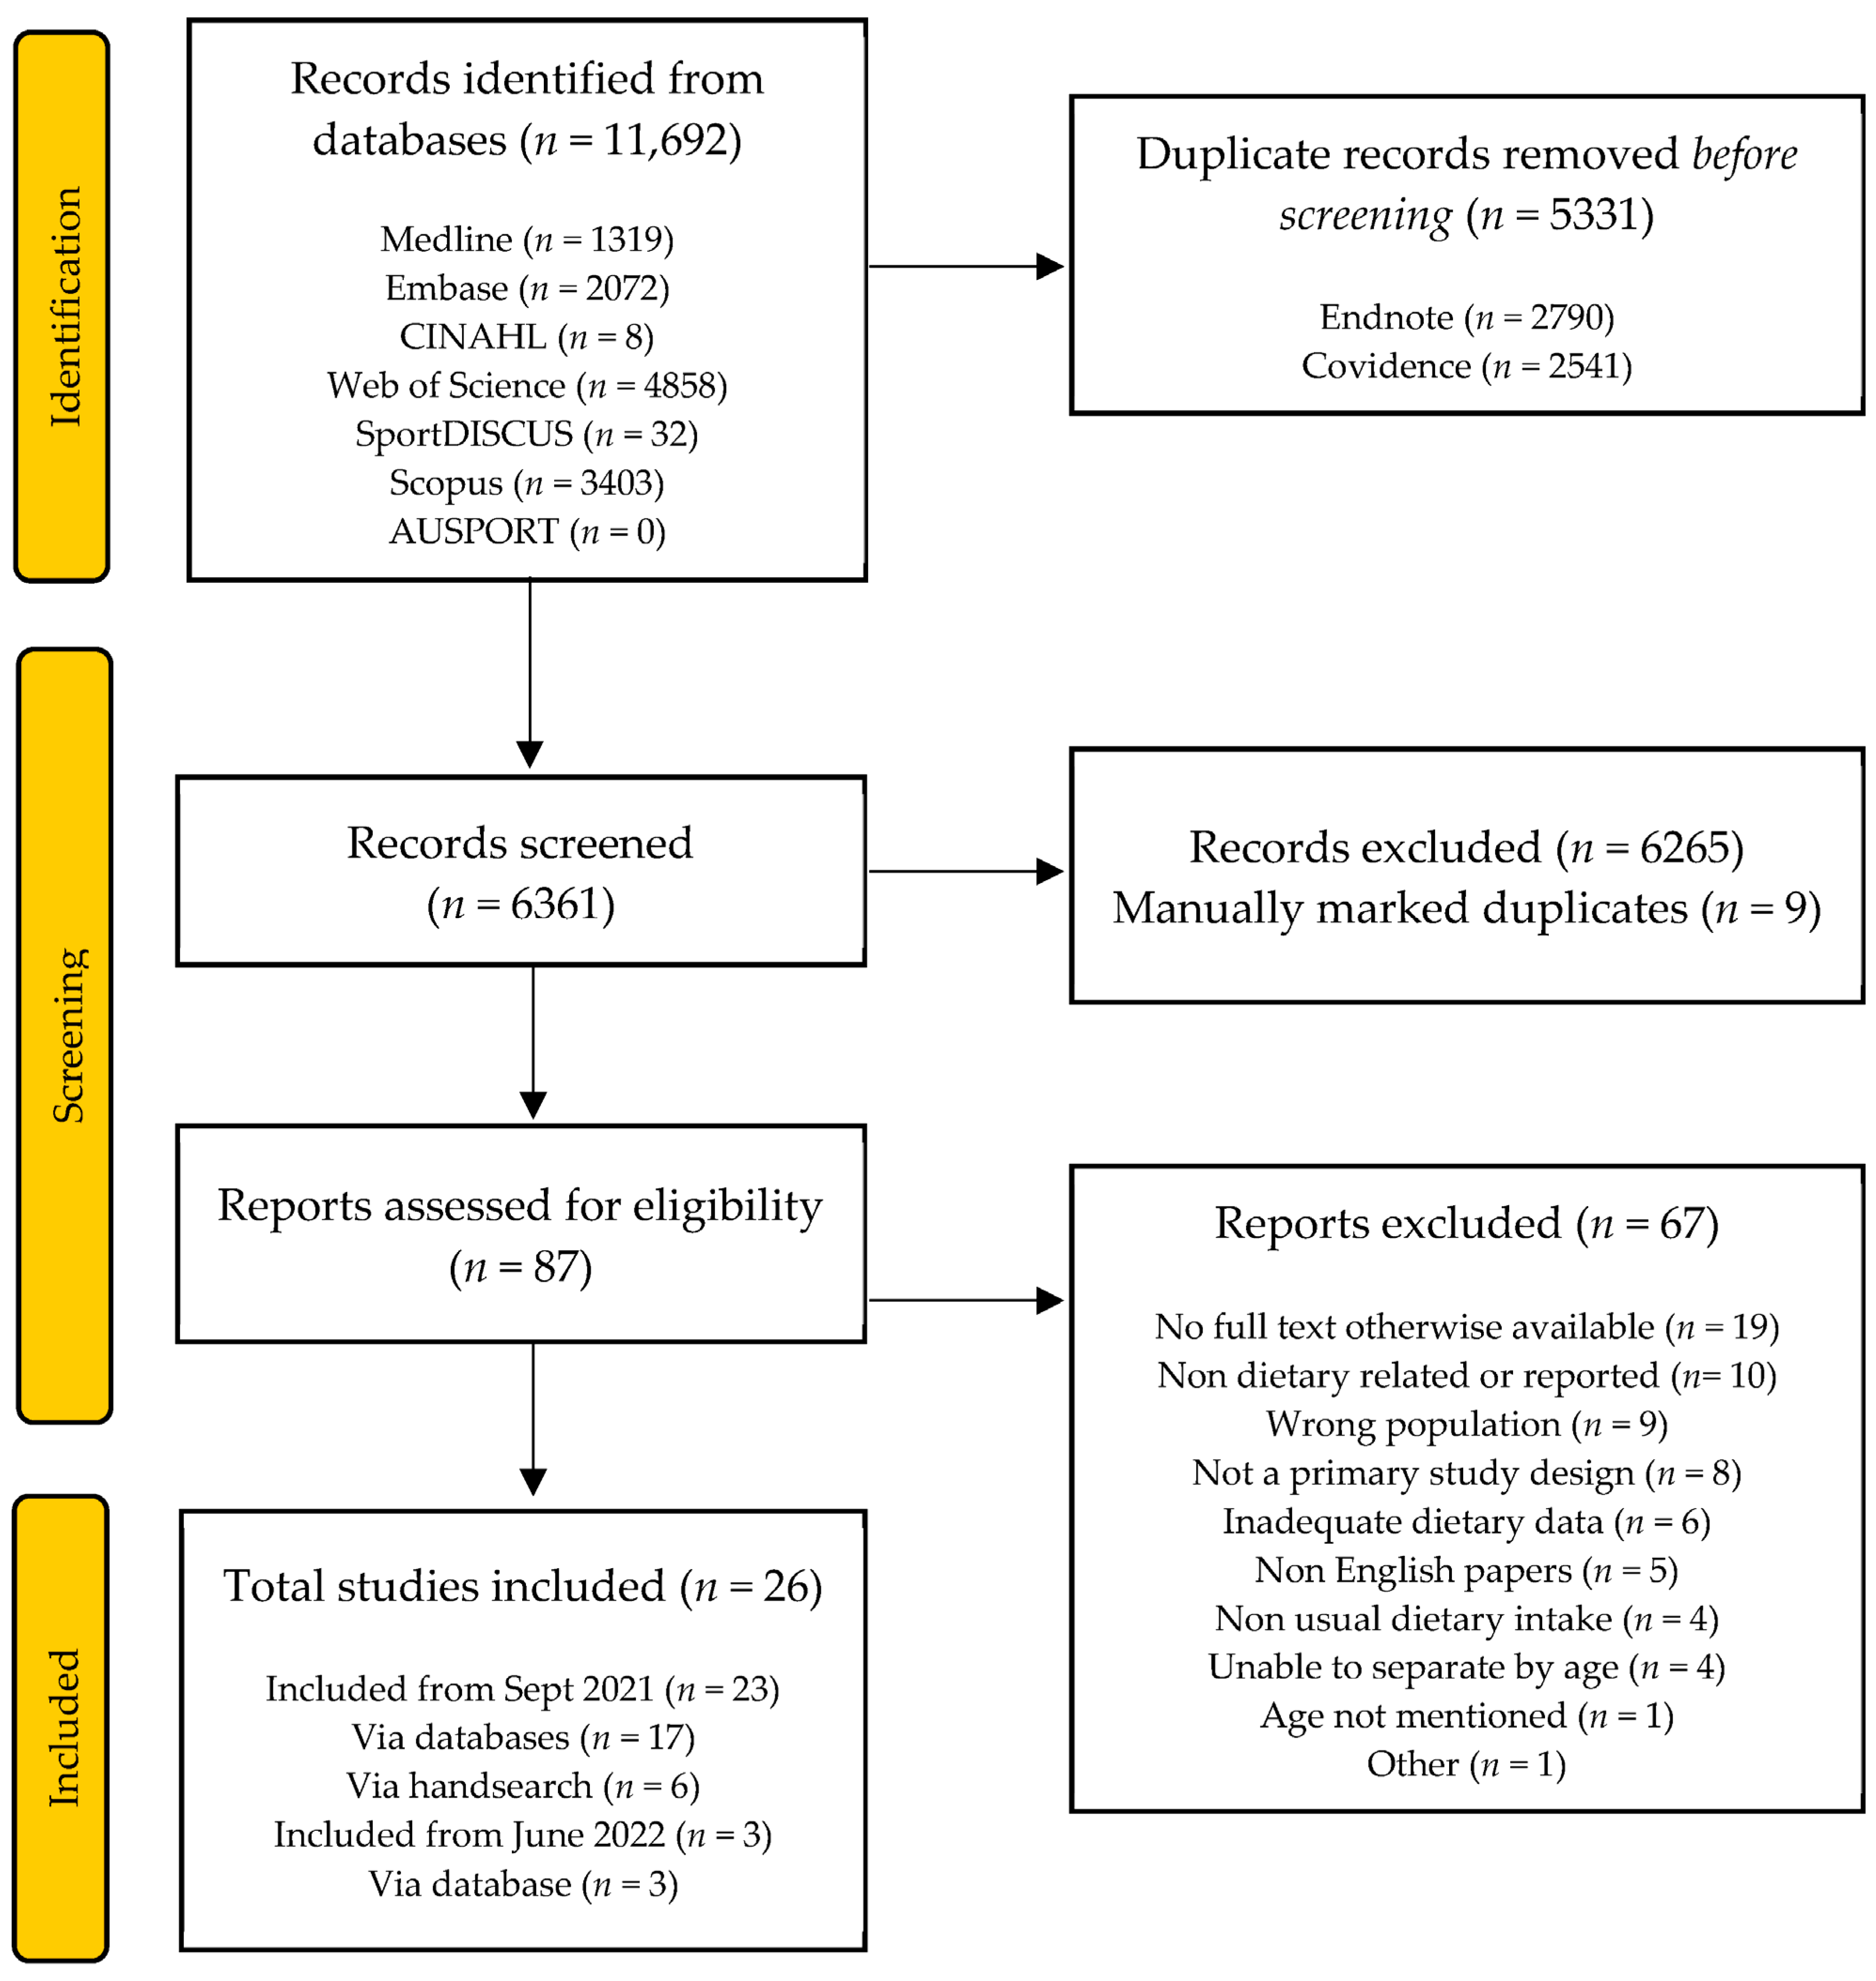
3.1. Study Selection
3.2. Participants and Study Characteristics
4. Discussion
5. Conclusions
Supplementary Materials
Author Contributions
Funding
Institutional Review Board Statement
Informed Consent Statement
Data Availability Statement
Acknowledgments
Conflicts of Interest
References
- Tanaka, H.; Tarumi, T.; Rittweger, J. Aging and Physiological Lessons from Master Athletes. Compr. Physiol. 2020, 10, 261–296. [Google Scholar] [CrossRef]
- Van Pelt, R.E.; Dinneno, F.A.; Seals, D.R.; Jones, P.P. Age-related decline in RMR in physically active men: Relation to exercise volume and energy intake. Am. J. Physiol. Endocrinol. Metab. 2001, 44, E633–E639. [Google Scholar] [CrossRef]
- Louis, J.; Vercruyssen, F.; Dupuy, O.; Bernard, T. Nutrition for master athletes: Is there a need for specific recommendations? J. Aging Phys. Act. 2019, 28, 489–498. [Google Scholar] [CrossRef]
- Australian Institute of Health and Welfare. Insufficient Physical Activity; Australian Institute of Health and Welfare: Paddington, NSW, Australia, 2020.
- Gifford, J.; O’Connor, H. Masters athletes. In Nutrition for Sport, Exercise and Performance: A Practical Guide for Students, Sports Enthusiasts and Professionals; Belski, R., Forsyth, A., Mantzioris, E., Eds.; Allen & Unwin: Crows Nest, NSW, Australia, 2019. [Google Scholar]
- Australian Bureau of Statistics. Australian Health Survey: Nutrition First Results—Foods and Nutrients, 2011–2012. Available online: https://www.abs.gov.au/statistics/health/health-conditions-and-risks/australian-health-survey-nutrition-first-results-foods-and-nutrients/latest-release (accessed on 10 July 2022).
- Afshin, A.; Sur, P.J.; Fay, K.A.; Cornaby, L.; Ferrara, G.; Salama, J.S.; Mullany, E.C.; Abate, K.H.; Abbafati, C.; Abebe, Z.; et al. Health effects of dietary risks in 195 countries, 1990–2017: A systematic analysis for the Global Burden of Disease Study 2017. Lancet 2019, 393, 1958–1972. [Google Scholar] [CrossRef]
- Australian Bureau of Statistics. National Health Survey: First Results, 2017–2018—Australia. Available online: https://www.abs.gov.au/statistics/health/health-conditions-and-risks/chronic-conditions/latest-release (accessed on 2 November 2021).
- Black, D.; Climstein, M.; Gifford, J.; Halar, F.; O’Connor, H.; Prvan, T.; Reaburn, P.; Stuart-Smith, W. Prevalence of chronic conditions in masters games athletes. J. Sci. Med. Sport 2021, 24, S5–S6. [Google Scholar] [CrossRef]
- Geard, D.; Reaburn, P.R.J.; Rebar, A.L.; Dionigi, R.A. Masters Athletes: Exemplars of Successful Aging? J. Aging Phys. Act. 2017, 25, 490–500. [Google Scholar] [CrossRef]
- Blair, S.N.; Ellsworth, N.M.; Haskell, W.L.; Stern, M.P.; Farquhar, J.W.; Wood, P.D. Comparison of nutrient intake in middle-aged men and women runners and controls. Med. Sci. Sports Exerc. 1981, 13, 310–315. [Google Scholar] [CrossRef]
- Chatard, J.C.; Boutet, C.; Tourny, C.; Garcia, S.; Berthouze, S.; Guezennec, C.Y. Nutritional status and physical fitness of elderly sportsmen. Eur. J. Appl. Physiol. 1998, 77, 157–163. [Google Scholar] [CrossRef]
- Hallfrisch, J.; Drinkwater, D.T.; Muller, D.C.; Fleg, J.; Janette; Busby-Whitehead, M.; Andres, R.; Goldberg, A. Physical conditioning status and diet intake in active and sedentary older men. Nutr. Res. 1994, 14, 817–827. [Google Scholar] [CrossRef]
- Nieman, D.C.; Butler, J.V.; Pollett, L.M.; Dietrich, S.J.; Lutz, R.D. Nutrient intake of marathon runners. J. Am. Diet. Assoc. 1989, 89, 1273–1278. [Google Scholar] [CrossRef] [PubMed]
- Sallinen, J.; Ojanen, T.; Karavirta, L.; Ahtiainen, J.P.; Häkkinen, K. Muscle mass and strength, body composition and dietary intake in master strength athletes vs untrained men of different ages. J. Sports Med. Phys. Fit. 2008, 48, 190–196. [Google Scholar]
- Bauer, J.M.D.; Biolo, G.M.D.P.; Cederholm, T.M.D.P.; Cesari, M.M.D.P.; Cruz-Jentoft, A.J.M.D.; Morley, J.E.M.B.B.; Phillips, S.P.; Sieber, C.M.D.P.; Stehle, P.M.D.P.; Teta, D.M.D.P.; et al. Evidence-Based Recommendations for Optimal Dietary Protein Intake in Older People: A Position Paper From the PROT-AGE Study Group. J. Am. Med. Dir. Assoc. 2013, 14, 542–559. [Google Scholar] [CrossRef] [PubMed]
- National Health and Medical Research Council; Australian Government Department of Health and Ageing; New Zealand Ministry of Health. Nutrient Reference Values for Australia and New Zealand. Available online: https://www.nrv.gov.au/home (accessed on 11 October 2023).
- Dixon, D.; Hegedus, C. An Analysis of the Nutritional Practices of Club Level Cyclists before and during a Cyclocross Race. Int. J. Sports Sci. 2014, 4, 7–13. [Google Scholar]
- Lavoué, C.; Siracusa, J.; Chalchat, É.; Bourrilhon, C.; Charlot, K. Analysis of food and fluid intake in elite ultra-endurance runners during a 24-h world championship. J. Int. Soc. Sports Nutr. 2020, 17, 36. [Google Scholar] [CrossRef]
- García-Rovés, P.M.; Terrados, N.; Fernández, S.; Patterson, A.M. Comparison of dietary intake and eating behavior of professional road cyclists during training and competition. Int. J. Sport Nutr. Exerc. Metab. 2000, 10, 82–98. [Google Scholar] [CrossRef] [PubMed]
- Methenitis, S.; Mouratidis, A.; Manga, K.; Chalari, E.; Feidantsis, K.; Arnaoutis, G.; Arailoudi-Alexiadou, X.; Skepastianos, P.; Hatzitolios, A.; Mourouglakis, A.; et al. The importance of protein intake in master marathon runners. Nutrition 2021, 86, 111154. [Google Scholar] [CrossRef]
- National Health and Medical Research Council. Australian Dietary Guidelines; National Health and Medical Research Council: Canberra, Australia, 2013.
- Page, M.J.; McKenzie, J.E.; Bossuyt, P.M.; Boutron, I.; Hoffmann, T.C.; Mulrow, C.D.; Shamseer, L.; Tetzlaff, J.M.; Akl, E.A.; Brennan, S.E.; et al. The PRISMA 2020 statement: An updated guideline for reporting systematic reviews. BMJ (Br. Med. J.) 2021, 372, n71. [Google Scholar] [CrossRef]
- Beshgetoor, D.; Nichols, J.F.; Rego, I. Effect of Training Mode and Calcium Intake on Bone Mineral Density in Female Master Cyclists, Runners, and Non-Athletes. Int. J. Sport Nutr. Exerc. Metab. 2000, 10, 290–301. [Google Scholar] [CrossRef]
- Australian Bureau of Statistics. Hypertension and Measured High Blood Pressure. 2017–2018. Available online: https://www.abs.gov.au/statistics/health/health-conditions-and-risks/hypertension-and-measured-high-blood-pressure/2017-18 (accessed on 10 November 2023).
- Academy of Nutrition and Dietetics. Evidence Analysis Manual: Steps in the Academy Evidence Analysis Process. Available online: https://www.andeal.org/vault/2440/web/files/2016_April_EA_Manual.pdf (accessed on 10 October 2021).
- National Health and Medical Research Council. Micronutrients & Dietary Fibre. Available online: https://www.nrv.gov.au/node/41 (accessed on 14 November 2021).
- Volpe, S.L. Micronutrient Requirements for Athletes. Clin. Sports Med. 2007, 26, 119–130. [Google Scholar] [CrossRef]
- Australian Bureau of Statistics. Australian Health Survey: Usual Nutrient Intakes; Australian Bureau of Statistics: Sydney, NSW, Australia, 2015.
- Australian Bureau of Statistics. Arthritis and Osteoporosis. Available online: https://www.abs.gov.au/statistics/health/health-conditions-and-risks/arthritis-and-osteoporosis/2017-18 (accessed on 24 November 2023).
- Australian Bureau of Statistics. Heart, Stroke and Vascular Disease. Available online: https://www.abs.gov.au/statistics/health/health-conditions-and-risks/heart-stroke-and-vascular-disease/latest-release (accessed on 24 November 2023).
- Beshgetoor, D.; Nichols, J.F. Dietary intake and supplement use in female master cyclists and runners. Int. J. Sport Nutr. Exerc. Metab. 2003, 13, 166–172. [Google Scholar] [CrossRef]
- Condello, G.; Capranica, L.; Migliaccio, S.; Forte, R.; Di Baldassarre, A.; Pesce, C. Energy Balance and Active Lifestyle: Potential Mediators of Health and Quality of Life Perception in Aging. Nutrients 2019, 11, 2122. [Google Scholar] [CrossRef]
- Di Girolamo, F.G.; Situlin, R.; Fiotti, N.; Tence, M.; De Colle, P.; Mearelli, F.; Minetto, M.A.; Ghigo, E.; Pagani, M.; Lucini, D.; et al. A higher protein intake is associated with improved muscle strength in elite senior athletes. Nutrition 2017, 42, 82–86. [Google Scholar] [CrossRef]
- Glenn, J.M.; Gray, M.; Stewart, R.; Moyen, N.E.; Kavouras, S.A.; DiBrezzo, R.; Turner, R.; Baum, J. Incremental effects of 28 days of beta-alanine supplementation on high-intensity cycling performance and blood lactate in masters female cyclists. Amino Acids 2015, 47, 2593–2600. [Google Scholar] [CrossRef] [PubMed]
- Harrison, S.; Carbonneau, É.; Talbot, D.; Lemieux, S.; Lamarche, B. Development and validation of a dietary screener for carbohydrate intake in endurance athletes. J. Int. Soc. Sports Nutr. 2018, 15, 44. [Google Scholar] [CrossRef] [PubMed]
- Hartung, G.H.; Foreyt, J.P.; Mitchell, R.E.; Vlasek, I.; Gotto, A.M. Relation of Diet to High-Density-Lipoprotein Cholesterol in Middle-Aged Marathon Runners, Joggers, and Inactive Men. N. Engl. J. Med. 1980, 302, 357–361. [Google Scholar] [CrossRef]
- Hjerrild, J.N.; Wobbe, A.; Stausholm, M.B.; Larsen, A.E.; Josefsen, C.O.; Malmgaard-Clausen, N.M.; Dela, F.; Kjaer, M.; Magnusson, S.P.; Hansen, M.; et al. Effects of Long-Term Physical Activity and Diet on Skin Glycation and Achilles Tendon Structure. Nutrients 2019, 11, 1409. [Google Scholar] [CrossRef]
- Louis, J.; Tiollier, E.; Lamb, A.; Bontemps, B.; Areta, J.; Bernard, T. Retraining and Nutritional Strategy of an Endurance Master Athlete Following Hip Arthroplasty: A Case Study. Front. Sports Act. Living 2020, 2, 9. [Google Scholar] [CrossRef] [PubMed]
- Naclerio, F.; Seijo, M.; Larumbe-Zabala, E.; Ashrafi, N.; Christides, T.; Karsten, B.; Nielsen, B.V. Effects of Supplementation with Beef or Whey Protein Versus Carbohydrate in Master Triathletes. J. Am. Coll. Nutr. 2017, 36, 593–601. [Google Scholar] [CrossRef]
- Naclerio, F.; Larumbe-Zabala, E.; Seijo, M.; Ashrafi, N.; Nielsen, B.V.; Earnest, C.P. Effects of Protein Versus Carbohydrate Supplementation on Markers of Immune Response in Master Triathletes: A Randomized Controlled Trial. J. Am. Coll. Nutr. 2019, 38, 395–404. [Google Scholar] [CrossRef]
- Potgieter, S.; Labadarios, D.; Labuschagne, I. Body composition, dietary intake and supplement use among triathletes residing in the Western Cape. S. Afr. J. Sports Med. 2011, 23, 74. [Google Scholar] [CrossRef][Green Version]
- Ratajczak, J.; Czerniak, U.; Wieliński, D.; Ciekot-Sołtysiak, M.; Zieliński, J.; Gronek, P.; Demuth, A. Pro-Healthy Diet Properties and Its Determinants among Aging Masters Athletes. Int. J. Environ. Res. Public Health 2021, 18, 7614. [Google Scholar] [CrossRef] [PubMed]
- Shaw, K.A.; Bertrand, L.; Deprez, D.; Ko, J.; Zello, G.A.; Chilibeck, P.D. The impact of the COVID-19 pandemic on the diet, training habits and fitness of Masters cyclists. Nutr. Health 2021, 28, 669–675. [Google Scholar] [CrossRef] [PubMed]
- Sullo, A.; Brizzi, G.; Meninno, V.; Mercadante, F.; Cardinale, P. Morphofunctional modification induced by a training protocol in the elderly. Acta Med. 2004, 47, 25–28. [Google Scholar]
- Van der Avoort, C.M.; Ten Haaf, D.S.M.; De Vries, J.H.M.; Verdijk, L.B.; Van Loon, L.J.C.; Eijsvogels, T.M.H.; Hopman, M.T.E. Higher levels of physical activity are associated with greater fruit and vegetable intake in older adults. J. Nutr. Health Aging 2021, 25, 230–241. [Google Scholar] [CrossRef]
- Viner, R.T.; Harris, M.; Berning, J.R.; Meyer, N.L. Energy Availability and Dietary Patterns of Adult Male and Female Competitive Cyclists with Lower Than Expected Bone Mineral Density. Int. J. Sport Nutr. Exerc. Metab. 2015, 25, 594–602. [Google Scholar] [CrossRef] [PubMed]
- Croteau, K.A.; Eduljee, N.; Murphy, L. Global Region Comparisons in Health, Lifestyle Behaviors, and Well-Being of International Master’s World Cup Field Hockey Players: 195. Med. Sci. Sports Exerc. 2021, 53, 60. [Google Scholar] [CrossRef]
- Waldman, H.S.; Heatherly, A.J.; Killen, L.G.; Hollingsworth, A.; Koh, Y.; O’Neal, E.K. A 3-Week, Low-Carbohydrate, High-Fat Diet Improves Multiple Serum Inflammatory Markers in Endurance-Trained Males. J. Strength Cond. Res. 2020, 36, 2502–2508. [Google Scholar] [CrossRef] [PubMed]
- Mehta, K.J.; Seijo, M.; Larumbe-Zabala, E.; Ashrafi, N.; Christides, T.; Karsten, B.; Nielsen, B.V.; Naclerio, F. Case studies: Effects of beef, whey and carbohydrate supplementation in female master triathletes. J. Hum. Sport Exerc. 2019, 14, 170–184. [Google Scholar] [CrossRef]
- Croteau, K.; Eduljee, N.B.; Murphy, L. Health, lifestyle behaviours, and well-being of International Masters field hockey athletes. Int. Sports Stud. 2021, 43, 6–26. [Google Scholar] [CrossRef]
- Priego Quesada, J.I.; Kerr, Z.Y.; Bertucci, W.M.; Carpes, F.P. The categorization of amateur cyclists as research participants: Findings from an observational study. J. Sports Sci. 2018, 36, 2018–2024. [Google Scholar] [CrossRef]
- Academy of Nutrition and Dietetics; Dietitians of Canada; American College of Sports Medicine. Nutrition and Athletic Performance. Med. Sci. Sports Exerc. 2016, 48, 543–568. [Google Scholar] [CrossRef] [PubMed]
- World Health Organization; Food and Agriculture Organization of the United Nations; United Nations University. Human Energy Requirements: Report of a Joint FAO/WHO/UNU Expert Consultation: Rome, 17–24 October 2001; Food and Agriculture Organization of the United Nations: Rome, Italy, 2004. [Google Scholar]
- McKenzie, B.L.; Coyle, D.H.; Santos, J.A.; Burrows, T.; Rosewarne, E.; Peters, S.A.E.; Carcel, C.; Jaacks, L.M.; Norton, R.; Collins, C.E.; et al. Investigating sex differences in the accuracy of dietary assessment methods to measure energy intake in adults: A systematic review and meta-analysis. Am. J. Clin. Nutr. 2021, 113, 1241–1255. [Google Scholar] [CrossRef] [PubMed]
- Margo, M.; Kathryn, E.A.; David, M.B.; Louise, M.B.; Naama, C.; Anthony, C.H.; Ida Aliisa, H.; Anna, M.; Anne Marte, P.; Trent, S.; et al. 2023 International Olympic Committee’s (IOC) consensus statement on Relative Energy Deficiency in Sport (REDs). Br. J. Sports Med. 2023, 57, 1073. [Google Scholar] [CrossRef]
- Dolan, E.; Koehler, K.; Areta, J.; Longman, D.P.; Pontzer, H. Energy constraint and compensation: Insights from endurance athletes. Comp. Biochem. Physiol. Part A Mol. Integr. Physiol. 2023, 285, 111500. [Google Scholar] [CrossRef]
- Logue, D.M.; Madigan, S.M.; Heinen, M.; McDonnell, S.-J.; Delahunt, E.; Corish, C.A. Screening for risk of low energy availability in athletic and recreationally active females in Ireland. Eur. J. Sport Sci. 2019, 19, 112–122. [Google Scholar] [CrossRef]
- Janssen, I.; Heymsfield, S.B.; Wang, Z.; Ross, R. Skeletal muscle mass and distribution in 468 men and women aged 18–88 yr. J. Appl. Physiol. 2000, 89, 81–88. [Google Scholar] [CrossRef]
- Doering, T.M.; Reaburn, P.R.; Phillips, S.M.; Jenkins, D.G. Postexercise Dietary Protein Strategies to Maximize Skeletal Muscle Repair and Remodeling in Masters Endurance Athletes: A Review. Int. J. Sport Nutr. Exerc. Metab. 2016, 26, 168–178. [Google Scholar] [CrossRef]
- Khara, T.; Riedy, C.; Ruby, M.B. The Evolution of Urban Australian Meat-Eating Practices. Front. Sustain. Food Syst. 2021, 5, 624288. [Google Scholar] [CrossRef]
- Whitton, C.; Bogueva, D.; Marinova, D.; Phillips, C.J.C. Are We Approaching Peak Meat Consumption? Analysis of Meat Consumption from 2000 to 2019 in 35 Countries and Its Relationship to Gross Domestic Product. Animals 2021, 11, 3466. [Google Scholar] [CrossRef]
- Augustin, L.S.A.; Kendall, C.W.C.; Jenkins, D.J.A.; Willett, W.C.; Astrup, A.; Barclay, A.W.; Björck, I.; Brand-Miller, J.C.; Brighenti, F.; Buyken, A.E.; et al. Glycemic index, glycemic load and glycemic response: An International Scientific Consensus Summit from the International Carbohydrate Quality Consortium (ICQC). Nutr. Metab. Cardiovasc. Dis. 2015, 25, 795–815. [Google Scholar] [CrossRef]
- Chang, C.-K.; Borer, K.; Lin, P.-J. Low-Carbohydrate-High-Fat Diet: Can it Help Exercise Performance? J. Hum. Kinet. 2017, 56, 81–92. [Google Scholar] [CrossRef] [PubMed]
- Burke, L.M.; Hawley, J.A.; Wong, S.H.S.; Jeukendrup, A.E. Carbohydrates for training and competition. J. Sports Sci. 2011, 29, S17–S27. [Google Scholar] [CrossRef]
- Milman, N.T. Dietary Iron Intake in Women of Reproductive Age in Europe: A Review of 49 Studies from 29 Countries in the Period 1993–2015. J. Nutr. Metab. 2019, 2019, 7631306. [Google Scholar] [CrossRef]
- Harnett, J.; Climstein, M.; Walsh, J.; Gifford, J. The Use of Medications and Dietary Supplements by Masters Athletes—A Review. Curr. Nutr. Rep. 2022, 11, 253–262. [Google Scholar] [CrossRef]
- Myung, S.-K.; Kim, H.-B.; Lee, Y.-J.; Choi, Y.-J.; Oh, S.-W. Calcium Supplements and Risk of Cardiovascular Disease: A Meta-Analysis of Clinical Trials. Nutrients 2021, 13, 368. [Google Scholar] [CrossRef] [PubMed]
- Lindsay, H. Food demand in Australia: Trends and issues 2018. In Australian Bureau of Agricultural and Resource Economics and Sciences; Department of Agriculture, Fisheries and Forestry: Canberra, Australia, 2018. [Google Scholar]
- Burrows, T.L.; Ho, Y.Y.; Rollo, M.E.; Collins, C.E. Validity of Dietary Assessment Methods When Compared to the Method of Doubly Labeled Water: A Systematic Review in Adults. Front. Endocrinol. 2019, 10, 850. [Google Scholar] [CrossRef] [PubMed]


| First Author, Year, Reference | Study Type | Aim | Sport * | Country | Level ** | Age (Years) *** | Number (n)Gender (M/F) | Dietary Assessment Method | Quality Rating (ADA) [26] | Funding |
|---|---|---|---|---|---|---|---|---|---|---|
| Beshgetoor et al., 2000 [24] | Longitudinal (Baseline and 18MO for Ca intake) | Determine the effect of sport-specific training and Ca intake on BMD | Cycling (n = 12) Running (n = 9) | USA | Competitive | 49.6 ± 7.9 Cyclists = 48.2 ± 8.4 Runners = 50.9 ± 7.5 | n = 21 21 F | 4D FR 3 weekdays/1 weekend Validated FFQ specific for Ca | (+) | NR |
| Beshgetoor & Nichols, 2003 [32] | Cross-sectional | Compare the dietary intakes of supplementing athletes with nonsupplementing athletes | Cycling Running | USA | Competitive | 50.4 Supplementing = 52.5 ± 2.0 Non-supplementing = 48.4 ± 2.4 | n = 25 25 F Supplementing (n = 16) Non-supplementing (n = 9) | 4D FR 3 weekdays/1 weekend | (+) | NR |
| Blair et al., 1981 [11] | Cross-sectional | Compare nutrient intake in regular runners with sedentary individuals of the same age and sex | Long distance running (n = 61) | USA | NR | 35–59 | n = 61 (34 M, 27 F) | 3D FR Most diet records were obtained on running days | (Ø) | Supported in part by LRC Contract, NIH grant, and a grant from Best Foods, a Division of CPC International |
| Chatard et al., 1998 [12] | Cross-sectional | Examine the nutritional status of sportsmen and to evaluate its relationship to physical fitness | Cycling Running Swimming Tennis Walking # | France | NR | 63 ± 4.5 | n = 18 18 M | 2 × 3D weighed FR, with a 6W interval 3 consecutive weekdays (Tuesday–Thursday) | (+) | NR |
| Condello et al., 2019 [33] | Cross-sectional | Investigate the mediating effects of total energy expenditure and intake, body mass, and body image dissatisfaction on the relationship between age and perception of health and quality of life | Senior athletes n = 42 | Italy | Competitive (National/International) | 55−84 | n = 42 M & F ! | 7D FR | (+) | Ministero dell’Istruzione, dell’Università e della Ricerca |
| Croteau et al., 2021 [51] | Cross-sectional | Describe and compare health status, lifestyle behaviours, and well-being of athletes from three world regions competing in the 2018 Masters Field Hockey World Cup | Hockey | 21 countries clustered into North America (n = 138), Europe (n = 273), Asia/Pacific (n = 54) | Competitive (Masters Field Hockey and Grand Masters World Cups) | 35–76 | n = 465 180 M; 284 F; 1 O | Questionnaire on lifestyle variables related to dietary behaviours, alcohol use, sleep, sitting time, and physical activity | (+) | NR |
| Di Girolamo et al., 2017 [34] | Cross-sectional | Test the hypothesis that protein intake level is associated with muscle strength in elderly elite athletes | Cycling Running Pentathlon Fencing Weightlifting | Italy | Competitive (European Master Games 2011) | 65–81 | n = 50 (38 M, 12 F) § LPI n = 25 (19 M, 7 F) § HPI n = 25 (18 M, 6 F) § | DHx (over 1 W period) | (Ø) | A grant from the Italian Ministry of Education, University and Research |
| Glenn et al., 2015 [35] | RCT | Examine the longitudinal effects of beta-alanine on time to exhaustion, total work completed, and lactate clearance in female master athlete cyclists | Cycling | USA | Competitive | Beta-alanine = 54 ± 2 Placebo = 53 ± 1 | n = 22 22 F Beta-alanine n = 11 Placebo n = 11 | 3D FR 2 non-consecutive weekdays and 1 weekend | (+) | Powder City donated the beta-alanine |
| Hallfrisch et al., 1994 [13] | Cross-sectional | Compare the fitness, body composition, and diet intakes of older endurance-trained men and a group of healthy, but sedentary men of similar age who were matched for BMI | Running (n = 11) Bicycling (n = 5) Racquetball (n = 1) Swimming (n = 5) Race walking (n = 8) Weightlifting (n = 1) # | USA | Competitive (Senior Olympics and/or competed at national/local level) | 58–75 Athletes = 66.6 ± 1.3 | n = 16 16 M | 7D FR (athletes and controls during a normal training week) | (+) | NR |
| Harrison et al., 2018 [36] | Validation | Develop and validate a rapid and easy to use dietary screener to identify athletes who do and do not achieve a CHO intake >6 g/kg BW in the context of endurance sports | Ironman triathlon Ironman 70.3 triathlon Winter pentathlon (tandem or solo) Winter triathlon | Canada | Competitive | VALID = 37.1 ± 11.3 | n = 175 (111 M, 64 F) | Validated web-based FFQ—136 questions Food intake 1MO prior | (Ø) | A grant from Canadian Institutes of Health Research |
| Hartung et al., 1980 [37] | Cross-sectional | Investigate relationship between diet and plasma lipids and lipoprotein levels in middle-aged marathon runners, joggers, and inactive men | Marathon running (n = 59) Jogging (n = 85) | USA | Competitive (marathon runners) NR (joggers) | 35–66 Marathon = 44.4 ± 6.8 Joggers = 46.8 ± 7.6 | n = 144 144 M | FFQ—25 foods or groups of foods Asked servings (D, W, MO, Y) | (+) | NR |
| Hjerrild et al., 2019 [38] | Cross-sectional | Investigate the effect of regular long-term exercise and diet on skin autofluorescence as a measure of glycation and on Achilles tendon structure | Athletics (n = 167) Running (n = 15) | Athletes of 24 different nationalities competing at the 2017 European Masters Athletics Championships Stadia/Denmark | Competitive (2017 European Masters Athletics Championships Stadia) | Athletes = 57 ± 15 | n = 182 182 M | FFQ (over past 3MO in fixed ranges D, W) | (+) | Lundbeckfonden |
| Louis et al., 2020 [39] | Case study | Evaluate the feasibility and benefits that evidence-based nutritional and training recommendations could have on the time course of reconditioning and retraining following hip arthroplasty in an endurance master triathlete | Triathlon | UK | Competitive (70.3 Ironman age group World Championship) | 52 | n = 1 1 M | 7D FR—consecutive days Remote food photographic method | (Ø) | No |
| Mehta et al., 2019 [50] | Case study | Examine the post-workout effects of ingesting beef or whey protein extracts or CHO in female endurance athletes during a 10 W endurance training program | Triathlon | UK | NR | 40–55 | n = 6 6 F | NR | (Ø) | Crown Sports Nutrition and the University of Greenwich |
| Naclerio et al., 2017 [40] | RCT | Compare the effect of ingesting hydrolysed beef protein, whey protein, and CHO on performance, body composition, muscular thickness, and blood indices of health, including ferritin concentrations, following a 10 W intervention program | Triathlon | UK | Competitive | 35–60 Beef = 47.0 ± 8.9 Whey = 45.3 ± 8.9 CHO = 46.2 ± 7.0 | n = 24 24 M Beef n = 8 Whey n = 8 CHO n = 8 | 3D FR 2 weekday/1 weekend Baseline and during the last week of intervention | (+) | Crown Sports Nutrition and the University of Greenwich |
| Naclerio et al., 2019 [41] | RCT | Examine the long-term effects of ingesting hydrolysed beef protein versus carbohydrate on indirect markers of immunity during 10 weeks of endurance training in master aged triathletes | Triathlon | UK | Recreational | 35–60 PRO = 48 ± 8 CHO = 46 ± 6.9 | n = 16 16 M PRO n = 8 CHO n = 8 | 3D FR 2 weekday/1 weekend Baseline and during the last week of intervention | (+) | Crown Sports Nutrition and the University of Greenwich |
| Nieman et al., 1989 [14] | Cross-sectional | Compare food records from marathon runners to various standards of dietary quality | Marathon running | USA | NR | M = 40.1 ± 0.6 F = 37.8 ± 1.2 | n = 347 (291 M, 56 F) | 3D FR—consecutive days 2 weekday/1 weekend (Sunday-Tuesday) | (+) | NR |
| Potgieter et al., 2011 [42] | Cross-sectional | Determine body composition, dietary intake and supplement use among Olympic and Ironman distance triathletes residing in the Western Cape | Triathlon | South Africa | Competitive (Olympic/Ironman distance events) | M = 37.9 ± 6.8 F = 37.5 ± 9.6 | n = 26 (total study) n = 18 (reported dietary data) (9 M, 9 F) | 3D FR 2 weekday/1 weekend An additional questionnaire was completed for supplement use | (Ø) | NR |
| Ratajczak et al., 2021 [43] | Cross-sectional | Evaluate diet quality and its determinants among ageing masters athletes | Athletics | Poland | Competitive (8th World Masters Indoor Athletics Championship) | 36–65 Poland = 50.5 ± 8.3 France = 51.1 ± 9.6 Great Britain = 50.5 ± 8.7 | n = 86 86 M | FFQ (Dietary Habits and Nutrition Beliefs Questionnaire) | (Ø) | No external funding |
| Sallinen et al., 2008 [15] | Cross-sectional | Compare muscle strength and thickness, body composition and dietary intake between master strength athletes and controls | Shot-put Discus Hammer throw | Finland | Competitive (national) | Middle-aged athletes = 52.1 ± 4.7 Older athletes = 71.8 ± 3.8 | n = 17 17 M Middle-aged athletes n = 9 Older athletes n = 8 | 4D FR 3 weekday/1 weekend | (Ø) | Grant from the Ministry of Education and a contribution of Peurunka-Medical Rehabilitation Center, Finland |
| Shaw et al., 2021 [44] | Cross-sectional | Investigate how the COVID-19 pandemic impacted the diet, training and fitness of masters-level cyclists | Cycling | Canada | Recreational (as defined by Priego Quesada et al., 2018 [52]) | 46 ± 10 | n = 32 (12 M, 20 F) | FFQ (adapted for use in the Canadian population) Typical diet prior and during the COVID-19 pandemic | (Ø) | No financial support |
| Sullo et al., 2004 [45] | Longitudinal | Investigate the changes in body composition and aerobic power in a group of older athletes who practiced competitive sport for two consecutive years comparing them with a control group of subjects with similar characteristics who practiced moderate physical activity | Endurance sports (NS) (n = 20) | Italy | Competitive | 65 ± 2.6 | n = 20 20 M | 7D weighed FR—consecutive days Beginning of the study and for two consecutive years | (Ø) | NR |
| Van der Avoort et al., 2021 [46] | Cross-sectional | Establish if there is an association between habitual PA and intake of nutrient-dense foods | NS | Netherlands | NR | (PA quintiles) Q4 = 62 ± 8 Q5 = 64 ± 8 | n = 987 Q4 n = 494 (274 M, 220 F) Q5 n = 493 (304 M, 189 F) | Online validated 180-item semi-quantitative FFQ | (+) | Part of the EAT2MOVE project and supported by a grant from the Province of Gelderland |
| Van Pelt et al., 2001 [2] | Cross-sectional | Test the hypotheses that (1) RMR is lower with age in men who regularly perform endurance exercise, and (2) this age-related decline in RMR is related to declines in exercise volume and/or estimated energy intake | Running Triathlon (Active (n = 32)) | USA | Competitive | 63 ± 1 | n = 26 ^ 26 M | 4D weighed or measured FR—consecutive days 3 weekday/1 weekend | (+) | Public Health Services Research Grant 5 01 RR-00051 from the Division of Research Resources |
| Viner et al., 2015 [47] | Cross-sectional | (1) Examine EA of adult male and female competitive cyclists across the cycling training and competition season, (2) analyse eating behaviours that may contribute to LEA, and (3) compare EA of male versus female cyclists, and endurance road cyclists versus mountain bike cyclists | Cycling Road (n = 5) Mountain (n = 5) | USA | Competitive | M = 42.0 ± 7.7 F = 38.4 ± 10.3 | n = 10 (6 M, 4 F) | 3D FR per MO through one cycling season (alternating days each MO to represent all days of the week) Encouraged to use a scale or household measures to quantify food intake | (+) | NR |
| Waldman et al., 2022 [49] | Before and after | Examine the effects of a 21D low CHO, high fat diet on 30 inflammatory markers in endurance-trained, middle-aged men, before and after exposure to exercise and heat stressors | Triathlon | USA | Competitive (recreational level) | 39.5 ± 9.9 | n = 8 8 M | Dietary questionnaire with a list of common CHO rich food and beverages | (+) | NR |
| First Author, Year, Reference | Study Subgroup | Energy (kJ/Day) Mean ± SD | Protein Mean ± SD | Fat Mean ± SD | Carbohydrate Mean ± SD | Alcohol Mean ± SD | Micronutrients (mg/day) | Food or Beverage Items/Food Groups |
|---|---|---|---|---|---|---|---|---|
| Beshgetoor et al., 2000 [24] | Cyclists, Female | NR | NR | NR | NR | NR | Ca ! Baseline = 984 ± 583 | No significant differences in frequency of dairy intake between the three groups (cyclists, runners and controls). On average all three groups consumed dairy products >1 per week, but not everyday |
| Runners, Female | NR | NR | NR | NR | NR | Ca ! Baseline = 598 ± 457 | NR | |
| Beshgetoor & Nichols, 2003 [32] | Supplementing athletes, Female | 8699 ± 2628 † | 104 ± 75 g 20%E | 65 ± 39 g 28%E | 269 ± 112 g 52%E | NR | Ca = 1708 ± 127 Mg = 601 ± 58 Fe = 43 ± 8 Zn = 21 ± 2 Na = 2806 ± 980 | NR |
| Nonsupplementing athletes, Female | 8372 ± 1820 † | 84 ± 35 g 17%E | 61 ± 22 g 28%E | 277 ± 43 g 55%E | NR | Ca = 791 ±174 Mg = 366 ± 45 Fe = 25 ± 9 Zn = 13 ± 4 Na = 2897 ± 1243 | NR | |
| Blair et al., 1981 [11] | Runners, Male | 12380 † | 102 ± 30 g 14 ± 3%E | 134 ± 39 g 41 ± 7%E | 295 ± 87 g 40 ± 8%E | Average 23 g/d 6%E 83% consumers | NR | NR |
| Runners, Female | 9983 † | 82 ± 20 g 14 ± 2%E | 111 ± 44 g 41 ± 6%E | 234 ± 69 g 40 ± 7%E | 16 g/d 5%E 74% consumers | NR | NR | |
| Chatard et al., 1998 [12] | Sportsmen, Male | 11549 ± 1923 | 102 ± 12 g/d | 107 ± 18 g | 338 ± 94 g/d | NR | Ca = 960 ± 304 Mg = 353 ± 79 Fe = 18 ± 4 | NR |
| Condello et al., 2019 [33] | Senior athletes (55–84 years), Male/Female | 8208 ± 1540 † | NR | NR | NR | NR | NR | NR |
| Croteau et al., 2021 [51] | Hockey, North America | NR | NR | NR | NR | Alcoholic beverages in a week n (%) Do not consume: 29 (21) Less than 1: 22 (15.9) 1 to 2: 29 (21) 3 to 4: 27 (20) 5 to 6: 16 (12) 7 or more: 15 (11) | NR | Serves of Fruit n (%) Do not eat: 1 (1) One: 41 (30) Two: 56 (41) Three: 30 (22) Four or more: 10 (7) Serves of Vegetables n (%) Do not eat: 1 (1) One: 19 (14) Two: 53 (38) Three: 31 (23) Four or more: 18 (13) SSB consumed each day n (%) Do not consume: 57 (41) Less than one: 31 (23) One: 32 (23) Two: 12 (9) Three: 4 (3) Four or more: 2 (1) |
| Hockey, Europe | NR | NR | NR | NR | Alcoholic beverages in a week n (%) Do not consume: 43 (16) Less than 1: 42 (15) 1 to 2: 60 (22) 3 to 4: 51 (19) 5 to 6: 39 (14) 7 or more: 38 (14) | NR | Servings of Fruit n (%) Do not eat: 4 (2) One: 70 (26) Two: 92 (34) Three: 59 (22) Four or more: 26 (10) Servings of Vegetables n (%) Do not eat: 7 (3) One: 87 (32) Two: 73 (27) Three: 49 (18) Four or more: 57 (21) SSB consumed each day n (%) Do not consume: 101 (37) Less than one: 61 (22) One: 50 (18) Two: 34 (13) Three: 12 (4) Four or more: 15 (6) | |
| Hockey, Asia/Pacific | NR | NR | NR | NR | Alcoholic beverages in a week n (%) Do not consume: 14 (25.9) Less than 1: 7 (13) 1 to 2: 11 (20) 3 to 4: 8 (15) 5 to 6: 5 (9) 7 or more: 9 (17) | NR | Servings of Fruit n (%) Do not eat: 2 (4) One: 23 (46) Two: 16 (30) Three: 10 (19) Four or more: 3 (6) Servings of Vegetables n (%) Do not eat: 0 (0) One: 8 (15) Two: 10 (19) Three: 19 (35) Four or more: 10 (19) SSB consumed each day n (%) Do not consume: 23 (43) Less than one: 14 (26) One: 7 (13) Two: 3 (6) Three: 4 (7) Four or more: 3 (6) | |
| Di Girolamo et al., 2017 [34] | Elite senior athletes, low PRO intake, Male/Female | 8941 (7514–10021) †,$ | 1.2 (1.1–1.3) g/kg BW $ 16 (15–19)%E $ | 26 (22–30)%E $ | 51(48–55)%E $ | NR | NR | NR |
| Elite senior athletes, high PRO intake, Male/Female | 8485 (7268- 9820) †,$ | 1.3 (1.2–1.6) g/kg BW $ 23 (20–27)%E | 22 (20–24)%E | 49(44–53)%E | NR | NR | NR | |
| Glenn et al., 2015 [35] | Cyclists, beta-alanine, Female | 7540 ± 2126 † | 90 ± 27 g # | 69 ± 22 g # | 183 ± 62 g # | NR | NR | NR |
| Cyclists, placebo, Female | 9162 ± 1997 † | 97 ± 27 g # | 80 ± 25 # | 249 ± 68 g # | NR | NR | NR | |
| Hallfrisch et al., 1994 [13] | Endurance-trained, Male | 10297 ± 490 † | 103 ± 7 g # 17 ± 1%E 1.5 ± 0.1 g/kg BW # | 85 ± 8 g # 31 ± 2%E # | 312 ± 17 g # 50 ± 2%E # | EtOH: 9 ± 2 g # 2 ± 1%E | NR | NR |
| Harrison et al., 2018 [36] | Endurance athletes, Male/Female | NR | NR | NR | 5.4 ± 2.5 g/kg BW | NR | NR | NR |
| Hartung et al., 1980 [37] | Joggers, Male | NR | NR | NR | NR | Vodka, rum, and whiskey (45 mL): 3.3 ± 5.2 | NR | Significant dietary differences between joggers and inactive subjects for the number of portions per week for beef, veal, and pork, sausages, bacon, and sugar, jam, jelly and honey. Beef, veal, and pork (85 g): 5.2 ± 4.1 Sausages (57 g): 0.5 ± 0.8 Bacon (17 g): 1.6 ± 3.3 Cottage cheese (56 g): 1.0 ± 1.6 Sugar, jam, jelly, honey (4 g): 4.8 ± 7.3 |
| Marathon Runners, Male | NR | NR | NR | NR | Vodka, rum, and whiskey (45 mL): 1.20 ± 2.81 | NR | Significant dietary differences between marathon runners and inactive subjects for the number of portions per week for beef, veal, and pork, sausages, bacon, and cottage cheese. Beef, veal, and pork (85 g): 5.6 ± 4.9 Sausages (57 g): 0.5 ± 0.7 Bacon (17 g): 1.4 ± 2.2 Cottage cheese (56 g): 1.6 ± 3.4 Sugar, jam, jelly, honey (4 g): 6.9 ± 10.3 | |
| Hjerrild et al., 2019 [38] | Athletes, Male | NR | NR | NR | NR | Mean weekly dietary intake Wine (glasses) 4.2 ± 8.0 Beer (bottles) 2.6 ± 5.8 Liquors/spirits (drinks) 0.4 ± 2.2 | NR | Mean weekly dietary intake. Fruit (pieces): 15.3 ± 9.8 Vegetables (100 g portions): 13.5 ± 8.7 Fish (100 g portions): 2.1 ± 3.4 Rye or wholegrain bread (slices): 16 ± 12 Oat or wholegrain cereals (1 dL servings): 5.7 ± 5.9 “Western” diet currently (%):28 ± 21 “Western” diet prior to 18 years (%): 44 ± 25 Coffee (cups/week): 16 ± 12 |
| Louis et al., 2020 [39] | Triathlete, Male | NR | 1.7 ± 0.5 g/kg BW 16 ± 3%E | 2.0 ± 0.8 g/kg BW 40 ± 9%E | 4.5 ± 0.8 g/kg BW 43 ± 7%E | NR | NR | NR |
| Mehta et al., 2019 [50] | Triathlete, Beef, Female | 5073 † | 1.3 g/kg/BW | 1.1 g/kg BW | 3.5 g/kg BW | NR | Fe: 11 Non-Heme: 8 Heme: 3 | NR |
| Triathlete, Beef, Female | 6286 † | 1.3/kg/BW | 0.9 g/kg BW | 4.0 g/kg BW | NR | Fe: 13 Non-Heme: 10 Heme: 3 | NR | |
| Triathlete, Whey, Female | 6317 † | 1.3/kg/BW | 0.7 g/kg BW | 3.9 g/kg BW | NR | Fe: 12 Non-Heme: 8 Heme: 3 | NR | |
| Triathlete, Whey, Female | 6317 † | 1.3/kg/BW | 1.2 g/kg BW | 4.1 g/kg BW | NR | Fe: 10 Non-Heme: 7 Heme: 3 | NR | |
| Triathlete, Carbohydrate, Female | 5483 † | 1.3/kg/BW | 0.8 g/kg BW | 4.0 g/kg BW | NR | Fe: 7 Non-Heme: 6 Heme: 1 | NR | |
| Triathlete, Carbohydrate, Female | 6489 † | 1.3/kg/BW | 1.1 g/kg BW | 4.1 g/kg BW | NR | Fe: 12 Non-Heme: 9 Heme: 3 | NR | |
| Naclerio et al., 2017 [40] | Triathletes, beef supplementation, Male | NR | 1.3 ± 0.3g/kg BW | 1.1 ± 0.3 g/kg BW | 3.4 ± 1.2 g/kg BW | NR | Fe: 12 ± 4 | NR |
| Triathletes, whey supplementation, Male | NR | 1.5 ± 0.6 g/kg BW | 1.4 ± 0.4 g/kg BW | 3.5 ± 1.6 g/kg BW | NR | Fe: 15 ± 9 | NR | |
| Triathletes, CHO, Male | NR | 1.3 ± 0.2 g/kg BW | 1.4 ± 0.8 g/kg BW | 3.0 ± 1.2 g/kg BW | NR | Fe: 14 ± 3 | NR | |
| Naclerio et al., 2019 [41] | Triathletes, PRO group, Male | NR | 1.3 ± 0.3 g/kg BW | 1.1 ± 0.3 g/kg BW | 3.4 ± 1.2 g/kg BW | NR | NR | NR |
| Triathletes, CHO group, Male | NR | 1.4 ± 0.2 g/kg BW | 1.4 ± 0.8 g/kg BW | 3.0 ± 1.2 g/kg BW | NR | NR | NR | |
| Nieman et al., 1989 [14] | Marathon Runners, Male | 10,569 ± 180 † | 105 ± 2 g # 1.4 ± 0.0 g/kg BW 17%E | 87 ± 2 g # 31%E | 327 ± 7 g # 52%E | NR | Ca: 1034 ± 28 # Mg: 386 ± 10 # Fe: 20 ± 1 # Zn: 12 ± 0.4 # Na: 3303 ± 81 # | Runners were asked to estimate the kind of changes made in their diets after they began regular running. More than 75% of the runners reported somewhat or definitely higher intakes of fruits, vegetables, whole grains, poultry, and fish and lower intakes of red meat, eggs, salt, and fats |
| Marathon Runners, Female | 7819 ± 339 † | 74 ± 5 g/d # 1.3 ± 0.1 g/kg BW 16%E | 66 ± 5 g/d # 32%E | 246 ± 11 g/d # 53%E | NR | Ca: 797 ± 53 # Mg: 299 ± 16 # Fe: 14 ± 1 # Zn: 8 ± 1 # Na: 2583 ± 149 # | NR | |
| Potgieter et al., 2011 [42] | Triathletes, Male | 14,535 ± 4510 | 2.0 ± 0.5 g/kg BW | 35.0 ± 10%E | 5.3 ± 1.9 g/kg BW | NR | NR | NR |
| Triathletes, Female | 9004 ± 369 | 1.2 ± 0.2 g/kg BW | 30.0 ± 6.0%E | 3.5 ± 1.0 g/kg BW | NR | NS ^ | NR | |
| Ratajczak et al., 2021 [43] | Athletics, Poland, Male | NR | NR | NR | NR | NR | NR | Median values Diet quality 25.5 Median consumption frequency Number of meals daily 4.0 Wholemeal bread 0.1 Grains and groats 0.1 Milk 0.5 Fermented milk beverages 0.5 Curd 0.1 White meat 0.5 Fish 0.1 Legumes 0.1 Fruits 1.0 Vegetables 1.0 |
| Athletics, France, Male | NR | NR | NR | NR | NR | NR | Median values Diet quality 29.8 Median consumption frequency Number of meals daily 4.0 Wholemeal bread 0.5 Grains and groats 0.5 Milk 0.1 Fermented milk beverages 0.3 Curd 0.3 White meat 0.5 Fish 0.5 Legumes 0.1 Fruits 2.0 Vegetables 2.0 | |
| Athletics, Great Britain, Male | NR | NR | NR | NR | NR | NR | Median values Diet quality 31.0 Median consumption frequency Number of meals daily 3.0 Wholemeal bread 0.5 Grains and groats 0.1 Milk 0.1 Fermented milk beverages 0.5 Curd 0.1 White meat 0.5 Fish 0.1 Legumes 0.1 Fruits 1.0 Vegetables 2.0 | |
| Sallinen et al., 2008 [15] | Middle-aged Athletes, Male | 11,000 ± 1300 | 1.2 ± 0.3 g/kg BW 18 ± 2%E | 1.1 ± 0.3 g/kg BW 36 ± 5%E | 3.0 ± 0.8 g/kg BW 43 ± 6%E | NR | NR | NR |
| Older Athletes, Male | 9300 ± 1200 | 1.0 ± 0.3 g/kg BW 16 ± 4%E | 1.0 ± 0.3 g/kg BW 33 ± 5%E | 3.2 ± 0.6 g/kg BW 51 ± 7%E | NR | NR | NR | |
| Shaw et al., 2021 [44] | Cyclists, Male | 11,728 ± 2736 † | 131 ± 51 g | 105 ± 35 g | 350 ± 91 g | 3.2 ± 4.6 g | Ca: 1539 ± 778 Fe: 24 ± 7 Zn: 21 ± 16 Na: 3831 ± 1209 | Caffeine: 155 ± 127 mg |
| Cyclists, Female | 9021 ± 2410 † | 104 ± 31 g | 68 ± 22 g | 292 ± 95 g | 4.0 ± 5.5 g | Ca: 1815 ± 862 Fe: 33 ± 19 Zn: 18 ± 9 Na: 3283 ± 966 | Caffeine: 302 ± 157 mg | |
| Sullo et al., 2004 [45] | Endurance sports, baseline, Male | 6686 ± 523 † | 57 ± 6 g # 15 ± 2%E | 54 ± 7 g # 31±2%E | 221 ± 31 g # 56 ± 1%E | NR | NR | NR |
| Van der Avoort et al., 2021 [46] | Active, Q4, Male/Female | 9297 ± 3075 † | NR | NR | NR | 14 ± 14 g | NR | Fruit and vegetable intake Overall: 363 ± 175 g/day Fruit intake: 125 ± 124 g/day (0.8/serves) Vegetable intake: 168 ± 95 g/day (2.2/serves) % meeting guidelines = 38% |
| Active, Male, Q4 | 10,092 ± 3167 † | NR | NR | NR | NR | NR | NR | |
| Active, Female, Q4 | 8301 ± 2636 † | NR | NR | NR | NR | NR | NR | |
| Active, Q5, Male/Female | 9029 ± 2833 † | NR | NR | NR | 13 ± 13 g | NR | Fruit and vegetable intake Overall: 386 ± 213 g/day Fruit intake: 210 ± 142 g/day (1.4 serves) Vegetable intake: 177 ± 121 g/day (2.4/serves) % meeting guidelines 41% | |
| Active, Male, Q5 | 10,096 ± 2996 † | NR | NR | NR | NR | NR | NR | |
| Active, Female, Q5 | 8427 ± 2807 † | NR | NR | NR | NR | NR | NR | |
| Van Pelt et al., 2001 [2] | Physically active, Male | 10,326 ± 377 † | 1.2 ± 0.1 g/kg BW # 13%E | 9.0 ± 0.6 g/kg BW # 27%E | 4.7 ± 0.2 g/kg BW # 58%E | 226 ± 54 † (2%) kJ/day | NR | NR |
| Viner et al., 2015 [47] | Cyclists, Male/Female | 8715 ± 649 † | 94 ± 29 g 1.4 ± 0.4 g/kg BW | 72 ± 19 g 1.1 ± 0.3 g/kg BW | 267 ± 84 g 3.9 ± 1.2 g/kg BW | NR | Ca: 1400–1900 | NR |
| Cyclists, Male | 9669 ± 2029 † | 106 ± 30 g 1.5 ± 0.4 g/kg BW | 78 ± 21 g 1.1 ± 0.3 g/kg BW | 296 ± 94 g 4.1 ± 1.3 g/kg BW | NR | NR | NR | |
| Cyclists, Female | 7284 ± 1109 † | 77 ± 15 g 1.3 ± 0.4 g/kg BW | 61 ± 7 g 1.0 ± 0.3 g/kg BW | 223 ± 43 g 3.7 ± 1.2 g/kg BW | NR | NR | NR | |
| Waldman et al., 2022 [49] | Triathlete, Habitual Diet, Male | 11,799 ± 3996† | 103 g ± 47 g 1.3 ± 0.6 g/kg/BW 15 ± 20%E # | 116 ± 29 g 1.4 ± 0.4 g/kg/BW 37 ± 27%E # | 336 ± 145 g 4.1 ± 1.8 g/kg/BW 48 ± 61%E # | NR | NR | NR |
| Nutrient | Averages of All Studies 35–50 Years | Averages of All Studies > 50 Years | Percentage Difference (%) † | ||||||
|---|---|---|---|---|---|---|---|---|---|
| Combined | Male | Female | Combined | Male | Female | Combined | Male | Female | |
| Energy (kJ/day) | 9073 | 11,780 | 7485 | 8902 | 9919 | 7819 | 2 | 17 | −4 |
| Macronutrients | |||||||||
| Protein | |||||||||
| g/day | 97 | 109 | 84 | 92 | 87 | 97 | 5 | 22 | −14 |
| g/kg | 1.4 | 1.4 | 1.3 | 1.3 | 1.3 | 1.3 | 7 | 7 | 0 |
| %E | 16 | 15 | 16 | 17 | 16 | 20 | -6 | −6 | −22 |
| Fat | |||||||||
| g/day | 87 | 104 | 73 | 77 | 82 | 71 | 12 | 24 | 3 |
| g/kg | 1.2 | 1.3 | 1.0 | 2.5 | 3.3 | 0.8 | −70 | −87 | 22 |
| %E | 34 | 36 | 33 | 30 | 33 | 28 | 13 | 9 | 16 |
| Carbohydrate | |||||||||
| g/day | 286 | 321 | 254 | 262 | 290 | 234 | 9 | 10 | 8 |
| g/kg | 3.9 | 3.7 | 3.8 | 3.9 | 3.9 | 4 | 0 | −5 | −5 |
| %E | 48 | 47 | 49 | 50 | 50 | 52 | −4 | −6 | −6 |
| Alcohol | |||||||||
| g/day | 12 | 13 | 10 | 66 | 118 | NR | −138 | −160 | - |
| %E | 6 | 6 | 5 | 2 | 2 | NR | 100 | 100 | - |
| Micronutrients (mg/day) | |||||||||
| Calcium | 1230 | 1287 | 1097 | 1089 | 960 | 1153 | 12 | 29 | −5 |
| Magnesium | 350 | 386 | 333 | 477 | 353 | 601 | −31 | 9 | −57 |
| Iron | 17 | 17 | 24 | 31 | 18 | 43 | −58 | −6 | −57 |
| Zinc | 14 | 17 | 13 | 21 | NR | 21 | −40 | - | −47 |
| Sodium | 3179 | 3567 | 2921 | 2806 | NR | 2806 | 12 | - | 4 |
| Nutrient | Averages of All Studies 35–50 Years | Australian Health Survey 2011–2012 | Percentage Difference (%) † | ||||||
|---|---|---|---|---|---|---|---|---|---|
| Combined | Male | Female | Combined | Male | Female | Combined | Male | Female | |
| Energy (kJ/day) | 9073 | 11,780 | 7485 | 8872 | 10,220 | 7540 | 2 | 14 | −1 |
| Macronutrients | |||||||||
| Protein | |||||||||
| g/day | 97 | 109 | 84 | 94 | 108 | 80 | 3 | 1 | 5 |
| g/kg | 1.4 | 1.4 | 1.3 | NR | NR | NR | - | - | - |
| %E | 16 | 15 | 16 | 18 | 18 | 19 | −12 | −18 | −17 |
| Fat | |||||||||
| g/day | 87 | 104 | 73 | 76 | 86 | 65 | 13 | 19 | 12 |
| g/kg | 1.2 | 1.3 | 1.0 | NR | NR | NR | - | - | - |
| %E | 34 | 36 | 33 | 31 | 31 | 31 | 9 | 15 | 6 |
| Carbohydrate | |||||||||
| g/day | 286 | 321 | 254 | 230 | 264 | 197 | 22 | 19 | 25 |
| g/kg | 3.9 | 3.7 | 3.8 | NR | NR | NR | - | - | - |
| %E | 48 | 47 | 49 | 43 | 43 | 44 | 11 | 9 | 11 |
| Alcohol | |||||||||
| g/day | 12 | 13 | 10 | 15 | 20 | 10 | −22 | −42 | 0 |
| %E | 6 | 6 | 5 | 4 | 5 | 4 | 40 | 18 | 22 |
| Micronutrients (mg/day) | |||||||||
| Calcium | 1230 | 1287 | 1097 | 834 | 911 | 758 | 38 | 34 | 37 |
| Magnesium | 350 | 386 | 333 | 351 | 393 | 309 | 0 | −2 | 7 |
| Iron | 17 | 17 | 24 | 11 | 13 | 10 | 43 | 27 | 82 |
| Zinc | 14 | 17 | 13 | 11 | 13 | 9 | 24 | 27 | 36 |
| Sodium | 3179 | 3567 | 2921 | 2533 | 2915 | 2154 | 23 | 20 | 30 |
| Nutrient | Averages of All Studies > 50 Years | Australian Health Survey 2011–2012 | Percentage Difference (%) † | ||||||
|---|---|---|---|---|---|---|---|---|---|
| Combined | Male | Female | Combined | Male | Female | Combined | Male | Female | |
| Energy (kJ/day) | 8902 | 9919 | 7819 | 7792 | 8759 | 6919 | 13 | 12 | 12 |
| Macronutrients | |||||||||
| Protein | |||||||||
| g/day | 92 | 87 | 97 | 82 | 90 | 75 | 11 | −3 | 26 |
| g/kg | 1.3 | 1.3 | 1.3 | NR | NR | NR | - | - | - |
| %E | 17 | 16 | 20 | 19 | 18 | 19 | −11 | −12 | 5 |
| Fat | |||||||||
| g/day | 77 | 82 | 71 | 66 | 73 | 59 | 15 | 12 | 18 |
| g/kg | 2.5 | 3.3 | 0.8 | NR | NR | NR | - | - | - |
| %E | 30 | 33 | 28 | 31 | 30 | 31 | −3 | 10 | −10 |
| Carbohydrate | |||||||||
| g/day | 262 | 290 | 234 | 201 | 227 | 178 | 26 | 24 | 27 |
| g/kg | 3.9 | 3.9 | 4.0 | NR | NR | NR | - | - | - |
| %E | 50 | 50 | 52 | 43 | 43 | 43 | 15 | 15 | 19 |
| Alcohol | |||||||||
| g/day | 66 | 118 | NR | 14 | 18 | 11 | 130 | 147 | - |
| %E | 2 | 2 | NR | 5 | 6 | 4 | −86 | −100 | - |
| Micronutrients (mg/day) | |||||||||
| Calcium | 1089 | 960 | 1153 | 729 | 754 | 707 | 40 | 24 | 48 |
| Magnesium | 477 | 353 | 601 | 315 | 340 | 292 | 41 | 4 | 69 |
| Iron | 31 | 18 | 43 | 11 | 12 | 10 | 95 | 40 | 125 |
| Zinc | 21 | NR | 21 | 10 | 11 | 9 | 71 | - | 80 |
| Sodium | 2806 | NR | 2806 | 2105 | 2363 | 1872 | 29 | - | 40 |
Disclaimer/Publisher’s Note: The statements, opinions and data contained in all publications are solely those of the individual author(s) and contributor(s) and not of MDPI and/or the editor(s). MDPI and/or the editor(s) disclaim responsibility for any injury to people or property resulting from any ideas, methods, instructions or products referred to in the content. |
© 2023 by the authors. Licensee MDPI, Basel, Switzerland. This article is an open access article distributed under the terms and conditions of the Creative Commons Attribution (CC BY) license (https://creativecommons.org/licenses/by/4.0/).
Share and Cite
Guo, S.; Shaoni, G.L.L.; Stuart-Smith, W.A.; Davies, A.J.; Gifford, J.A. Dietary Intake of Masters Athletes: A Systematic Review. Nutrients 2023, 15, 4973. https://doi.org/10.3390/nu15234973
Guo S, Shaoni GLL, Stuart-Smith WA, Davies AJ, Gifford JA. Dietary Intake of Masters Athletes: A Systematic Review. Nutrients. 2023; 15(23):4973. https://doi.org/10.3390/nu15234973
Chicago/Turabian StyleGuo, Sheran, Gabriella L. L. Shaoni, Wendy A. Stuart-Smith, Alyse J. Davies, and Janelle A. Gifford. 2023. "Dietary Intake of Masters Athletes: A Systematic Review" Nutrients 15, no. 23: 4973. https://doi.org/10.3390/nu15234973
APA StyleGuo, S., Shaoni, G. L. L., Stuart-Smith, W. A., Davies, A. J., & Gifford, J. A. (2023). Dietary Intake of Masters Athletes: A Systematic Review. Nutrients, 15(23), 4973. https://doi.org/10.3390/nu15234973