
Changes in Plasma Carotenoid Concentrations during the AntioxObesity Weight Reduction Program among Adults with Excessive Body Weight


Abstract
:
1. Introduction
2. Materials and Methods
2.1. Ethics Approval
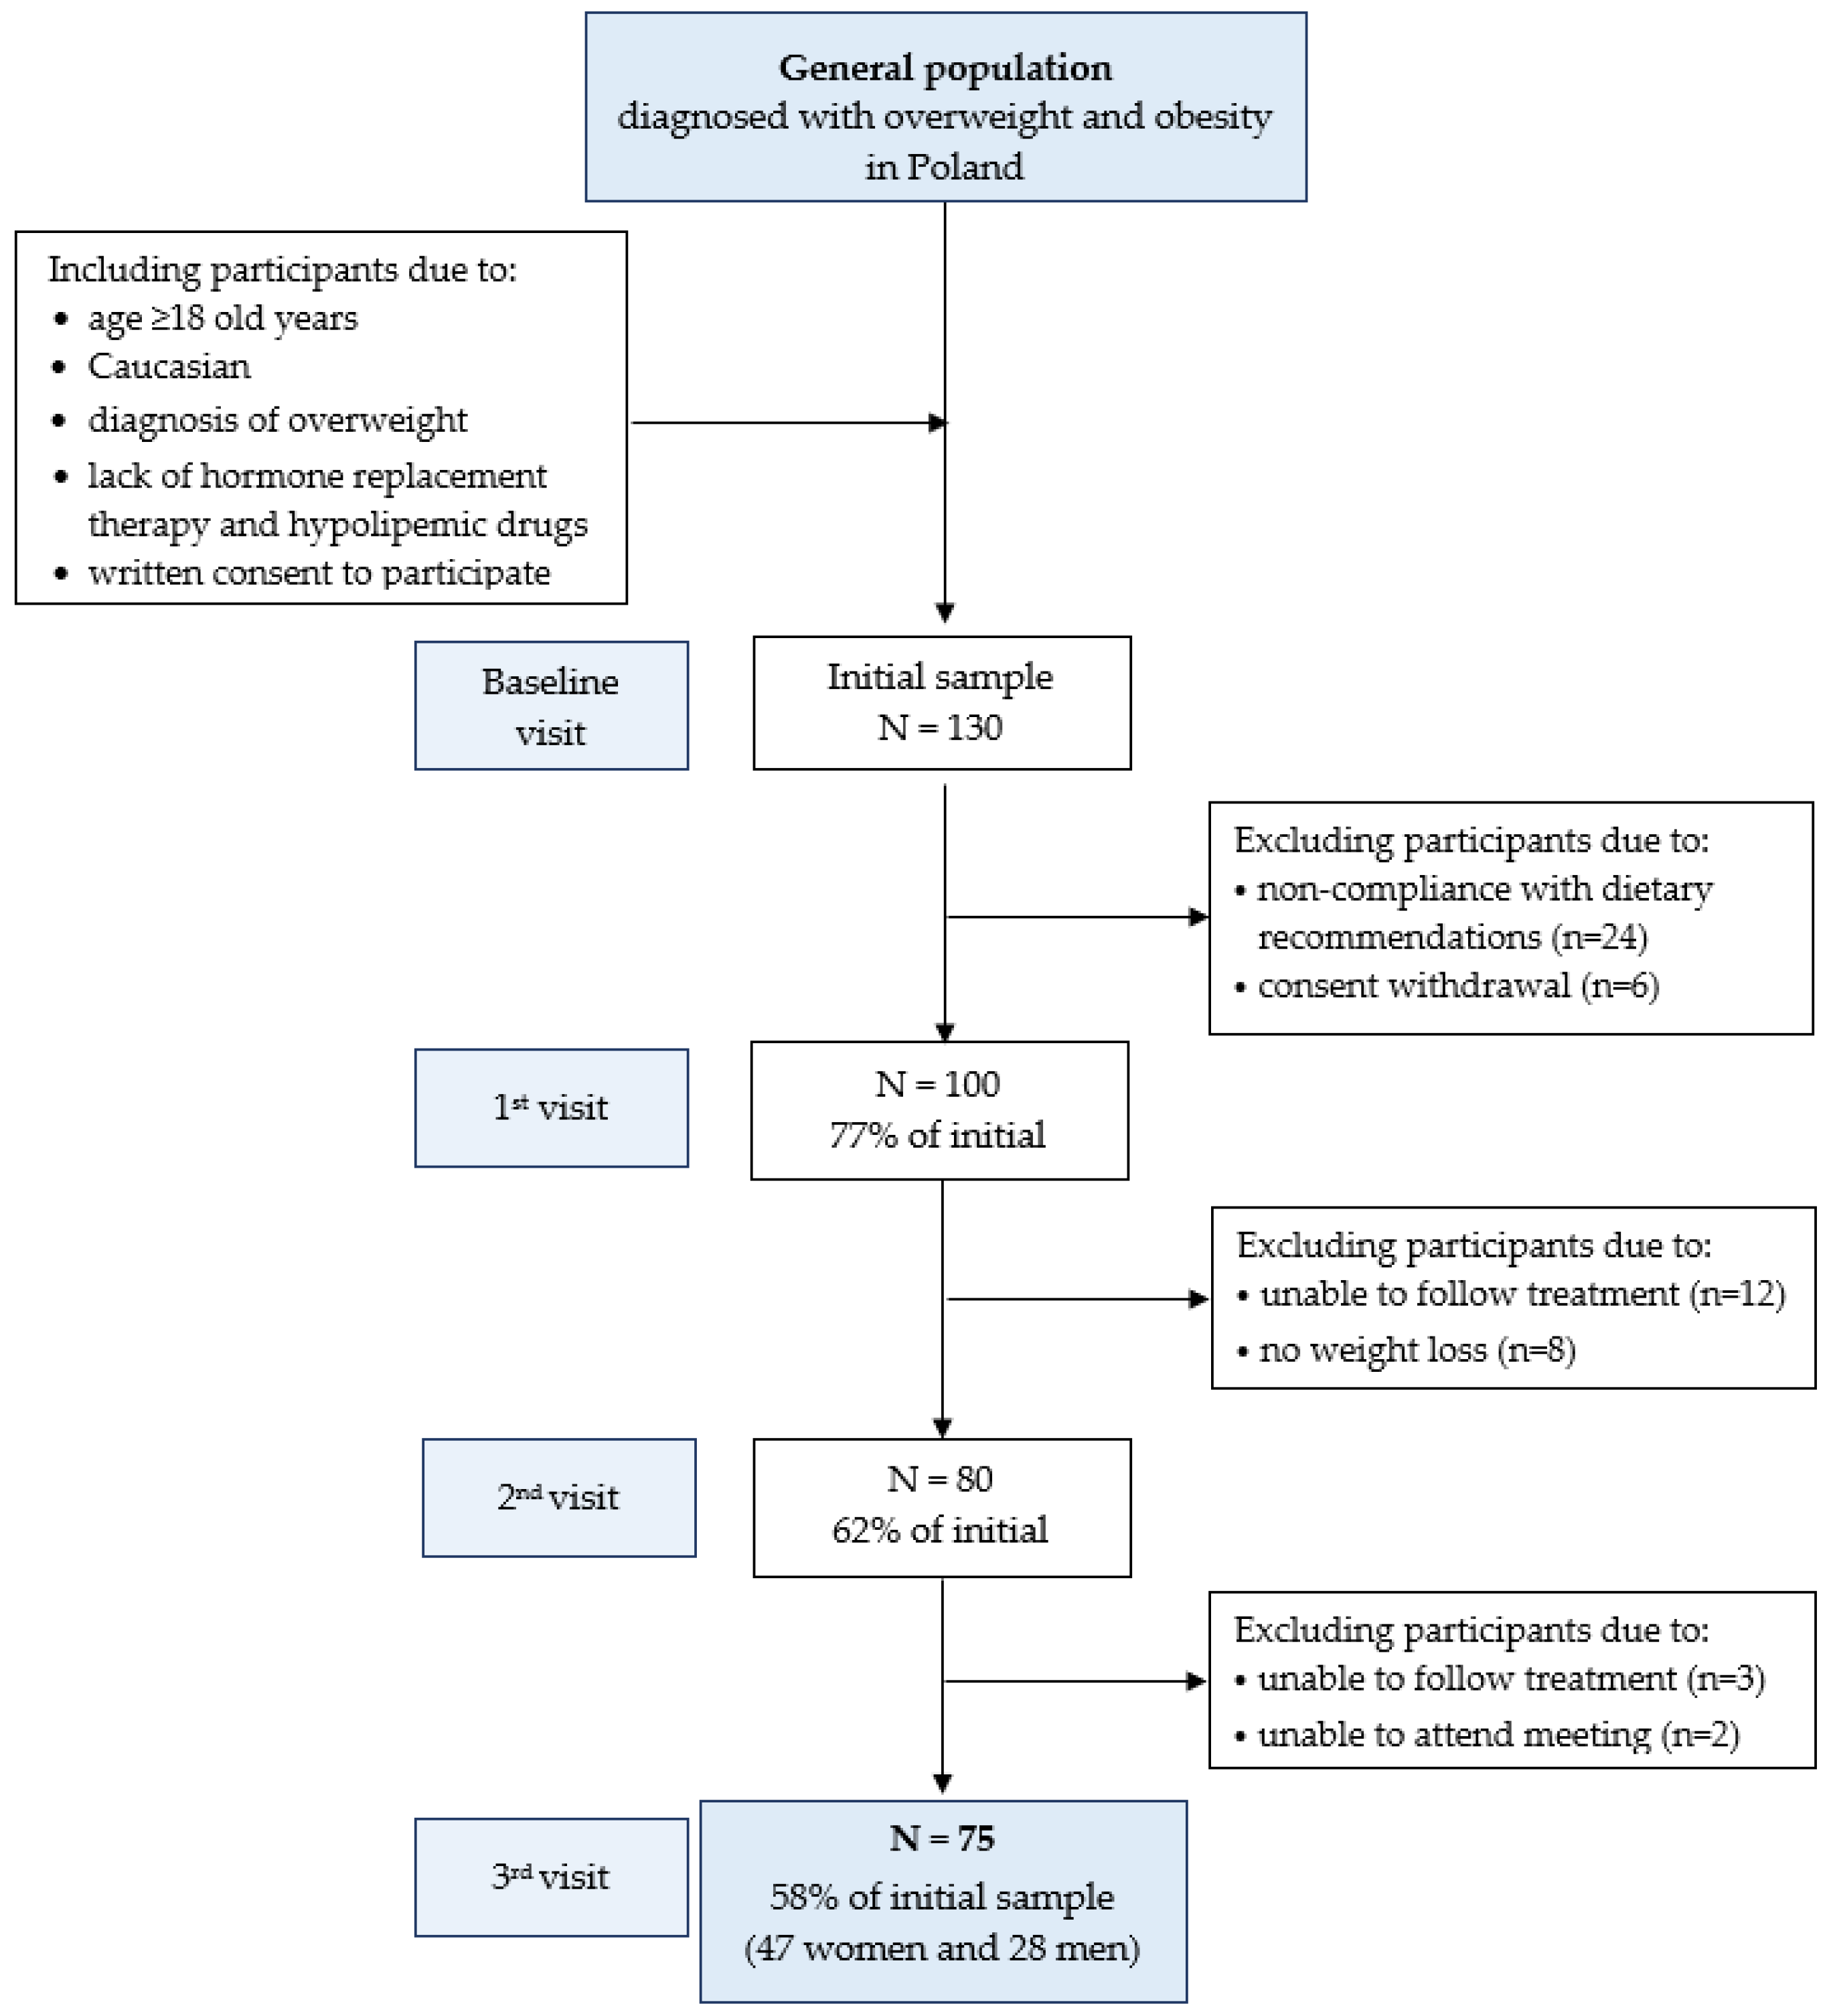
2.2. Study Design and Participants
2.2.1. AntioxObesity Program
2.2.2. Compliance with Dietary Treatment
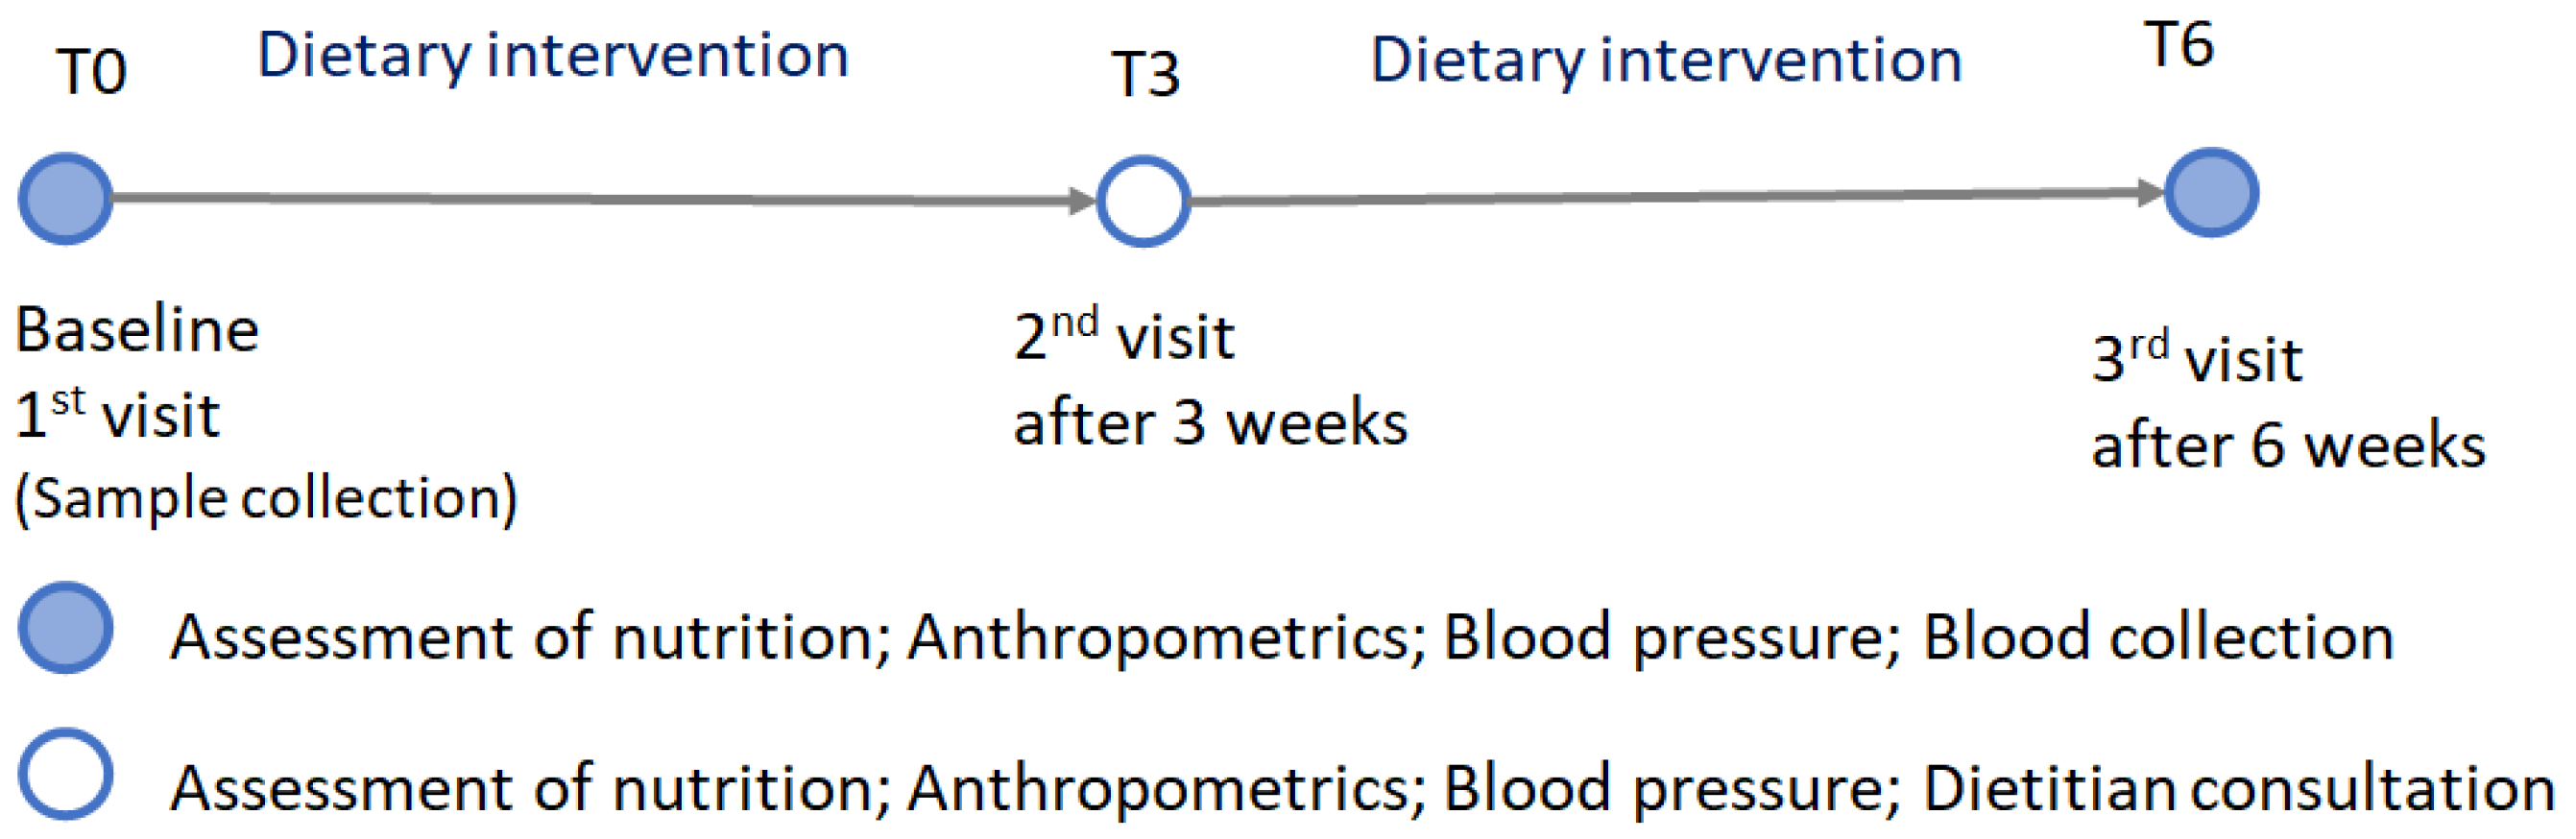
2.3. Data Collection and Procedures
2.3.1. Dietary Assessment
2.3.2. Anthropometry Measurements
2.3.3. Blood Samples and Biochemical Analyses
2.4. Statistical Analysis
3. Results
4. Discussion
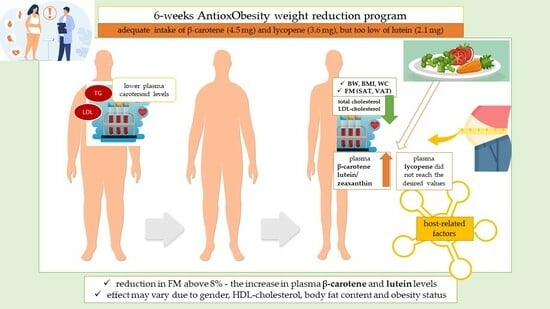
5. Conclusions
Author Contributions
Funding
Institutional Review Board Statement
Informed Consent Statement
Data Availability Statement
Acknowledgments
Conflicts of Interest
References
- Zhang, X.; Ha, S.; Lau, H.C.; Yu, J. Excess body weight: Novel insights into its roles in obesity comorbidities. Semin. Cancer Biol. 2023, 92, 16–27. [Google Scholar] [CrossRef]
- Keaver, L.; Webber, L.; Dee, A.; Shiely, F.; Marsh, T.; Balanda, K.; Perry, I.J. Application of the UK foresight obesity model in Ireland: The health and economic consequences of projected obesity trends in Ireland. PLoS ONE 2013, 8, e79827. [Google Scholar] [CrossRef]
- Calder, P.C.; Ahluwalia, N.; Brouns, F.; Buetler, T.; Clement, K.; Cunningham, K.; Esposito, K.; Jönsson, L.S.; Kolb, H.; Lansink, M.; et al. Dietary factors and low-grade inflammation in relation to overweight and obesity. Br. J. Nutr. 2011, 106 (Suppl. S3), S5–S78. [Google Scholar] [CrossRef] [PubMed]
- Kawai, T.; Autieri, M.V.; Scalia, R. Adipose tissue inflammation and metabolic dysfunction in obesity. Am. J. Physiol. Cell Physiol. 2021, 320, C375–C391. [Google Scholar] [CrossRef] [PubMed]
- Thomas-Valdés, S.; Tostes, M.D.G.V.; Anunciação, P.C.; da Silva, B.P.; Sant’Ana, H.M.P. Association between vitamin deficiency and metabolic disorders related to obesity. Crit. Rev. Food Sci. Nutr. 2017, 57, 3332–3343. [Google Scholar] [CrossRef] [PubMed]
- Bohn, T. Carotenoids and Markers of Oxidative Stress in Human Observational Studies and Intervention Trials: Implications for Chronic Diseases. Antioxidants 2019, 8, 179. [Google Scholar] [CrossRef]
- Dias, M.; Camões, M.; Oliveira, L. Carotenoids in traditional Portuguese fruits and vegetables. Food Chem. 2009, 113, 808–815. [Google Scholar] [CrossRef]
- Perry, A.; Rasmussen, H.; Johnson, E.J. Xanthophyll (lutein, zeaxanthin) content in fruits, vegetables and corn and egg products. J. Food Compost. Anal. 2009, 22, 9–15. [Google Scholar] [CrossRef]
- Abdel-Aal, E.-S.M.; Akhtar, H.; Zaheer, K.; Ali, R. Dietary sources of lutein and zeaxanthin carotenoids and their role in eye health. Nutrients 2013, 5, 1169–1185. [Google Scholar] [CrossRef]
- Rodriguez-Concepcion, M.; Avalos, J.; Bonet, M.L.; Boronat, A.; Gomez-Gomez, L.; Hornero-Mendez, D.; Limón, C.; Meléndez-Martinez, A.J.; Olmedilla-Alonso, B.; Palou, A.; et al. A global perspective on carotenoids: Metabolism, biotechnology, and benefits for nutrition and health. Prog. Lipid Res. 2018, 70, 62–93. [Google Scholar] [CrossRef]
- Reboul, E. Absorption of vitamin A and carotenoids by the enterocyte: Focus on transport proteins. Nutrients 2013, 5, 3563–3581. [Google Scholar] [CrossRef]
- Moran, N.E.; Mohn, E.S.; Hason, N.; Erdman, J.W., Jr.; Johnson, E.J. Intrinsic and Extrinsic Factors Impacting Absorption, Metabolism, and Health Effects of Dietary Carotenoids. Adv. Nutr. 2018, 9, 465–492. [Google Scholar] [CrossRef]
- Kurniawan, R.; Nurkolis, F.; Taslim, N.A.; Subali, D.; Surya, R.; Gunawan, W.B.; Alisaputra, D.; Mayulu, N.; Salindeho, N.; Kim, B. Carotenoids Composition of Green Algae Caulerpa racemosa and Their Antidiabetic, Anti-Obesity, Antioxidant, and Anti-Inflammatory Properties. Molecules 2023, 28, 3267. [Google Scholar] [CrossRef] [PubMed]
- Nurkolis, F.; Taslim, N.A.; Hardinsyah, H. The importance of lutein-plant based nanoencapsulation studies—An effort to improve clinical studies on the stability and bioaccessibility of lutein for health vision. Clin. Nutr. ESPEN 2023, 56, 81–82. [Google Scholar] [CrossRef] [PubMed]
- Ribaya-Mercado, J.D. Influence of dietary fat on beta-carotene absorption and bioconversion into vitamin A. Nutr. Rev. 2002, 60, 104–110. [Google Scholar] [CrossRef]
- Britton, G.; Khachik, F. Carotenoids in Food. In Carotenoids; Britton, G., Pfander, H., Liaaen-Jensen, S., Eds.; Birkhäuser: Basel, Switzerland, 2009; Volume 5, pp. 45–66. [Google Scholar] [CrossRef]
- Krinsky, N.I.; Johnson, E.J. Carotenoid actions and their relation to health and disease. Mol. Asp. Med. 2005, 26, 459–516. [Google Scholar] [CrossRef] [PubMed]
- Thomas, S.E.; Johnson, E.J. Xanthophylls. Adv. Nutr. 2018, 9, 160–162. [Google Scholar] [CrossRef]
- Umbreen, H.; Javid, M.; Riaz, M. Metabolism of Carotenoids. In Carotenoids: Structure and Function in the Human Body; Zia-Ul-Haq, M., Dewanjee, S., Riaz, M., Eds.; Springer: Cham, Switzerland, 2021; pp. 421–446. [Google Scholar] [CrossRef]
- Bohn, T.; Bonet, M.L.; Borel, P.; Keijer, J.; Landrier, J.F.; Milisav, I.; Ribot, J.; Riso, P.; Winklhofer-Roob, B.; Sharoni, Y.; et al. Mechanistic aspects of carotenoid health benefits—Where are we now? Nutr. Res. Rev. 2021, 34, 276–302. [Google Scholar] [CrossRef]
- Broekmans, W.M.; Berendschot, T.T.; Klopping-Ketelaars, I.A.; de Vries, A.J.; Goldbohm, R.A.; Tijburg, L.B.; Kardinaal, A.F.; van Poppel, G. Macular pigment density in relation to serum and adipose tissue concentrations of lutein and serum concentrations of zeaxanthin. Am. J. Clin. Nutr. 2002, 76, 595–603. [Google Scholar] [CrossRef]
- Chung, H.-Y.; Ferreira, A.L.A.; Epstein, S.; Paiva, S.A.R.; Castaneda-Sceppa, C.; Johnson, E.J. Site-specific concentrations of carotenoids in adipose tissue: Relations with dietary and serum carotenoid concentrations in healthy adults. Am. J. Clin. Nutr. 2009, 90, 533–539. [Google Scholar] [CrossRef]
- Mounien, L.; Tourniaire, F.; Landrier, J.F. Anti-Obesity Effect of Carotenoids: Direct Impact on Adipose Tissue and Adipose Tissue-Driven Indirect Effects. Nutrients 2019, 11, 1562. [Google Scholar] [CrossRef] [PubMed]
- Östh, M.; Öst, A.; Kjolhede, P.; Strålfors, P. The concentration of β-carotene in human adipocytes, but not the whole-body adipocyte stores, is reduced in obesity. PLoS ONE 2014, 9, e85610. [Google Scholar] [CrossRef] [PubMed]
- Sy, C.; Gleize, B.; Dangles, O.; Landrier, J.F.; Veyrat, C.C.; Borel, P. Effects of physicochemical properties of carotenoids on their bioaccessibility, intestinal cell uptake, and blood and tissue concentrations. Mol. Nutr. Food Res. 2012, 56, 1385–1397. [Google Scholar] [CrossRef]
- Jomova, K.; Valko, M. Health protective effects of carotenoids and their interactions with other biological antioxidants. Eur. J. Med. Chem. 2013, 70, 102–110. [Google Scholar] [CrossRef]
- Fiedor, J.; Burda, K. Potential role of carotenoids as antioxidants in human health and disease. Nutrients 2014, 6, 466–488. [Google Scholar] [CrossRef]
- Bonet, M.L.; Canas, J.A.; Ribot, J.; Palou, A. Carotenoids and their conversion products in the control of adipocyte function, adiposity and obesity. Arch. Biochem. Biophys. 2015, 572, 112–125. [Google Scholar] [CrossRef]
- Eggersdorfer, M.; Wyss, A. Carotenoids in human nutrition and health. Arch. Biochem. Biophys. 2018, 652, 18–26. [Google Scholar] [CrossRef] [PubMed]
- Bonet, M.; Ribot, J.; Galmés, S.; Serra, F.; Palou, A. Carotenoids and carotenoid conversion products in adipose tissue biology and obesity: Pre-clinical and human studies. Biochim. Biophys. Acta Mol. Cell Biol. Lipids 2020, 1865, 158676. [Google Scholar] [CrossRef]
- Böhm, V.; Lietz, G.; Olmedilla-Alonso, B.; Phelan, D.; Reboul, E.; Bánati, D.; Borel, P.; Corte-Real, J.; de Lera, A.R.; Desmarchelier, C.; et al. From carotenoid intake to carotenoid blood and tissue concentrations—Implications for dietary intake recommendations. Nutr. Rev. 2021, 79, 544–573. [Google Scholar] [CrossRef] [PubMed]
- Yamaguchi, M. Role of carotenoid β-cryptoxanthin in bone homeostasis. J. Biomed. Sci. 2012, 19, 36. [Google Scholar] [CrossRef]
- Yao, N.; Yan, S.; Guo, Y.; Wang, H.; Li, X.; Wang, L.; Hu, W.; Li, B.; Cui, W. The association between carotenoids and subjects with overweight or obesity: A systematic review and meta-analysis. Food Funct. 2021, 12, 4768–4782. [Google Scholar] [CrossRef]
- Landrier, J.F.; Marcotorchino, J.; Tourniaire, F. Lipophilic micronutrients and adipose tissue biology. Nutrients 2012, 4, 1622–1649. [Google Scholar] [CrossRef] [PubMed]
- Hamułka, J.; Górnicka, M.; Sulich, A.; Frąckiewicz, J. Weight loss program is associated with decrease α-tocopherol status in obese adults. Clin. Nutr. 2019, 38, 1861–1870. [Google Scholar] [CrossRef] [PubMed]
- World Health Organization. The Challenge of Obesity in the WHO European Region and the Strategies for Response. Summary; Branca, F., Nikogosian, H., Lobstein, T., Eds.; World Health Organization: Geneva, Switzerland, 2007. [Google Scholar]
- Ashwell, M.; Gibson, S. Waist-to-height ratio as an indicator of ‘early health risk’: Simpler and more predictive than using a ‘matrix’ based on BMI and waist circumference. BMJ Open 2016, 6, e010159. [Google Scholar] [CrossRef] [PubMed]
- FAO. Dietary Assessment: A Resource Guide to Method Selection and Application in Low Resource Settings; FAO: Rome, Italy, 2018. [Google Scholar]
- Szponar, L.; Wolnicka, K.; Rychlik, E. Atlas of Food Products and Dishes Portion Sizes; National Food and Nutrition Institute: Warsaw, Poland, 2000. (In Polish) [Google Scholar]
- FoodData Central. Available online: https://fdc.nal.usda.gov/fdc-app.html#/ (accessed on 24 April 2023).
- Jarosz, M.; Rychlik, E.; Stoś, K.; Charzewska, J. (Eds.) Polish Dietary Reference Intakes—Revision; National Institute of Public Health—National Institute of Hygiene: Warsaw, Poland, 2020; ISBN 9788365870285. (In Polish) [Google Scholar]
- ISAK; International Society for Advancement of Kinanthropometry. International Standards for Anthropometric Assessment; International Society for the Advancement of Kinanthropometry: Potchefstroom, South Africa, 2001. [Google Scholar]
- Stewart, A.; Marfell-Jones, M.J.; International Society for the Advancement of Kinanthropometry. International Standards for Anthropometric Assessment; International Society for the Advancement of Kinanthropometry, Ed.; International Society for the Advancement of Kinanthropometry: Lower Hutt, New Zealand, 2011. [Google Scholar]
- World Health Organization. WHO European Regional Obesity Report 2022; WHO Regional Office for Europe: Copenhagen, Denmark, 2022; Available online: https://iris.who.int/bitstream/handle/10665/353747/9789289057738-eng.pdf?sequence=1&isAllowed=y (accessed on 29 January 2023).
- Friedewald, W.T.; Levy, R.I.; Fredrickson, D.S. Estimation of the concentration of low-density lipoprotein cholesterol in plasma, without use of the preparative ultracentrifuge. Clin. Chem. 1972, 18, 499–502. [Google Scholar] [CrossRef]
- Wu, K.; Schwartz, S.J.; Platz, E.A.; Clinton, S.K.; Erdman, J.W., Jr.; Ferruzzi, M.G.; Willett, W.C.; Giovannucci, E.L. Variations in plasma lycopene and specific isomers over time in a cohort of U.S. men. J. Nutr. 2003, 133, 1930–1936. [Google Scholar] [CrossRef]
- Hamułka, J.; Wawrzyniak, A.; Sulich, A. The assessment of beta-carotene, lycopene and lutein intake by selected group of adults. Roczn PZH 2012, 63, 179–186. (In Polish) [Google Scholar]
- Wawrzyniak, A.; Hamułka, J.; Friberg, E.; Wolk, A. Dietary, anthropometric, and lifestyle correlates of serum carotenoids in postmenopausal women. Eur. J. Nutr. 2013, 52, 1919–1926. [Google Scholar] [CrossRef]
- Myszkowska-Ryciak, J.; Harton, A.; Gajewska, D.; Bawa, S. Lycopene, lutein and zeaxanthin intake in selected young women. Bromat Chem. Toksykol. 2014, 47, 630–634. (In Polish) [Google Scholar]
- Sulich, A.; Hamułka, J.; Nogal, D. Dietary sources of lutein in adults suffering eye disease (AMD/Cataracts). Roczn PZH 2015, 66, 55–60. [Google Scholar]
- Burrows, T.L.; Williams, R.; Rollo, M.; Wood, L.; Garg, M.L.; Jensen, M.; Collins, C.E. Plasma carotenoid levels as biomarkers of dietary carotenoid consumption: A systematic review of the validation studies. J. Nutr. Metab. 2015, 2, 15–64. [Google Scholar] [CrossRef]
- Toh, D.W.K.; Loh, W.W.; Sutanto, C.N.; Yao, Y.; Kim, J.E. Skin Carotenoid Status and Plasma Carotenoids: Biomarkers of Dietary Carotenoids, Fruits and Vegetables for Middle-Aged and Older Singaporean Adults. Br. J. Nutr. 2021, 126, 1398–1407. [Google Scholar] [CrossRef] [PubMed]
- Nagao, A.; Kotake-Nara, E.; Hase, M. Effects of Fats and Oils on the Bioaccessibility of Carotenoids and Vitamin E in Vegetables. Biosci. Biotechnol. Biochem. 2013, 77, 1055–1060. [Google Scholar] [CrossRef]
- Molteni, C.; la Motta, C.; Valoppi, F. Improving the Bioaccessibility and Bioavailability of Carotenoids by Means of Nanostructured Delivery Systems: A Comprehensive Review. Antioxidants 2022, 11, 1931. [Google Scholar] [CrossRef]
- Suzuki, K.; Ito, Y.; Inoue, T.; Hamajima, N. Inverse association of serum carotenoids with prevalence of metabolic syndrome among Japanese. Clin. Nutr. 2011, 30, 369–375. [Google Scholar] [CrossRef] [PubMed]
- Burrows, T.L.; Warren, J.M.; Colyvas, K.; Garg, M.L.; Collins, C.E. Validation of overweight children’s fruit and vegetable intake using plasma carotenoids. Obesity 2009, 17, 162–168. [Google Scholar] [CrossRef] [PubMed]
- Chai, W.; Conroy, S.M.; Maskarinec, G.; Franke, A.A.; Pagano, I.S.; Cooney, R.V. Associations between obesity and serum lipid-soluble micronutrients among premenopausal women. Nutr. Res. 2010, 30, 227–232. [Google Scholar] [CrossRef] [PubMed]
- Kabat, G.C.; Heo, M.; Ochs-Balcom, H.M.; LeBoff, M.S.; Mossavar-Rahmani, Y.; Adams-Campbell, L.L.; Nassir, R.; Ard, J.; Zaslavsky, O.; Rohan, T.E. Longitudinal association of measures of adiposity with serum antioxidant concentrations in postmenopausal women. Eur. J. Clin. Nutr. 2016, 70, 47–53. [Google Scholar] [CrossRef] [PubMed]
- Granado-Lorencio, F.; Blanco-Navarro, I.; Pérez-Sacristán, B.; Hernández-Álvarez, E. Biomarkers of carotenoid bioavailability. Food Res. Int. 2017, 99 Pt 2, 902–916. [Google Scholar] [CrossRef] [PubMed]
- Olmedilla-Alonso, B. Carotenoid Markers of Dietary Exposure and Nutritional Status. Nutrients 2023, 15, 2359. [Google Scholar] [CrossRef] [PubMed]
- Bohn, T.; Desmarchelier, C.; Dragsted, L.O.; Nielsen, C.S.; Stahl, W.; Rühl, R.; Keijer, J.; Borel, P. Host-related factors explaining interindividual variability of carotenoid bioavailability and tissue concentrations in humans. Mol. Nutr. Food Res. 2017, 61, 1600685. [Google Scholar] [CrossRef] [PubMed]
- Desmarchelier, C.; Borel, P. Overview of carotenoid bioavailability determinants: From dietary factors to host genetic variations: Carotenoid bioavailability determinants. Trends Food Sci. Technol. 2017, 69, 270–280. [Google Scholar] [CrossRef]
- Marhuenda-Muñoz, M.; Domínguez-López, I.; Langohr, K.; Tresserra-Rimbau, A.; Martínez González, M.Á.; Salas-Salvadó, J.; Corella, D.; Zomeño, M.D.; Martínez, J.A.; Alonso-Gómez, A.M.; et al. Circulating carotenoids are associated with favorable lipid and fatty acid profiles in an older population at high cardiovascular risk. Front. Nutr. 2022, 9, 967967. [Google Scholar] [CrossRef] [PubMed]
- Amengual, J.; Coronel, J.; Marques, C.; Aradillas-García, C.; Morales, J.M.V.; Andrade, F.C.D.; Erdman, J.W.; Teran-Garcia, M. β-Carotene Oxygenase 1 Activity Modulates Circulating Cholesterol Concentrations in Mice and Humans. J. Nutr. 2020, 150, 2023–2030. [Google Scholar] [CrossRef]
- Sugiura, M.; Nakamura, M.; Ogawa, K.; Ikoma, Y.; Matsumoto, H.; Ando, F.; Shimokata, H.; Yano, M. Associations of serum carotenoid concentrations with the metabolic syndrome: Interaction with smoking. Br. J. Nutr. 2008, 100, 1297–1306. [Google Scholar] [CrossRef]
- Suzuki, K.; Inoue, T.; Hashimoto, S.; Ochiai, J.; Kusuhara, Y.; Ito, Y.; Hamajima, N. Association of serum carotenoids with high molecular weight adiponectin and inflammation markers among Japanese subjects. Clin. Chim. Acta 2010, 411, 1330–1334. [Google Scholar] [CrossRef]
- Ben Amara, N.; Tourniaire, F.; Maraninchi, M.; Attia, N.; Amiot-Carlin, M.J.; Raccah, D.; Valéro, R.; Landrier, J.F.; Darmon, P. Independent positive association of plasma β-carotene concentrations with adiponectin among non-diabetic obese subjects. Eur. J. Nutr. 2015, 54, 447–454. [Google Scholar] [CrossRef]
- Allore, T.; Lemieux, S.; Vohl, M.; Couture, P.; Lamarche, B.; Couillard, C. Correlates of the difference in plasma carotenoid concentrations between men and women. Br. J. Nutr. 2019, 121, 172–181. [Google Scholar] [CrossRef]
- Bovier, E.R.; Lewis, R.D.; Hammond, B.R., Jr. The Relationship between Lutein and Zeaxanthin Status and Body Fat. Nutrients 2013, 5, 750–757. [Google Scholar] [CrossRef]
- Andersen, L.F.; Jacobs, D.R.; Gross, M.D.; Schreiner, P.J.; Williams, O.D.; Lee, D.-H. Longitudinal associations between body mass index and serum carotenoids: The CARDIA study. Br. J. Nutr. 2006, 95, 358–365. [Google Scholar] [CrossRef]
- Matsumoto, M.; Suganuma, H.; Ozato, N.; Shimizu, S.; Katashima, M.; Katsuragi, Y.; Mikami, T.; Itoh, K.; Nakaji, S. Association between Serum Concentration of Carotenoid and Visceral Fat. Nutrients 2021, 13, 912. [Google Scholar] [CrossRef] [PubMed]
- Białkowska, A.; Górnicka, M.; Zielinska-Pukos, M.A.; Hallmann, E.; Hamulka, J. Plasma Carotenoids and Polyphenols and Their Association with MetS: The Need for Nutritional Interventions. Antioxidants 2023, 12, 1336. [Google Scholar] [CrossRef] [PubMed]
- Meléndez-Martínez, A.J.; Mandić, A.I.; Bantis, F.; Böhm, V.; Borge, G.I.A.; Brnčić, M.; Bysted, A.; Cano, M.P.; Dias, M.G.; Elgersma, A.; et al. A comprehensive review on carotenoids in foods and feeds: Status quo, applications, patents, and research needs. Crit. Rev. Food Sci. Nutr. 2022, 62, 1999–2049. [Google Scholar] [CrossRef] [PubMed]
- Olmedilla-Alonso, B.; Estévez-Santiago, R. Dietary intake of carotenoids: Nutritional status assessment and the importance of considering free and esters forms in foods. In Carotenoid Esters in Foods: Physical, Chemical and Biological Properties; Mercadante, A.Z., Ed.; The Royal Society of Chemistry: London, UK, 2019; pp. 375–389. [Google Scholar]
- Olmedilla-Alonso, B.; Rodríguez-Rodríguez, E.; Beltrán-de-Miguel, B.; Estévez-Santiago, R. Dietary β-cryptoxanthin and αcarotene have greater apparent bioavailability than β-carotene in subjects from countries with different dietary patterns. Nutrients 2020, 12, 2639. [Google Scholar] [CrossRef]


| Carotenoids | Total | β-Carotene | Lycopene | Lutein and Zeaxanthin |
|---|---|---|---|---|
| plasma (nM/L) | 1725 | 500 | 600 | 330 |
| diet (mg/d) | 11.8 | 4.1 | 2.2 | 4.6 |
| Variables | Total Group n = 75 | Women n = 47 | Men n = 28 | p-Value |
|---|---|---|---|---|
| Age (years) | 34.7 ± 9.01 | 33.9 ± 9.1 | 36.0 ± 8.9 | NS |
| Place of living (%) | NS | |||
| >100,000 residents | 74.7 | 70.2 | 82.1 | |
| <100,000 residents | 25.3 | 29.8 | 17.9 | |
| Education (%) | NS | |||
| secondary | 28.0 | 29.8 | 25.0 | |
| university | 72.0 | 70.2 | 75.0 | |
| Professionally active (%) | NS | |||
| yes | 81.3 | 83.0 | 78.6 | |
| no | 18.7 | 17.0 | 21.4 | |
| Smoking (%): | NS | |||
| yes | 12.0 | 10.6 | 14.3 | |
| no | 88.0 | 89.4 | 85.7 | |
| Physical activity (%) | NS | |||
| high | 6.7 | 2.0 | 14.3 | |
| moderate | 33.3 | 36.2 | 28.6 | |
| low | 60.0 | 61.8 | 57.1 | |
| High (m) | 1.7 ± 0.1 | 1.7 ± 0.1 | 1.8 ± 0.1 | <0.001 |
| BW (kg) | 93.3 ± 17.2 | 86.5 ± 14.5 | 104.7 ± 15.2 | <0.001 |
| BMI (kg/m2) | 32.0 ± 4.7 | 31.7 ± 4.8 | 32.5 ± 4.5 | NS |
| BMI categories (%) | NS | |||
| 25–29.9 kg/m2 | 37.3 | 40.4 | 32.1 | |
| ≥30 kg/m2 | 62.7 | 59.6 | 67.9 |
| Variables | Group | Stage of the AntioxObesity | p-Value * | ||
|---|---|---|---|---|---|
| T0 | T3 | T6 | |||
| Energy value (kcal/d) | Total | 2006 ± 605 a | 1591 ± 454 b | 1499 ± 444 c | <0.001 |
| Women | 1811 ± 537 a | 1445 ± 406 b | 1345 ± 366 c | <0.001 | |
| Men | 2335 ± 576 a | 1836 ± 431 b | 1757 ± 449 b | 0.001 | |
| p-value ** | <0.001 | <0.001 | <0.001 | ||
| Fat (g/d) | Total | 73.1 ± 32.7 a | 51.5 ± 25.7 b | 46.0 ± 19.3 b | <0.001 |
| Women | 63.6 ± 28.9 a | 46.3 ± 24.8 b | 41.1 ± 16.2 b | <0.001 | |
| Men | 88.9 ± 33.2 a | 60.2 ± 25.4 b | 54.3 ± 21.3 b | <0.001 | |
| p-value ** | <0.001 | 0.02 | 0.006 | ||
| Fat (% energy) | Total | 31.1 | 28.0 | 26.9 | NS |
| Women | 29.7 | 27.4 | 27.0 | NS | |
| Men | 33.5 | 28.9 | 26.9 | NS | |
| p-value ** | NS | NS | NS | ||
| β-carotene (mg/d) | Total | 4.5 ± 2.5 | 4.8 ± 2.5 | 4.7 ± 2.3 | NS |
| Women | 4.6 ± 2.6 | 4.8 ± 2.4 | 4.8 ± 2.3 | NS | |
| Men | 4.4 ± 2.3 | 4.8 ± 2.5 | 4.6 ± 2.5 | NS | |
| p-value ** | NS | NS | NS | ||
| Lycopene (mg/d) | Total | 3.6 ± 2.2 | 3.8 ± 2.3 | 3.8 ± 2.3 | NS |
| Women | 3.4 ± 2.0 | 3.7 ± 2.2 | 3.7 ± 2.4 | NS | |
| Men | 3.8 ± 2.5 | 4.0 ± 2.5 | 3.9 ± 2.5 | NS | |
| p-value ** | NS | NS | NS | ||
| Lutein/ zeaxanthin (mg/d) | Total | 2.1 ± 1.3 | 2.1 ± 1.2 | 2.2 ± 1.2 | NS |
| Women | 2.2 ± 1.3 | 2.3 ± 1.3 | 2.3 ± 1.3 | NS | |
| Men | 2.0 ± 1.1 | 1.9 ± 0.9 | 2.0 ± 1.0 | NS | |
| p-value ** | NS | NS | NS | ||
| Variables | Group | Stage of the AntioxObesity | p-Value * | Changes % | ||
|---|---|---|---|---|---|---|
| T0 | T3 | T6 | ||||
| BW (kg) | Total | 93.3 ± 17.2 a | 90.5 ± 17.1 b | 89.4 ± 16.9 c | <0.001 | ↓ 4.2 ± 3.0 |
| Women | 86.5 ± 14.5 a | 84.0 ± 14.5 b | 82.9 ± 14.3 c | <0.001 | ↓ 4.2 ± 2.6 | |
| Men | 104.7 ± 15.2 a | 101.4 ± 15.6 b | 100.3 ± 15.5 c | <0.001 | ↓ 4.3 ± 3.5 | |
| p-value ** | <0.001 | <0.001 | <0.001 | |||
| BMI (kg/m2) | Total | 32.0 ± 4.7 a | 31.1 ± 4.6 b | 30.7 ± 4.5 c | <0.001 | ↓ 4.2 ± 3.1 |
| Women | 31.7 ± 4.8 a | 30.8 ± 4.7 b | 30.4 ± 4.6 b | <0.001 | ↓ 4.2 ± 2.8 | |
| Men | 32.5 ± 4.5 a | 31.4 ± 4.4 b | 31.1 ± 4.4 b | <0.001 | ↓ 4.3 ± 3.6 | |
| p-value ** | NS | NS | NS | |||
| WC (cm) | Total | 94.8 ± 12.3 a | 91.8 ± 11.9 b | 89.9 ± 11.9 c | <0.001 | ↓ 5.1 ± 4.0 |
| Women | 90.0 ± 10.5 a | 87.1 ± 9.8 b | 85.1 ± 9.7 c | <0.001 | ↓ 5.3 ± 4.2 | |
| Men | 102.8 ± 11.0 a | 99.6 ± 11.1 b | 97.9 ± 11.1 c | <0.001 | ↓ 4.8 ± 3.7 | |
| p-value ** | <0.001 | <0.001 | <0.001 | |||
| FFM (kg) | Total | 53.6 ± 11.6 | 53.8 ± 12.3 | 53.1 ± 11.3 | NS | ↓ 0.7 ± 3.3 |
| Women | 45.4 ± 3.6 | 45.5 ± 3.3 | 45.2 ± 3.4 | NS | ↓ 0.4 ± 3.6 | |
| Men | 67.4 ± 5.6 | 67.8 ± 8.6 | 66.5 ± 6.0 | NS | ↓ 1.4 ± 2.6 | |
| p-value ** | <0.001 | <0.001 | <0.001 | |||
| FM (kg) | Total | 39.6 ± 13.3 a | 36.6 ± 13.0 b | 36.3 ± 13.3 b | <0.001 | ↓ 8.9 ± 7.8 |
| Women | 41.0 ± 14.0 a | 38.4 ± 13.9 b | 37.8 ± 14.0 c | <0.001 | ↓ 8.3 ± 7.4 | |
| Men | 37.3 ± 12.1 a | 33.5 ± 10.8 b | 33.7 ± 11.9 b | <0.001 | ↓ 9.9 ± 8.3 | |
| p-value ** | NS | NS | NS | |||
| SAT (cm2) | Total | 248.0 ± 82.5 a | 240.1 ± 82.3 a | 228.2 ± 86.6 b | 0.002 | ↓ 7.2 ± 21.7 |
| Women | 242.0 ± 75.1 | 236.7 ± 83.2 | 231.5 ± 87.1 | NS | ↓ 4.2 ± 21.3 | |
| Men | 258.0 ± 94.4 a | 245.8 ± 82.0 a | 222.7 ± 86.9 b | 0.003 | ↓ 12.3 ± 21.8 | |
| p-value ** | NS | NS | NS | |||
| VAT (cm2) | Total | 175.5 ± 71.7 a | 158.0 ± 72.5 b | 148.8 ± 75.3 c | <0.001 | ↓ 15.7 ± 18.5 |
| Women | 165.6 ± 64.5 a | 150.6 ± 67.0 b | 141.3 ± 67.4 c | <0.001 | ↓ 15.0 ± 18.5 | |
| Men | 192.1 ± 81.0 a | 170.3 ± 80.8 b | 161.4 ± 86.9 c | <0.001 | ↓ 16.9 ± 18.7 | |
| p-value ** | NS | NS | NS | |||
| Lipid Profile | Group | Stage of the AntioxObesity | p-Value * | Changes % | |
|---|---|---|---|---|---|
| T0 | T6 | ||||
| Total cholesterol (mg/dL) | Total | 198.4 ± 30.8 | 183.8 ± 30.7 | <0.001 | ↓ 6.6 ± 12.7 |
| Women | 201.6 ± 31.6 | 186.0 ± 28.7 | <0.001 | ↓ 7.1 ± 10.9 | |
| Men | 193.0 ± 29.2 | 180.1 ± 34.0 | 0.04 | ↓ 5.9 ± 15.4 | |
| p-value ** | NS | NS | |||
| HDL-cholesterol (mg/dL) | Total | 51.1 ± 8.9 | 50.8 ± 9.1 | NS | ↓ 0.2 ± 13.9 |
| Women | 53.3 ± 9.1 | 53.3 ± 9.6 | NS | ↑ 0.8 ± 16.6 | |
| Men | 47.3 ± 7.2 | 46.6 ± 6.6 | NS | ↓ 0.9 ± 7.9 | |
| p-value ** | NS | NS | |||
| LDL-cholesterol (mg/dL) | Total | 122.9 ± 32.0 | 109.9 ± 30.7 | <0.001 | ↓ 8.4 ± 21.8 |
| Women | 126.1 ± 32.5 | 111.3 ± 29.0 | <0.001 | ↓ 9.8 ± 18.5 | |
| Men | 117.6 ± 31.1 | 107.5 ± 33.6 | NS | ↓ 6.0 ± 26.7 | |
| p-value ** | NS | NS | |||
| Triglycerides (mg/dL) | Total | 122.1 ± 42.8 | 115.8 ± 36.1 | NS | ↓ 1.2 ± 24.1 |
| Women | 111.1 ± 35.5 | 107.3 ± 33.0 | NS | ↓ 0.8 ± 20.7 | |
| Men | 140.5 ± 48.2 | 130.0 ± 37.2 | NS | ↓ 1.9 ± 29.4 | |
| p-value ** | 0.003 | 0.001 | |||
| Variables | Category | β-Carotene (nM/L) | Lycopene (nM/L) | Lutein/Zeaxanthin (nM/L) | |||||||||
|---|---|---|---|---|---|---|---|---|---|---|---|---|---|
| Stage | p * | Changes % | Stage | p * | Changes % | Stage | p * | Changes % | |||||
| T0 | T6 | T0 | T6 | T0 | T6 | ||||||||
| Total group (n = 75) | 612.0 ± 275.1 | 650.6 ± 285.2 | <0.001 | ↑ 9.0 ± 18.9 | 426.3 ± 172.1 | 446.5 ± 172.2 | NS | ↑ 8.3 ± 22.4 | 340.1 ± 124.2 | 384.4 ± 149.9 | <0.001 | ↑ 13.9 ± 22.4 | |
| Sex | Women (n = 47) | 620.4 ± 274.5 | 692.1 ± 350.3 | <0.001 | ↑ 8.2 ± 14.9 | 410.2 ± 179.9 | 431.4 ± 169.0 | NS | ↑ 8.8 ± 20.1 | 338.8 ± 129.7 | 377.0 ± 139.5 | <0.001 | ↑ 12.8 ± 20.3 |
| Men (n = 28) | 598.1 ± 280.7 | 635.1 ± 304.1 | NS | ↑ 10.2 ± 24.3 | 453.4 ± 157.4 | 471.8 ± 177.6 | NS | ↑ 7.3 ± 27.5 | 342.4 ± 116.7 | 396.8 ± 167.8 | NS | ↑ 15.6 ± 25.9 | |
| p-value ** | NS | NS | NS | NS | NS | NS | |||||||
| BMI (kg/m2) | <30 (n = 28) | 607.3 ± 278.1 | 647.7 ± 302.2 | 0.03 | ↑ 7.5 ± 15.6 | 437.2 ± 194.2 | 458.4 ± 190.0 | NS | ↑ 8.9 ± 23.5 | 380.4 ± 135.3 | 441.0 ± 166.4 | 0.04 | ↑ 17.0 ± 22.1 |
| ≥30 (n = 47) | 614.7 ± 276.4 | 652.3 ± 278.3 | 0.004 | ↑ 9.8 ± 20.6 | 419.9 ± 159.3 | 439.4 ± 162.4 | NS | ↑ 7.8 ± 22.9 | 316.1 ± 111.8 | 350.7 ± 129.5 | NS | ↑ 12.0 ± 22.6 | |
| p-value ** | NS | NS | NS | NS | 0.04 | 0.02 | |||||||
| FM reduction (kg) | <4.0 (n = 38) | 630.6 ± 278.1 | 660.1 ± 291.7 | NS | ↑ 5.9 ± 18.2 | 434.4 ± 176.6 | 450.2 ± 176.6 | NS | ↑ 7.4 ± 23.2 | 350.9 ± 128.7 | 402.2 ± 151.5 | NS | ↑ 16.0 ± 23.0 |
| ≥4.0 (n = 37) | 593.4 ± 274.7 | 641.1 ± 282.2 | 0.001 | ↑ 12.0 ± 19.3 | 418.0 ± 169.3 | 442.7 ± 170.0 | NS | ↑ 9.1 ± 23.1 | 329.0 ± 120.2 | 366.1 ± 148.0 | 0.04 | ↑ 11.7 ± 21.9 | |
| p-value ** | NS | NS | NS | NS | NS | NS | |||||||
| Carotenoids Changes (%) | FM Reduction (%) | p-Value * | ||||||
|---|---|---|---|---|---|---|---|---|
| Q1 <3.0 (n = 19) | p-Value * | Q2 3.0–7.5 (n = 19) | p-Value * | Q3 7.6–13.4 (n = 19) | p-Value * | Q4 >13.4 (n = 18) | ||
| ∆ β-carotene | ↑ 3.4 ± 17.2 | NS | ↑ 8.8 ± 19.0 | NS | ↑ 8.6 ± 16.5 | 0.02 | ↑ 15.0 ± 22.1 | 0.03 |
| ∆ Lycopen | ↑ 6.7 ± 23.5 | NS | ↑ 9.4 ± 23.7 | NS | ↑ 14.3 ± 25.1 | NS | ↑ 2.3 ± 19.3 | NS |
| ∆ Lutein/zeaxanthin | ↑ 17.0 ± 25.5 | 0.01 | ↑11.3 ± 20.6 | NS | ↑ 14.4 ± 24.5 | 0.04 | ↑ 10.1 ± 19.1 | 0.04 |
| ∆ Sum of carotenoids | ↑ 9.1 ± 16.5 | 0.02 | ↑ 7.0 ± 10.3 | 0.01 | ↑ 8.6 ± 12.3 | 0.01 | ↑ 8.7 ± 14.7 | 0.04 |
Disclaimer/Publisher’s Note: The statements, opinions and data contained in all publications are solely those of the individual author(s) and contributor(s) and not of MDPI and/or the editor(s). MDPI and/or the editor(s) disclaim responsibility for any injury to people or property resulting from any ideas, methods, instructions or products referred to in the content. |
© 2023 by the authors. Licensee MDPI, Basel, Switzerland. This article is an open access article distributed under the terms and conditions of the Creative Commons Attribution (CC BY) license (https://creativecommons.org/licenses/by/4.0/).
Share and Cite
Hamulka, J.; Sulich, A.; Górnicka, M.; Jeruszka-Bielak, M. Changes in Plasma Carotenoid Concentrations during the AntioxObesity Weight Reduction Program among Adults with Excessive Body Weight. Nutrients 2023, 15, 4890. https://doi.org/10.3390/nu15234890
Hamulka J, Sulich A, Górnicka M, Jeruszka-Bielak M. Changes in Plasma Carotenoid Concentrations during the AntioxObesity Weight Reduction Program among Adults with Excessive Body Weight. Nutrients. 2023; 15(23):4890. https://doi.org/10.3390/nu15234890
Chicago/Turabian StyleHamulka, Jadwiga, Agnieszka Sulich, Magdalena Górnicka, and Marta Jeruszka-Bielak. 2023. "Changes in Plasma Carotenoid Concentrations during the AntioxObesity Weight Reduction Program among Adults with Excessive Body Weight" Nutrients 15, no. 23: 4890. https://doi.org/10.3390/nu15234890
APA StyleHamulka, J., Sulich, A., Górnicka, M., & Jeruszka-Bielak, M. (2023). Changes in Plasma Carotenoid Concentrations during the AntioxObesity Weight Reduction Program among Adults with Excessive Body Weight. Nutrients, 15(23), 4890. https://doi.org/10.3390/nu15234890