
Relationship between Iron Deficiency and Thyroid Function: A Systematic Review and Meta-Analysis
 , ,
, ,  ,
,  ,
,  and
and 
Abstract
1. Introduction
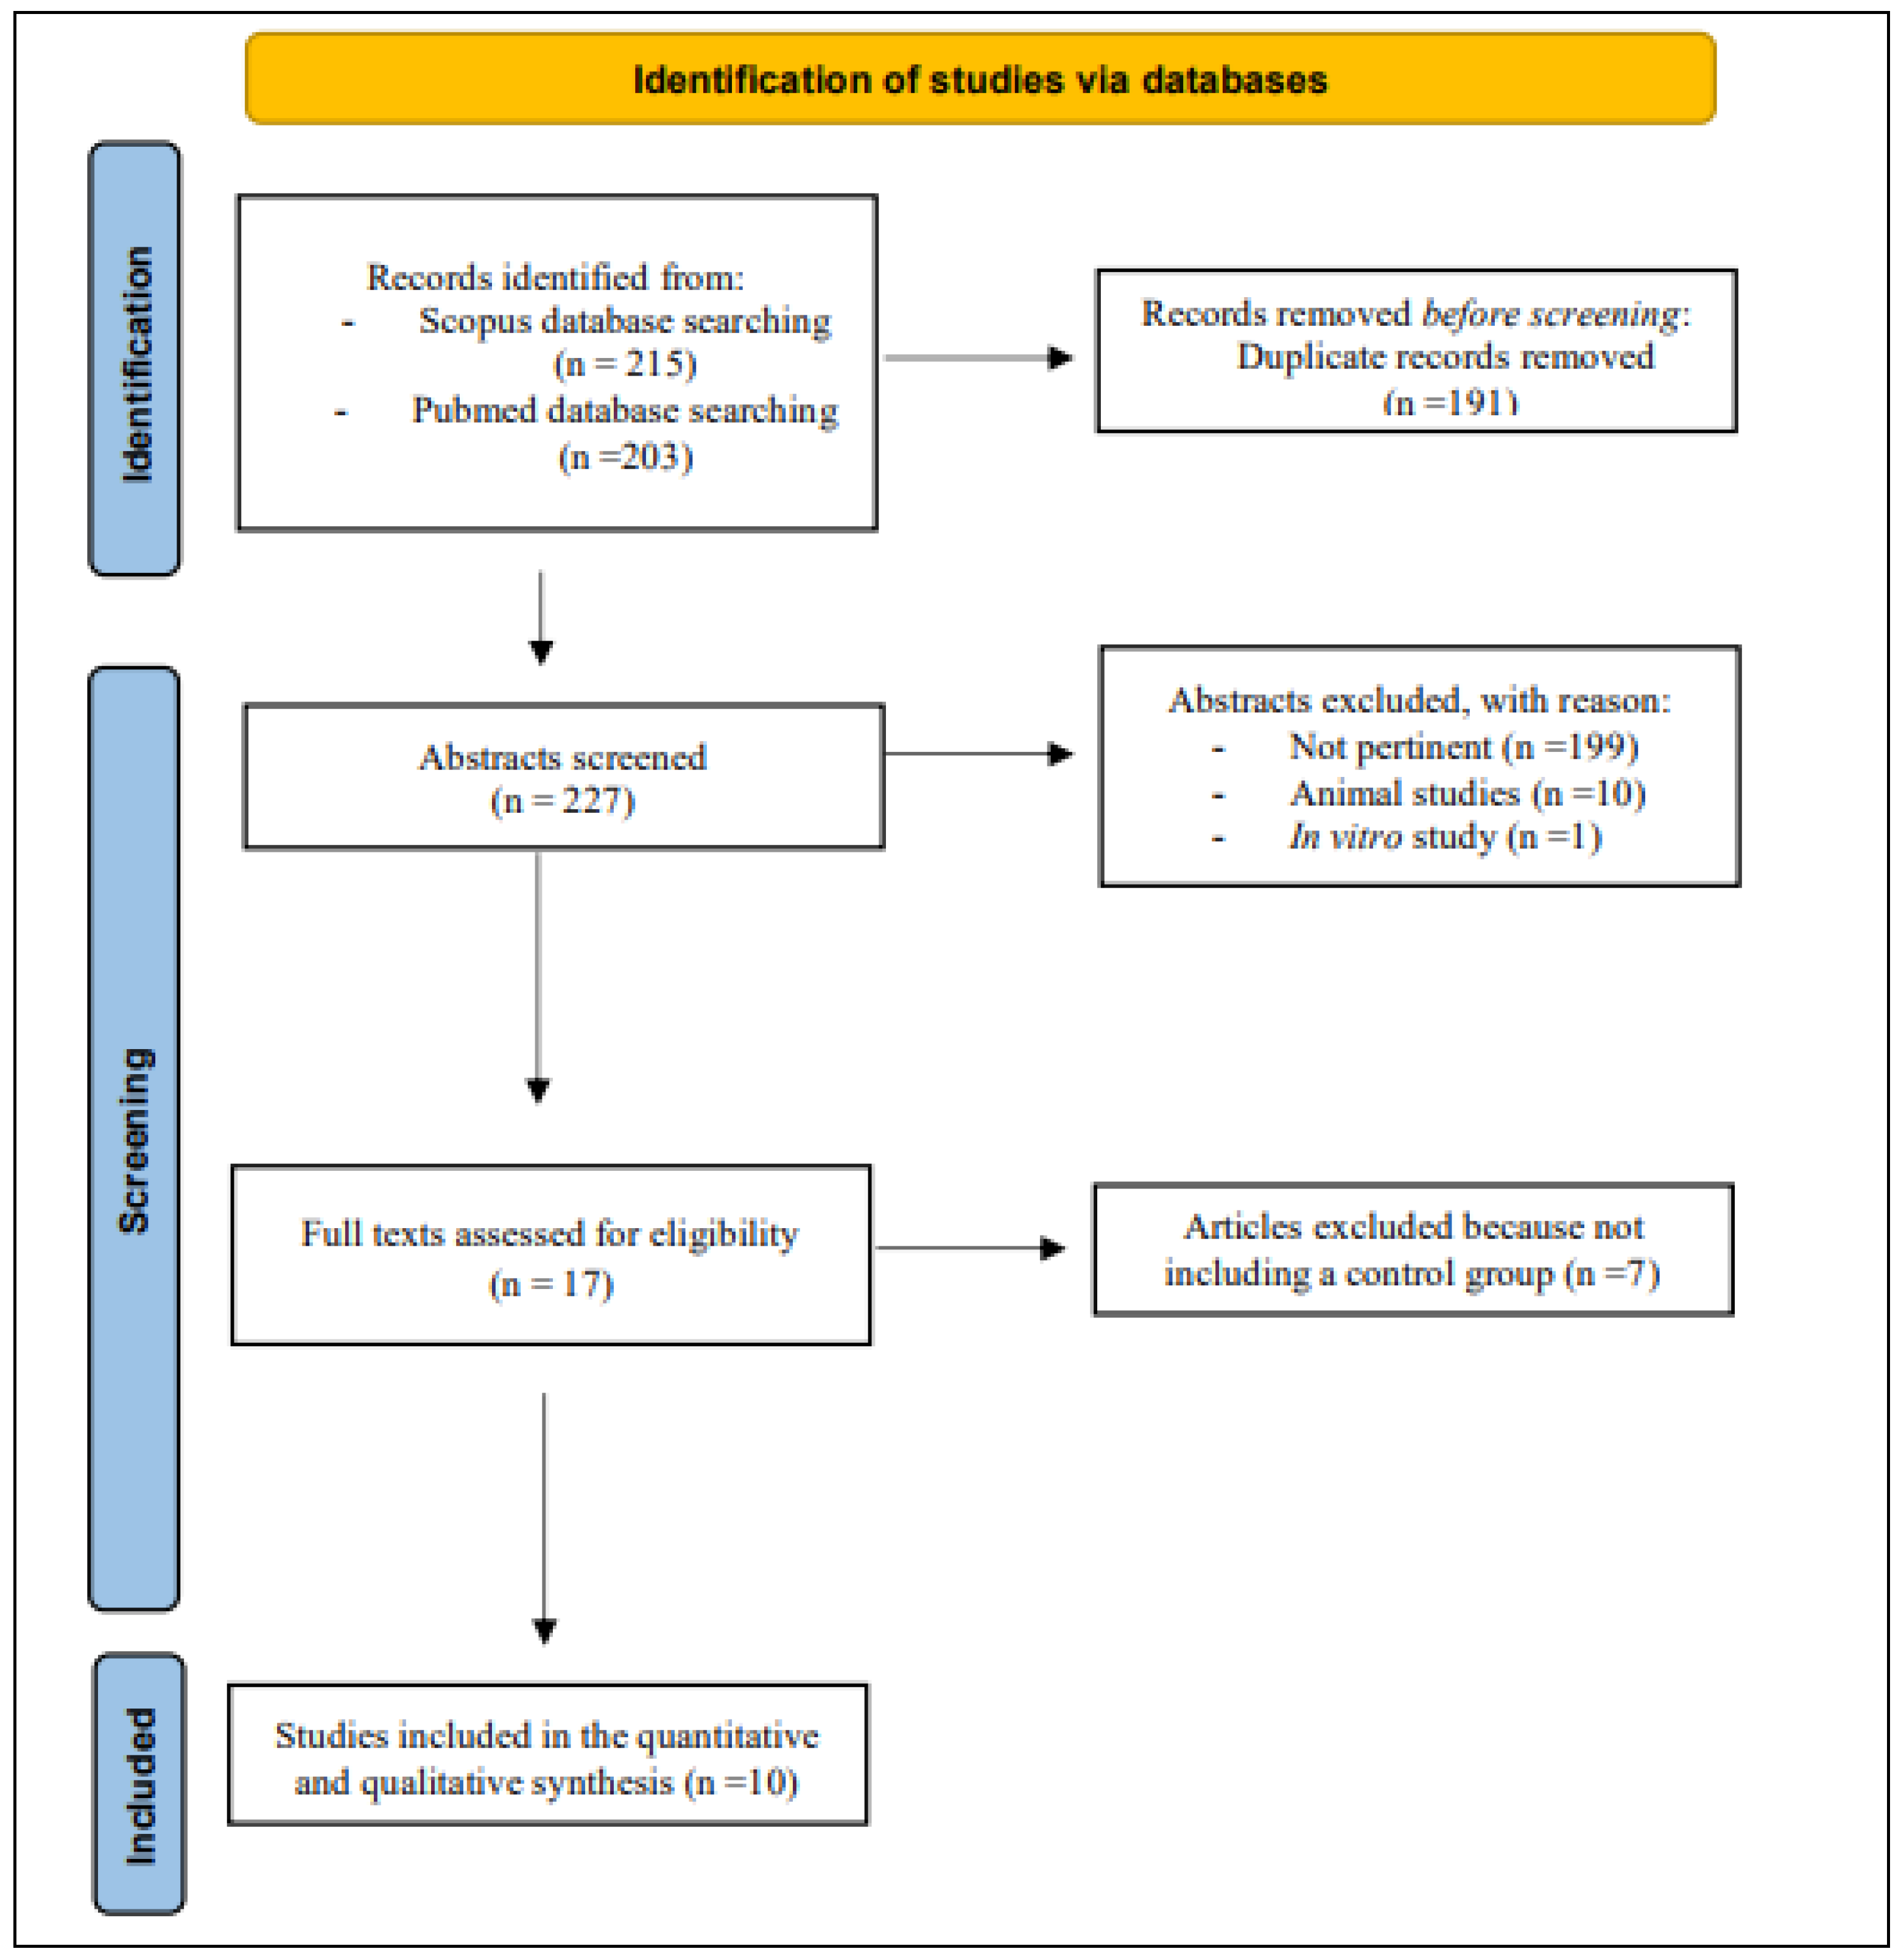
2. Methods
2.1. Search Strategy
2.2. Selection Criteria
2.3. Data Extraction
2.4. Quality Assessment
2.5. Statistical Analysis
3. Results

3.1. Quality of Evidence of Included Studies
3.2. Results of the Quantitative Synthesis
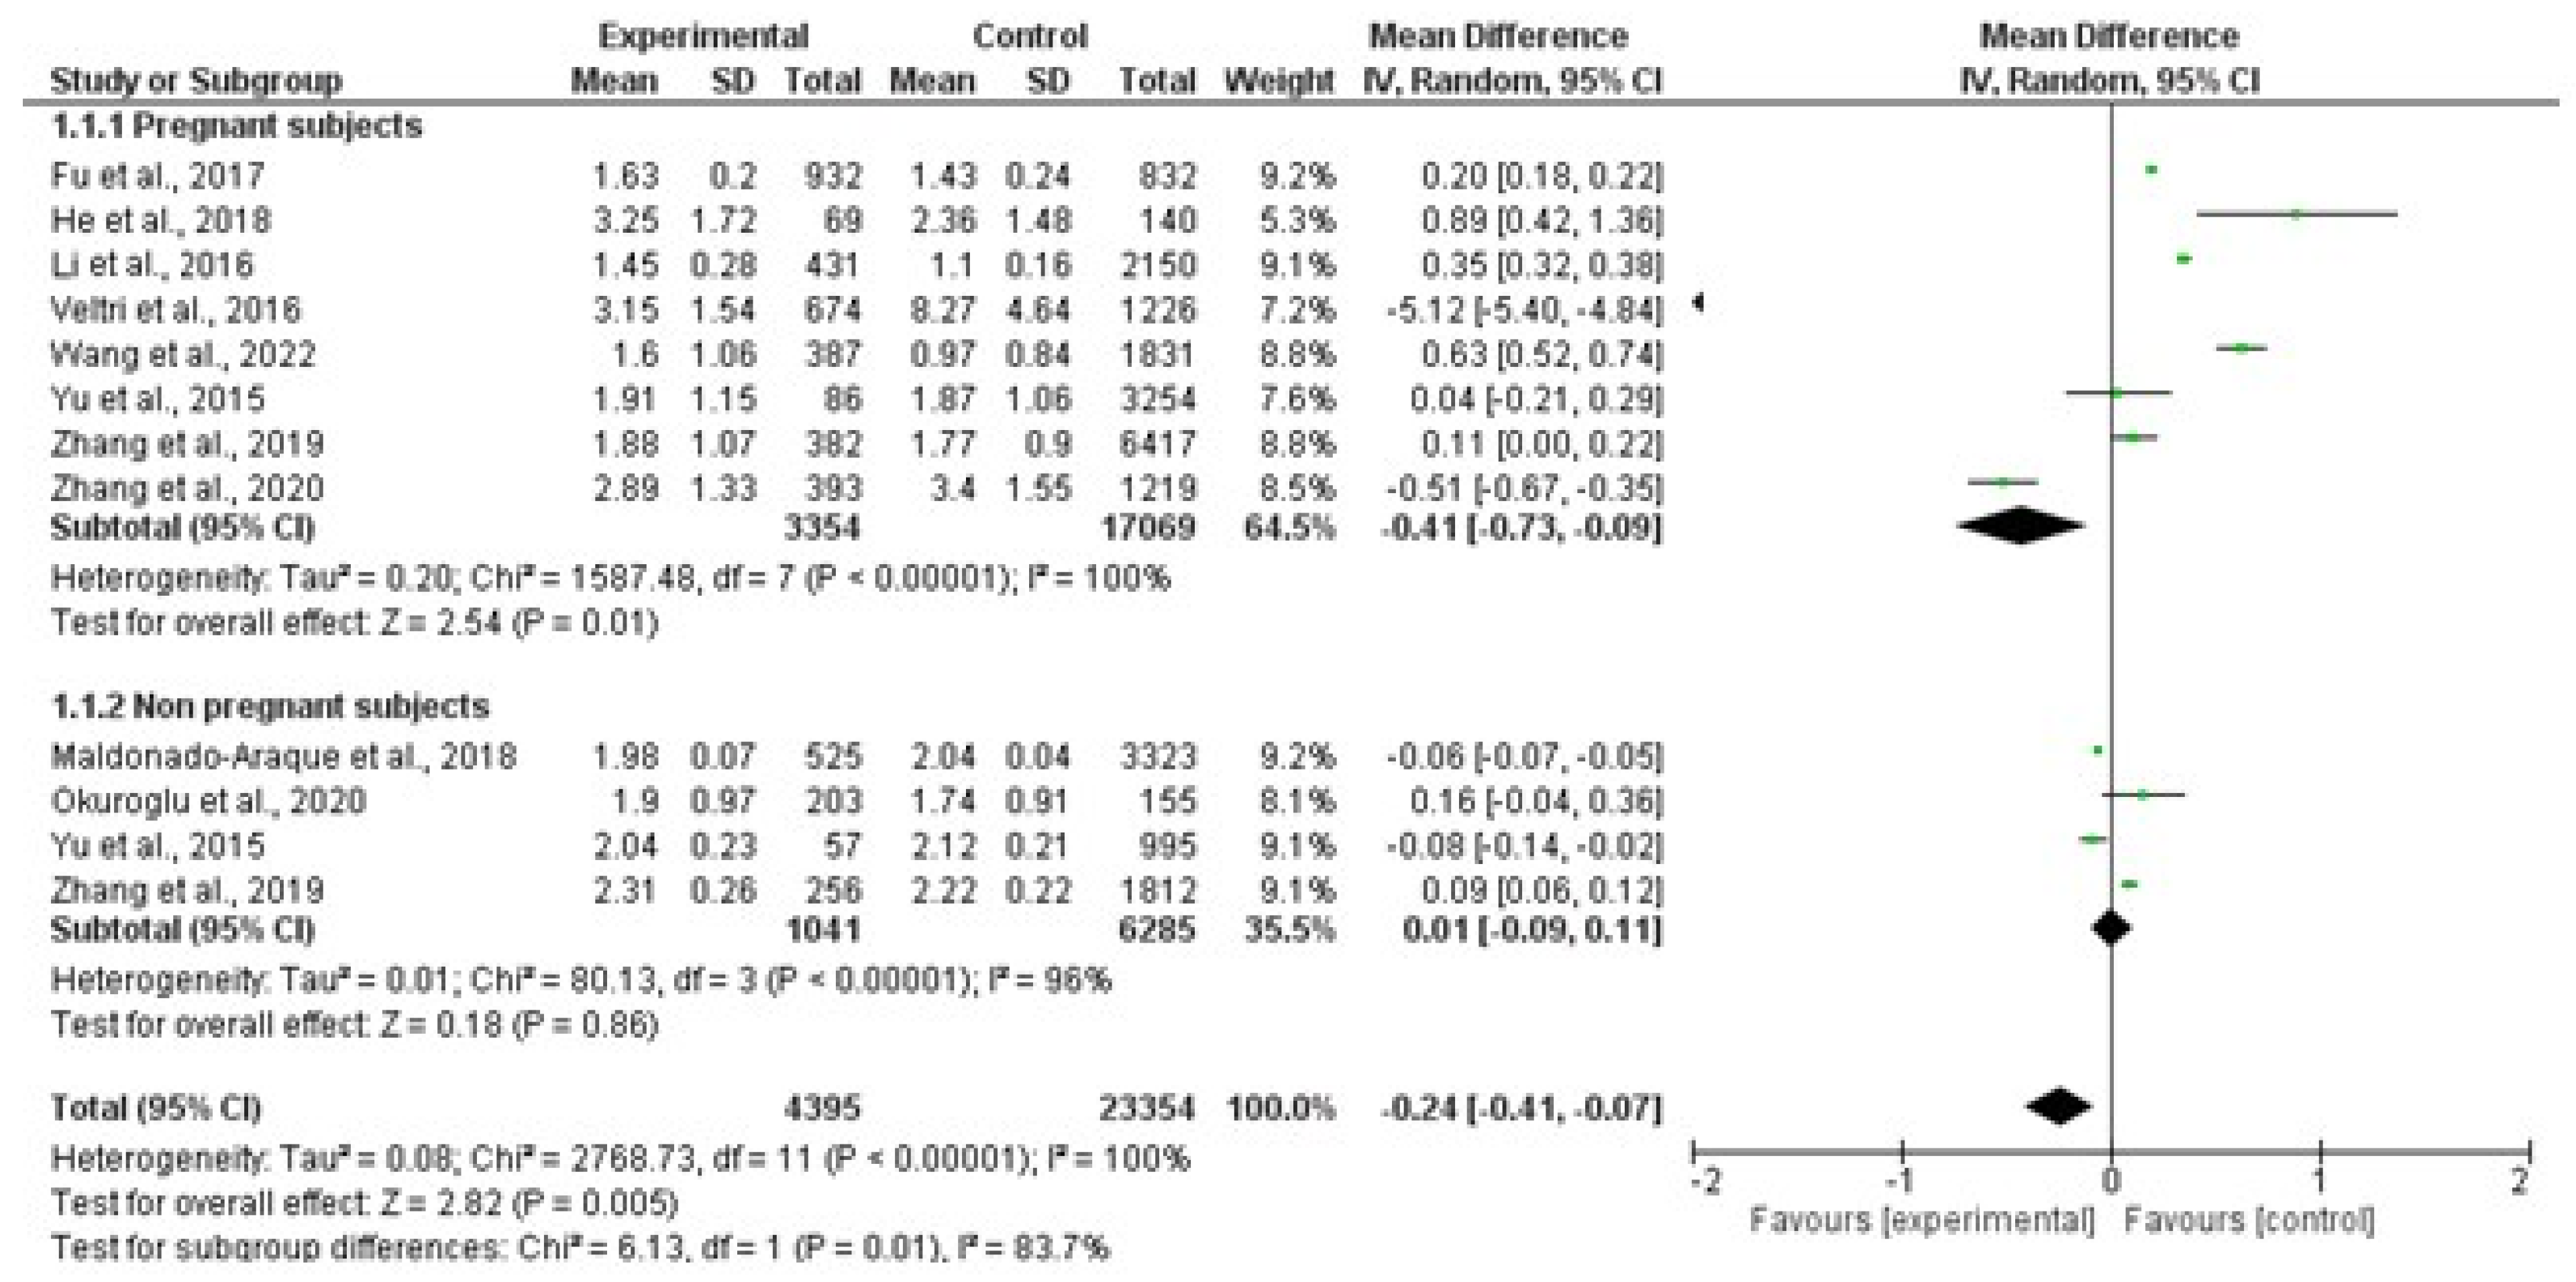
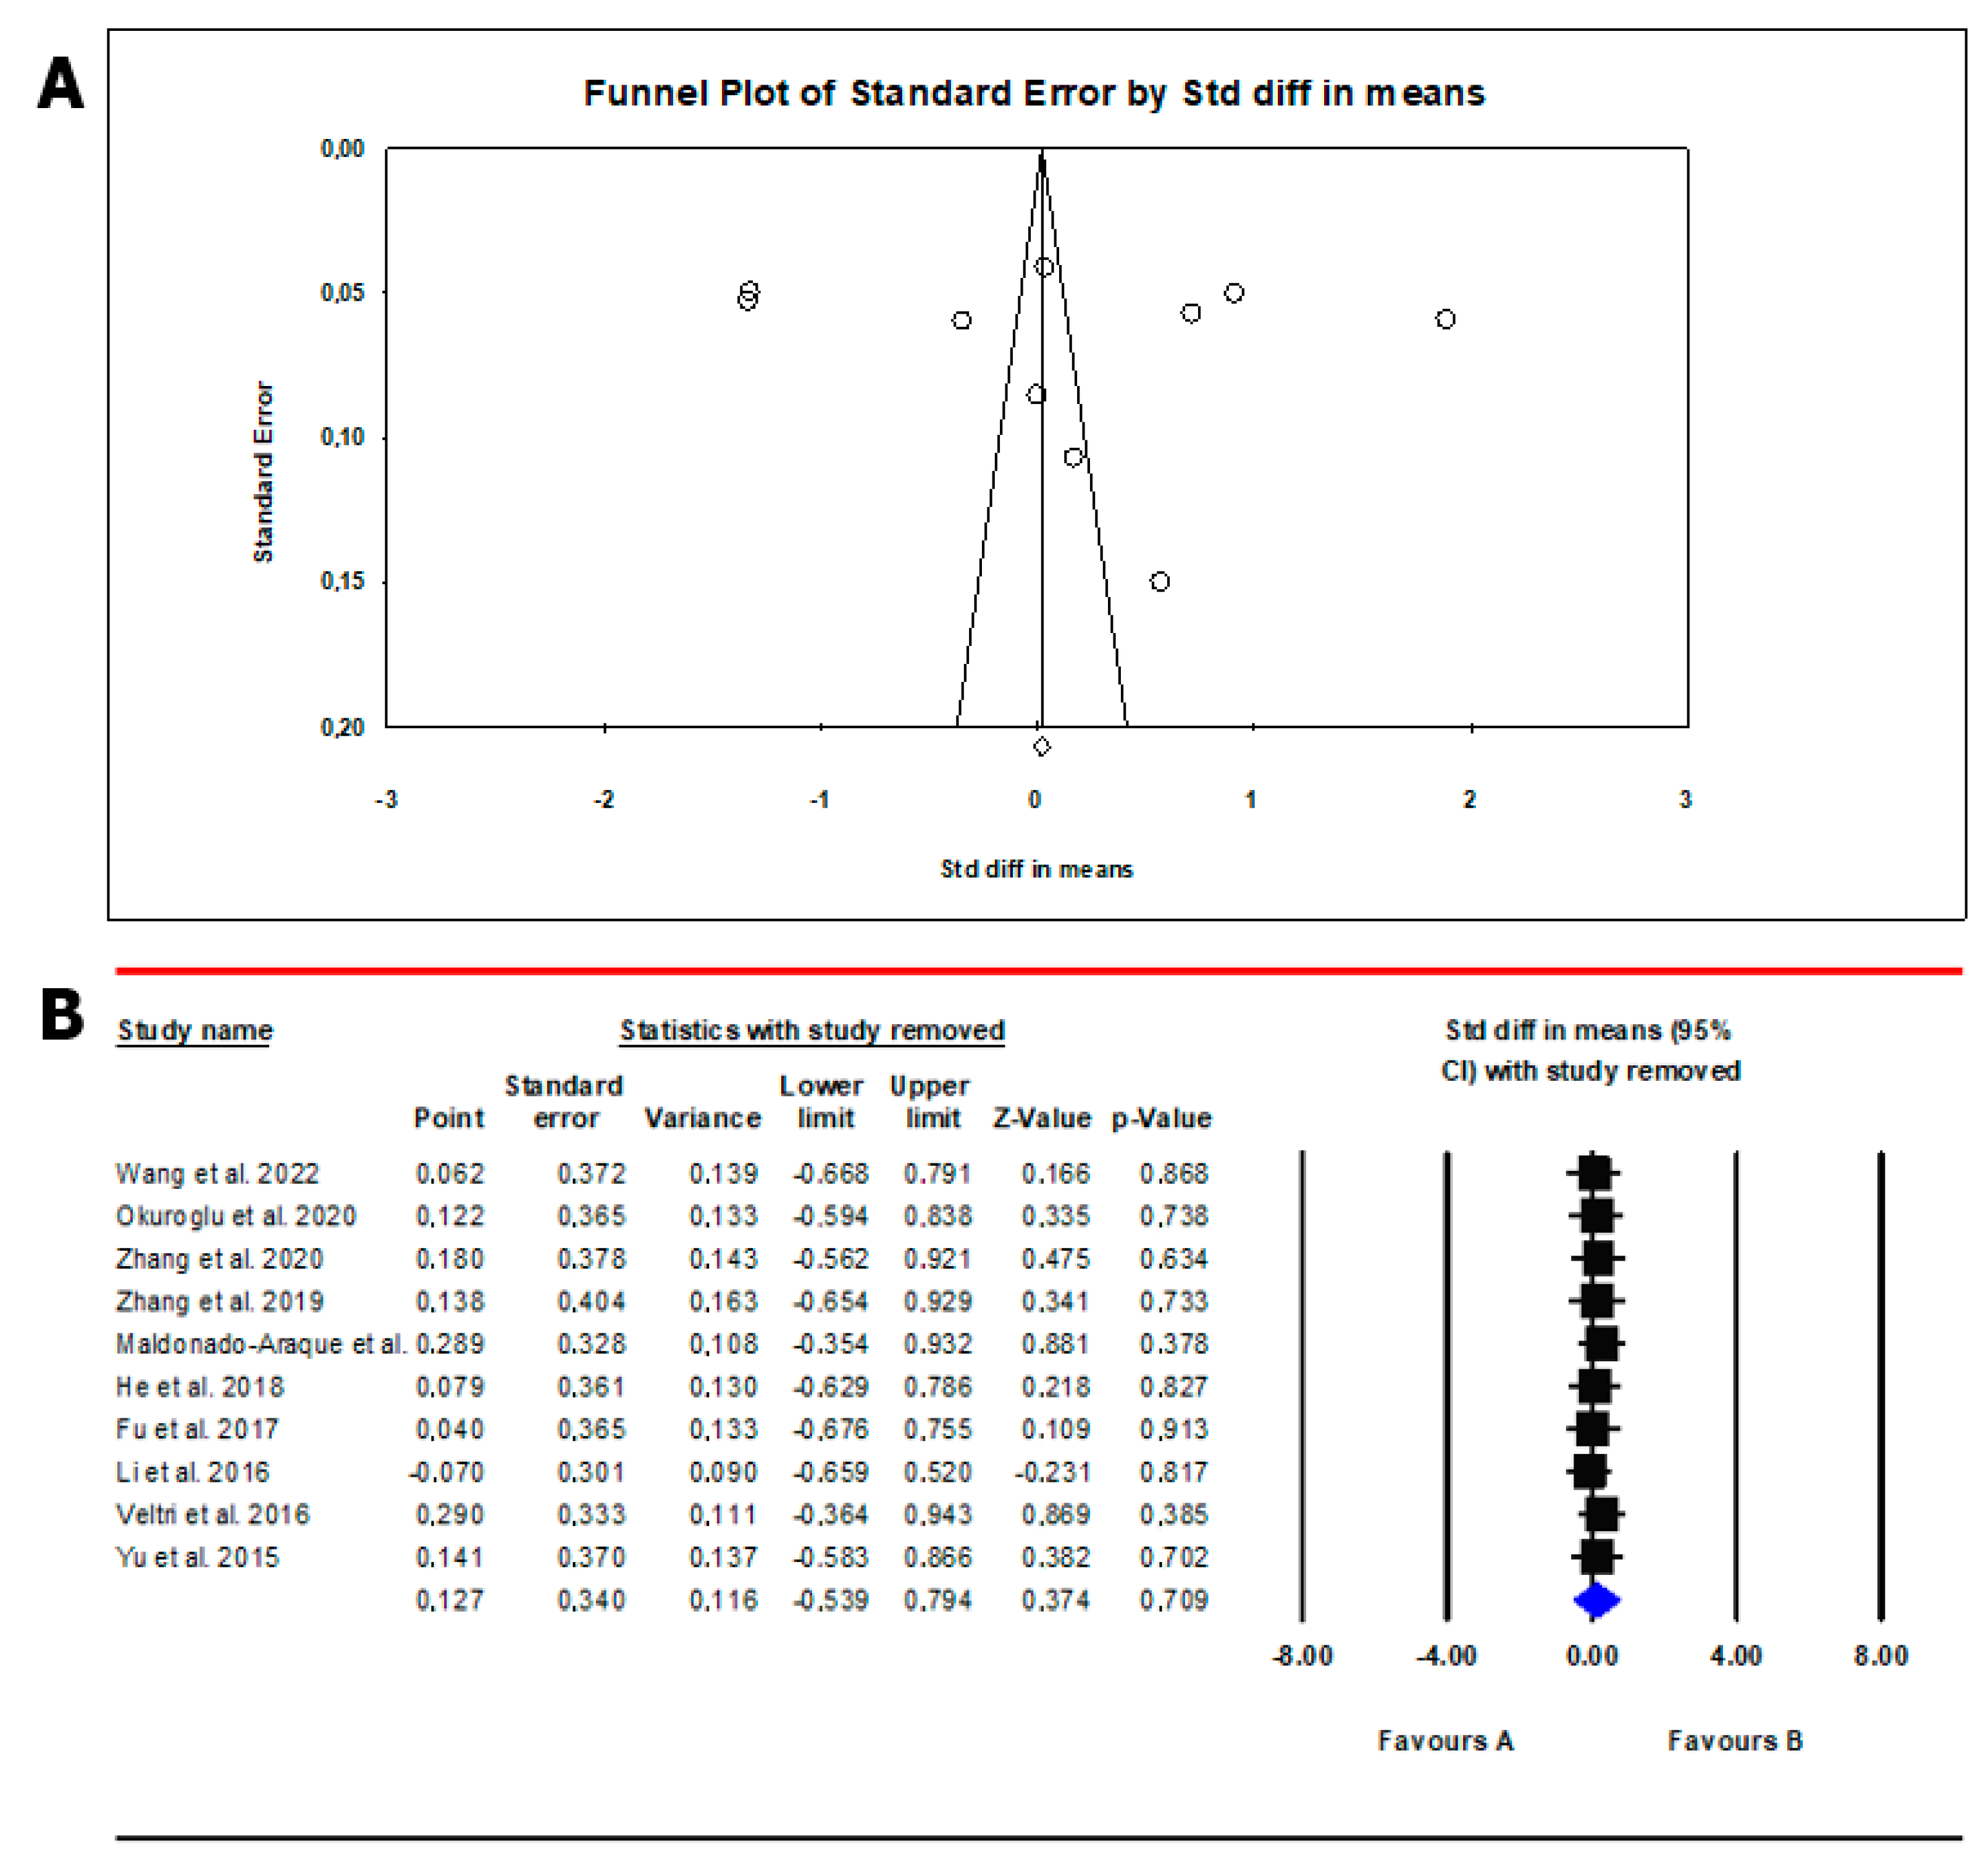
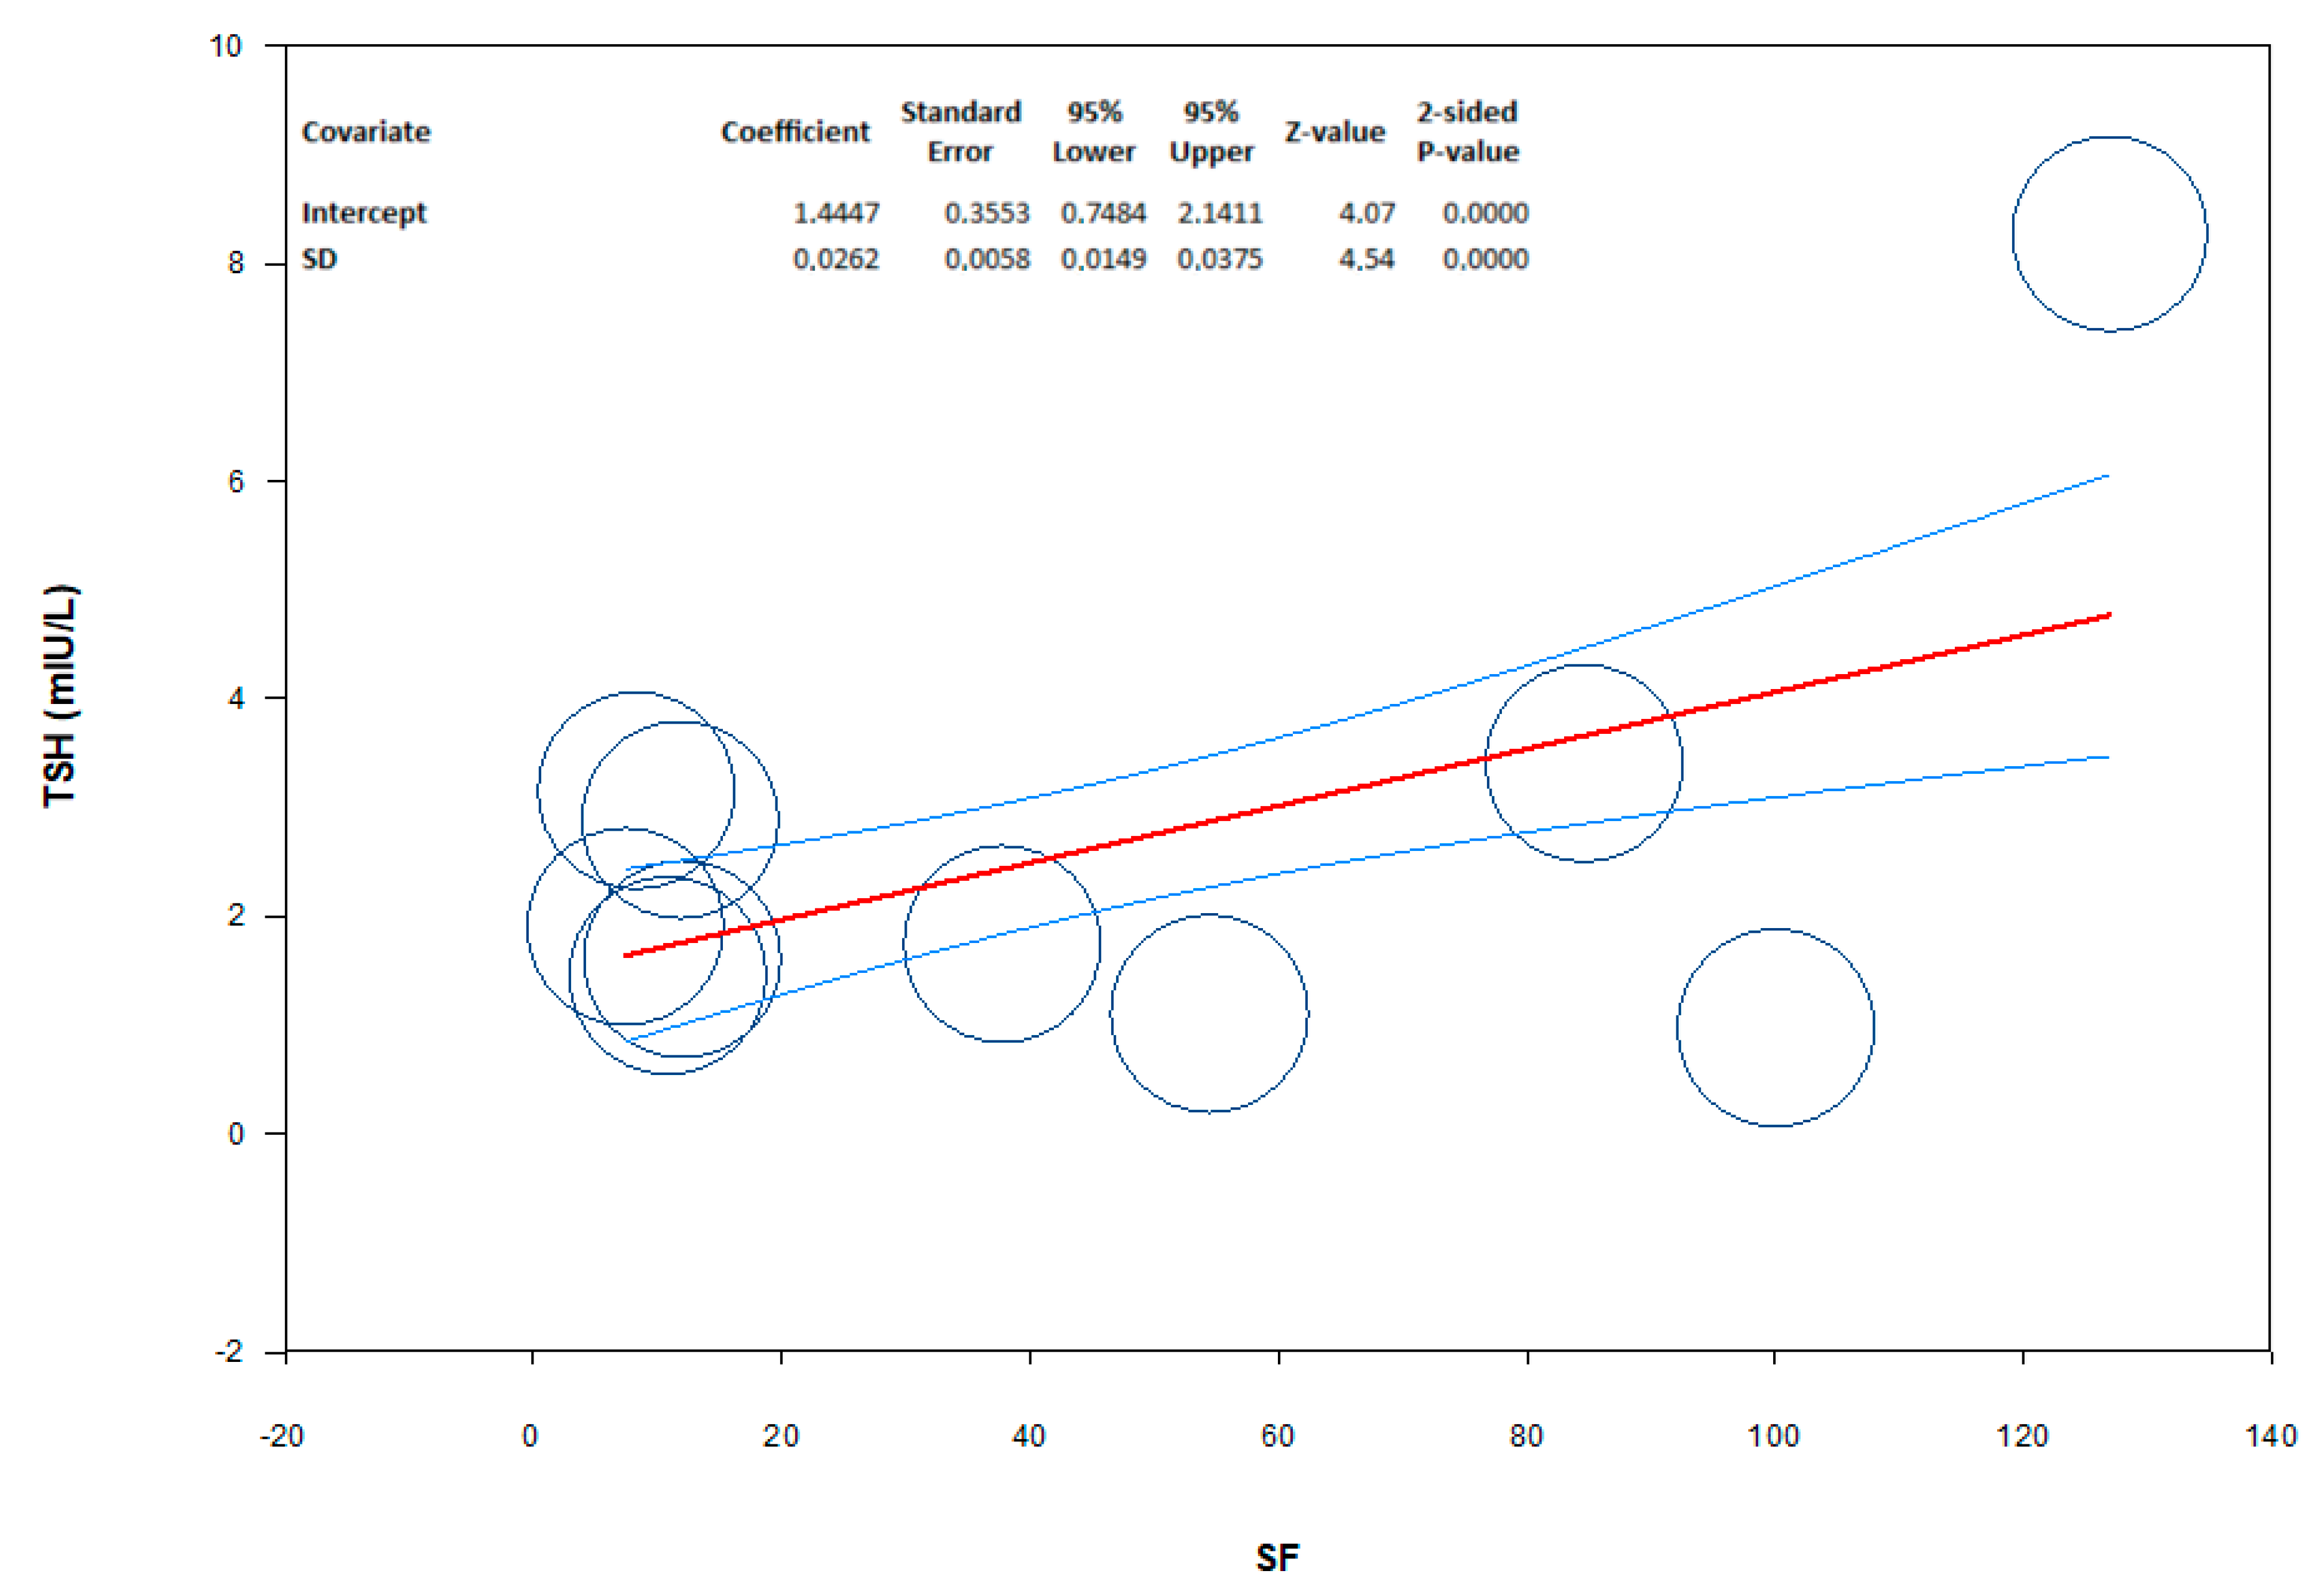
3.2.1. TSH
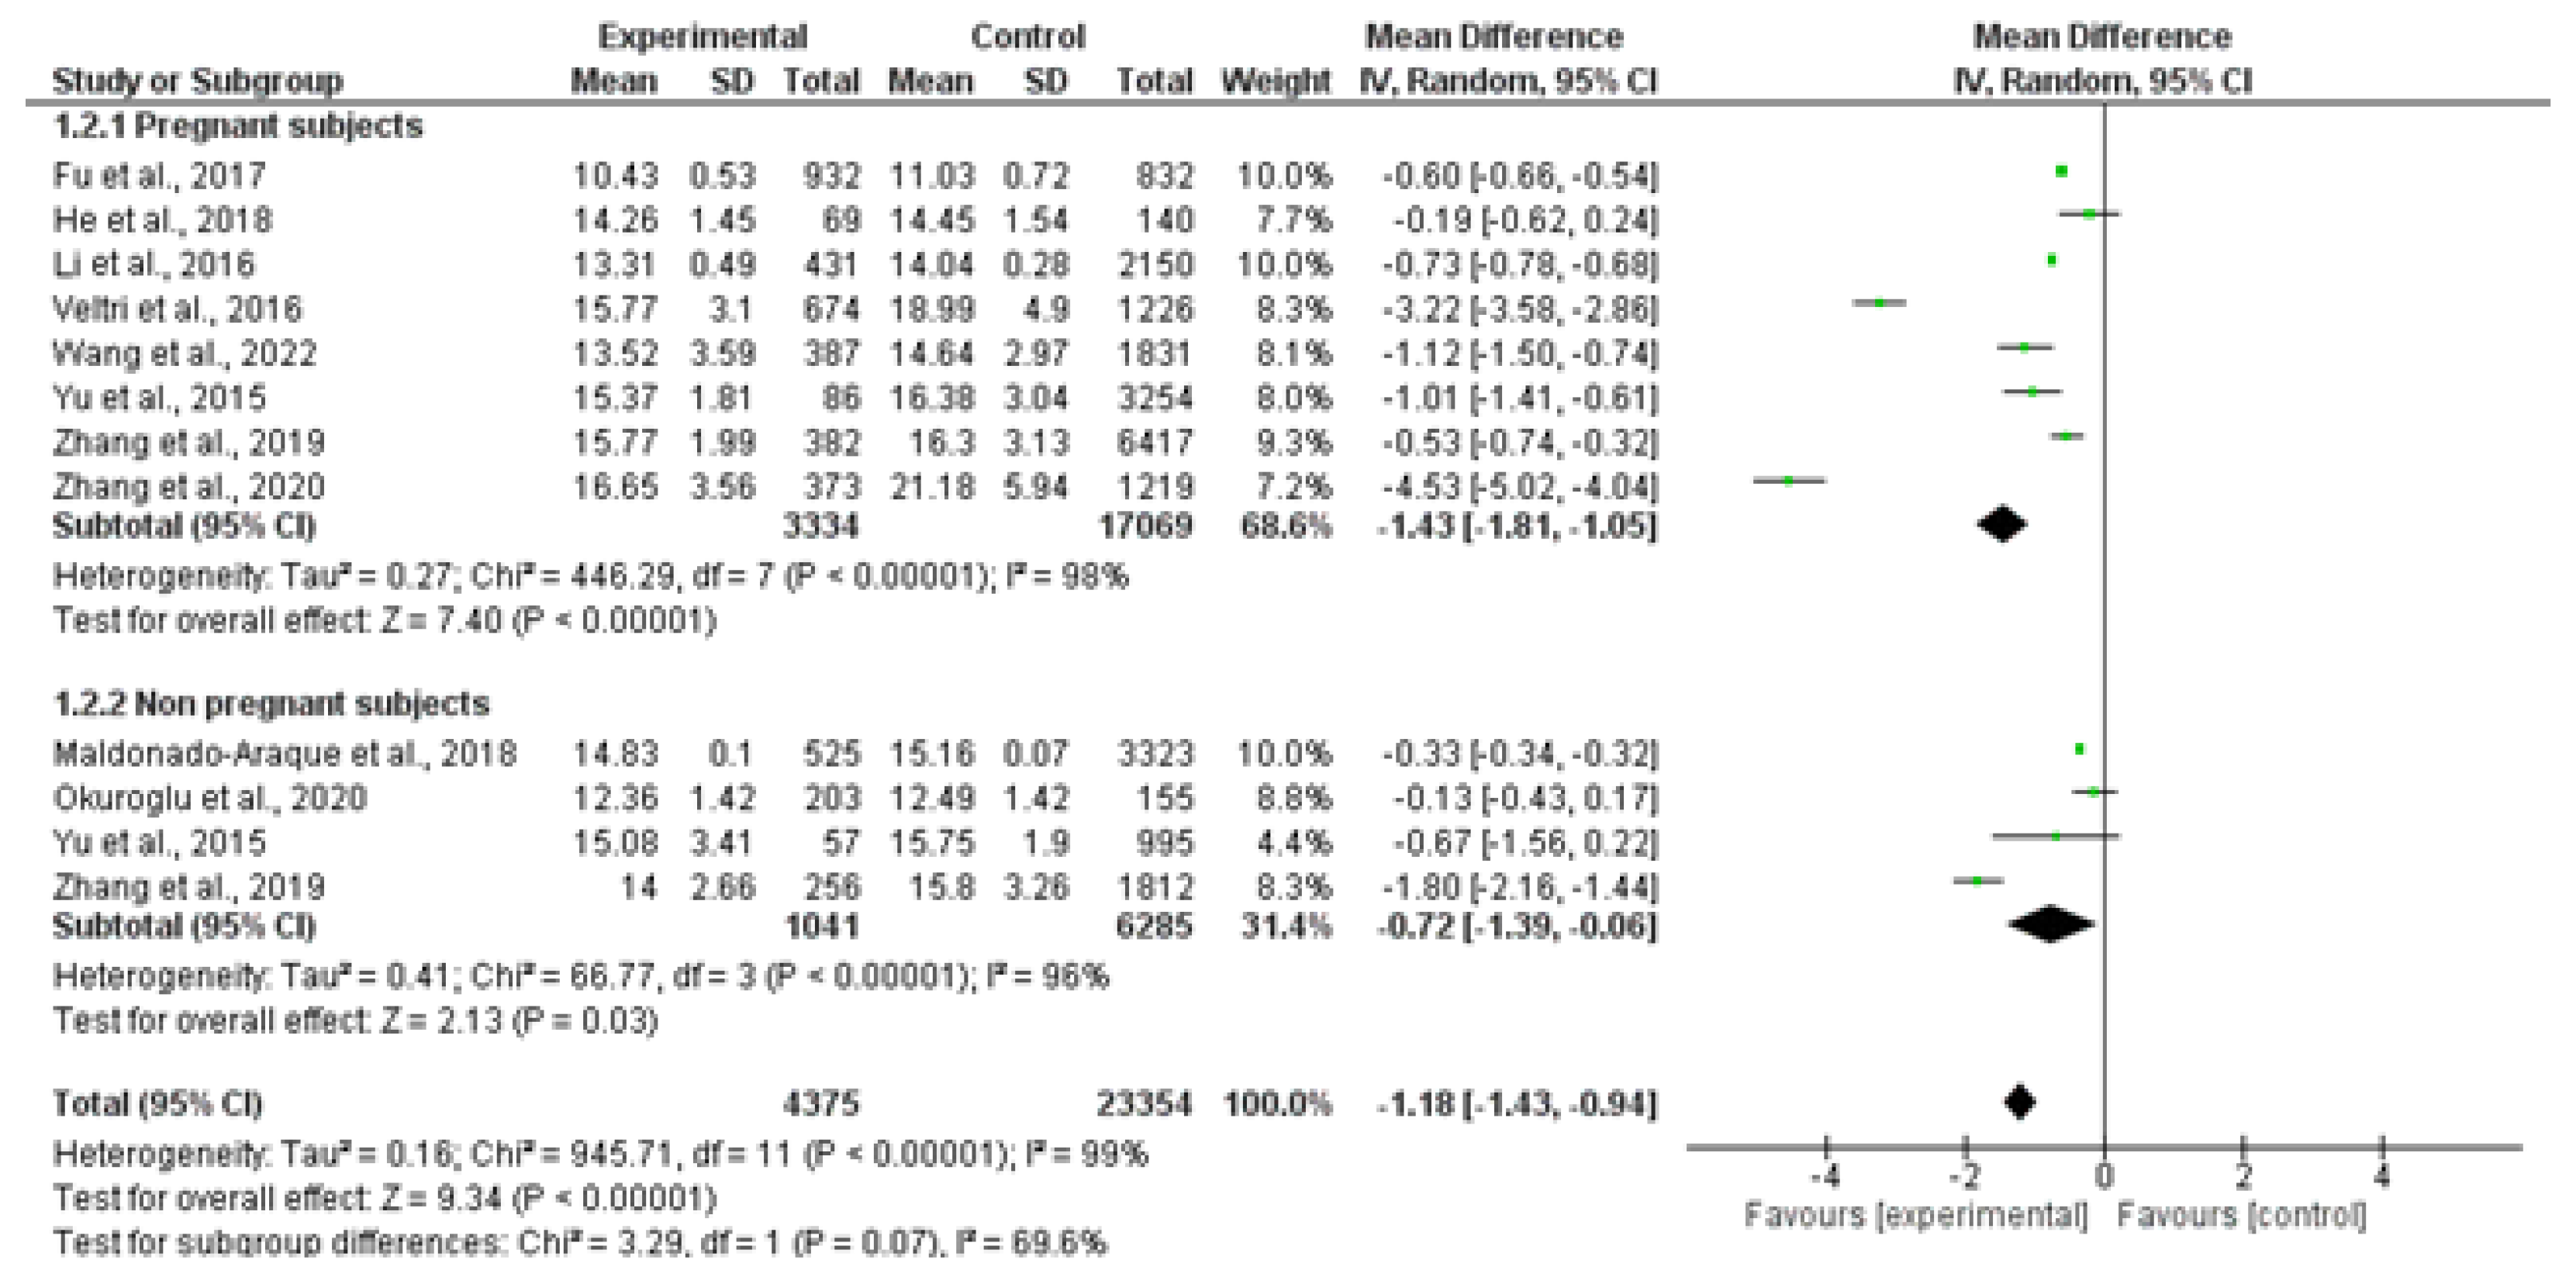
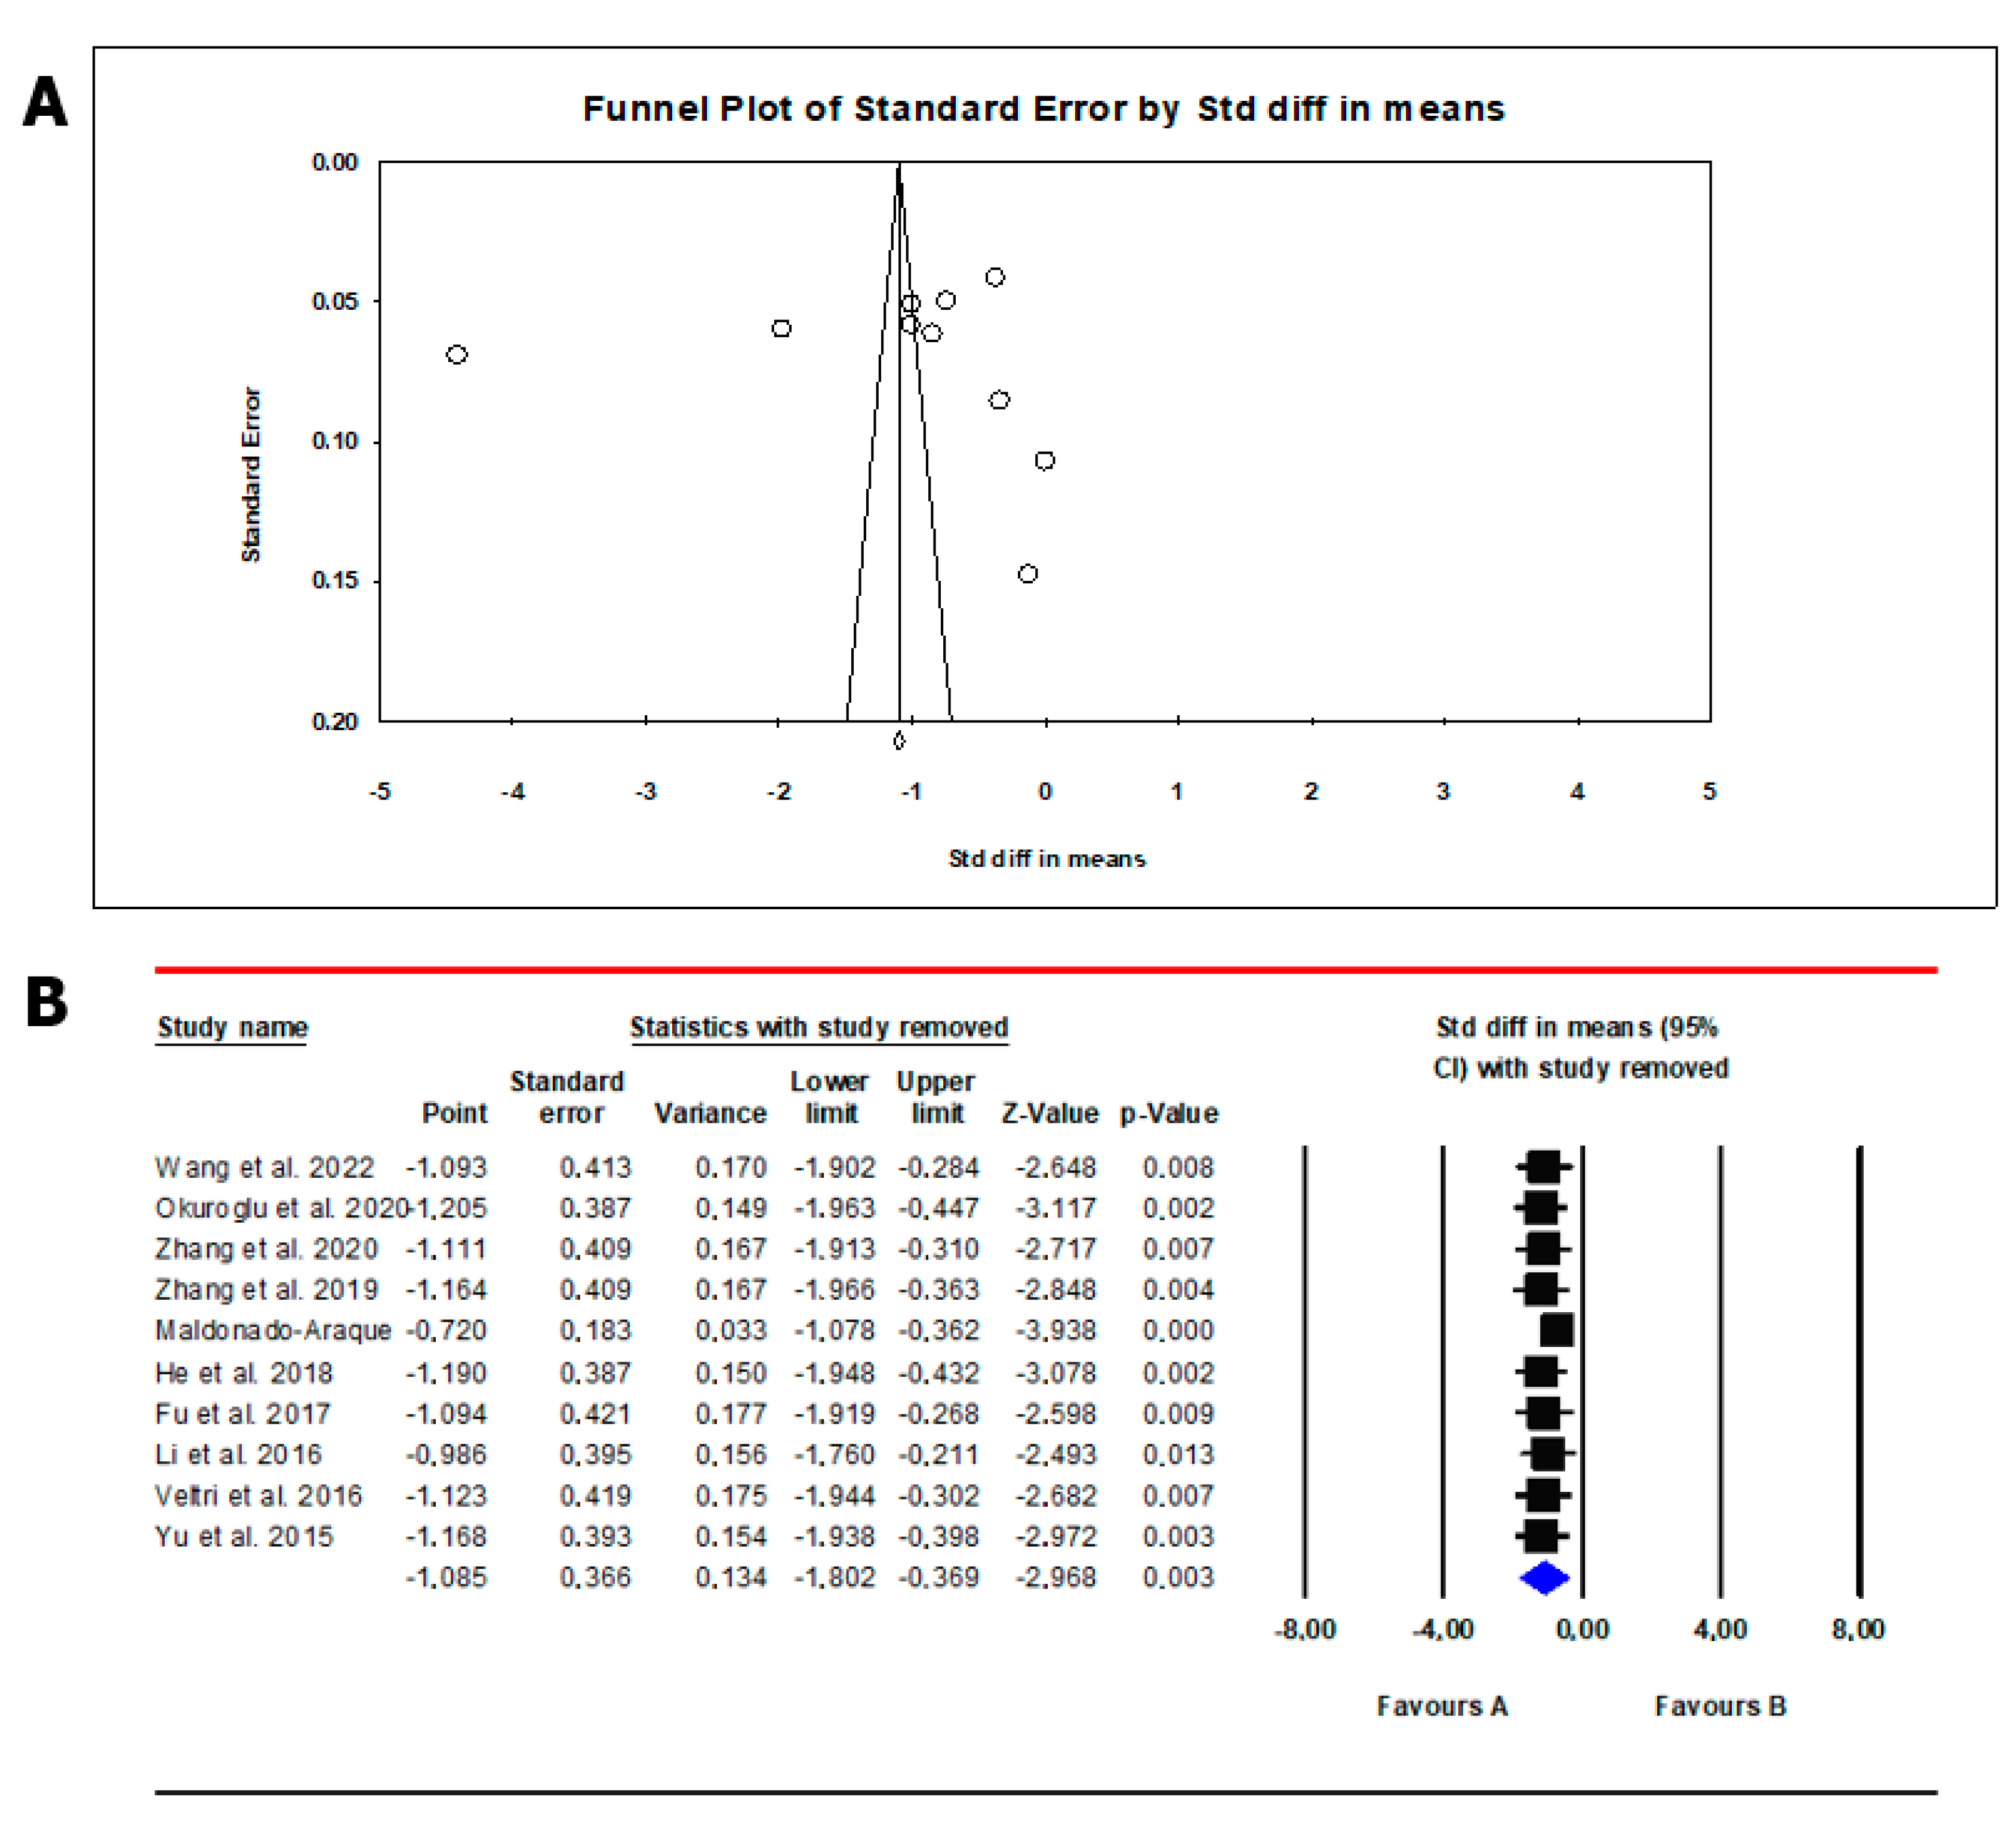
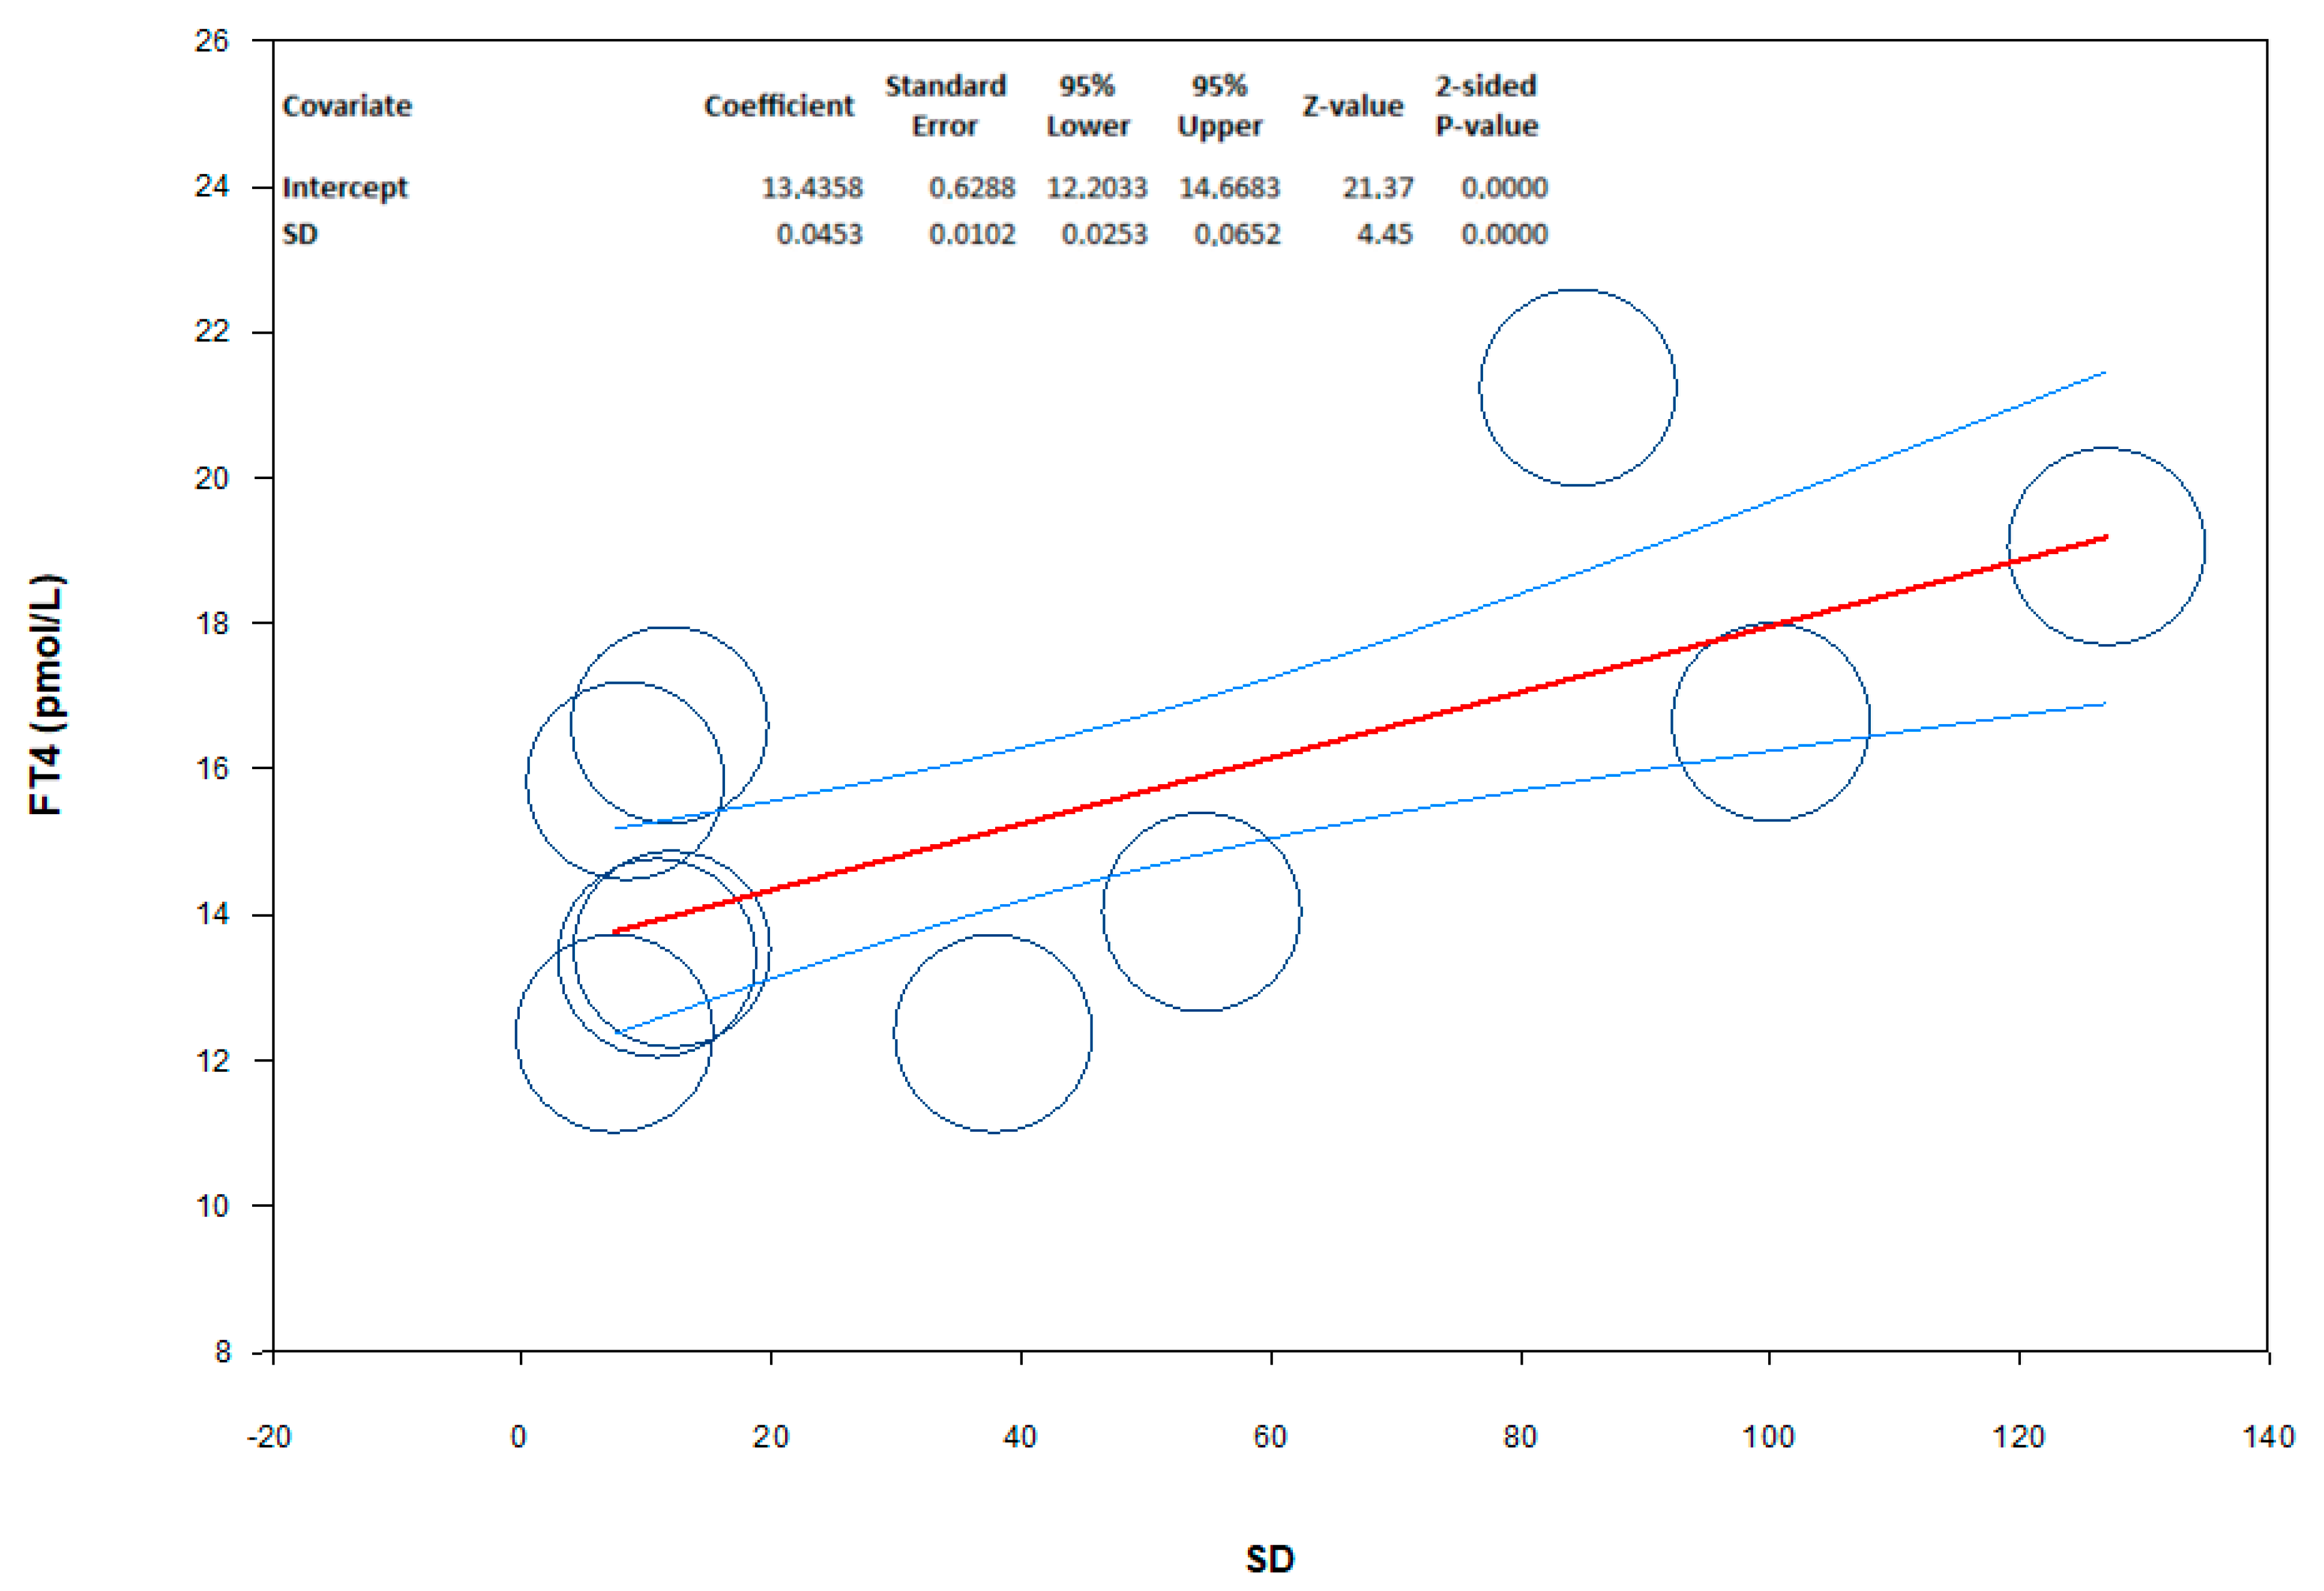
3.2.2. Free Thyroxin
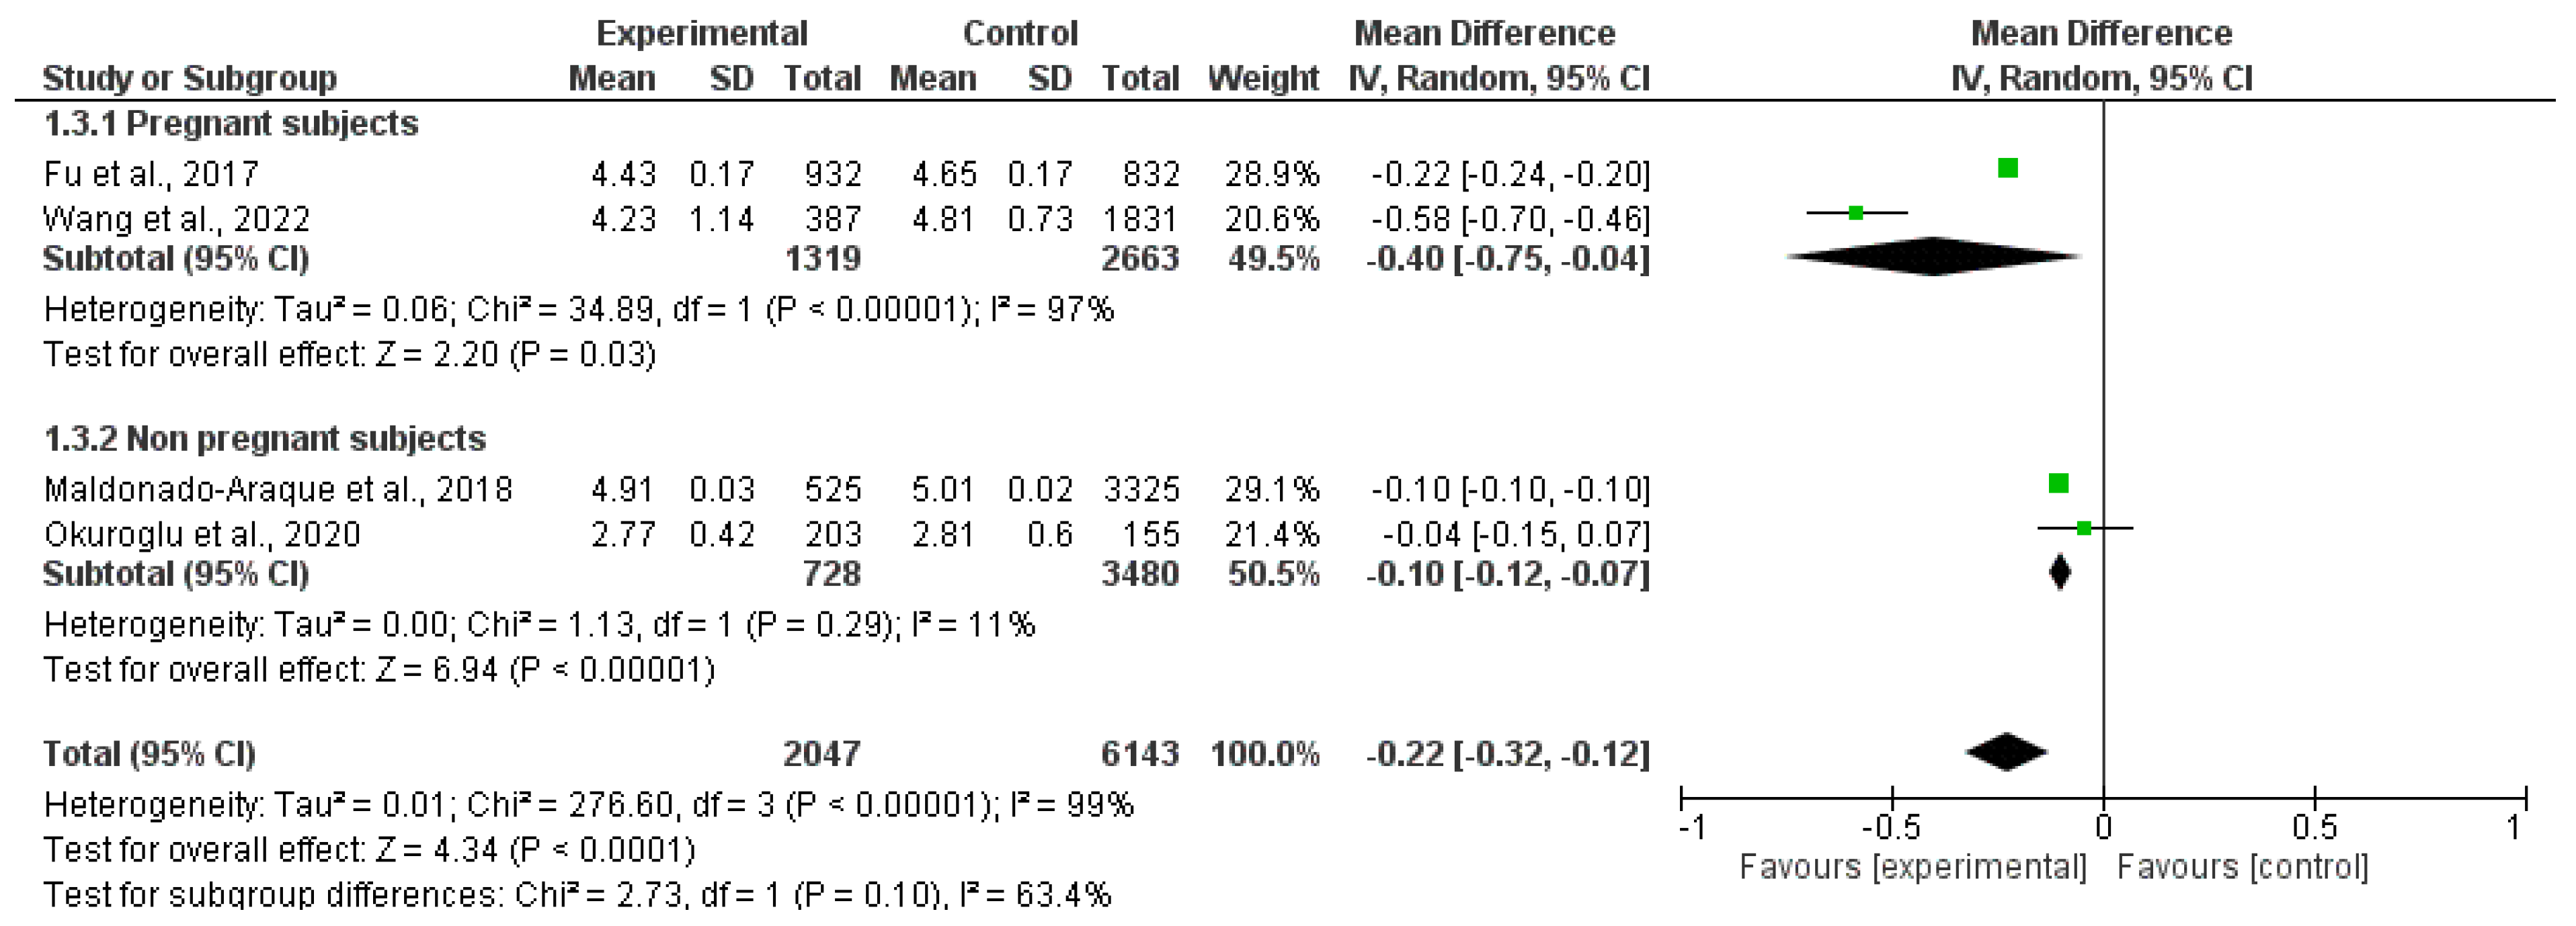
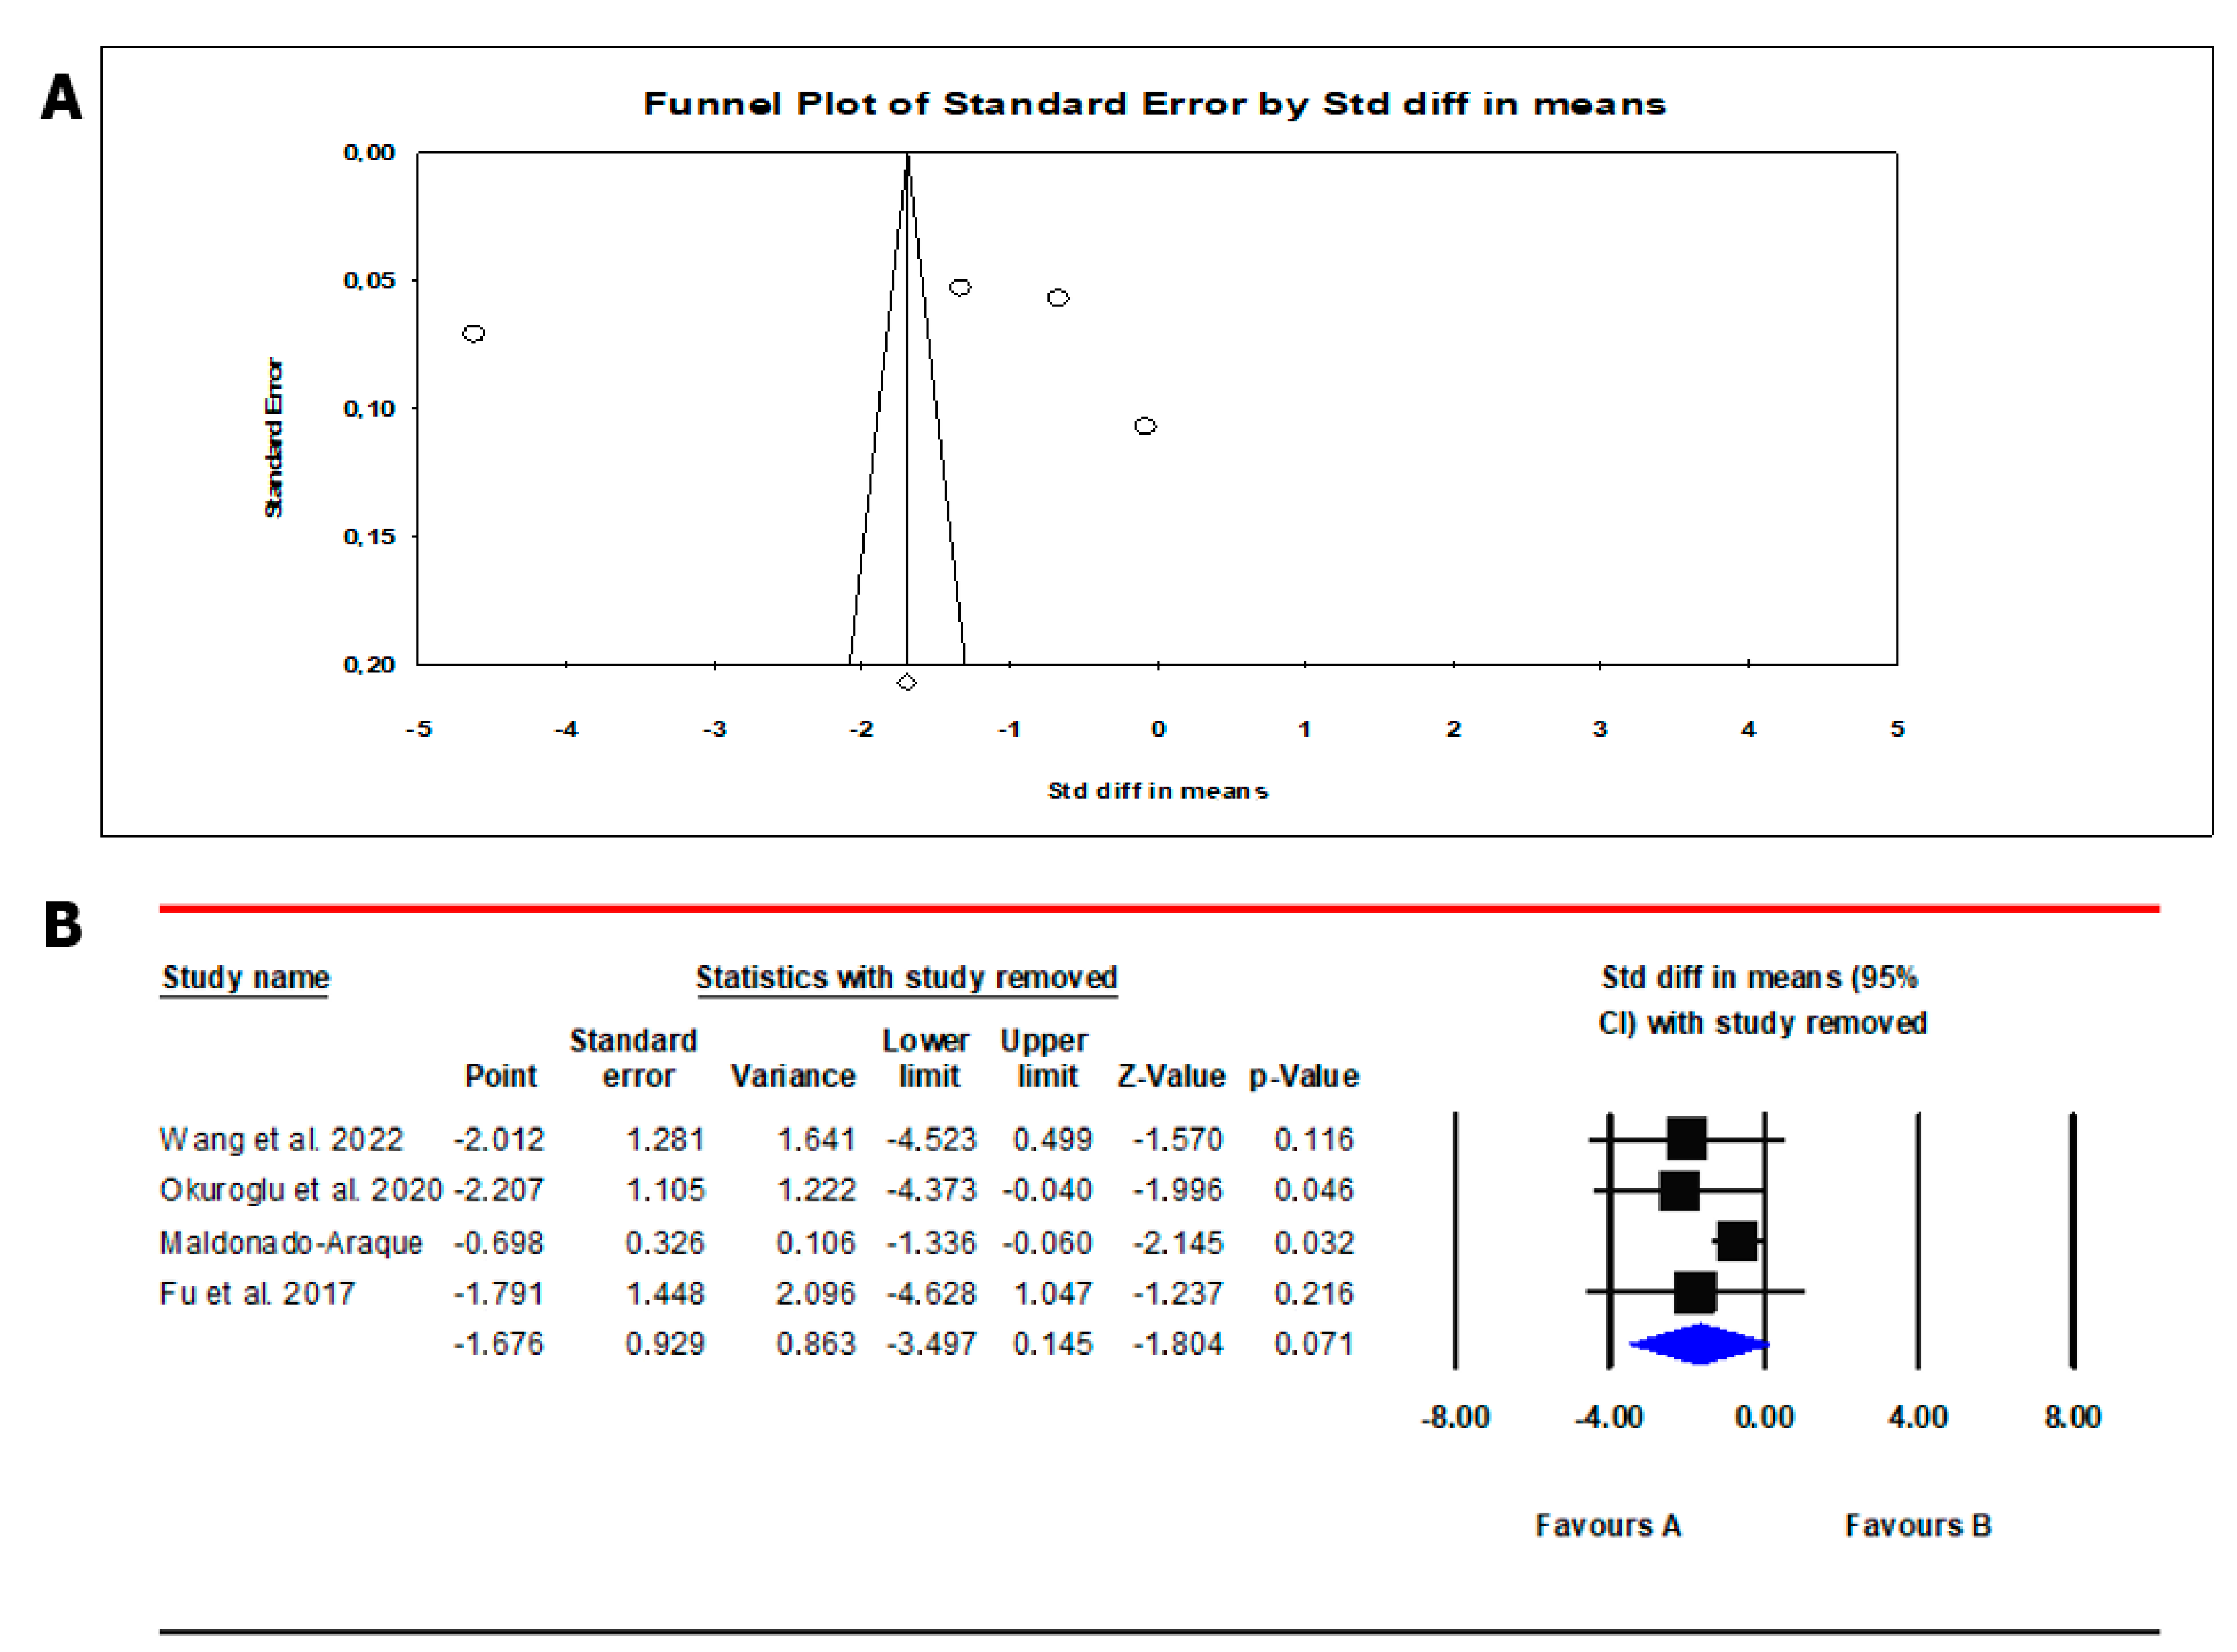
3.2.3. Free Triiodothyronine
3.3. Results of the Qualitative Synthesis
4. Discussion
Supplementary Materials
Author Contributions
Funding
Institutional Review Board Statement
Informed Consent Statement
Data Availability Statement
Conflicts of Interest
References
- Kumar, S.B.; Arnipalli, S.R.; Mehta, P.; Carrau, S.; Ziouzenkova, O. Iron Deficiency Anemia: Efficacy and Limitations of Nutritional and Comprehensive Mitigation Strategies. Nutrients 2022, 14, 2976. [Google Scholar] [CrossRef] [PubMed]
- Zimmermann, M.B.; Hurrell, R.F. Nutritional iron deficiency. Lancet 2007, 370, 511–520. [Google Scholar] [CrossRef] [PubMed]
- Pasricha, S.R.; Tye-Din, J.; Muckenthaler, M.U.; Swinkels, D.W. Iron deficiency. Lancet 2021, 397, 233–248. [Google Scholar] [CrossRef] [PubMed]
- Hess, S.Y.; Zimmermann, M.B.; Arnold, M.; Langhans, W.; Hurrell, R.F. Iron deficiency anemia reduces thyroid peroxidase activity in rats. J. Nutr. 2002, 132, 1951–1955. [Google Scholar] [CrossRef]
- Szczepanek-Parulska, E.; Hernik, A.; Ruchała, M. Anemia in thyroid diseases. Pol. Arch. Intern. Med. 2017, 127, 352–360. [Google Scholar] [CrossRef]
- Soliman, A.T.; De Sanctis, V.; Yassin, M.; Wagdy, M.; Soliman, N. Chronic anemia and thyroid function. Acta Biomed. 2017, 88, 119–127. [Google Scholar] [CrossRef]
- Golde, D.W.; Bersch, N.; Chopra, I.J.; Cline, M.J. Thyroid hormones stimulate erythropoiesis in vitro. Br. J. Haematol. 1977, 37, 173–177. [Google Scholar] [CrossRef]
- Maggio, M.; De Vita, F.; Fisichella, A.; Lauretani, F.; Ticinesi, A.; Ceresini, G.; Cappola, A.; Ferrucci, L.; Ceda, G.P. The Role of the Multiple Hormonal Dysregulation in the Onset of “Anemia of Aging”: Focus on Testosterone, IGF-1, and Thyroid Hormones. Int. J. Endocrinol. 2015, 2015, 292574. [Google Scholar] [CrossRef]
- Zimmermann, M.B. The impact of iron and selenium deficiencies on iodine and thyroid metabolism: Biochemistry and relevance to public health. Thyroid 2002, 12, 867–878. [Google Scholar] [CrossRef]
- Brigham, D.E.; Beard, J.L. Effect of thyroid hormone replacement in iron-deficient rats. Am. J. Physiol. 1995, 269 Pt. 2, R1140–R1147. [Google Scholar] [CrossRef]
- Beard, J.L.; Brigham, D.E.; Kelley, S.K.; Green, M.H. Plasma thyroid hormone kinetics are altered in iron-deficient rats. J. Nutr. 1998, 128, 1401–1408. [Google Scholar] [CrossRef] [PubMed]
- van Gucht, A.L.M.; Meima, M.E.; Moran, C.; Agostini, M.; Tylki-Szymanska, A.; Krajewska, M.W.; Chrzanowska, K.; Efthymiadou, A.; Chrysis, D.; Demir, K.; et al. Anemia in Patients with Resistance to Thyroid Hormone α: A Role for Thyroid Hormone Receptor α in Human Erythropoiesis. J. Clin. Endocrinol. Metab. 2017, 102, 3517–3525. [Google Scholar] [CrossRef] [PubMed]
- Pastori, V.; Pozzi, S.; Labedz, A.; Ahmed, S.; Ronchi, A.E. Role of Nuclear Receptors in Controlling Erythropoiesis. Int. J. Mol. Sci. 2022, 23, 2800. [Google Scholar] [CrossRef] [PubMed]
- Luo, J.; Wang, X.; Yuan, L.; Guo, L. Iron Deficiency, a Risk Factor of Thyroid Disorders in Reproductive-Age and Pregnant Women: A Systematic Review and Meta-Analysis. Front Endocrinol. 2021, 12, 629831. [Google Scholar] [CrossRef] [PubMed]
- Stroup, D.F.; Berlin, J.A.; Morton, S.C.; Olkin, I.; Williamson, G.D.; Rennie, D.; Moher, D.; Becker, B.J.; Sipe, T.A.; Thacker, S.B. Meta-analysis of observational studies in epidemiology: A proposal for reporting. Meta-analysis of 14 Observational Studies in Epidemiology (MOOSE) group. J. Am. Med. Assoc. 2000, 283, 2008–2012. [Google Scholar] [CrossRef]
- Shamseer, L.; Moher, D.; Clarke, M.; Ghersi, D.; Liberati, A.; Petticrewet, M.; Shekelle, P.; Stewart, L.A. Preferred reporting items for systematic review and meta-analysis protocols (prisma-p): Elaboration and explanation. BMJ 2015, 349, q7647. [Google Scholar] [CrossRef]
- Methley, A.M.; Campbell, S.; Chew-Graham, C.; McNally, R.; Cheraghi-Sohi, S. PICO, PICOS and SPIDER: A comparison study of specificity and sensitivity in three search tools for qualitative systematic reviews. BMC Health Serv. Res. 2014, 14, 579. [Google Scholar] [CrossRef]
- Wan, X.; Wang, W.; Liu, J.; Tong, T. Estimating the sample mean and standard deviation from the sample size, median, range and/or interquartile range. BMC Med. Res. Methodol. 2014, 14, 135. [Google Scholar] [CrossRef]
- Murray, J.; Farrington, D.P.; Eisner, M.P. Drawing conclusions about causes from systematic reviews of risk factors: The Cambridge Quality Checklists. J. Exp. Criminol. 2009, 5, 1–23. [Google Scholar] [CrossRef]
- Wang, F.; Zhang, Y.; Yuan, Z.; Li, Y.; Liu, S.; Zeng, X.; Qiu, X.; Ye, L.; Huang, D. The association between iron status and thyroid hormone levels during pregnancy. J. Trace Elem. Med. Biol. 2022, 74, 127047. [Google Scholar] [CrossRef]
- Okuroglu, N.; Ozturk, A.; Özdemir, A. Is iron deficiency a risk factor for the development of thyroid autoantibodies in euthyroid women with reproductive ages? Acta Endocrinol. 2020, 16, 49–52. [Google Scholar] [CrossRef]
- Zhang, Y.; Huang, X.; Chen, Z.; Yang, Q.; Li, X.; Zhang, R.; Yu, Z.; Li, Q.; Liu, J.; Zha, B. Iron deficiency, a risk factor for thyroid autoimmunity during second trimester of pregnancy in china. Endocr. Pract. 2020, 26, 595–603. [Google Scholar] [CrossRef] [PubMed]
- Zhang, H.Y.; Teng, X.C.; Shan, Z.Y.; Wang, Z.J.; Li, C.Y.; Yu, X.H.; Mao, J.Y.; Wang, W.W.; Xie, X.C.; Teng, W.P. Association between iron deficiency and prevalence of thyroid autoimmunity in pregnant and non-pregnant women of childbearing age: A cross-sectional study. Chin. Med. J. 2019, 132, 2143–2149. [Google Scholar] [CrossRef] [PubMed]
- He, L.; Shen, C.; Zhang, Y.; Chen, Z.; Ding, H.; Liu, J.; Zha, B. Evaluation of serum ferritin and thyroid function in the second trimester of pregnancy. Endocr. J. 2018, 65, 75–82. [Google Scholar] [CrossRef]
- Fu, J.; Yang, A.; Zhao, J.; Zhu, Y.; Gu, Y.; Xu, Y.; Chen, D. The relationship between iron level and thyroid function during the first trimester of pregnancy: A cross-sectional study in Wuxi, China. J. Trace Elem. Med. Biol. 2017, 43, 148–152. [Google Scholar] [CrossRef]
- Li, S.; Gao, X.; Wei, Y.; Zhu, G.; Yang, C. The Relationship between Iron Deficiency and Thyroid Function in Chinese Women during Early Pregnancy. J. Nutr. Sci. Vitaminol. 2016, 62, 397–401. [Google Scholar] [CrossRef]
- Veltri, F.; Decaillet, S.; Kleynen, P.; Grabczan, L.; Belhomme, J.; Rozenberg, S.; Pepersack, T.; Poppe, K. Prevalence of thyroid autoimmunity and dysfunction in women with iron deficiency during early pregnancy: Is it altered? Eur. J. Endocrinol. 2016, 175, 191–199. [Google Scholar] [CrossRef]
- Yu, X.; Shan, Z.; Li, C.; Mao, J.; Wang, W.; Xie, X.; Liu, A.; Teng, X.; Zhou, W.; Li, C.; et al. Iron deficiency, an independent risk factor for isolated hypothyroxinemia in pregnant and nonpregnant women of childbearing age in China. J. Clin. Endocrinol. Metab. 2015, 100, 1594–1601. [Google Scholar] [CrossRef]
- Maldonado-Araque, C.; Valdés, S.; Lago-Sampedro, A.; Lillo-Muñoz, J.A.; Garcia-Fuentes, E.; Perez-Valero, V.; Gutierrez-Repiso, C.; Goday, A.; Urrutia, I.; Peláez, L.; et al. Iron deficiency is associated with Hypothyroxinemia and Hypotriiodothyroninemia in the Spanish general adult population: Di@bet.es study. Sci. Rep. 2018, 8, 6571. [Google Scholar] [CrossRef]
- Page, M.J.; McKenzie, J.E.; Bossuyt, P.M.; Boutron, I.; Hoffmann, T.C.; Mulrow, C.D.; Shamseer, L.; Tetzlaff, J.M.; Akl, E.A.; Brennan, S.E.; et al. The PRISMA 2020 statement: An updated guideline for reporting systematic reviews. BMJ 2021, 372, n71. [Google Scholar] [CrossRef]
- Grabowski, M.K.; Gray, R.H.; Makumbi, F.; Kagaayi, J.; Redd, A.D.; Kigozi, G.; Reynolds, S.J.; Nalugoda, F.; Lutalo, T.; Wawer, M.J.; et al. The Global Prevalence of Anaemia in 2011; WHO: Geneva, Switzerland, 2015; Volume 126, pp. 5409–5418. [Google Scholar] [CrossRef]
- Köhrle, J. Selenium, Iodine and Iron-Essential Trace Elements for Thyroid Hormone Synthesis and Metabolism. Int. J. Mol. Sci. 2023, 24, 3393. [Google Scholar] [CrossRef] [PubMed]
- Eftekhari, M.H.; Simondon, K.B.; Jalali, M.; Keshavarz, S.A.; Elguero, E.; Eshraghian, M.R.; Saadat, N. Effects of administration of iron, iodine and simultaneous iron-plus-iodine on the thyroid hormone profile in iron-deficient adolescent Iranian girls. Eur. J. Clin. Nutr. 2006, 60, 545–552. [Google Scholar] [CrossRef] [PubMed]
- Ravanbod, M.; Asadipooya, K.; Kalantarhormozi, M.; Nabipour, I.; Omrani, G.R. Treatment of iron-deficiency anemia in patients with subclinical hypothyroidism. Am. J. Med. 2013, 126, 420–424. [Google Scholar] [CrossRef] [PubMed]
- Cinemre, H.; Bilir, C.; Gokosmanoglu, F.; Bahcebasi, T. Hematologic effects of levothyroxine in iron-deficient subclinical hypothyroid patients: A randomized, double-blind, controlled study. J. Clin. Endocrinol. Metab. 2009, 94, 151–156. [Google Scholar] [CrossRef] [PubMed]
- Prezioso, G.; Giannini, C.; Chiarelli, F. Effect of Thyroid Hormones on Neurons and Neurodevelopment. Horm. Res. Paediatr. 2018, 90, 73–81. [Google Scholar] [CrossRef]
- Allan, W.C.; Haddow, J.E.; Palomaki, G.E.; Williams, J.R.; Mitchell, M.L.; Hermos, R.J.; Faix, J.D.; Klein, R.Z. Maternal thyroid deficiency and pregnancy complications: Implications for population screening. J. Med. Screen. 2000, 7, 127–130. [Google Scholar] [CrossRef]
- Bothwell, T.H. Iron requirements in pregnancy and strategies to meet them. Am. J. Clin. Nutr. 2000, 72 (Suppl. S1), 257S–264S. [Google Scholar] [CrossRef]
- Zimmermann, M.B.; Burgi, H.; Hurrell, R.F. Iron deficiency predicts poor maternal thyroid status during pregnancy. J. Clin. Endocrinol. Metab. 2007, 92, 3436–3440. [Google Scholar] [CrossRef]
- Fuse, Y.; Ohashi, T.; Yamaguchi, S.; Yamaguchi, M.; Shishiba, Y.; Irie, M. Iodine status of pregnant and postpartum japanese women: Effect of iodine intake on maternal and neonatal thyroid function in an iodine-sufficient area. J. Clin. Endocrinol. Metab. 2011, 96, 3846–3854. [Google Scholar] [CrossRef]
- Orito, Y.; Oku, H.; Kubota, S.; Amino, N.; Shimogaki, S.; Hata, M.; Manki, K.; Tanaka, Y.; Sugino, S.; Ueta, M.; et al. Thyroid function in early pregnancy in japanese healthy women: Relation to urinary iodine excretion, emesis, and fetal and child development. J. Clin. Endocrinol. Metab. 2009, 94, 1683–1688. [Google Scholar] [CrossRef]
- Haapala, A.M.; Hyoty, H.; Parkkonen, P.; Mustonen, J.; Soppi, E. Antibody reactivity against thyroid peroxidase and myeloperoxidase in autoimmune thyroiditis and systemic vasculitis. Scand. J. Immunol. 1997, 46, 78–85. [Google Scholar] [CrossRef] [PubMed]
- Weetman, A.P. The immunopathogenesis of chronic autoimmune thyroiditis one century after hashimoto. Eur. Thyroid. J. 2013, 1, 243–250. [Google Scholar] [CrossRef]
- Guastamacchia, E.; Giagulli, V.A.; Licchelli, B.; Triggiani, V. Selenium and Iodine in Autoimmune Thyroiditis. Endocr. Metab. Immune Disord. Drug Targets 2015, 15, 288–292. [Google Scholar] [CrossRef]
- Ueda, N.; Takasawa, K. Impact of Inflammation on Ferritin, Hepcidin and the Management of Iron Deficiency Anemia in Chronic Kidney Disease. Nutrients 2018, 10, 1173. [Google Scholar] [CrossRef]
- Hernik, A.; Szczepanek-Parulska, E.; Filipowicz, D.; Abdolall, A.; Borowczyk, M.; Wrotkowska, E.; Czarnywojtek, A.; Krasiński, Z.; Ruchała, M. The hepcidin concentration decreases in hypothyroid patients with Hashimoto’s thyroiditis following restoration of euthyroidism. Sci. Rep. 2019, 9, 16222. [Google Scholar] [CrossRef]
- Chao, K.C.; Chang, C.C.; Chiou, H.Y.; Chang, J.S. Serum Ferritin Is Inversely Correlated with Testosterone in Boys and Young Male Adolescents: A Cross-Sectional Study in Taiwan. PLoS ONE 2015, 10, e0144238. [Google Scholar] [CrossRef] [PubMed]
- Liu, Z.; Ye, F.; Zhang, H.; Gao, Y.; Tan, A.; Zhang, S.; Xiao, Q.; Zhang, B.; Huang, L.; Ye, B.; et al. The association between the levels of serum ferritin and sex hormones in a large scale of Chinese male population. PLoS ONE 2013, 8, e75908. [Google Scholar] [CrossRef]
- Zafar, U.; Ali, Z.; Khaliq, S.; Lone, K.P. Correlation of insulin resistance with neutrophil to lymphocyte ratio and serum ferritin in male patients of metabolic syndrome. J. Pak. Med. Assoc. 2022, 72, 696–701. [Google Scholar] [CrossRef]
- Nwabuobi, C.; Arlier, S.; Schatz, F.; Guzeloglu-Kayisli, O.; Lockwood, C.J.; Kayisli, U.A. hCG: Biological Functions and Clinical Applications. Int. J. Mol. Sci. 2017, 18, 2037. [Google Scholar] [CrossRef]
- World Health Organization. Serum Ferritin Concentrations for the Assessment of Iron Status and Iron Deficiency in Populations; World Health Organization: Geneva, Switzerland, 2011; Available online: https://iris.who.int/handle/10665/85843 (accessed on 12 November 2023).
- Moher, D.; Liberati, A.; Tetzlaff, J.; Altman, D.G.; The PRISMA Group. Preferred Reporting Items for Systematic Reviews and Meta-Analyses: The PRISMA Statement. PLoS Med. 2009, 6, e1000097. [Google Scholar] [CrossRef]


| Inclusion | Exclusion | |
|---|---|---|
| Population | Adults, pregnant women | Patients with comorbidities or taking drugs that affect thyroid function or iron status, age < 18 years. |
| Exposure | Iron deficiency | - |
| Comparison | Subjects without ID | - |
| Outcome | TSH, FT4, FT3, TPOAb, gAb | - |
| Study Type | Cross-sectional study, randomized controlled study, case–control, cohort | In vitro, animal studies, case reports, editorials, communications, reviews, and meta-analyses |
| Type of Study | Age (y) | Type of Population | Population (n) | Diagnostic Criteria for ID (SF) | Items and Reference Range | TSH | FT4 | FT3 | TPOAb | TgAb | |||||||
|---|---|---|---|---|---|---|---|---|---|---|---|---|---|---|---|---|---|
| ID | Controls | ||||||||||||||||
| ID | Controls | ID | Controls | ID | Controls | ID | Controls | ID | Controls | ||||||||
| Wang et al., 2022 [20] | CSS | 29 (25–33) | Chinese Pregnant women | 387 | 1831 | <20 ng/dL | TSH (0.24–4.2 mIU/L), FT4 (12–22 pmol/L), FT3 (3.1–6.8 pmol/L) | 1.54 (0.92–2.35) | 0.93 (0.43–1.56) | 13.23 (11.26–16.08) | 16.58 (14.67–18.67) | 4.15 (3.51–5.04) | 4.79 (4.33–5.32) | NR | NR | NR | NR |
| Okuroglu et al., 2020 [21] | CSS | 31.5 ± 8.4 | Non-pregnant women of reproductive ages | 203 | 155 | <15 ng/dL | TSH (0.35–4.2 mIU/L), FT4 (0.58–1.64 ng/dL), FT3 (1.71–3.71 pg/mL), AbTPO (<5.6 IU/mL), AbTg (<10 IU/mL) | 1.90 ± 0.97 | 1.74 ± 0.91 | 0.96 ± 0.11 | 0.97 ± 0.11 | 2.77 ± 0.42 | 2.81 ± 0.60 | 8.37% | 3.87% | 9.85% | 7.10% |
| Zhang et al., 2020 [22] | CSS | 28.3 ± 0.1 | Chinese pregnant women | 373 | 1219 | <20 ng/dL | TSH (0.27–4.2 mIU/L), FT4 (12–22 pmol/L), AbTPO (<34 IU/mL), AbTg (<115 IU/mL) | 1.85 (0.01–7.84) | 1.69 (0.01–10.2) | 13.94 (8.91–29.82) | 14.63 (8.22–47.24) | NR | NR | 3.8% | 5.2% | 4.6% | 3.1% |
| Zhang et al., 2019 [23] | CSS | 28.3 ± 3.6 | Chinese pregnant and non-pregnant women | 638 | 8229 | <15 ng/dL | TSH (0.14–4.87 mIU/L), FT4 (NR), AbTPO (<34 IUmL), AbTg (<115 IU/mL) | 2.06 (1.17–3.09) | 1.99 (1.14–3.05) | 14.88 ± 2.32 | 16.05 ± 3.19 | NR | NR | 8.9 (5–15.6) | 8.21 (5–13.82) | 12.33 (10–42.45) | 11.35 (10–24.34) |
| Maldonado-Araque et al., 2018 [29] | CSS | 50 ± 17.1 | Spanish adult non-pregnant population | 523 | 3323 | <15 ng/dL | TSH (µUI/mL), FT4 (pmol/L), FT3 (pmol/L) | 1.98 ± 0.07 | 2.04 ± 0.04 | 14.83 ± 0.10 | 15.16 ± 0.07 | 4.91 ± 0.03 | 5.01 ± 0.02 | NR | NR | NR | NR |
| He et al., 2018 [24] | CSS | 27.2 ± 4.5 | Pregnant women | 69 | 140 | <12 ng/dL | TSH (0.27–4.2 mIU/L), FT4 (12–22 pmol/L), AbTPO (<34 IU/mL), AbTg (<115 IU/mL) | 3.25 ± 1.72 | 2.36 ± 1.48 | 14.26 ± 1.45 | 14.45 ± 1.54 | NR | NR | 9.7 (9.3–14.3) | 10.4 (9.6–14.5) | 10 (10–15.95) | 10.02 (9.2–15.09) |
| Fu et al., 2017 [25] | CSS | 27 ± 3 | Chinese pregnant women | 932 | 832 | <20 ng/dL | TSH (0.98–2.26 mIU/L), FT4 (8.85–12.25 pmol/L), FT3 (4.06–5.06 pmol/L) | 1.6 (1–2.3) | 1.4 (0.7–2.2) | 10.36 (8.8–12.2) | 10.88 (8.9–13.44) | 4.4 (3.9–5) | 4.6 (4.2–5.2) | NR | NR | NR | NR |
| Li et al., 2016 [26] | CSS | 28.5 ± 3.7 | Pregnant women | 431 | 2150 | <20 ng/dL | TSH (0.1–2.5 mIU/L), FT4 (11.5–18.8 pmol/L), AbTPO (<5.6 mIU/mL) | 1.35 (0.71–2.4) | 1.07 (0.6–1.67) | 13.22 (11.95–14.84) | 13.99 (13.12–15.07) | NR | NR | 3 (23.6%) (3–4.28) | 3 (11.2%) (3–3) | NR | NR |
| Veltri et al., 2016 [27] | CSS | 30 (15–47) | Pregnant women | 674 | 1226 | <15 ng/dL | TSH (0.3–4 mIU/L), FT4 (0.8–2 ng/dL), AbTPO (<60 kIU/L) | 1.5 (0.0–9.6) | 1.3 (0.0–30.5) | 1.0 (0.7–2.2) | 1.1 (0.6–3.1) | NR | NR | 29 (10%) (15–9704) | 28 (6%) (25–13,000) | NR | NR |
| Yu et al., 2015 [28] | CSS | 28.9 ± 3.6 | Chinese pregnant and non-pregnant women | 143 | 4249 | <12 ng/dL | TSH (0.14–4.87 mIU/L), FT4 (12.4–20.7 pmol/L) | 1.94 (1.2–2.73) | 1.92 (1.12–2.85) | 15.22 ± 2.61 | 16.06 ± 2.47 | NR | NR | NR | NR | NR | NR |
| Study Name | Type of Study | Cambridge Quality Checklists | ||
|---|---|---|---|---|
| Checklist for Correlates | Checklist for Risk Factors | Checklist for Causal Risk Factors | ||
| Wang et al., 2022 [20] | CSS | 4 | 1 | 5 |
| Okuroglu et al., 2020 [21] | CSS | 3 | 1 | 5 |
| Zhang et al., 2020 [22] | CSS | 4 | 1 | 5 |
| Zhang et al., 2019 [23] | CSS | 5 | 1 | 5 |
| Maldonado-Araque et al., 2018 [29] | CSS | 5 | 1 | 5 |
| He et al., 2018 [24] | CSS | 4 | 1 | 5 |
| Fu et al., 2017 [25] | CSS | 5 | 1 | 5 |
| Li et al., 2016 [26] | CSS | 5 | 1 | 5 |
| Veltri et al., 2016 [27] | CSS | 5 | 1 | 5 |
| Yu et al., 2015 [28] | CSS | 4 | 1 | 5 |
Disclaimer/Publisher’s Note: The statements, opinions and data contained in all publications are solely those of the individual author(s) and contributor(s) and not of MDPI and/or the editor(s). MDPI and/or the editor(s) disclaim responsibility for any injury to people or property resulting from any ideas, methods, instructions or products referred to in the content. |
© 2023 by the authors. Licensee MDPI, Basel, Switzerland. This article is an open access article distributed under the terms and conditions of the Creative Commons Attribution (CC BY) license (https://creativecommons.org/licenses/by/4.0/).
Share and Cite
Garofalo, V.; Condorelli, R.A.; Cannarella, R.; Aversa, A.; Calogero, A.E.; La Vignera, S. Relationship between Iron Deficiency and Thyroid Function: A Systematic Review and Meta-Analysis. Nutrients 2023, 15, 4790. https://doi.org/10.3390/nu15224790
Garofalo V, Condorelli RA, Cannarella R, Aversa A, Calogero AE, La Vignera S. Relationship between Iron Deficiency and Thyroid Function: A Systematic Review and Meta-Analysis. Nutrients. 2023; 15(22):4790. https://doi.org/10.3390/nu15224790
Chicago/Turabian StyleGarofalo, Vincenzo, Rosita A. Condorelli, Rossella Cannarella, Antonio Aversa, Aldo E. Calogero, and Sandro La Vignera. 2023. "Relationship between Iron Deficiency and Thyroid Function: A Systematic Review and Meta-Analysis" Nutrients 15, no. 22: 4790. https://doi.org/10.3390/nu15224790
APA StyleGarofalo, V., Condorelli, R. A., Cannarella, R., Aversa, A., Calogero, A. E., & La Vignera, S. (2023). Relationship between Iron Deficiency and Thyroid Function: A Systematic Review and Meta-Analysis. Nutrients, 15(22), 4790. https://doi.org/10.3390/nu15224790