
The Influences of Macronutrients on Bone Mineral Density, Bone Turnover Markers, and Fracture Risk in Elderly People: A Review of Human Studies


Abstract
1. Introduction
1.1. Current Position on Calcium and Vitamin D Supplementation for Fracture Risk
1.2. The Association between Bone Mineral Density and Bone Turnover Markers
1.3. The Association between Macronutrients and Bone Metabolism
1.4. The Objective of This Review
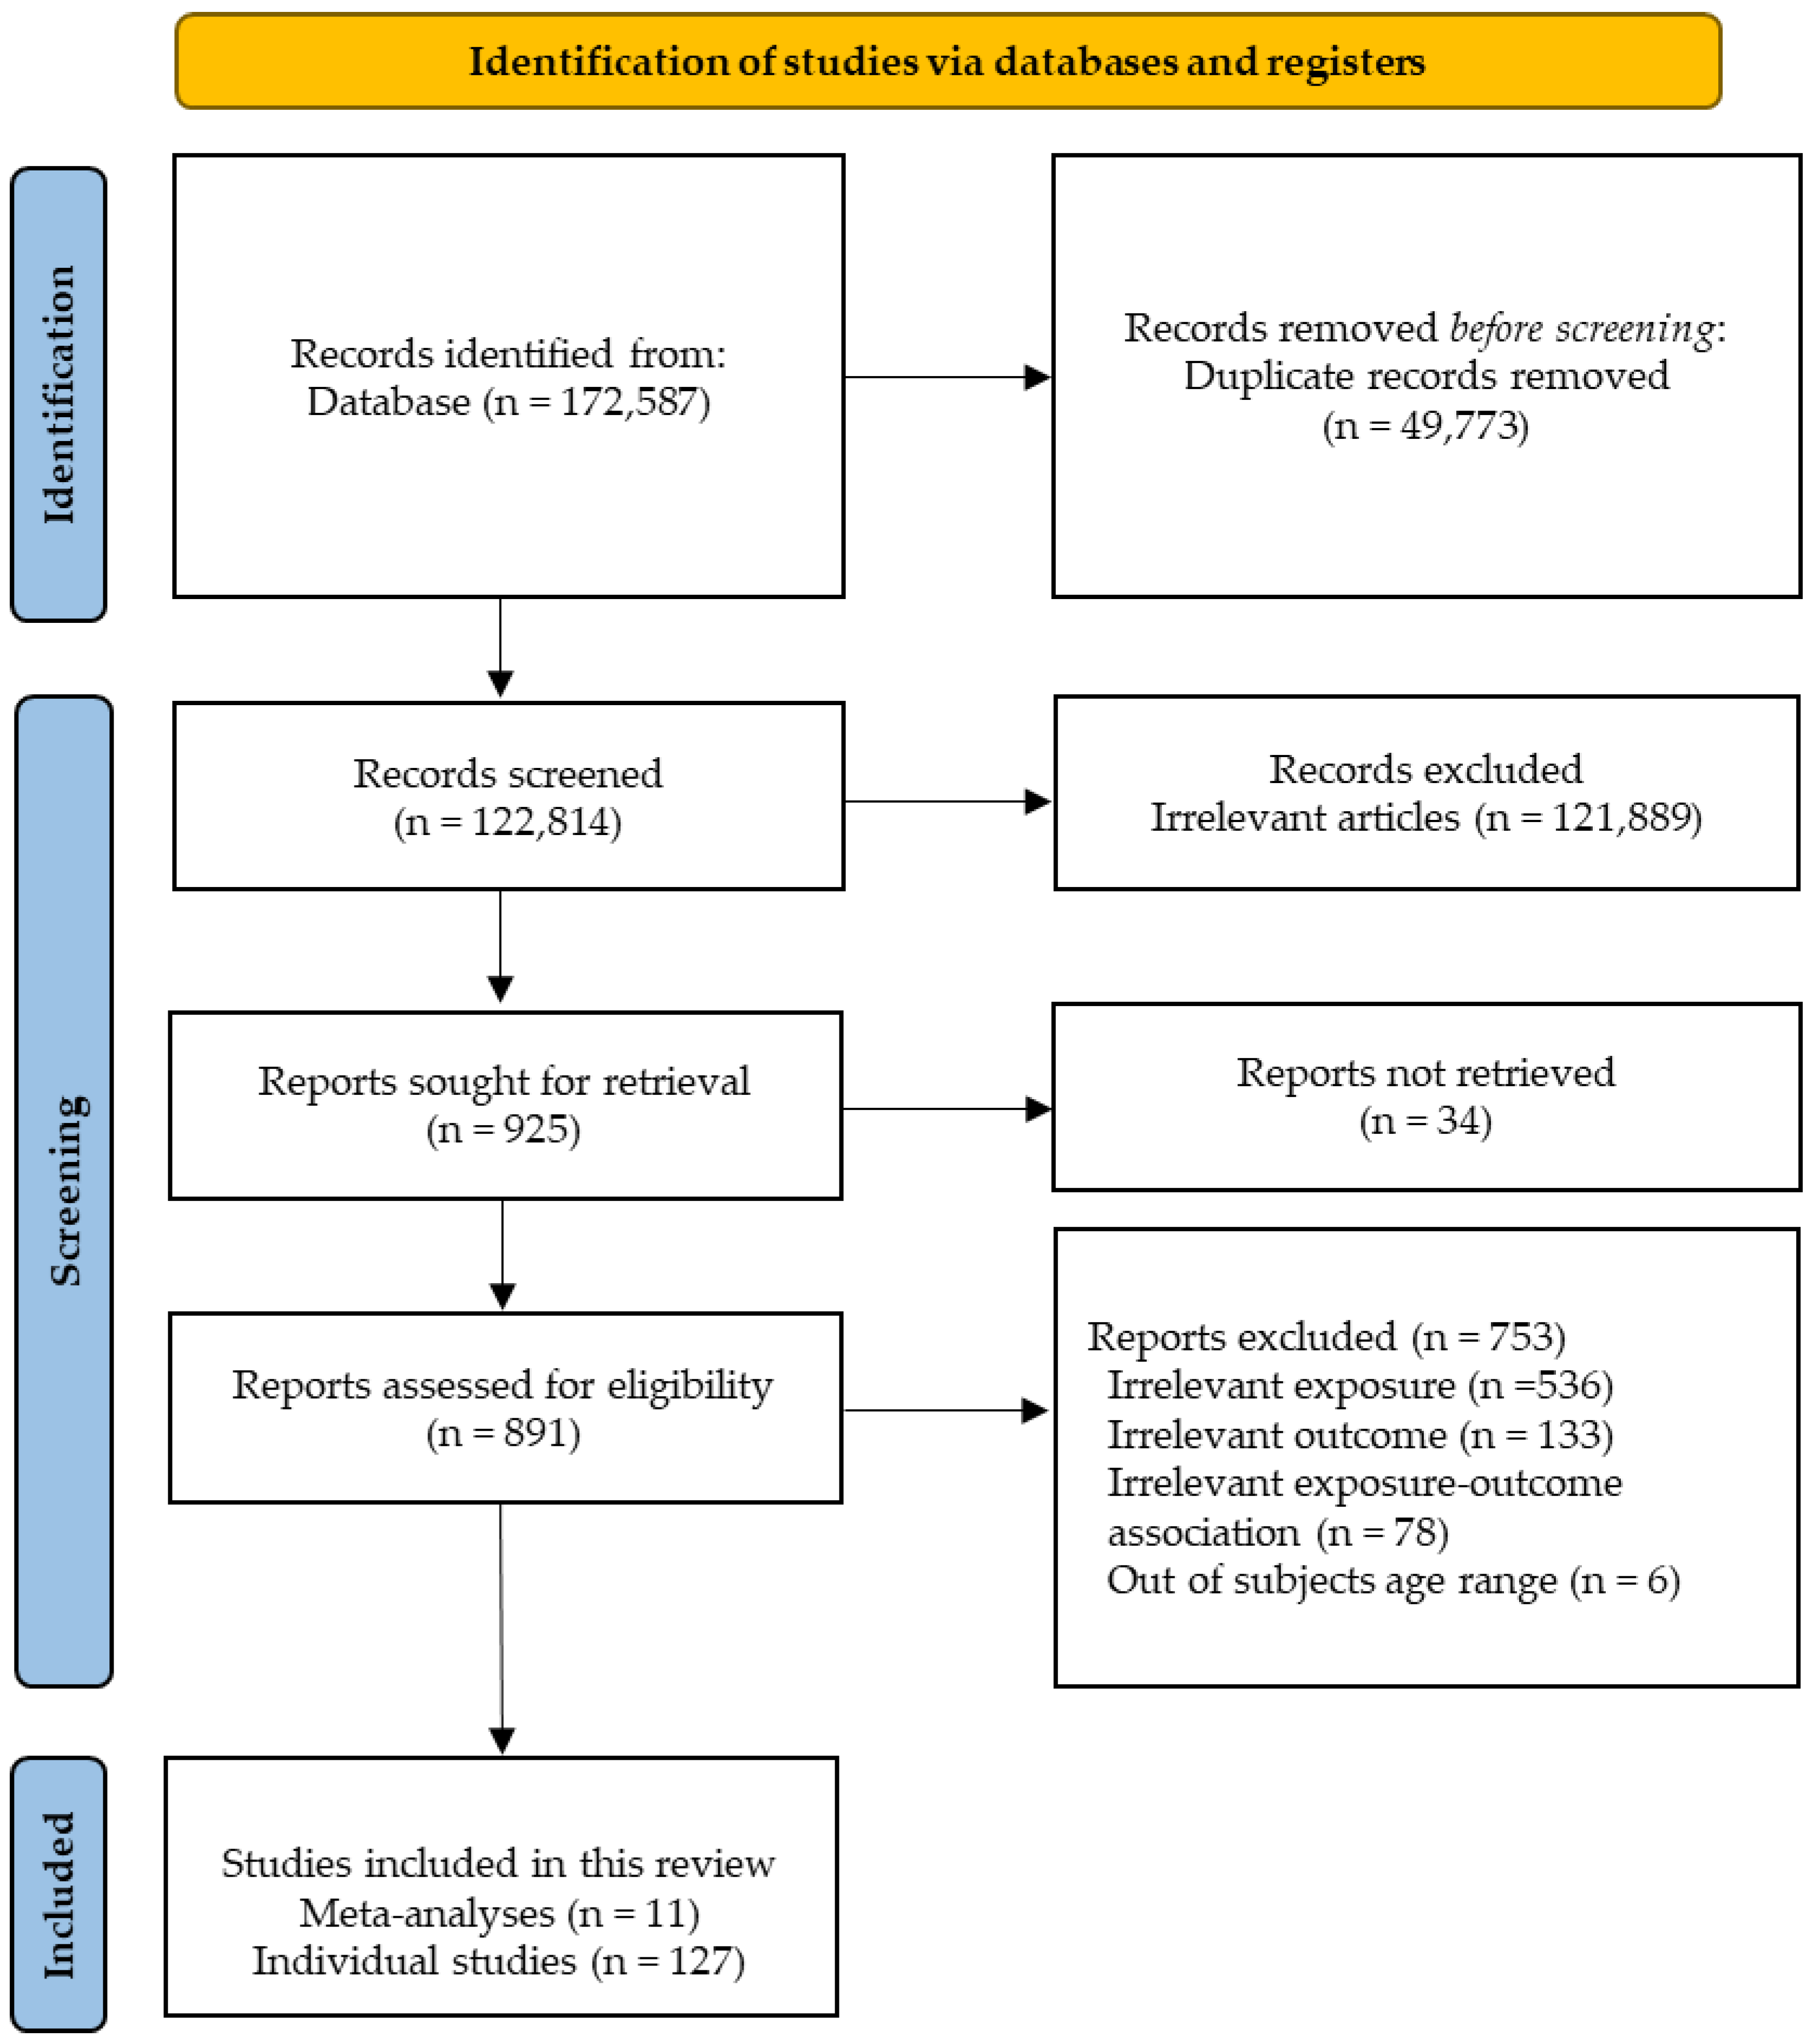
2. Methods
Rationale for Not Conducting a Meta-Analysis
3. Effects of Macronutrients on Bone Mineral Density, Bone Turnover Markers, and Bone Fracture
3.1. Carbohydrates
3.1.1. Bone Mineral Density and Bone Turnover Markers
3.1.2. Bone Fracture
3.2. Proteins
3.2.1. Bone Mineral Density
3.2.2. Bone Fracture
3.2.3. Bone Turnover Markers
3.3. Fat
3.3.1. Bone Mineral Density
3.3.2. Bone Fracture
3.3.3. Bone Turnover Markers
4. Discussion
5. Conclusions
Author Contributions
Funding
Conflicts of Interest
References
- Rachner, T.D.; Sundeep, K.; Hofbauer, L.C. Osteoporosis: Now and the future. Lancet 2011, 377, 1276–1287. [Google Scholar] [CrossRef]
- Sambrook, P.; Cooper, C. Osteoporosis. Lancet 2006, 367, 2010–2018. [Google Scholar] [CrossRef]
- Watts, N.B.; Manson, J.E. Osteoporosis and Fracture Risk Evaluation and Management: Shared Decision Making in Clinical Practice. JAMA 2017, 317, 253–254. [Google Scholar] [CrossRef]
- Svedbom, A.; Hernlund, E.; Ivergård, M.; Compston, J.; Cooper, C.; Stenmark, J.; McCloskey, E.V.; Jönsson, B.; Kanis, J.A.; EU Review Panel of IOF. Osteoporosis in the European Union: A compendium of country-specific reports. Arch. Osteoporos. 2013, 8, 137. [Google Scholar] [CrossRef]
- Kanis, J.A.; Cooper, C.; Rizzoli, R.; Reginster, J.-Y.; Scientific Advisory Board of the European Society for Clinical; Economic Aspects of Osteoporosis (ESCEO); Committees of Scientific Advisors; National Societies of the International Osteoporosis Foundation (IOF). European guidance for the diagnosis and management of osteoporosis in postmenopausal women. Osteoporos. Int. 2019, 30, 3–44. [Google Scholar] [CrossRef]
- Wright, N.C.; Looker, A.C.; Saag, K.G.; Curtis, J.R.; Delzell, E.S.; Randall, S.; Dawson-Hughes, B. The recent prevalence of osteoporosis and low bone mass in the United States based on bone mineral density at the femoral neck or lumbar spine. J. Bone Miner. Res. 2014, 29, 2520–2526. [Google Scholar] [CrossRef]
- Lane, N.E. Epidemiology, etiology, and diagnosis of osteoporosis. Am. J. Obstet. Gynecol. 2006, 194, S3–S11. [Google Scholar] [CrossRef]
- Weaver, C.M.; Gordon, C.M.; Janz, K.F.; Kalkwarf, H.J.; Lappe, J.M.; Lewis, R.; O’Karma, M.; Wallace, T.C.; Zemel, B.S. The National Osteoporosis Foundation’s position statement on peak bone mass development and lifestyle factors: A systematic review and implementation recommendations. Osteoporos. Int. J. Establ. Result Coop. Eur. Found. Osteoporos. Natl. Osteoporos. Found. USA 2016, 27, 1281–1386. [Google Scholar] [CrossRef]
- Hansen, M. Assessment of age and risk factors on bone density and bone turnover in healthy premenopausal women. Osteoporos. Int. 1994, 4, 123–128. [Google Scholar] [CrossRef]
- Kyriazopoulos, P.; Trovas, G.; Charopoulos, J.; Antonogiannakis, E.; Galanos, A.; Lyritis, G. Lifestyle factors and forearm bone density in young Greek men. Clin. Endocrinol. 2006, 65, 234–238. [Google Scholar] [CrossRef]
- Stevenson, J.; Lees, B.; Devenport, M.; Cust, M.; Ganger, K. Determinants of bone density in normal women: Risk factors for future osteoporosis? Br. Med. J. 1989, 298, 924–928. [Google Scholar] [CrossRef]
- Rizzoli, R. Nutrition: Its role in bone health. Best Prac. Res. Clin. Endocrinol. Metab. 2008, 22, 813–829. [Google Scholar] [CrossRef]
- New, S.A. Exercise, bone and nutrition. Proc. Nutr. Soc. 2001, 60, 265–274. [Google Scholar]
- Reid, I.R.; Bolland, M.J.; Grey, A. Effects of vitamin D supplements on bone mineral density: A systematic review and meta-analysis. Lancet 2014, 383, 146–155. [Google Scholar] [CrossRef]
- Kahwati, L.C.; Weber, R.P.; Pan, H.; Gourlay, M.; LeBlanc, E.; Coker-Schwimmer, M.; Viswanathan, M. Vitamin D, Calcium, or Combined Supplementation for the Primary Prevention of Fractures in Community-Dwelling Adults: Evidence Report and Systematic Review for the US Preventive Services Task Force. JAMA 2018, 319, 1600–1612. [Google Scholar] [CrossRef]
- Yao, P.; Bennett, D.; Mafham, M.; Lin, X.; Chen, Z.; Armitage, J.; Clarke, R. Vitamin D and Calcium for the Prevention of Fracture: A Systematic Review and Meta-analysis. JAMA Netw. Open 2019, 2, e1917789. [Google Scholar] [CrossRef]
- Avenell, A.; Gillespie, W.J.; Gillespie, L.D.; O’Connell, D. Vitamin D and vitamin D analogues for preventing fractures associated with involutional and post-menopausal osteoporosis. Cochrane Database Syst. Rev. 2009, 20, CD000227. [Google Scholar] [CrossRef]
- DIPART (Vitamin D Individual Patient Analysis of Randomized Trials) Group. Patient level pooled analysis of 68 500 patients from seven major vitamin D fracture trials in US and Europe. BMJ Clin. Res. Ed. 2010, 340, b5463. [Google Scholar] [CrossRef]
- Chung, M.; Lee, J.; Terasawa, T.; Lau, J.; Trikalinos, T.A. Vitamin D with or without calcium supplementation for prevention of cancer and fractures: An updated meta-analysis for the U.S. Preventive Services Task Force. Ann. Intern. Med. 2011, 155, 827–838. [Google Scholar] [CrossRef]
- Glendenning, P.; Zhu, K.; Inderjeeth, C.; Howat, P.; Lewis, J.R.; Prince, R.L. Effects of three-monthly oral 150,000 IU cholecalciferol supplementation on falls, mobility, and muscle strength in older postmenopausal women: A randomized controlled trial. J. Bone Miner. Res. 2012, 27, 170–176. [Google Scholar] [CrossRef]
- Larsen, A.U.; Grimnes, G.; Jorde, R. The effect of high-dose vitamin D 3 supplementation on bone mineral density in subjects with prediabetes. Osteoporos. Int. 2018, 29, 171–180. [Google Scholar] [CrossRef]
- Law, M.; Withers, H.; Morris, J.; Anderson, F. Vitamin D supplementation and the prevention of fractures and falls: Results of a randomised trial in elderly people in residential accommodation. Age Ageing 2006, 35, 482–486. [Google Scholar] [CrossRef]
- Meyer, H.E.; Smedshaug, G.B.; Kvaavik, E.; Falch, J.A.; Tverdal, A.; Pedersen, J.I. Can vitamin D supplementation reduce the risk of fracture in the elderly? A randomized controlled trial. J. Bone Miner. Res. 2002, 17, 709–715. [Google Scholar] [CrossRef]
- Lips, P.; Graafmans, W.C.; Ooms, M.E.; Bezemer, P.D.; Bouter, L.M. Vitamin D supplementation and fracture incidence in elderly persons: A randomized, placebo-controlled clinical trial. Ann. Intern. Med. 1996, 124, 400–406. [Google Scholar] [CrossRef]
- Trivedi, D.P.; Doll, R.; Khaw, K.T. Effect of four monthly oral vitamin D3 (cholecalciferol) supplementation on fractures and mortality in men and women living in the community: Randomised double blind controlled trial. BMJ Clin. Res. Ed. 2003, 326, 469. [Google Scholar] [CrossRef]
- Sanders, K.M.; Stuart, A.L.; Williamson, E.J.; Simpson, J.A.; Kotowicz, M.A.; Young, D.; Nicholson, G.C. Annual high-dose oral vitamin D and falls and fractures in older women: A randomized controlled trial. JAMA 2010, 303, 1815–1822. [Google Scholar] [CrossRef]
- Khaw, K.-T.; Stewart, A.W.; Waayer, D.; Lawes, C.M.; Toop, L.; Camargo, C.A., Jr.; Scragg, R. Effect of monthly high-dose vitamin D supplementation on falls and non-vertebral fractures: Secondary and post-hoc outcomes from the randomised, double-blind, placebo-controlled ViDA trial. Lancet Diabetes Endocrinol. 2017, 5, 438–447. [Google Scholar] [CrossRef]
- Group, R.T. Oral vitamin D3 and calcium for secondary prevention of low-trauma fractures in elderly people (Randomised Evaluation of Calcium Or vitamin D, RECORD): A randomised placebo-controlled trial. Lancet 2005, 365, 1621–1628. [Google Scholar]
- Lyons, R.A.; Johansen, A.; Brophy, S.; Newcombe, R.G.; Phillips, C.; Lervy, B.; Evans, R.; Wareham, K.; Stone, M.D. Preventing fractures among older people living in institutional care: A pragmatic randomised double blind placebo controlled trial of vitamin D supplementation. Osteoporos. Int. 2007, 18, 811–818. [Google Scholar] [CrossRef]
- Smith, H.; Anderson, F.; Raphael, H.; Maslin, P.; Crozier, S.; Cooper, C. Effect of annual intramuscular vitamin D on fracture risk in elderly men and women—A population-based, randomized, double-blind, placebo-controlled trial. Rheumatology 2007, 46, 1852–1857. [Google Scholar] [CrossRef]
- Chapuy, M.; Pamphile, R.; Paris, E.; Kempf, C.; Schlichting, M.; Arnaud, S.; Garnero, P.; Meunier, P. Combined calcium and vitamin D3 supplementation in elderly women: Confirmation of reversal of secondary hyperparathyroidism and hip fracture risk: The Decalyos II study. Osteoporos. Int. 2002, 13, 257–264. [Google Scholar] [CrossRef]
- Porthouse, J.; Cockayne, S.; King, C.; Saxon, L.; Steele, E.; Aspray, T.; Baverstock, M.; Birks, Y.; Dumville, J.; Francis, R.; et al. Randomised controlled trial of calcium and supplementation with cholecalciferol (vitamin D3) for prevention of fractures in primary care. BMJ Clin. Res. Ed. 2005, 330, 1003. [Google Scholar] [CrossRef]
- Salovaara, K.; Tuppurainen, M.; Kärkkäinen, M.; Rikkonen, T.; Sandini, L.; Sirola, J.; Honkanen, R.; Alhava, E.; Kröger, H. Effect of vitamin D(3) and calcium on fracture risk in 65- to 71-year-old women: A population-based 3-year randomized, controlled trial—The OSTPRE-FPS. J. Bone Min. Res. 2010, 25, 1487–1495. [Google Scholar] [CrossRef]
- Chapuy, M.C.; Arlot, M.E.; Duboeuf, F.; Brun, J.; Crouzet, B.; Arnaud, S.; Delmas, P.D.; Meunier, P.J. Vitamin D3 and calcium to prevent hip fractures in elderly women. N. Engl. J. Med. 1992, 327, 1637–1642. [Google Scholar] [CrossRef]
- Jackson, R.D.; LaCroix, A.Z.; Gass, M.; Wallace, R.B.; Robbins, J.; Lewis, C.E.; Bassford, T.; Beresford, S.A.; Black, H.R.; Blanchette, P.; et al. Calcium plus vitamin D supplementation and the risk of fractures. N. Engl. J. Med. 2006, 354, 669–683. [Google Scholar] [CrossRef] [PubMed]
- Dawson-Hughes, B.; Harris, S.S.; Krall, E.A.; Dallal, G.E. Effect of calcium and vitamin D supplementation on bone density in men and women 65 years of age or older. N. Engl. J. Med. 1997, 337, 670–676. [Google Scholar] [CrossRef] [PubMed]
- Flicker, L.; MacInnis, R.J.; Stein, M.S.; Scherer, S.C.; Mead, K.E.; Nowson, C.A.; Thomas, J.; Lowndes, C.; Hopper, J.L.; Wark, J.D. Should older people in residential care receive vitamin D to prevent falls? Results of a randomized trial. J. Am. Geriatr. Soc. 2005, 53, 1881–1888. [Google Scholar] [CrossRef]
- Koumulainen, M.; Kroger, H.; Tupperainen, M. HRT and Vit D in prevention of nonvertebral fractures in postmenopausal women: A 5 year randomised trial. Maturitas 1998, 31, 45–54. [Google Scholar] [CrossRef]
- Harwood, R.H.; Sahota, O.; Gaynor, K.; Masud, T.; Hosking, D.J. A randomised, controlled comparison of different calcium and vitamin D supplementation regimens in elderly women after hip fracture: The Nottingham Neck of Femur (NONOF) Study. Age Ageing 2004, 33, 45–51. [Google Scholar] [CrossRef]
- Pfeifer, M.; Begerow, B.; Minne, H.W.; Abrams, C.; Nachtigall, D.; Hansen, C. Effects of a short-term vitamin D and calcium supplementation on body sway and secondary hyperparathyroidism in elderly women. J. Bone Miner. Res. 2000, 15, 1113–1118. [Google Scholar] [CrossRef] [PubMed]
- Punthakee, Z.; Bosch, J.; Dagenais, G.; Diaz, R.; Holman, R.; Probstfield, J.L.; Ramachandran, A.; Riddle, M.C.; Rydén, L.E.; Zinman, B.; et al. Design, history and results of the Thiazolidinedione Intervention with vitamin D Evaluation (TIDE) randomised controlled trial. Diabetologia 2012, 55, 36–45. [Google Scholar]
- Aloia, J.F.; Dhaliwal, R.; Shieh, A.; Mikhail, M.; Islam, S.; Yeh, J.K. Calcium and vitamin D supplementation in postmenopausal women. J. Clin. Endocrinol. Metab. 2013, 98, E1702–E1709. [Google Scholar] [CrossRef][Green Version]
- Massart, A.; Debelle, F.D.; Racapé, J.; Gervy, C.; Husson, C.; Dhaene, M.; Wissing, K.M.; Nortier, J.L. Biochemical parameters after cholecalciferol repletion in hemodialysis: Results from the VitaDial randomized trial. Am. J. Kidney Dis. 2014, 64, 696–705. [Google Scholar] [CrossRef]
- Liu, B.-X.; Chen, S.-P.; Li, Y.-D.; Wang, J.; Zhang, B.; Lin, Y.; Guan, J.-H.; Cai, Y.-F.; Liang, Z.; Zheng, F. The effect of the modified eighth section of eight-section brocade on osteoporosis in postmenopausal women: A prospective randomized trial. Medicine 2015, 94, e991. [Google Scholar] [CrossRef]
- Uusi-Rasi, K.; Patil, R.; Karinkanta, S.; Kannus, P.; Tokola, K.; Lamberg-Allardt, C.; Sievänen, H. Exercise and vitamin D in fall prevention among older women: A randomized clinical trial. JAMA Intern. Med. 2015, 175, 703–711. [Google Scholar] [CrossRef] [PubMed]
- Hin, H.; Tomson, J.; Newman, C.; Kurien, R.; Lay, M.; Cox, J.; Sayer, J.; Hill, M.; Emberson, J.; Armitage, J. Optimum dose of vitamin D for disease prevention in older people: BEST-D trial of vitamin D in primary care. Osteoporos. Int. 2017, 28, 841–851. [Google Scholar] [CrossRef]
- Xue, Y.; Hu, Y.; Wang, O.; Wang, C.; Han, G.; Shen, Q.; Deng, H.; Jiang, Y.; Li, M.; Xia, W. Effects of enhanced exercise and combined vitamin D and calcium supplementation on muscle strength and fracture risk in postmenopausal Chinese women. Zhongguo Yi Xue Ke Xue Yuan Xue Bao/Acta Acad. Med. Sin. 2017, 39, 345–351. [Google Scholar]
- Inkovaara, J.; Gothoni, G.; Halttula, R.; Heikinheimo, R.; Tokola, O. Calcium, vitamin D and anabolic steroid in treatment of aged bones: Double-blind placebo-controlled long-term clinical trial. Age Ageing 1983, 12, 124–130. [Google Scholar] [CrossRef] [PubMed]
- Hanson, T.; Roos, B. The effect of fluoride and calcium on spinal bone mineral content: A controlled, prospective study. Calcif. Tissue Int. 1987, 40, 315. [Google Scholar] [CrossRef]
- Reid, I.R.; Ames, R.W.; Evans, M.C.; Gamble, G.D.; Sharpe, S.J. Effect of calcium supplementation on bone loss in postmenopausal women. N. Engl. J. Med. 1993, 328, 460–464. [Google Scholar] [CrossRef]
- Recker, R.R.; Hinders, S.; Davies, K.M.; Heaney, R.P.; Stegman, M.R.; Lappe, J.M.; Kimmel, D.B. Correcting calcium nutritional deficiency prevents spine fractures in elderly women. J. Bone Miner. Res. 1996, 11, 1961–1966. [Google Scholar] [CrossRef] [PubMed]
- Riggs, B.L.; O’Fallon, W.M.; Muhs, J.; O’Connor, M.K.; Kumar, R.; Melton, L.J., 3rd. Long-term effects of calcium supplementation on serum parathyroid hormone level, bone turnover, and bone loss in elderly women. J. Bone Miner. Res. 1998, 13, 168–174. [Google Scholar] [CrossRef] [PubMed]
- Baron, J.A.; Beach, M.; Mandel, J.S.; van Stolk, R.U.; Haile, R.W.; Sandler, R.S.; Rothstein, R.; Summers, R.W.; Snover, D.C.; Beck, G.J.; et al. Calcium supplements for the prevention of colorectal adenomas. Calcium Polyp Prevention Study Group. N. Engl. J. Med. 1999, 340, 101–107. [Google Scholar] [CrossRef] [PubMed]
- Ruml, L.A.; Sakhaee, K.; Peterson, R.; Adams-Huet, B.; Pak, C.Y. The effect of calcium citrate on bone density in the early and mid-postmenopausal period: A randomized placebo-controlled study. Am. J. Ther. 1999, 6, 303–311. [Google Scholar] [CrossRef]
- Peacock, M.; Liu, G.; Carey, M.; McClintock, R.; Ambrosius, W.; Hui, S.; Johnston, C.C. Effect of calcium or 25OH vitamin D3 dietary supplementation on bone loss at the hip in men and women over the age of 60. J. Clin. Endocrinol. Metab. 2000, 85, 3011–3019. [Google Scholar] [CrossRef]
- Avenell, A.; Grant, A.M.; McGee, M.; McPherson, G.; Campbell, M.K.; McGee, M.A. The effects of an open design on trial participant recruitment, compliance and retention—A randomized controlled trial comparison with a blinded, placebo-controlled design. Clin. Trials 2004, 1, 490–498. [Google Scholar] [CrossRef]
- Prince, R.L.; Devine, A.; Dhaliwal, S.S.; Dick, I.M. Effects of calcium supplementation on clinical fracture and bone structure: Results of a 5-year, double-blind, placebo-controlled trial in elderly women. Arch. Intern. Med. 2006, 166, 869–875. [Google Scholar] [CrossRef]
- Reid, I.R.; Mason, B.; Horne, A.; Ames, R.; Reid, H.E.; Bava, U.; Bolland, M.J.; Gamble, G.D. Randomized controlled trial of calcium in healthy older women. Am. J. Med. 2006, 119, 777–785. [Google Scholar] [CrossRef]
- Bolton-Smith, C.; McMurdo, M.E.; Paterson, C.R.; Mole, P.A.; Harvey, J.M.; Fenton, S.T.; Prynne, C.J.; Mishra, G.D.; Shearer, M.J. Two-year randomized controlled trial of vitamin K1 (phylloquinone) and vitamin D3 plus calcium on the bone health of older women. J. Bone Miner. Res. 2007, 22, 509–519. [Google Scholar] [CrossRef]
- Mitri, J.; Dawson-Hughes, B.; Hu, F.B.; Pittas, A.G. Effects of vitamin D and calcium supplementation on pancreatic β cell function, insulin sensitivity, and glycemia in adults at high risk of diabetes: The Calcium and Vitamin D for Diabetes Mellitus (CaDDM) randomized controlled trial. Am. J. Clin. Nutr. 2011, 94, 486–494. [Google Scholar] [CrossRef]
- Witham, M.D.; Price, R.J.; Struthers, A.D.; Donnan, P.T.; Messow, C.M.; Ford, I.; McMurdo, M.E. Cholecalciferol treatment to reduce blood pressure in older patients with isolated systolic hypertension: The VitDISH randomized controlled trial. JAMA Intern. Med. 2013, 173, 1672–1679. [Google Scholar] [CrossRef] [PubMed]
- Zhao, J.G.; Zeng, X.T.; Wang, J.; Liu, L. Association Between Calcium or Vitamin D Supplementation and Fracture Incidence in Community-Dwelling Older Adults: A Systematic Review and Meta-analysis. JAMA 2017, 318, 2466–2482. [Google Scholar] [CrossRef]
- Vasikaran, S.; Eastell, R.; Bruyère, O.; Foldes, A.J.; Garnero, P.; Griesmacher, A.; McClung, M.; Morris, H.A.; Silverman, S.; Trenti, T.; et al. Markers of bone turnover for the prediction of fracture risk and monitoring of osteoporosis treatment: A need for international reference standards. Osteoporos. Int. J. Establ. Result Coop. Eur. Found. Osteoporos. Natl. Osteoporos. Found. USA 2011, 22, 391–420. [Google Scholar] [CrossRef] [PubMed]
- Mederle, O.A.; Balas, M.; Ioanoviciu, S.D.; Gurban, C.V.; Tudor, A.; Borza, C. Correlations between bone turnover markers, serum magnesium and bone mass density in postmenopausal osteoporosis. Clin. Interv. Aging 2018, 13, 1383–1389. [Google Scholar] [CrossRef]
- Bonnick, S.L.; Shulman, L. Monitoring osteoporosis therapy: Bone mineral density, bone turnover markers, or both? Am. J. Med. 2006, 119, S25–S31. [Google Scholar] [CrossRef] [PubMed]
- Shetty, S.; Kapoor, N.; Bondu, J.D.; Thomas, N.; Paul, T.V. Bone turnover markers: Emerging tool in the management of osteoporosis. Indian J. Endocrinol. Metab. 2016, 20, 846. [Google Scholar]
- Naylor, K.; Eastell, R. Bone turnover markers: Use in osteoporosis. Nat. Rev. Rheumatol. 2012, 8, 379–389. [Google Scholar] [CrossRef]
- Eastell, R.; Szulc, P. Use of bone turnover markers in postmenopausal osteoporosis. Lancet Diabetes Endocrinol. 2017, 5, 908–923. [Google Scholar] [CrossRef]
- Brown, J.P.; Don-Wauchope, A.; Douville, P.; Albert, C.; Vasikaran, S.D. Current use of bone turnover markers in the management of osteoporosis. Clin. Biochem. 2022, 109–110, 1–10. [Google Scholar] [CrossRef]
- Isley, W.L.; Underwood, L.E.; Clemmons, D.R. Dietary components that regulate serum somatomedin-C concentrations in humans. J. Clin. Investig. 1983, 71, 175–182. [Google Scholar] [CrossRef]
- Clemmons, D.; Underwood, L.; Dickerson, R.; Brown, R.; Hak, L.; MacPhee, R.; Heizer, W. Use of plasma somatomedin-C/insulin-like growth factor I measurements to monitor the response to nutritional repletion in malnourished patients. Am. J. Clin. Nutr. 1985, 41, 191–198. [Google Scholar] [CrossRef]
- Calvez, J.; Poupin, N.; Chesneau, C.; Lassale, C.; Tome, D. Protein intake, calcium balance and health consequences. Eur. J. Clin. Nutr. 2012, 66, 281–295. [Google Scholar] [CrossRef] [PubMed]
- Cao, J.J.; Johnson, L.K.; Hunt, J.R. A diet high in meat protein and potential renal acid load increases fractional calcium absorption and urinary calcium excretion without affecting markers of bone resorption or formation in postmenopausal women. J. Nutr. 2011, 141, 391–397. [Google Scholar] [CrossRef] [PubMed]
- Morton, R.W.; Murphy, K.T.; McKellar, S.R.; Schoenfeld, B.J.; Henselmans, M.; Helms, E.; Aragon, A.A.; Devries, M.C.; Banfield, L.; Krieger, J.W. A systematic review, meta-analysis and meta-regression of the effect of protein supplementation on resistance training-induced gains in muscle mass and strength in healthy adults. Br. J. Sports Med. 2018, 52, 376–384. [Google Scholar] [CrossRef]
- Rogeri, P.S.; Zanella, R., Jr.; Martins, G.L.; Garcia, M.D.; Leite, G.; Lugaresi, R.; Gasparini, S.O.; Sperandio, G.A.; Ferreira, L.H.B.; Souza-Junior, T.P. Strategies to prevent sarcopenia in the aging process: Role of protein intake and exercise. Nutrients 2021, 14, 52. [Google Scholar] [CrossRef]
- Krieger, N.S.; Frick, K.K.; Bushinsky, D.A. Mechanism of acid-induced bone resorption. Curr. Opin. Nephrol. Hypertens. 2004, 13, 423–436. [Google Scholar] [CrossRef] [PubMed]
- Litzow, J.R.; Lemann, J.; Lennon, E.J. The effect of treatment of acidosis on calcium balance in patients with chronic azotemic renal disease. J. Clin. Investig. 1967, 46, 280–286. [Google Scholar] [CrossRef] [PubMed]
- Prezioso, D.; Strazzullo, P.; Lotti, T.; Bianchi, G.; Borghi, L.; Caione, P.; Carini, M.; Caudarella, R.; Gambaro, G.; Gelosa, M. Dietary treatment of urinary risk factors for renal stone formation. A review of CLU Working Group. Arch. Ital. Urol. Androl. 2015, 87, 105–120. [Google Scholar] [CrossRef] [PubMed]
- Hegsted, M.; Linkswiler, H.M. Long-term effects of level of protein intake on calcium metabolism in young adult women. J. Nutr. 1981, 111, 244–251. [Google Scholar] [CrossRef]
- Itoh, R.; Nishiyama, N.; Suyama, Y. Dietary protein intake and urinary excretion of calcium: A cross-sectional study in a healthy Japanese population. Am. J. Clin. Nutr. 1998, 67, 438–444. [Google Scholar] [CrossRef]
- Hunt, J.R.; Johnson, L.K.; Fariba Roughead, Z. Dietary protein and calcium interact to influence calcium retention: A controlled feeding study. Am. J. Clin. Nutr. 2009, 89, 1357–1365. [Google Scholar] [CrossRef] [PubMed]
- Kerstetter, J.E.; Caseria, D.M.; Mitnick, M.; Ellison, A.F.; Gay, L.F.; Liskov, T.; Carpenter, T.O.; Insogna, K.L. Increased circulating concentrations of parathyroid hormone in healthy, young women consuming a protein-restricted diet. Am. J. Clin. Nutr. 1997, 66, 1188–1196. [Google Scholar] [CrossRef] [PubMed]
- Lutz, J.; Linkswiler, H. Calcium metabolism in postmenopausal and osteoporotic women consuming two levels of dietary protein. Am. J. Clin. Nutr. 1981, 34, 2178–2186. [Google Scholar] [CrossRef] [PubMed]
- Kim, Y.; Linkswiler, H.M. Effect of level of protein intake on calcium metabolism and on parathyroid and renal function in the adult human male. J. Nutr. 1979, 109, 1399–1404. [Google Scholar] [CrossRef] [PubMed]
- Page, M.J.; McKenzie, J.E.; Bossuyt, P.M.; Boutron, I.; Hoffmann, T.C.; Mulrow, C.D.; Shamseer, L.; Tetzlaff, J.M.; Akl, E.A.; Brennan, S.E. The PRISMA 2020 statement: An updated guideline for reporting systematic reviews. Int. J. Surg. 2021, 88, 105906. [Google Scholar] [CrossRef]
- Mozaffari, H.; Daneshzad, E.; Azadbakht, L. Dietary carbohydrate intake and risk of bone fracture: A systematic review and meta-analysis of observational studies. Public Health 2020, 181, 102–109. [Google Scholar] [CrossRef]
- Xu, L.; Dibley, M.; D’Este, C.; Phillips, M.; Porteous, J.; Attia, J. Food groups and risk of forearm fractures in postmenopausal women in Chengdu, China. Climact. J. Int. Menopause Soc. 2009, 12, 222–229. [Google Scholar] [CrossRef]
- Kato, I.; Toniolo, P.; Zeleniuch-Jacquotte, A.; Shore, R.E.; Koenig, K.L.; Akhmedkhanov, A.; Riboli, E. Diet, smoking and anthropometric indices and postmenopausal bone fractures: A prospective study. Int. J. Epidemiol. 2000, 29, 85–92. [Google Scholar] [CrossRef]
- Michaelsson, K.; Holmberg, L.; Mallmin, H.; SÖRENSEN, S.; Wolk, A.; BERGSTRŌM, R.; Ljunghall, S.; Study Group of the Multiple Risk Survey on Swedish Women for Eating Assessment. Diet and hip fracture risk: A case-control study. Int. J. Epidemiol. 1995, 24, 771–782. [Google Scholar] [CrossRef]
- Martinez-Ramirez, M.; Palma, S.; Martinez-Gonzalez, M.; Delgado-Martinez, A.; De la Fuente, C.; Delgado-Rodriguez, M. Dietary fat intake and the risk of osteoporotic fractures in the elderly. Eur. J. Clin. Nutr. 2007, 61, 1114–1120. [Google Scholar] [CrossRef]
- Munger, R.G.; Cerhan, J.R.; Chiu, B.C. Prospective study of dietary protein intake and risk of hip fracture in postmenopausal women. Am. J. Clin. Nutr. 1999, 69, 147–152. [Google Scholar] [CrossRef]
- Huang, Z.; Himes, J.H.; McGovern, P.G. Nutrition and subsequent hip fracture risk among a national cohort of white women. Am. J. Epidemiol. 1996, 144, 124–134. [Google Scholar] [CrossRef] [PubMed]
- Benetou, V.; Orfanos, P.; Zylis, D.; Sieri, S.; Contiero, P.; Tumino, R.; Giurdanella, M.; Peeters, P.; Linseisen, J.; Nieters, A. Diet and hip fractures among elderly Europeans in the EPIC cohort. Eur. J. Clin. Nutr. 2011, 65, 132–139. [Google Scholar] [CrossRef] [PubMed]
- Darling, A.L.; Manders, R.J.F.; Sahni, S.; Zhu, K.; Hewitt, C.E.; Prince, R.L.; Millward, D.J.; Lanham-New, S.A. Dietary protein and bone health across the life-course: An updated systematic review and meta-analysis over 40 years. Osteoporos. Int. J. Establ. Result Coop. Eur. Found. Osteoporos. Natl. Osteoporos. Found. USA 2019, 30, 741–761. [Google Scholar] [CrossRef] [PubMed]
- Alissa, E.M.; Alnahdi, W.A.; Alama, N.; Ferns, G.A. Relationship between nutritional profile, measures of adiposity, and bone mineral density in postmenopausal Saudi women. J. Am. Coll. Nutr. 2014, 33, 206–214. [Google Scholar] [CrossRef] [PubMed]
- Chan, R.; Woo, J.; Lau, W.; Leung, J.; Xu, L.; Zhao, X.; Yu, W.; Lau, E.; Pocock, N. Effects of lifestyle and diet on bone health in young adult Chinese women living in Hong Kong and Beijing. Food Nutr. Bull. 2009, 30, 370–378. [Google Scholar] [CrossRef]
- Coin, A.; Perissinotto, E.; Enzi, G.; Zamboni, M.; Inelmen, E.M.; Frigo, A.C.; Manzato, E.; Busetto, L.; Buja, A.; Sergi, G. Predictors of low bone mineral density in the elderly: The role of dietary intake, nutritional status and sarcopenia. Eur. J. Clin. Nutr. 2008, 62, 802–809. [Google Scholar] [CrossRef]
- Chiu, J.F.; Lan, S.J.; Yang, C.Y.; Wang, P.W.; Yao, W.J.; Su, L.H.; Hsieh, C.C. Long-term vegetarian diet and bone mineral density in postmenopausal Taiwanese women. Calcif. Tissue Int. 1997, 60, 245–249. [Google Scholar] [CrossRef]
- Gunn, C.A.; Weber, J.L.; Kruger, M.C. Diet, weight, cytokines and bone health in postmenopausal women. J. Nutr. Health Aging 2014, 18, 479–486. [Google Scholar] [CrossRef]
- Cooper, C.; Atkinson, E.J.; Hensrud, D.D.; Wahner, H.W.; O’Fallon, W.M.; Riggs, B.L.; Melton, L.J., 3rd. Dietary protein intake and bone mass in women. Calcif. Tissue Int. 1996, 58, 320–325. [Google Scholar] [CrossRef]
- Henderson, N.K.; Price, R.I.; Cole, J.H.; Gutteridge, D.H.; Bhagat, C.I. Bone density in young women is associated with body weight and muscle strength but not dietary intakes. J. Bone Miner. Res. 1995, 10, 384–393. [Google Scholar] [CrossRef]
- Ho, S.C.; Woo, J.; Lam, S.; Chen, Y.; Sham, A.; Lau, J. Soy protein consumption and bone mass in early postmenopausal Chinese women. Osteoporos. Int. J. Establ. Result Coop. Eur. Found. Osteoporos. Natl. Osteoporos. Found. USA 2003, 14, 835–842. [Google Scholar] [CrossRef]
- Kumar, A.; Mittal, S.; Orito, S.; Ishitani, K.; Ohta, H. Impact of dietary intake, education, and physical activity on bone mineral density among North Indian women. J. Bone Miner. Metab. 2010, 28, 192–201. [Google Scholar] [CrossRef] [PubMed]
- Jaime, P.C.; Latorre Mdo, R.; Florindo, A.A.; Tanaka, T.; Zerbini, C.A. Dietary intake of Brazilian black and white men and its relationship to the bone mineral density of the femoral neck. Sao Paulo Med. J./Rev. Paul. Med. 2006, 124, 267–270. [Google Scholar] [CrossRef] [PubMed]
- Lau, E.M.; Kwok, T.; Woo, J.; Ho, S.C. Bone mineral density in Chinese elderly female vegetarians, vegans, lacto-vegetarians and omnivores. Eur. J. Clin. Nutr. 1998, 52, 60–64. [Google Scholar] [CrossRef] [PubMed]
- Michaëlsson, K.; Holmberg, L.; Mallmin, H.; Wolk, A.; Bergström, R.; Ljunghall, S. Diet, bone mass, and osteocalcin: A cross-sectional study. Calcif. Tissue Int. 1995, 57, 86–93. [Google Scholar] [CrossRef]
- New, S.A.; Bolton-Smith, C.; Grubb, D.A.; Reid, D.M. Nutritional influences on bone mineral density: A cross-sectional study in premenopausal women. Am. J. Clin. Nutr. 1997, 65, 1831–1839. [Google Scholar] [CrossRef]
- Orozco López, P.; Ruiz Gil, E.; Nolla Sole, J.M. Are food intake and life styles related with bone mass in fertile women? Anal. Med. Intern. 1998, 15, 63–69. [Google Scholar]
- Rapuri, P.B.; Gallagher, J.C.; Haynatzka, V. Protein intake: Effects on bone mineral density and the rate of bone loss in elderly women. Am. J. Clin. Nutr. 2003, 77, 1517–1525. [Google Scholar] [CrossRef]
- Teegarden, D.; Lyle, R.M.; McCabe, G.P.; McCabe, L.D.; Proulx, W.R.; Michon, K.; Knight, A.P.; Johnston, C.C.; Weaver, C.M. Dietary calcium, protein, and phosphorus are related to bone mineral density and content in young women. Am. J. Clin. Nutr. 1998, 68, 749–754. [Google Scholar] [CrossRef]
- Wang, M.C.; Luz Villa, M.; Marcus, R.; Kelsey, J.L. Associations of vitamin C, calcium and protein with bone mass in postmenopausal Mexican American women. Osteoporos. Int. J. Establ. Result Coop. Eur. Found. Osteoporos. Natl. Osteoporos. Found. USA 1997, 7, 533–538. [Google Scholar] [CrossRef] [PubMed]
- Horiuchi, T.; Onouchi, T.; Takahashi, M.; Ito, H.; Orimo, H. Effect of soy protein on bone metabolism in postmenopausal Japanese women. Osteoporos. Int. J. Establ. Result Coop. Eur. Found. Osteoporos. Natl. Osteoporos. Found. USA 2000, 11, 721–724. [Google Scholar] [CrossRef] [PubMed]
- Quintas, M.E.; Ortega, R.M.; López-Sobaler, A.M.; Garrido, G.; Requejo, A.M. Influence of dietetic and anthropometric factors and of the type of sport practised on bone density in different groups of women. Eur. J. Clin. Nutr. 2003, 57 (Suppl. 1), S58–S62. [Google Scholar] [CrossRef]
- Thorpe, M.; Mojtahedi, M.C.; Chapman-Novakofski, K.; McAuley, E.; Evans, E.M. A positive association of lumbar spine bone mineral density with dietary protein is suppressed by a negative association with protein sulfur. J. Nutr. 2008, 138, 80–85. [Google Scholar] [CrossRef] [PubMed]
- Whiting, S.J.; Boyle, J.L.; Thompson, A.; Mirwald, R.L.; Faulkner, R.A. Dietary protein, phosphorus and potassium are beneficial to bone mineral density in adult men consuming adequate dietary calcium. J. Am. Coll. Nutr. 2002, 21, 402–409. [Google Scholar] [CrossRef]
- Tkatch, L.; Rapin, C.H.; Rizzoli, R.; Slosman, D.; Nydegger, V.; Vasey, H.; Bonjour, J.P. Benefits of oral protein supplementation in elderly patients with fracture of the proximal femur. J. Am. Coll. Nutr. 1992, 11, 519–525. [Google Scholar] [CrossRef]
- Kerstetter, J.E.; Bihuniak, J.D.; Brindisi, J.; Sullivan, R.R.; Mangano, K.M.; Larocque, S.; Kotler, B.M.; Simpson, C.A.; Cusano, A.M.; Gaffney-Stomberg, E.; et al. The Effect of a Whey Protein Supplement on Bone Mass in Older Caucasian Adults. J. Clin. Endocrinol. Metab. 2015, 100, 2214–2222. [Google Scholar] [CrossRef]
- Zhu, K.; Meng, X.; Kerr, D.A.; Devine, A.; Solah, V.; Binns, C.W.; Prince, R.L. The effects of a two-year randomized, controlled trial of whey protein supplementation on bone structure, IGF-1, and urinary calcium excretion in older postmenopausal women. J. Bone Miner. Res. 2011, 26, 2298–2306. [Google Scholar] [CrossRef]
- Langsetmo, L.; Barr, S.; Berger, C.; Kreiger, N.; Rahme, E.; Adachi, J.; Papaioannou, A.; Kaiser, S.; Prior, J.; Hanley, D. Associations of protein intake and protein source with bone mineral density and fracture risk: A population-based cohort study. J. Nutr. Health Aging 2015, 19, 861–868. [Google Scholar] [CrossRef]
- Misra, D.; Berry, S.; Broe, K.; McLean, R.; Cupples, L.; Tucker, K.; Kiel, D.; Hannan, M. Does dietary protein reduce hip fracture risk in elders? The Framingham Osteoporosis Study. Osteoporos. Int. 2011, 22, 345–349. [Google Scholar] [CrossRef]
- Sahni, S.; Cupples, L.A.; Mclean, R.R.; Tucker, K.L.; Broe, K.E.; Kiel, D.P.; Hannan, M.T. Protective effect of high protein and calcium intake on the risk of hip fracture in the Framingham offspring cohort. J. Bone Miner. Res. 2010, 25, 2770–2776. [Google Scholar] [CrossRef]
- Martínez-Ramírez, M.J.; Delgado-Martínez, A.D.; Ruiz-Bailén, M.; de la Fuente, C.; Martínez-González, M.; Delgado-Rodríguez, M. Protein intake and fracture risk in elderly people: A case-control study. Clin. Nutr. 2012, 31, 391–395. [Google Scholar] [CrossRef] [PubMed]
- Nieves, J.W.; Grisso, J.A.; Kelsey, J.L. A case-control study of hip fracture: Evaluation of selected dietary variables and teenage physical activity. Osteoporos. Int. J. Establ. Result Coop. Eur. Found. Osteoporos. Natl. Osteoporos. Found. USA 1992, 2, 122–127. [Google Scholar] [CrossRef] [PubMed]
- Wengreen, H.J.; Munger, R.G.; West, N.A.; Cutler, D.R.; Corcoran, C.D.; Zhang, J.; Sassano, N.E. Dietary protein intake and risk of osteoporotic hip fracture in elderly residents of Utah. J. Bone Miner. Res. 2004, 19, 537–545. [Google Scholar] [CrossRef]
- Aoe, S.; Koyama, T.; Toba, Y.; Itabashi, A.; Takada, Y. A controlled trial of the effect of milk basic protein (MBP) supplementation on bone metabolism in healthy menopausal women. Osteoporos. Int. J. Establ. Result Coop. Eur. Found. Osteoporos. Natl. Osteoporos. Found. USA 2005, 16, 2123–2128. [Google Scholar] [CrossRef] [PubMed]
- Uenishi, K.; Ishida, H.; Toba, Y.; Aoe, S.; Itabashi, A.; Takada, Y. Milk basic protein increases bone mineral density and improves bone metabolism in healthy young women. Osteoporos. Int. J. Establ. Result Coop. Eur. Found. Osteoporos. Natl. Osteoporos. Found. USA 2007, 18, 385–390. [Google Scholar] [CrossRef]
- Zou, Z.Y.; Lin, X.M.; Xu, X.R.; Xu, R.; Ma, L.; Li, Y.; Wang, M.F. Evaluation of milk basic protein supplementation on bone density and bone metabolism in Chinese young women. Eur. J. Nutr. 2009, 48, 301–306. [Google Scholar] [CrossRef]
- Meyer, H.E.; Pedersen, J.I.; LØken, E.B.; Tverdal, A. Dietary factors and the incidence of hip fracture in middle-aged Norwegians: A prospective study. Am. J. Epidemiol. 1997, 145, 117–123. [Google Scholar] [CrossRef]
- Feskanich, D.; Willett, W.C.; Stampfer, M.J.; Colditz, G.A. Protein consumption and bone fractures in women. Am. J. Epidemiol. 1996, 143, 472–479. [Google Scholar] [CrossRef]
- Dargent-Molina, P.; Sabia, S.; Touvier, M.; Kesse, E.; Bréart, G.; Clavel-Chapelon, F.; Boutron-Ruault, M.C. Proteins, dietary acid load, and calcium and risk of postmenopausal fractures in the E3N French women prospective study. J. Bone Miner. Res. 2008, 23, 1915–1922. [Google Scholar] [CrossRef]
- Mussolino, M.E.; Looker, A.C.; Madans, J.H.; Langlois, J.A.; Orwoll, E.S. Risk factors for hip fracture in white men: The NHANES I Epidemiologic Follow-up Study. J. Bone Miner. Res. 1998, 13, 918–924. [Google Scholar] [CrossRef] [PubMed]
- Shams-White, M.M.; Chung, M.; Du, M.; Fu, Z.; Insogna, K.L.; Karlsen, M.C.; LeBoff, M.S.; Shapses, S.A.; Sackey, J.; Wallace, T.C.; et al. Dietary protein and bone health: A systematic review and meta-analysis from the National Osteoporosis Foundation. Am. J. Clin. Nutr. 2017, 105, 1528–1543. [Google Scholar] [CrossRef] [PubMed]
- Jesudason, D.; Nordin, B.C.; Keogh, J.; Clifton, P. Comparison of 2 weight-loss diets of different protein content on bone health: A randomized trial. Am. J. Clin. Nutr. 2013, 98, 1343–1352. [Google Scholar] [CrossRef] [PubMed]
- Kukuljan, S.; Nowson, C.; Bass, S.; Sanders, K.; Nicholson, G.; Seibel, M.; Salmon, J.; Daly, R. Effects of a multi-component exercise program and calcium–vitamin-D 3-fortified milk on bone mineral density in older men: A randomised controlled trial. Osteoporos. Int. 2009, 20, 1241–1251. [Google Scholar] [CrossRef]
- Sukumar, D.; Ambia-Sobhan, H.; Zurfluh, R.; Schlussel, Y.; Stahl, T.J.; Gordon, C.L.; Shapses, S.A. Areal and volumetric bone mineral density and geometry at two levels of protein intake during caloric restriction: A randomized, controlled trial. J. Bone Miner. Res. 2011, 26, 1339–1348. [Google Scholar] [CrossRef]
- Tirosh, A.; de Souza, R.J.; Sacks, F.; Bray, G.A.; Smith, S.R.; LeBoff, M.S. Sex differences in the effects of weight loss diets on bone mineral density and body composition: Pounds Lost trial. J. Clin. Endocrinol. Metab. 2015, 100, 2463–2471. [Google Scholar] [CrossRef]
- Flodin, L.; Sääf, M.; Cederholm, T.; Al-Ani, A.N.; Ackermann, P.W.; Samnegård, E.; Dalen, N.; Hedström, M. Additive effects of nutritional supplementation, together with bisphosphonates, on bone mineral density after hip fracture: A 12-month randomized controlled study. Clin. Interv. Aging 2014, 9, 1043. [Google Scholar]
- Bharadwaj, S.; Naidu, A.; Betageri, G.; Prasadarao, N.; Naidu, A. Milk ribonuclease-enriched lactoferrin induces positive effects on bone turnover markers in postmenopausal women. Osteoporos. Int. 2009, 20, 1603–1611. [Google Scholar] [CrossRef]
- Holm, L.; Olesen, J.L.; Matsumoto, K.; Doi, T.; Mizuno, M.; Alsted, T.J.; Mackey, A.L.; Schwarz, P.; Kjær, M. Protein-containing nutrient supplementation following strength training enhances the effect on muscle mass, strength, and bone formation in postmenopausal women. J. Appl. Physiol. 2008, 105, 274–281. [Google Scholar] [CrossRef]
- Schurch, M.-A.; Rizzoli, R.; Slosman, D.; Vadas, L.; Vergnaud, P.; Bonjour, J.-P. Protein supplements increase serum insulin-like growth factor-I levels and attenuate proximal femur bone loss in patients with recent hip fracture: A randomized, double-blind, placebo-controlled trial. Ann. Intern. Med. 1998, 128, 801–809. [Google Scholar] [CrossRef]
- Tengstrand, B.; Cederholm, T.; Söderqvist, A.; Tidermark, J. Effects of protein-rich supplementation and nandrolone on bone tissue after a hip fracture. Clin. Nutr. 2007, 26, 460–465. [Google Scholar] [CrossRef]
- Shams-White, M.M.; Chung, M.; Fu, Z.; Insogna, K.L.; Karlsen, M.C.; LeBoff, M.S.; Shapses, S.A.; Sackey, J.; Shi, J.; Wallace, T.C.; et al. Animal versus plant protein and adult bone health: A systematic review and meta-analysis from the National Osteoporosis Foundation. PLoS ONE 2018, 13, e0192459. [Google Scholar] [CrossRef]
- Arjmandi, B.H.; Lucas, E.A.; Khalil, D.A.; Devareddy, L.; Smith, B.J.; McDonald, J.; Arquitt, A.B.; Payton, M.E.; Mason, C. One year soy protein supplementation has positive effects on bone formation markers but not bone density in postmenopausal women. Nutr. J. 2005, 4, 8. [Google Scholar] [CrossRef]
- Kenny, A.M.; Mangano, K.M.; Abourizk, R.H.; Bruno, R.S.; Anamani, D.E.; Kleppinger, A.; Walsh, S.J.; Prestwood, K.M.; Kerstetter, J.E. Soy proteins and isoflavones affect bone mineral density in older women: A randomized controlled trial. Am. J. Clin. Nutr. 2009, 90, 234–242. [Google Scholar] [CrossRef]
- Kreijkamp-Kaspers, S.; Kok, L.; Grobbee, D.E.; de Haan, E.H.; Aleman, A.; Lampe, J.W.; van der Schouw, Y.T. Effect of soy protein containing isoflavones on cognitive function, bone mineral density, and plasma lipids in postmenopausal women: A randomized controlled trial. JAMA 2004, 292, 65–74. [Google Scholar] [CrossRef] [PubMed]
- Vupadhyayula, P.M.; Gallagher, J.C.; Templin, T.; Logsdon, S.M.; Smith, L.M. Effects of soy protein isolate on bone mineral density and physical performance indices in postmenopausal women—A 2-year randomized, double-blind, placebo-controlled trial. Menopause 2009, 16, 320–328. [Google Scholar] [CrossRef]
- Wallace, T.C.; Frankenfeld, C.L. Dietary protein intake above the current RDA and bone health: A systematic review and meta-analysis. J. Am. Coll. Nutr. 2017, 36, 481–496. [Google Scholar] [CrossRef] [PubMed]
- Beasley, J.M.; LaCroix, A.Z.; Larson, J.C.; Huang, Y.; Neuhouser, M.L.; Tinker, L.F.; Jackson, R.; Snetselaar, L.; Johnson, K.C.; Eaton, C.B. Biomarker-calibrated protein intake and bone health in the Women’s Health Initiative clinical trials and observational study. Am. J. Clin. Nutr. 2014, 99, 934–940. [Google Scholar] [CrossRef] [PubMed]
- Fung, T.T.; Meyer, H.E.; Willett, W.C.; Feskanich, D. Protein intake and risk of hip fractures in postmenopausal women and men age 50 and older. Osteoporos. Int. 2017, 28, 1401–1411. [Google Scholar] [CrossRef]
- Dawson-Hughes, B.; Harris, S.S.; Rasmussen, H.; Song, L.; Dallal, G.E. Effect of dietary protein supplements on calcium excretion in healthy older men and women. J. Clin. Endocrinol. Metab. 2004, 89, 1169–1173. [Google Scholar] [CrossRef]
- Hunt, J.R.; Gallagher, S.K.; Johnson, L.; Lykken, G.I. High-versus low-meat diets: Effects on zinc absorption, iron status, and calcium, copper, iron, magnesium, manganese, nitrogen, phosphorus, and zinc balance in postmenopausal women. Am. J. Clin. Nutr. 1995, 62, 621–632. [Google Scholar] [CrossRef] [PubMed]
- Jenkins, D.; Kendall, C.; Vidgen, E.; Augustin, L.; Parker, T.; Faulkner, D.; Vieth, R.; Vandenbroucke, A.; Josse, R. Effect of high vegetable protein diets on urinary calcium loss in middle-aged men and women. Eur. J. Clin. Nutr. 2003, 57, 376–382. [Google Scholar] [CrossRef] [PubMed]
- Kerstetter, J.E.; O’Brien, K.O.; Insogna, K.L. Dietary protein affects intestinal calcium absorption. Am. J. Clin. Nutr. 1998, 68, 859–865. [Google Scholar] [CrossRef] [PubMed]
- Kerstetter, J.E.; Svastisalee, C.M.; Caseria, D.M.; Mitnick, M.E.; Insogna, K.L. A threshold for low-protein-diet–induced elevations in parathyroid hormone. Am. J. Clin. Nutr. 2000, 72, 168–173. [Google Scholar] [CrossRef]
- Kerstetter, J.E.; Wall, D.E.; O’Brien, K.O.; Caseria, D.M.; Insogna, K.L. Meat and soy protein affect calcium homeostasis in healthy women. J. Nutr. 2006, 136, 1890–1895. [Google Scholar] [CrossRef] [PubMed]
- Pannemans, D.L.; Schaafsma, G.; Westerterp, K.R. Calcium excretion, apparent calcium absorption and calcium balance in young and elderly subjects: Influence of protein intake. Br. J. Nutr. 1997, 77, 721–729. [Google Scholar] [CrossRef]
- Kerstetter, J.M.M.; Gundberg, C.M.; Caseria, D.M.; Ellison, A.F.; Carpenter, T.O.; Insogna, K.L. Changes in bone turnover in young women consuming different levels of dietary protein. J. Clin. Endocrinol. Metab. 1999, 84, 1052–1055. [Google Scholar] [CrossRef]
- Darling, A.L.; Millward, D.J.; Torgerson, D.J.; Hewitt, C.E.; Lanham-New, S.A. Dietary protein and bone health: A systematic review and meta-analysis. Am. J. Clin. Nutr. 2009, 90, 1674–1692. [Google Scholar] [CrossRef]
- Alekel, D.L.; Germain, A.S.; Peterson, C.T.; Hanson, K.B.; Stewart, J.W.; Toda, T. Isoflavone-rich soy protein isolate attenuates bone loss in the lumbar spine of perimenopausal women. Am. J. Clin. Nutr. 2000, 72, 844–852. [Google Scholar] [CrossRef]
- Potter, S.M.; Baum, J.A.; Teng, H.; Stillman, R.J.; Shay, N.F.; Erdman, J.W., Jr. Soy protein and isoflavones: Their effects on blood lipids and bone density in postmenopausal women. Am. J. Clin. Nutr. 1998, 68, 1375S–1379S. [Google Scholar] [CrossRef]
- Thorpe, M.P.; Jacobson, E.H.; Layman, D.K.; He, X.; Kris-Etherton, P.M.; Evans, E.M. A diet high in protein, dairy, and calcium attenuates bone loss over twelve months of weight loss and maintenance relative to a conventional high-carbohydrate diet in adults. J. Nutr. 2008, 138, 1096–1100. [Google Scholar] [CrossRef]
- Dawson-Hughes, B.; Harris, S.S. Calcium intake influences the association of protein intake with rates of bone loss in elderly men and women. Am. J. Clin. Nutr. 2002, 75, 773–779. [Google Scholar] [CrossRef]
- Hannan, M.T.; Tucker, K.L.; Dawson-Hughes, B.; Cupples, L.A.; Felson, D.T.; Kiel, D.P. Effect of dietary protein on bone loss in elderly men and women: The Framingham Osteoporosis Study. J. Bone Miner. Res. 2000, 15, 2504–2512. [Google Scholar] [CrossRef] [PubMed]
- Ho, S.; Chan, S.; Yip, Y.; Chan, C.; Woo, J.; Sham, A. Change in bone mineral density and its determinants in pre-and perimenopausal Chinese women: The Hong Kong perimenopausal women osteoporosis study. Osteoporos. Int. 2008, 19, 1785–1796. [Google Scholar] [CrossRef] [PubMed]
- Promislow, J.H.; Goodman-Gruen, D.; Slymen, D.J.; Barrett-Connor, E. Protein consumption and bone mineral density in the elderly: The Rancho Bernardo Study. Am. J. Epidemiol. 2002, 155, 636–644. [Google Scholar] [CrossRef] [PubMed]
- Recker, R.R.; Davies, K.M.; Hinders, S.M.; Heaney, R.P.; Stegman, M.R.; Kimmel, D.B. Bone gain in young adult women. JAMA 1992, 268, 2403–2408. [Google Scholar] [CrossRef]
- Sahni, S.; Broe, K.E.; Tucker, K.L.; McLean, R.R.; Kiel, D.P.; Cupples, L.A.; Hannan, M.T. Association of total protein intake with bone mineral density and bone loss in men and women from the Framingham Offspring Study. Public Health Nutr. 2014, 17, 2570–2576. [Google Scholar] [CrossRef]
- Li, Z.; Treyzon, L.; Chen, S.; Yan, E.; Thames, G.; Carpenter, C.L. Protein-enriched meal replacements do not adversely affect liver, kidney or bone density: An outpatient randomized controlled trial. Nutr. J. 2010, 9, 72. [Google Scholar] [CrossRef]
- Freudenheim, J.; Johnson, N.; Smith, E. Relationships between usual nutrient intake and bone-mineral content of women 35–65 years of age: Longitudinal and cross-sectional analysis. Am. J. Clin. Nutr. 1986, 44, 863–876. [Google Scholar] [CrossRef]
- Gregg, E.; Kriska, A.; Salamone, L.; Wolf, R.; Roberts, M.; Ferrell, R.; Anderson, S.; Kuller, L.; Cauley, J. Correlates of quantitative ultrasound in the Women’s Healthy Lifestyle Project. Osteoporos. Int. 1999, 10, 416–424. [Google Scholar] [CrossRef]
- Lacey, J.M.; Anderson, J.J.; Fujita, T.; Yoshimoto, Y.; Fukase, M.; Tsuchie, S.; Koch, G.G. Correlates of cortical bone mass among premenopausal and postmenopausal Japanese women. J. Bone Miner. Res. 1991, 6, 651–659. [Google Scholar] [CrossRef]
- Metz, J.A.; Anderson, J.; Gallagher, P.N., Jr. Intakes of calcium, phosphorus, and protein, and physical-activity level are related to radial bone mass in young adult women. Am. J. Clin. Nutr. 1993, 58, 537–542. [Google Scholar] [CrossRef] [PubMed]
- Tylavsky, F.; Anderson, J. Dietary factors in bone health of elderly lactoovovegetarian and omnivorous women. Am. J. Clin. Nutr. 1988, 48, 842–849. [Google Scholar] [CrossRef] [PubMed]
- Koh, W.-P.; Wu, A.H.; Wang, R.; Ang, L.-W.; Heng, D.; Yuan, J.-M.; Yu, M.C. Gender-specific associations between soy and risk of hip fracture in the Singapore Chinese Health Study. Am. J. Epidemiol. 2009, 170, 901–909. [Google Scholar] [CrossRef]
- Cauley, J.A.; Cawthon, P.M.; Peters, K.E.; Cummings, S.R.; Ensrud, K.E.; Bauer, D.C.; Taylor, B.C.; Shikany, J.M.; Hoffman, A.R.; Lane, N.E. Risk factors for hip fracture in older men: The osteoporotic fractures in men study (MrOS). J. Bone Miner. Res. 2016, 31, 1810–1819. [Google Scholar] [CrossRef]
- Zhang, X.; Shu, X.-O.; Li, H.; Yang, G.; Li, Q.; Gao, Y.-T.; Zheng, W. Prospective cohort study of soy food consumption and risk of bone fracture among postmenopausal women. Arch. Intern. Med. 2005, 165, 1890–1895. [Google Scholar] [CrossRef]
- Langsetmo, L.; Shikany, J.M.; Cawthon, P.M.; Cauley, J.A.; Taylor, B.C.; Vo, T.N.; Bauer, D.C.; Orwoll, E.S.; Schousboe, J.T.; Ensrud, K.E. The association between protein intake by source and osteoporotic fracture in older men: A prospective cohort study. J. Bone Miner. Res. 2017, 32, 592–600. [Google Scholar] [CrossRef]
- Groenendijk, I.; den Boeft, L.; van Loon, L.J.C.; de Groot, L. High Versus low Dietary Protein Intake and Bone Health in Older Adults: A Systematic Review and Meta-Analysis. Comput. Struct. Biotechnol. J. 2019, 17, 1101–1112. [Google Scholar] [CrossRef] [PubMed]
- Key, T.J.; Appleby, P.N.; Spencer, E.A.; Roddam, A.W.; Neale, R.E.; Allen, N.E. Calcium, diet and fracture risk: A prospective study of 1898 incident fractures among 34 696 British women and men. Public Health Nutr. 2007, 10, 1314–1320. [Google Scholar] [CrossRef]
- Nieves, J.W.; Melsop, K.; Curtis, M.; Kelsey, J.L.; Bachrach, L.K.; Greendale, G.; Sowers, M.F.; Sainani, K.L. Nutritional factors that influence change in bone density and stress fracture risk among young female cross-country runners. Phys. Med. Rehabil. 2010, 2, 740–750. [Google Scholar] [CrossRef]
- Thorpe, D.L.; Knutsen, S.F.; Beeson, W.L.; Rajaram, S.; Fraser, G.E. Effects of meat consumption and vegetarian diet on risk of wrist fracture over 25 years in a cohort of peri-and postmenopausal women. Public Health Nutr. 2008, 11, 564–572. [Google Scholar] [CrossRef]
- Wu, A.M.; Sun, X.L.; Lv, Q.B.; Zhou, Y.; Xia, D.D.; Xu, H.Z.; Huang, Q.S.; Chi, Y.L. The relationship between dietary protein consumption and risk of fracture: A subgroup and dose-response meta-analysis of prospective cohort studies. Sci. Rep. 2015, 5, 9151. [Google Scholar] [CrossRef] [PubMed]
- AOE, S.; Toba, Y.; Yamamura, J.-i.; Kawakami, H.; Yahiro, M.; Kumegawa, M.; Itabashi, A.; Takada, Y. Controlled trial of the effects of milk basic protein (MBP) supplementation on bone metabolism in healthy adult women. Biosci. Biotechnol. Biochem. 2001, 65, 913–918. [Google Scholar] [CrossRef]
- Evans, E.M.; Racette, S.B.; Van Pelt, R.E.; Peterson, L.R.; Villareal, D.T. Effects of soy protein isolate and moderate exercise on bone turnover and bone mineral density in postmenopausal women. Menopause 2007, 14, 481–488. [Google Scholar] [CrossRef]
- Gallagher, J.C.; Satpathy, R.; Rafferty, K.; Haynatzka, V. The effect of soy protein isolate on bone metabolism. Menopause 2004, 11, 290–298. [Google Scholar] [CrossRef] [PubMed]
- Lydeking-Olsen, E.; Beck-Jensen, J.E.; Setchell, K.D.; Holm-Jensen, T. Soymilk or progesterone for prevention of bone loss—A 2 year randomized, placebo-controlled trial. Eur. J. Nutr. 2004, 43, 246–257. [Google Scholar] [CrossRef] [PubMed]
- Devine, A.; Dick, I.M.; Islam, A.F.; Dhaliwal, S.S.; Prince, R.L. Protein consumption is an important predictor of lower limb bone mass in elderly women. Am. J. Clin. Nutr. 2005, 81, 1423–1428. [Google Scholar] [CrossRef]
- Pedone, C.; Napoli, N.; Pozzilli, P.; Lauretani, F.; Bandinelli, S.; Ferrucci, L.; Antonelli-Incalzi, R. Quality of diet and potential renal acid load as risk factors for reduced bone density in elderly women. Bone 2010, 46, 1063–1067. [Google Scholar] [CrossRef][Green Version]
- Tucker, K.L.; Hannan, M.T.; Kiel, D.P. The acid-base hypothesis: Diet and bone in the Framingham Osteoporosis Study. Eur. J. Nutr. 2001, 40, 231–237. [Google Scholar] [CrossRef]
- Ballard, T.L.; Specker, B.L.; Binkley, T.L.; Vukovich, M.D. Effect of protein supplementation during a 6-month strength and conditioning program on areal and volumetric bone parameters. Bone 2006, 38, 898–904. [Google Scholar] [CrossRef]
- Meng, X.; Zhu, K.; Devine, A.; Kerr, D.A.; Binns, C.W.; Prince, R.L. A 5-year cohort study of the effects of high protein intake on lean mass and BMC in elderly postmenopausal women. J. Bone Miner. Res. 2009, 24, 1827–1834. [Google Scholar] [CrossRef]
- Ho-Pham, L.; Vu, B.; Lai, T.; Nguyen, N.; Nguyen, T. Vegetarianism, bone loss, fracture and vitamin D: A longitudinal study in Asian vegans and non-vegans. Eur. J. Clin. Nutr. 2012, 66, 75–82. [Google Scholar] [CrossRef] [PubMed]
- George, K.S.; Muñoz, J.; Akhavan, N.S.; Foley, E.M.; Siebert, S.C.; Tenenbaum, G.; Khalil, D.A.; Chai, S.C.; Arjmandi, B.H. Is soy protein effective in reducing cholesterol and improving bone health? Food Funct. 2020, 11, 544–551. [Google Scholar] [CrossRef] [PubMed]
- Ince, B.A.; Anderson, E.J.; Neer, R.M. Lowering dietary protein to US Recommended dietary allowance levels reduces urinary calcium excretion and bone resorption in young women. J. Clin. Endocrinol. Metab. 2004, 89, 3801–3807. [Google Scholar] [CrossRef] [PubMed]
- Murray, M.J.; Meyer, W.R.; Lessey, B.A.; Oi, R.H.; DeWire, R.E.; Fritz, M.A. Soy protein isolate with isoflavones does not prevent estradiol-induced endometrial hyperplasia in postmenopausal women: A pilot trial. Menopause 2003, 10, 456–464. [Google Scholar] [CrossRef]
- Dou, Y.; Wang, Y.; Chen, Z.; Yu, X.; Ma, D. Effect of n-3 polyunsaturated fatty acid on bone health: A systematic review and meta-analysis of randomized controlled trials. Food Sci. Nutr. 2022, 10, 145–154. [Google Scholar] [CrossRef]
- Bassey, E.J.; Littlewood, J.J.; Rothwell, M.C.; Pye, D.W. Lack of effect of supplementation with essential fatty acids on bone mineral density in healthy pre-and postmenopausal women: Two randomized controlled trials of Efacal® v. calcium alone. Br. J. Nutr. 2000, 83, 629–635. [Google Scholar] [CrossRef]
- Cornish, S.M.; Chilibeck, P.D. Alpha-linolenic acid supplementation and resistance training in older adults. Appl. Physiol. Nutr. Metab. 2009, 34, 49–59. [Google Scholar] [CrossRef]
- Dodin, S.; Lemay, A.; Jacques, H.; Legare, F.; Forest, J.-C.; Masse, B. The effects of flaxseed dietary supplement on lipid profile, bone mineral density, and symptoms in menopausal women: A randomized, double-blind, wheat germ placebo-controlled clinical trial. J. Clin. Endocrinol. Metab. 2005, 90, 1390–1397. [Google Scholar] [CrossRef]
- Kruger, M.; Coetzer, H.; De Winter, R.; Gericke, G.; Van Papendorp, D. Calcium, gamma-linolenic acid and eicosapentaenoic acid supplementation in senile osteoporosis. Aging Clin. Exp. Res. 1998, 10, 385–394. [Google Scholar] [CrossRef]
- Tartibian, B.; Maleki, B.H.; Kanaley, J.; Sadeghi, K. Long-term aerobic exercise and omega-3 supplementation modulate osteoporosis through inflammatory mechanisms in post-menopausal women: A randomized, repeated measures study. Nutr. Metab. 2011, 8, 71. [Google Scholar] [CrossRef]
- Vanlint, S.J.; Ried, K. Efficacy and tolerability of calcium, vitamin D and a plant-based omega-3 oil for osteopenia: A pilot RCT. Maturitas 2012, 71, 44–48. [Google Scholar] [CrossRef] [PubMed]
- Dong, H.; Hutchins-Wiese, H.; Kleppinger, A.; Annis, K.; Liva, E.; Lammi-Keefe, C.; Durham, H.; Feinn, R.; Kenny, A.M. Effects of omega-3 polyunsaturated fatty acid supplementation on bone turnover in older women. Int. J. Vitam Nutr. Res. 2014, 84, 124–132. [Google Scholar] [CrossRef] [PubMed]
- Fonolla-Joya, J.; Reyes-García, R.; García-Martín, A.; López-Huertas, E.; Muñoz-Torres, M. Daily intake of milk enriched with n-3 fatty acids, oleic acid, and calcium improves metabolic and bone biomarkers in postmenopausal women. J. Am. Coll. Nutr. 2016, 35, 529–536. [Google Scholar] [CrossRef]
- Griel, A.E.; Kris-Etherton, P.M.; Hilpert, K.F.; Zhao, G.; West, S.G.; Corwin, R.L. An increase in dietary n-3 fatty acids decreases a marker of bone resorption in humans. Nutr. J. 2007, 6, 2. [Google Scholar] [CrossRef] [PubMed]
- Hutchins-Wiese, H.L.; Picho, K.; Watkins, B.A.; Li, Y.; Tannenbaum, S.; Claffey, K.; Kenny, A.M. High-dose eicosapentaenoic acid and docosahexaenoic acid supplementation reduces bone resorption in postmenopausal breast cancer survivors on aromatase inhibitors: A pilot study. Nutr. Cancer 2014, 66, 68–76. [Google Scholar] [CrossRef]
- Lappe, J.; Kunz, I.; Bendik, I.; Prudence, K.; Weber, P.; Recker, R.; Heaney, R.P. Effect of a combination of genistein, polyunsaturated fatty acids and vitamins D3 and K1 on bone mineral density in postmenopausal women: A randomized, placebo-controlled, double-blind pilot study. Eur. J. Nutr. 2013, 52, 203–215. [Google Scholar] [CrossRef]
- Van Papendorp, D.; Coetzer, H.; Kruger, M. Biochemical profile of osteoporotic patients on essential fatty acid supplementation. Nutr. Res. 1995, 15, 325–334. [Google Scholar] [CrossRef]
- Abdelhamid, A.; Hooper, L.; Sivakaran, R.; Hayhoe, R.P.G.; Welch, A. The Relationship Between Omega-3, Omega-6 and Total Polyunsaturated Fat and Musculoskeletal Health and Functional Status in Adults: A Systematic Review and Meta-analysis of RCTs. Calcif. Tissue Int. 2019, 105, 353–372. [Google Scholar] [CrossRef]
- Bullo, M.; Amigó-Correig, P.; Márquez-Sandoval, F.; Babio, N.; Martínez-González, M.A.; Estruch, R.; Basora, J.; Solà, R.; Salas-Salvadó, J. Mediterranean diet and high dietary acid load associated with mixed nuts: Effect on bone metabolism in elderly subjects. J. Am. Geriatr. Soc. 2009, 57, 1789–1798. [Google Scholar] [CrossRef]
- Fernández-Real, J.M.; Bullo, M.; Moreno-Navarrete, J.M.; Ricart, W.; Ros, E.; Estruch, R.; Salas-Salvado, J. A Mediterranean diet enriched with olive oil is associated with higher serum total osteocalcin levels in elderly men at high cardiovascular risk. J. Clin. Endocrinol. Metab. 2012, 97, 3792–3798. [Google Scholar] [CrossRef] [PubMed]
- Chen, J.; Hill, C.; Lester, S.; Ruediger, C.; Battersby, R.; Jones, G.; Cleland, L.; March, L. Supplementation with omega-3 fish oil has no effect on bone mineral density in adults with knee osteoarthritis: A 2-year randomized controlled trial. Osteoporos. Int. 2016, 27, 1897–1905. [Google Scholar] [CrossRef]
- Sharif, P.S.; Asalforoush, M.; Ameri, F.; Larijani, B.; Abdollahi, M. The effect of n-3 fatty acids on bone biomarkers in Iranian postmenopausal osteoporotic women: A randomized clinical trial. Age 2010, 32, 179–186. [Google Scholar] [CrossRef]
- Sadeghi, O.; Djafarian, K.; Ghorabi, S.; Khodadost, M.; Nasiri, M.; Shab-Bidar, S. Dietary intake of fish, n-3 polyunsaturated fatty acids and risk of hip fracture: A systematic review and meta-analysis on observational studies. Crit. Rev. Food Sci. Nutr. 2019, 59, 1320–1333. [Google Scholar] [CrossRef]
- Appleby, P.; Roddam, A.; Allen, N.; Key, T. Comparative fracture risk in vegetarians and nonvegetarians in EPIC-Oxford. Eur. J. Clin. Nutr. 2007, 61, 1400–1406. [Google Scholar] [CrossRef] [PubMed]
- Virtanen, J.K.; Mozaffarian, D.; Cauley, J.A.; Mukamal, K.J.; Robbins, J.; Siscovick, D.S. Fish consumption, bone mineral density, and risk of hip fracture among older adults: The cardiovascular health study. J. Bone Miner. Res. 2010, 25, 1972–1979. [Google Scholar] [CrossRef]
- Farina, E.K.; Kiel, D.P.; Roubenoff, R.; Schaefer, E.J.; Cupples, L.A.; Tucker, K.L. Dietary intakes of arachidonic acid and α-linolenic acid are associated with reduced risk of hip fracture in older adults. J. Nutr. 2011, 141, 1146–1153. [Google Scholar] [CrossRef]
- Virtanen, J.K.; Mozaffarian, D.; Willett, W.C.; Feskanich, D. Dietary intake of polyunsaturated fatty acids and risk of hip fracture in men and women. Osteoporos. Int. 2012, 23, 2615–2624. [Google Scholar] [CrossRef]
- Suzuki, T.; Yoshida, H.; Hashimoto, T.; Yoshimura, N.; Fujiwara, S.; Fukunaga, M.; Nakamura, T.; Yoh, K.; Inoue, T.; Hosoi, T. Case-control study of risk factors for hip fractures in the Japanese elderly by a Mediterranean Osteoporosis Study (MEDOS) questionnaire. Bone 1997, 21, 461–467. [Google Scholar] [CrossRef]
- Fan, F.; Xue, W.-Q.; Wu, B.-H.; He, M.-G.; Xie, H.-L.; Ouyang, W.-F.; Tu, S.-l.; Chen, Y.-M. Higher fish intake is associated with a lower risk of hip fractures in Chinese men and women: A matched case-control study. PLoS ONE 2013, 8, e56849. [Google Scholar] [CrossRef]
- Harris, T.B.; Song, X.; Reinders, I.; Lang, T.F.; Garcia, M.E.; Siggeirsdottir, K.; Sigurdsson, S.; Gudnason, V.; Eiriksdottir, G.; Sigurdsson, G.; et al. Plasma phospholipid fatty acids and fish-oil consumption in relation to osteoporotic fracture risk in older adults: The Age, Gene/Environment Susceptibility Study. Am. J. Clin. Nutr. 2015, 101, 947–955. [Google Scholar] [CrossRef]
- Orchard, T.S.; Cauley, J.A.; Frank, G.C.; Neuhouser, M.L.; Robinson, J.G.; Snetselaar, L.; Tylavsky, F.; Wactawski-Wende, J.; Young, A.M.; Lu, B. Fatty acid consumption and risk of fracture in the Women’s Health Initiative. Am. J. Clin. Nutr. 2010, 92, 1452–1460. [Google Scholar] [CrossRef] [PubMed]
- Mozaffari, H.; Djafarian, K.; Mofrad, M.D.; Shab-Bidar, S. Dietary fat, saturated fatty acid, and monounsaturated fatty acid intakes and risk of bone fracture: A systematic review and meta-analysis of observational studies. Osteoporos. Int. J. Establ. Result Coop. Eur. Found. Osteoporos. Natl. Osteoporos. Found. USA 2018, 29, 1949–1961. [Google Scholar] [CrossRef]
- Zeng, F.; Xie, H.; Fan, F.; Xue, W.; Wu, B.; Zhu, H.; Chen, Y. Association of dietary fat intake with the risk of hip fractures in an elderly C hinese population: A matched case–control study. Geriatr. Gerontol. Int. 2015, 15, 1171–1178. [Google Scholar] [CrossRef]
- García-Gavilán, J.F.; Bulló, M.; Canudas, S.; Martínez-González, M.A.; Estruch, R.; Giardina, S.; Fito, M.; Corella, D.; Ros, E.; Salas-Salvadó, J. Extra virgin olive oil consumption reduces the risk of osteoporotic fractures in the PREDIMED trial. Clin. Nutr. 2018, 37, 329–335. [Google Scholar] [CrossRef]
- Shen, D.; Zhang, X.; Li, Z.; Bai, H.; Chen, L. Effects of omega-3 fatty acids on bone turnover markers in postmenopausal women: Systematic review and meta-analysis. Clim. J. Int. Menopause Soc. 2017, 20, 522–527. [Google Scholar] [CrossRef]
- Lavado-García, J.; Roncero-Martin, R.; Moran, J.M.; Pedrera-Canal, M.; Aliaga, I.; Leal-Hernandez, O.; Rico-Martin, S.; Canal-Macias, M.L. Long-chain omega-3 polyunsaturated fatty acid dietary intake is positively associated with bone mineral density in normal and osteopenic Spanish women. PLoS ONE 2018, 13, e0190539. [Google Scholar] [CrossRef] [PubMed]
- Baxheinrich, A.; Stratmann, B.; Lee-Barkey, Y.H.; Tschoepe, D.; Wahrburg, U. Effects of a rapeseed oil-enriched hypoenergetic diet with a high content of α-linolenic acid on body weight and cardiovascular risk profile in patients with the metabolic syndrome. Br. J. Nutr. 2012, 108, 682–691. [Google Scholar] [CrossRef]
- Hutchins-Wiese, H.; Kleppinger, A.; Annis, K.; Liva, E.; Lammi-Keefe, C.; Durham, H.; Kenny, A.M. The impact of supplemental n-3 long chain polyunsaturated fatty acids and dietary antioxidants on physical performance in postmenopausal women. J. Nutr. Health Aging 2013, 17, 76–80. [Google Scholar] [CrossRef] [PubMed]
- Tardivo, A.P.; Nahas-Neto, J.; Orsatti, C.L.; Dias, F.; Poloni, P.; Schmitt, E.; Nahas, E.A. Effects of omega-3 on metabolic markers in postmenopausal women with metabolic syndrome. Clim. J. Int. Menopause Soc. 2015, 18, 290–298. [Google Scholar] [CrossRef]
- Estruch, R.; Ros, E.; Salas-Salvadó, J.; Covas, M.-I.; Corella, D.; Arós, F.; Gómez-Gracia, E.; Ruiz-Gutiérrez, V.; Fiol, M.; Lapetra, J. Retraction and republication: Primary prevention of cardiovascular disease with a Mediterranean diet. N. Engl. J. Med. 2013, 368, 1279–1290, Mass. Med. Soc.2018. [Google Scholar] [CrossRef]
- Keen, H.; Payan, J.; Allawi, J.; Walker, J.; Jamal, G.A.; Weir, A.I.; Henderson, L.M.; Bissessar, E.A.; Watkins, P.J.; Sampson, M. Treatment of diabetic neuropathy with γ-linolenic acid. Diabetes Care 1993, 16, 8–15. [Google Scholar] [CrossRef] [PubMed]
- Alvarez-Perez, J.; Sanchez-Villegas, A.; Diaz-Benitez, E.; Ruano-Rodriguez, C.; Corella, D.; Martinez-Gonzalez, M.; Estruch, R.; Salas-Salvado, J.; Serra-Majem, L. PREDIMED Study Investigators. Influence of a mediterranean dietary pattern on body fat distribution: Results of the PREDIMED-canarias intervention randomized trial. J. Am. Coll. Nutr. 2016, 35, 568–580. [Google Scholar] [CrossRef] [PubMed]
- Stammers, T.; Sibbald, B.; Freeling, P. Efficacy of cod liver oil as an adjunct to non-steroidal anti-inflammatory drug treatment in the management of osteoarthritis in general practice. Ann. Rheum. Dis. 1992, 51, 128–129. [Google Scholar] [CrossRef] [PubMed]
- Sinn, N.; Milte, C.M.; Street, S.J.; Buckley, J.D.; Coates, A.M.; Petkov, J.; Howe, P.R. Effects of n-3 fatty acids, EPA v. DHA, on depressive symptoms, quality of life, memory and executive function in older adults with mild cognitive impairment: A 6-month randomised controlled trial. Br. J. Nutr. 2012, 107, 1682–1693. [Google Scholar] [CrossRef]
- Andrieu, S.; Guyonnet, S.; Coley, N.; Cantet, C.; Bonnefoy, M.; Bordes, S.; Bories, L.; Cufi, M.-N.; Dantoine, T.; Dartigues, J.-F. Effect of long-term omega 3 polyunsaturated fatty acid supplementation with or without multidomain intervention on cognitive function in elderly adults with memory complaints (MAPT): A randomised, placebo-controlled trial. Lancet Neurol. 2017, 16, 377–389. [Google Scholar] [CrossRef]
- Galan, P.; Briancon, S.; Blacher, J.; Czernichow, S.; Hercberg, S. The SU. FOL. OM3 Study: A secondary prevention trial testing the impact of supplementation with folate and B-vitamins and/or Omega-3 PUFA on fatal and non fatal cardiovascular events, design, methods and participants characteristics. Trials 2008, 9, 35. [Google Scholar] [CrossRef]
- Gruenwald, J.; Petzold, E.; Busch, R.; Petzold, H.-P.; Graubaum, H.-J. Effect of glucosamine sulfate with or without omega-3 fatty acids in patients with osteoarthritis. Adv. Ther. 2009, 26, 858. [Google Scholar] [CrossRef]
- Dasarathy, S.; Dasarathy, J.; Khiyami, A.; Yerian, L.; Hawkins, C.; Sargent, R.; McCullough, A.J. Double blind randomized placebo controlled clinical trial of omega 3 fatty acids for the treatment of diabetic patients with nonalcoholic steatohepatitis. J. Clin. Gastroenterol. 2015, 49, 137. [Google Scholar] [CrossRef]
- Clark, L.F.; Thivierge, M.; Kidd, C.A.; McGeoch, S.C.; Abraham, P.; Pearson, D.W.; Horgan, G.W.; Holtrop, G.; Thies, F.; Lobley, G.E. Fish oil supplemented for 9 months does not improve glycaemic control or insulin sensitivity in subjects with impaired glucose regulation: A parallel randomised controlled trial. Br. J. Nutr. 2016, 115, 75–86. [Google Scholar] [CrossRef]
- Danthiir, V.; Burns, N.R.; Nettelbeck, T.; Wilson, C.; Wittert, G. The older people, omega-3, and cognitive health (EPOCH) trial design and methodology: A randomised, double-blind, controlled trial investigating the effect of long-chain omega-3 fatty acids on cognitive ageing and wellbeing in cognitively healthy older adults. Nutr. J. 2011, 10, 117. [Google Scholar]
- van de Rest, O.; Geleijnse, J.M.; Kok, F.J.; van Staveren, W.A.; Dullemeijer, C.; OldeRikkert, M.G.; Beekman, A.T.; De Groot, C. Effect of fish oil on cognitive performance in older subjects: A randomized, controlled trial. Neurology 2008, 71, 430–438. [Google Scholar] [CrossRef] [PubMed]
- Javidan, A.N.; Sabour, H.; Latifi, S.; Abrishamkar, M.; Soltani, Z.; Shidfar, F.; Razavi, H.E. Does consumption of polyunsaturated fatty acids influence on neurorehabilitation in traumatic spinal cord-injured individuals? a double-blinded clinical trial. Spinal Cord 2014, 52, 378–382. [Google Scholar] [CrossRef]
- Garbagnati, F.; Cairella, G.; De Martino, A.; Multari, M.; Scognamiglio, U.; Venturiero, V.; Paolucci, S. Is antioxidant and n–3 supplementation able to improve functional status in poststroke patients? Results from the Nutristroke Trial. Cerebrovasc. Dis. 2009, 27, 375–383. [Google Scholar] [CrossRef] [PubMed]
- Freund-Levi, Y.; Eriksdotter-Jönhagen, M.; Cederholm, T.; Basun, H.; Faxen-Irving, G.; Garlind, A.; Vedin, I.; Vessby, B.; Wahlund, L.-O.; Palmblad, J. ω-3 fatty acid treatment in 174 patients with mild to moderate Alzheimer disease: OmegAD study: A randomized double-blind trial. Arch. Neurol. 2006, 63, 1402–1408. [Google Scholar] [CrossRef]
- Smith, G.I.; Julliand, S.; Reeds, D.N.; Sinacore, D.R.; Klein, S.; Mittendorfer, B. Fish oil–derived n− 3 PUFA therapy increases muscle mass and function in healthy older adults. Am. J. Clin. Nutr. 2015, 102, 115–122. [Google Scholar] [CrossRef]
- Wang, F.; Wang, Y.; Zhu, Y.; Liu, X.; Xia, H.; Yang, X.; Sun, G. Treatment for 6 months with fish oil-derived n-3 polyunsaturated fatty acids has neutral effects on glycemic control but improves dyslipidemia in type 2 diabetic patients with abdominal obesity: A randomized, double-blind, placebo-controlled trial. Eur. J. Nutr. 2017, 56, 2415–2422. [Google Scholar] [CrossRef]
- Scorletti, E.; Bhatia, L.; McCormick, K.G.; Clough, G.F.; Nash, K.; Hodson, L.; Moyses, H.E.; Calder, P.C.; Byrne, C.D.; Investigators, W.S. Effects of purified eicosapentaenoic and docosahexaenoic acids in nonalcoholic fatty liver disease: Results from the Welcome* study. Hepatology 2014, 60, 1211–1221. [Google Scholar] [CrossRef]
- Gao, S.; Qian, X.; Huang, S.; Deng, W.; Li, Z.; Hu, Y. Association between macronutrients intake distribution and bone mineral density. Clin. Nutr. 2022, 41, 1689–1696. [Google Scholar] [CrossRef]
- Mazidi, M.; Kengne, A.P.; Vatanparast, H. Association of dietary patterns of American adults with bone mineral density and fracture. Public Health Nutr. 2018, 21, 2417–2423. [Google Scholar] [CrossRef]
- Rajaram, S.; Yip, E.L.; Reghunathan, R.; Mohan, S.; Sabaté, J. Effect of altering dietary n-6: N-3 polyunsaturated fatty acid ratio with plant and marine-based supplement on biomarkers of bone turnover in healthy adults. Nutrients 2017, 9, 1162. [Google Scholar] [CrossRef] [PubMed]
- Takada, I.; Kouzmenko, A.P.; Kato, S. Wnt and PPARγ signaling in osteoblastogenesis and adipogenesis. Nat. Rev. Rheumatol. 2009, 5, 442–447. [Google Scholar] [CrossRef]
- Lecka-Czernik, B. Bone loss in diabetes: Use of antidiabetic thiazolidinediones and secondary osteoporosis. Curr. Osteoporos. Rep. 2010, 8, 178–184. [Google Scholar] [CrossRef]
- Groenendijk, I.; Grootswagers, P.; Santoro, A.; Franceschi, C.; Bazzocchi, A.; Meunier, N.; Caille, A.; Malpuech-Brugere, C.; Bialecka-Debek, A.; Pietruszka, B. Protein intake and bone mineral density: Cross-sectional relationship and longitudinal effects in older adults. J. Cachexia Sarcopenia Muscle 2023, 14, 116–125. [Google Scholar] [CrossRef] [PubMed]
- Steell, L.; Sillars, A.; Welsh, P.; Iliodromiti, S.; Wong, S.; Pell, J.; Sattar, N.; Gill, J.; Celis-Morales, C.; Gray, S. Associations of dietary protein intake with bone mineral density: An observational study in 70,215 UK Biobank participants. Bone 2019, 120, 38–43. [Google Scholar] [CrossRef]
- Abbas, A.; Grant, P.J.; Kearney, M.T. Role of IGF-1 in glucose regulation and cardiovascular disease. Expert Rev. Cardiovasc. Ther. 2008, 6, 1135–1149. [Google Scholar] [CrossRef] [PubMed]
- Sonntag, W.E.; Lynch, C.; Thornton, P.; Khan, A.; Bennett, S.; Ingram, R. The effects of growth hormone and IGF-1 deficiency on cerebrovascular and brain ageing. J. Anat. 2000, 197, 575–585. [Google Scholar] [CrossRef]
- Crane, J.L.; Cao, X. Function of matrix IGF-1 in coupling bone resorption and formation. J. Mol. Med. 2014, 92, 107–115. [Google Scholar] [CrossRef]
- Reed, B.Y.; Zerwekh, J.E.; Sakhaee, K.; Breslau, N.A.; Gottschalk, F.; Pak, C.Y. Serum IGF 1 is low and correlated with osteoblastic surface in idiopathic osteoporosis. J. Bone Miner. Res. 1995, 10, 1218–1224. [Google Scholar] [CrossRef]
- Hammerman, M.R. Insulin-like growth factors and aging. Endocrinol. Metab. Clin. N. Am. 1987, 16, 995–1011. [Google Scholar] [CrossRef]
- Ashpole, N.M.; Herron, J.C.; Mitschelen, M.C.; Farley, J.A.; Logan, S.; Yan, H.; Ungvari, Z.; Hodges, E.L.; Csiszar, A.; Ikeno, Y. IGF-1 regulates vertebral bone aging through sex-specific and time-dependent mechanisms. J. Bone Miner. Res. 2016, 31, 443–454. [Google Scholar] [CrossRef]
- Bredella, M.A.; Torriani, M.; Ghomi, R.H.; Thomas, B.J.; Brick, D.J.; Gerweck, A.V.; Rosen, C.J.; Klibanski, A.; Miller, K.K. Vertebral bone marrow fat is positively associated with visceral fat and inversely associated with IGF-1 in obese women. Obesity 2011, 19, 49–53. [Google Scholar] [CrossRef] [PubMed]
- AsghariHanjani, N.; Vafa, M. The role of IGF-1 in obesity, cardiovascular disease, and cancer. Med. J. Islam. Repub. Iran 2019, 33, 56. [Google Scholar] [CrossRef] [PubMed]
- Garnero, P.; Sornay-Rendu, E.; Delmas, P.D. Low serum IGF-1 and occurrence of osteoporotic fractures in postmenopausal women. Lancet 2000, 355, 898–899. [Google Scholar] [CrossRef] [PubMed]
- Ohlsson, C.; Mellström, D.; Carlzon, D.; Orwoll, E.; Ljunggren, Ö.; Karlsson, M.K.; Vandenput, L. Older men with low serum IGF-1 have an increased risk of incident fractures: The MrOS Sweden study. J. Bone Miner. Res. 2011, 26, 865–872. [Google Scholar] [CrossRef] [PubMed]
- Webster, J.; Dalla Via, J.; Langley, C.; Smith, C.; Sale, C.; Sim, M. Nutritional strategies to optimise musculoskeletal health for fall and fracture prevention: Looking beyond calcium, vitamin D and protein. Bone Rep. 2023, 101684. [Google Scholar] [CrossRef]
- Fuglsang-Nielsen, R.; Rakvaag, E.; Vestergaard, P.; Hermansen, K.; Gregersen, S.; Starup-Linde, J. The Effects of 12-Weeks Whey Protein Supplements on Markers of Bone Turnover in Adults with Abdominal Obesity–A Post Hoc Analysis. Front. Endocrinol. 2022, 13, 832897. [Google Scholar] [CrossRef]
- Roughead, Z.K. Is the interaction between dietary protein and calcium destructive or constructive for bone?: Summary. J. Nutr. 2008, 133, 866S–869S. [Google Scholar] [CrossRef]
- Day, S.; Munski, J. Nutritional considerations in hip fracture. Tech. Orthop. 2004, 19, 223–228. [Google Scholar] [CrossRef]


| Ref | Nutrient Type | Description | Study Type; N of Subjects | Follow-Up Period and Age Range or Mean Age | Bone Fracture Outcomes |
|---|---|---|---|---|---|
| Mozaffari et al., 2020 [86] | CHO | Meta-analysis of five studies [87,88,89,90,91] | Observational; 38,828 subjects | 3–7.6 years ≥34 years | ↔ fracture risk in high-carbohydrate-intake group (overall RR (random) = 1.24; 95% CI 0.84 to 1.84; p = 0.27; I2 = 57.7%; Phet = 0.05) (vs. low) |
| Xu et al., 2009 [87] | Case–control; 418 subjects | N/A 61 years | ↔ fracture risk in high-intake group (vs. low) | ||
| Kato et al., 2000 [88] | Prospective; 4884 subjects | 7.6 years 34–65 years | ↔ fracture risk in high-intake group (vs. low) | ||
| Michaelson et al., 1995 [89] | Case–control; 1140 subjects | N/A 67 years | ↔ fracture risk in high-intake group (vs. low) | ||
| Ramirez et al., 2007 [90] | Case–control; 334 subjects | N/A 72 years | ↔ fracture risk in high-intake group (vs. low) | ||
| Munger et al., 1999 [91] | Prospective; 32,050 subjects | 3 years 55–69 years | ↔ fracture risk in high-intake group (vs. low) | ||
| Huang et al., 1996 [92] | Prospective; 2513 subjects | 13.4 years 45–77 years | ↓ fracture risk by 20% in high-intake group (vs. low) | ||
| Benetou et al., 2011 [93] | Prospective; 29,122 subjects | 8 years 60–86 years | ↔ fracture risk in high-intake group (vs. low) |
| Ref | Nutrient Type | Description | Studies | Study Type; N of Subjects | Follow-Up Period Age Range or Mean Age | BMD and/or Bone Fracture and/or BTM Outcomes |
|---|---|---|---|---|---|---|
| Darling et al., 2019 [94] | Total protein | Four meta-analyses of BMD outcomes | 19 studies [95,96,97,98,99,100,101,102,103,104,105,106,107,108,109,110,111] | Cross-sectional; 4786 subjects | N/A 20–89 years | ↔ FN BMD with total protein intake (r (fixed) = 0.07; 95% CI 0.04 to 0.09; R2 = 0.005 (0.5%); p < 0.0001; I2 = 26%; Phet = 0.15) |
| 18 studies [95,97,98,100,101,102,103,105,106,107,108,109,110,111,112,113,114,115] | Cross-sectional; 4257 subjects | N/A 20–89 years | ↔ LS BMD with total protein intake (r (random) = 0.09; 95% CI 0.04 to 0.14; R2 = 0.008 (0.8%); p < 0.001; I2 = 58%; Phet = 0.001) | |||
| Two studies [116,117] | RCT; 255 subjects | 7–18 months ≥60 years | ↔ LS BMD with total protein intake (MD (fixed) = 0.04; 95% CI 0.00 to 0.08; I2 = 0.0%; Phet = 0.47) | |||
| Three studies [116,117,118] | RCT; 435 subjects | 7–24 months ≥60 years | ↔ FN BMD with total protein intake (MD (random) = 0.01; 95% CI −0.03 to 0.05; I2 = 68%; Phet = 0.04) | |||
| Two meta-analyses of bone fracture outcomes | Three studies [119,120,121] | Prospective; 9263 subjects | 12–17 years (14) 20–62 years | ↔ HR for all fractures with total protein intake (HR (random) = 0.82; 95% CI 0.59 to 1.14; p = 0.24; I2 = 35%; Phet = 0.19) | ||
| Three studies [122,123,124] | Case–control; 3164 subjects | N/A 50–103 years | ↔ OR of fracture (OR (random) = 0.69; 95% CI 0.30 to 1.58; p = 0.38; I2 = 65%; Phet = 0.03) | |||
| MBP | A meta-analysis of BMD outcomes | Three studies [125,126,127] | RCT; 115 subjects | 6–8 months 30.5 years | ↔ LS BMD (MD (fixed) = 0.02; 95% CI 0.00 to 0.04; p = 0.08; I2 = 0.0%; Phet = 0.87) | |
| Animal protein | Three meta-analyses of bone fracture outcomes | Four studies [91,128,129,130] | Prospective; 193,954 subjects | 3–12 years (9.6) 30–69 years | ↔ all low-trauma fractures (RR (random) = 0.98; 95% CI 0.76 to 1.27; p = 0.87; I2 = 46% Phet = 0.13) | |
| Vegetable protein | Three studies [91,129,130] | Prospective; 154,167 subjects | 3–12 years (9) 30–69 years | ↔ all low-trauma fractures (RR (fixed) = 0.97; 95% CI 0.89 to 1.09; p = 0.61; I2 = 15%; Phet = 0.31) | ||
| Total protein | Four studies [91,129,130,131] | Prospective; 156,416 subjects | 3–13.9 years (10.2) 30–69 years | ↔ all low-trauma fractures (RR = 0.94; 95% CI 0.72 to 1.23; p = 0.55; I2 = 32%; Phet = 0.31) | ||
| Shams-White et al., 2017 [132] | Total Protein | Three meta-analyses of BMD outcomes | Five studies [117,133,134,135,136] | RCT; 989 subjects | 12–24 months (18) ≥40 years | ↑ LS BMD with higher protein (net percentage change = 0.52%; 95% CI 0.06 to 0.97; I2 = 0.0%; Phet = 0.579) (vs. lower) |
| Six studies [117,118,133,134,135,136] | RCT; 1172 subjects | 12–24 months (22.8) ≥40 years | ↔ FN BMD on higher protein intake (pooled mean percentage change = −0.14%; 95% CI −0.60 to 0.32; I2 = 0.0%; Phet = 0.952) (vs. lower) | |||
| Seven studies [117,118,133,134,135,136,137] | RCT; 1208 subjects | 12–24 months (18) ≥40 years | ↔ TH BMD on higher protein intake (pooled net percentage change = 0.30%; 95% CI −0.02 to 0.62; I2 = 0.0%; Phet = 0.539) (vs. lower) | |||
| Two meta-analyses of BTM outcomes | Eight studies [117,125,133,135,138,139,140,141] | RCT; 494 subjects | 6–24 months (12.8) 40–92 years | ↔ OC on higher protein intakes (pooled net change: 0.06 ng/mL; 95% CI −0.49 to 0.60; I2 = 27.2%; Phet = 0.211) (vs. lower) | ||
| Five studies [117,133,137,139,141] | RCT; 370 subjects | 12–24 months (15.6) 40–92 years | ↔ CTX in higher protein intake (pooled net change = 47.72 ng/L; 95% CI −27.34 to 122.78; I2 = 61.3%; Phet = 0.035) (vs. lower) | |||
| Shams-White et al., 2018 [142] | Isoflavone -rich soy protein vs. animal protein | Three meta-analyses of BMD outcomes | Four studies [143,144,145,146] | RCT; 393 subjects | 12–24 months (15) 66 years | ↔ LS BMD (pooled mean percentage change = 0.24%; 95% CI −0.80 to 1.28; I2 = 0.0%) |
| Three studies [144,145,146] | RCT; 331 subjects | 12–24 months (16) 67.8 years | ↔ FN BMD (pooled mean percentage change = 0.13%; 95% CI = −0.94 to 1.21; I2 = 0.0%) | |||
| Three studies [143,144,146] | RCT; 218 subjects | 12–24 months (16) 63.7 years | ↔ TB BMD (pooled mean percentage change = −0.24%; 95% CI −0.81 to 0.33; I2 = 0.0%) | |||
| Wallace and Frankenfeld et al., 2017 [147] | Total protein | A meta-analysis of bone fracture outcomes | Five studies [91,120,131,148,149] | Prospective; 289,707 subjects | 1–22 years (12.4) 20–79 years | ↓ hip fractures in higher protein intake (SMD = 0.84%; 95% CI 0.73 to 0.95; I2 = 36.8%; Phet = 0.161) (vs. low) |
| Two meta-analyses of BTM outcomes | 13 studies [73,82,117,150,151,152,153,154,155,156] | RCT; 509 subjects | 4 days to 9 weeks 20–75 years | ↑ urinary Ca excretion with protein intake (SMD = 0.48; 95% CI = 0.30 to 0.66; I2 = 28.3%; Phet = 0.167) | ||
| Seven studies [73,125,150,152,155,157] | RCT; 243 subjects | 4 days to 9 weeks 20–75 years | ↔ u-NTX with protein intake (SMD = −0.18; 95% CI −0.99 to 0.26; I2 = 66.3%; Phet = 0.007) | |||
| Darling et al., 2009 [158] | Total protein | Three meta-analyses of BMD outcomes | Three studies [116,125,126] | RCT; 110 subjects | 6–7 months (6.3) 51.3 years | ↔ LS BMD with protein supplementation (WMD (fixed) = 0.02; 95% CI 0.00 to 0.04; p = 0.04; I2 = 0.0%; Phet = 0.62) |
| Soy protein | Three studies [145,159,160] | RCT; 264 subjects | 6–12 months (8) 44–75 years | ↔ LS BMD with soy protein supplementation (WMD (fixed) = 0.01; 95% CI −0.05 to 0.06; p = 0.86; I2 = 54.1%; Phet = 0.11) | ||
| MBP | Two studies [125,126] | RCT; 62 subjects | 6 months 35.9 years | ↔ LS BMD with MBP supplementation (WMD (fixed) = 0.02; 95% CI 0.00 to 0.04; p = 0.07; I2 = 0.0%; Phet = 0.85) | ||
| Total Protein | Three meta-analyses of bone fracture outcomes | Three studies [91,129,131] | Prospective; 120,199 subjects | 3–13.9 years (9.6) 30–74 years | ↔ fracture risk in the highest quintile of total protein intake (RR (random) = 0.75; 95% CI 0.47 to 1.21; p = 0.23; I2 = 20.4%; Phet = 0.28) (vs. lowest) | |
| Animal protein | Three studies [91,128,129] | Prospective; 157,737 subjects | 3–12 years (8.8) 30–69 years | ↔ fracture risk in the highest quintile of animal protein intake (RR (random) = 0.83; 95% CI = 0.54 to 1.30; p = 0.42; I2 = 48.3%; Phet = 0.14) (vs. lowest) | ||
| Vegetable protein | Two studies [91,129] | Prospective; 117,950 subjects | 3–12 years (7.5) 30–69 years | ↔ fracture risk in the highest quintile of vegetable protein intake (RR (random) = 1.21; 95% CI 0.82 to 1.79; I2 = 2.0%; p = 0.34; Phet = 0.31) (vs. lowest) |
| Nutrient Type | Ref | Study Type | N of Subjects Study Design | Follow-Up Period and Age | BMD Outcomes |
|---|---|---|---|---|---|
| Total protein | Kyriazopoulos et al., 2006 [10] | Cross- sectional | 300 healthy Caucasian men Four categories of protein intake (g/week): Group 1: 0–84; Group 2: 126–168; Group 3: 210–252; Group 4: 294–420 | N/A 18–30 years (22.58 ± 3.34) | ↔ distal radius BMD or BMC with protein intake |
| Total protein | Alissa et al., 2014 [95] | Cross- sectional | 300 postmenopausal Saudi women | N/A 46–88 years (59.9 ± 0.5) | ↔ LS BMD with energy-adjusted protein ↑ FN BMD (r = 0.182), TH BMD (r = 0.244) with energy-adjusted protein |
| Chan et al., 2009 [96] | Cross- sectional | 441 premenopausal women | N/A 20–35 years | ↓ TH BMD (r = −0.103) with dietary protein ↔ FN BMD and LS BMD with dietary protein | |
| Coin et al., 2008 [97] | Cross- sectional | 352 elderly outpatients | N/A Men: 73.9 ± 5.6 years Women: 73.5 ± 5.3 years | ↑ TH BMD (R2 = 0.06) and troch BMD (R2 = 0.08) in men ↔ FN BMD in men | |
| Chiu et al., 1997 [98] | Cross- sectional | 258 postmenopausal Taiwanese women Exposure: protein intake (% of E) | N/A 40–87 years (60.79 ± 9.23) | ↑ LS BMD (β = 0.039) with energy intake from protein ↔ FN BMD (β = 0.012) with energy intake from protein ↓ LS osteopenia by 49% after multivariate adjustment ↔ FN osteopenia after multivariate adjustment | |
| Guun et al., 2014 [99] | Cross- sectional | 142 healthy postmenopausal women | N/A 50–70 years | ↑ FN BMD after adjustment for energy values (r = 0.19) | |
| Cooper et al., 1996 [100] | Cross- sectional | 290 pre- and postmenopausal women | N/A Premenopausal women: 39 years Postmenopausal women: 68 years | ↑ femoral troch BMD (r = 0.35), FN BMD (r = 0.27), and distal radius BMD (r = 0.28) in premenopausal women after multivariate adjustment ↔ LS BMD, midradius BMD, and femoral shaft BMD after multivariate adjustment ↔ LS BMD, femoral troch BMD, FN BMD, distal radius BMD, midradius BMD, and femoral shaft BMD in postmenopausal women after multivariate adjustment | |
| Henderson et al., 1995 [101] | Cross- sectional | 115 healthy, sexually mature Caucasian women | N/A 18 years | ↔ LS BMD, femoral shaft BMD, and distal tibia and fibula BMD after multivariate adjustment ↑ FN BMD (r = 0.22), troch BMD (r = 0.27), intertrochanter BMD (r = 0.19), and TH BMD (r = 0.21) after multivariate adjustment | |
| Soy protein | Ho et al., 2003 [102] | Cross- sectional | 454 healthy Chinese women within the first 12 years of menopause | N/A 48–62 years (55.1 ± 3.57) | ↔ LS BMD, FN BMD, troch BMD, intertrochanter BMD, TH BMD, and TB BMD after multivariate adjustment |
| Total protein | Kumar et al., 2010 [103] | Cross- sectional | 225 healthy women | N/A 20–69 years (40.5 ± 12.7) | ↑ LS BMD after multivariate adjustment (r = 0.224) ↔ FN BMD and Ward BMD after multivariate adjustment |
| Total protein | Jaime et al., 2006 [104] | Cross- sectional | 277 Brazilian black and white men | N/A >50 years (white, 62.6 ± 8.14; black, 59.7 ± 5.63) | ↔ FN BMD in the white men (r = 0.055) after adjusting for energy intake ↑ FN BMD in the black men (r = 0.359) after adjusting for energy intake ↔ FN BMD in the white men (β = 0.00058) and black men (β = 0.00192) after adjusting for energy intake |
| Total protein | Lau et al., 1998 [105] | Cross- sectional | 76 vegetarian Chinese women | N/A 70–89 years (79.1 ± 5.2) | ↔ LS BMD, FN BMD, intertrochanter BMD, and Ward BMD after multivariate adjustment |
| Total protein | Michaëlsson et al., 1995 [106] | Cross- sectional | 175 Caucasian women | N/A 28–74 years | ↔ TB BMD and LS BMD with nutrients from dietary records after multivariate adjustment ↑ FN BMD with nutrients from dietary records after multivariate adjustment (β = 0.0028) ↑ TB BMD with nutrients estimated from FFQ after multivariate adjustment (β = 0.0020) ↔ LS BMD and FN BMD with nutrients estimated from FFQ after multivariate adjustment |
| Total protein | New et al., 1997 [107] | Cross- sectional | 994 healthy premenopausal women | N/A 45–49 years (47.1 ± 1.43) | ↔ LS BMD, FN BMD, femoral troch BMD, and femoral Ward BMD after multivariate adjustment |
| Total protein | Orozco López et al., 1998 [108] | Cross- sectional | 76 premenopausal women Mean protein intake (g/day): Total protein: 73.4; Animal protein: 49.7; Vegetable protein: 23.7. | N/A 42 years | ↔ LS BMD, FN BMD, troch BMD, intertrochanter BMD, and Ward BMD with protein intake |
| Total protein | Rapuri et al., 2003 [109] | Cross- sectional and Prospective | 473 postmenopausal women Dietary protein intake (% of E) Q1: 13.1 ± 0.12; Q2: 15.1 ± 0.11; Q3: 16.7 ± 0.12; Q4: 19.8 ± 0.12. | N/A 65–77 years | Cross-sectional analysis: ↑ LS BMD in Q4 of protein intake (vs. Q2, Q3) ↑ midradius BMD and TB BMD in Q4 of protein intake (vs. Q2) ↔ FN BMD, troch BMD, and TH BMD ↑ LS BMD with protein in Q3 and Q4 of Ca intake (vs. Q1 Ca intake) ↔ TB BMD with protein intake in Q3 and Q4 of Ca intake (vs. Q1 intake) ↔ midradius BMD, troch BMD, and TH BMD with protein intake and Ca intake Prospective analysis: ↔ TH BMD, FN BMD, troch BMD, Ward, TB BMD, and radius BMD with protein intake |
| Total protein | Teegarden et al., 1998 [110] | Cross- sectional | 215 white women | N/A 18–31 years (23.8 ± 3.6) | ↑ radius BMD and LS BMD |
| Total protein | Wang et al., 1997 [111] | Cross- sectional | 125 Mexican American Caucasian women | N/A 59–84 years (68.0 ± 5.1) | ↔ FN BMD and LS BMD |
| Soy protein | Horiuchi et al., 2000 [112] | Cross- sectional | 85 postmenopausal women | N/A 52–83 years (66.9 ± 7.4) | ↔ LS BMD after multivariate adjustment |
| Total protein | Quintas et al., 2003 [113] | Cross- sectional | 164 women | N/A Control: 16.2 ± 1.0 years Dancers: 16.2 ± 2.0 years Basketballers: 17.2 ± 2.1 years Skiers: 17.1 ± 2.9 years | ↑ LS BMD (r = 0.31726) and right hip BMD (r = 0.3005) after multivariate adjustment |
| Total protein | Thorpe et al., 2008 [114] | Cross- sectional | 161 postmenopausal women | N/A 67.9 ± 7.4 years | ↑ LS areal BMD with a direct effect of protein intake ↑ TH areal BMD on protein intake |
| Total protein | Whiting et al., 2002 [115] | Cross- sectional | 57 men | N/A 39–42 years (39.6 ± 0.6) | ↑ TB BMD (r = 0.383), hip BMD (r = 0.322), LS BMD (r = 0.419), and TB BMD (β = 0.00193; SE = 0.00065; t = 2.96) after multivariate adjustment |
| Total protein | Tkatch et al., 1992 [116] | Parallel RCT | 48 elderly men and women Intervention (g/day): Protein: 20.4; control: 0 | 7 months ≥60 years (82) | ↔ FN BMD, femoral shaft BMD, and LS BMD between groups ↑ femoral shaft BMD within the protein group |
| MBP | Kerstetter et al., 2015 [117] | Parallel RCT: double blind | 208 men and women Intervention (g/day): Whey protein: 45 of whey protein Control: 0 All subjects: 400 IU vitamin D | 18 months Men: ≥70 years Women: ≥60 years | ↔ LS BMD, TH BMD, and FN BMD |
| MBP | Zhu et al., 2011 [118] | Parallel RCT: double blind | 186 healthy ambulant postmenopausal women Protein intake (g/day): Protein: 30 (whey protein + skim milk); placebo: 2.1 (skim milk) | 2 years 70–80 years (74.3 ± 2.7) | ↔ TH BMD between groups ↔ FN BMD between groups and within groups |
| MBP | Aoe et al., 2005 [125] | Parallel RCT: double blind | 27 healthy menopausal women Protein intake (mg/day): MBP group: 40; placebo group: 0 | 6 months 50.5 ± 3.0 years | ↑ LS BMD in the MBP group (vs. placebo) |
| MBP | Uenishi et al., 2007 [126] | Parallel RCT: double blind | 35 healthy young women Protein intake (mg/day): MBP: 40; placebo: 0 | 6 months 21.3 ± 1.2 years | ↑ LS BMD gain in the MBP group (vs. placebo) |
| MBP | Zou et al., 2009 [127] | Parallel RCT | 81 healthy young women Intervention (/day): MBP (40 mg of milk) group: 250 mL whole milk + 40 mg of MBP Whole-milk group: 250 mL Whole-milk control group: N/A | 8 months 19.6 ± 0.6 years | ↑ TB BMD within all groups ↔ LS BMD and left forearm BMD |
| Total protein | Jesudason et al., 2013 [133] | Parallel RCT | 136 postmenopausal women Protein intake (g/day) High protein (HP): >90 High normal protein (HNP): <80 | 24 months 40–70 years (HP: 59.5 ± 0.4; HNP: 59.4 ± 0.4) | ↔ L2–L4 BMD, distal forearm BMD, TH BMD, and FN BMD in the HP group (time, diet, diet × time vs. the HNP group) |
| MBP | Kukuljan et al., 2009 [134] | Parallel RCT | 175 healthy men Protein intake (g/day): Milk: 13.2; Control: 0 | 12 months 50–79 years (MBP: 61.7 ± 7.7; control: 59.9 ± 7.4) | ↑ TH BMD within the milk group ↔ FN BMD, LS BMD, TH BMD, and troch BMD with milk intake after adjusting for changes in weight |
| Total protein | Sukumar et al., 2011 [135] | Parallel RCT | 47 healthy overweight/obese postmenopausal women Protein intake (% of E): HP: 30; NP: 18 | 1 year 58 ± 4 years | ↑ LS BMD in the HP group (vs. NP) ↔ TB BMD, FN BMD, TH BMD, and BMC |
| Total protein | Tirosh et al., 2015 [136] | Parallel RCT | 424 healthy adults Protein intake (% kcal/day): High protein: 25 (35% and 55% carbohydrate group) Average protein: 15 (45% and 65% carbohydrate group) | 24 months 51.8 ± 8.9 years | ↔ LS BMD and FN BMD |
| MBP | Flodin et al., 2014 [137] | Parallel RCT | 67 patients with a recent hip fracture Intervention (/day): Bisphosphonates + nutritional supplementation (BN): 40 g of MBP + 5 mg of risedronate Bisphosphonates (B): 0 g of MBP + 5 mg of risedronate Controls (C): placebo All subjects: 1000 mg of Ca + 800 IU vitamin D3 | 1 year >60 years (79 ± 9) | ↔ TB BMD, TH BMD |
| MBP | Holm et al., 2008 [139] | Parallel RCT: double blind | 29 healthy, early postmenopausal women Intervention (/day): Nutrient (NUT): 10 g of whey protein, 31 g of carbohydrate, 1 g of fat, 5.0 μg of vitamin D, and 250 mg of Ca Control (C): 6 g of carbohydrate and 12 mg of Ca | 24 weeks Nut: 55 ± 1 years C: 55 ± 1 years | ↑ LS BMD within groups ↔ FN BMD, TB BMD within groups |
| MBP | Schürch et al., 1998 [140] | Parallel RCT: double blind | 82 orthopedic patients with recent hip fracture Intervention (g/day): Protein: 20 milk protein (5 days/week); Control: 0 | 12 months >60 years (protein: 81.1 ± 7.4; control: 80.2 ± 7.4) | ↔ LS BMD, FN BMD, troch BMD, femoral shaft BMD, and TB BMC between groups ↑proximal femur BMD in the protein group (vs. control) |
| MBP | Tengstrand et al., 2007 [141] | Parallel RCT | 52 lean, postmenopausal patients with recent FN fracture Intervention (g/day): Nutrition (PR) and combined therapy (PR/N): 20 Controls (C): 0 All subjects: 1 g of Ca + 800 IE vitamin D | 12 months 70–92 years (83 ± 5) | ↑ TB BMD within the PR group at month 6 and 12 ↔ FN BMD within the PR group |
| Soy protein | Arjmandi et al., 2005 [143] | Parallel RCT: double blind | 62 postmenopausal women Intervention (/day): Soy: 25 g of soy protein + 60 mg of isoflavones Control: 25 g of non-soy protein | 1 year <65 years (soy: 53 ± 6; control: 56 ± 5) | ↔ LS BMD, TH BMD, TB BMD, TB BMC, LS BMC, and TH BMC in the soy group (vs. control) |
| Soy protein | Kenny et al., 2009 [144] | Parallel RCT: double blind | 97 healthy ambulatory postmenopausal women Intervention (/day): Soy protein placebo (SPI−), soy protein isoflavone (SPI+): 18 g of soy protein Control protein placebo, control protein isoflavone: 18 g of milk and egg white protein Co-intervention (/day): SPI+: 35 mg of isoflavone All subjects: if not achieving 1200–1500 mg of Ca via diet, they were administered 315 mg of Ca and 200 IU vitamin D | 1 year >60 years (73.1 ± 5.9) | ↔ TB BMD, FN BMD, and LS BMD between groups |
| Soy protein | Kreijkamp et al., 2004 [145] | Parallel RCT: double blind | 175 healthy postmenopausal women Intervention (g/day): Soy protein + isoflavones (SPI+): 25.6 isoflavone-rich soy protein Placebo: 25.6 milk protein | 1 year 60–75 years (SPI+, 66.5 ± 4.7; placebo, 66.7 ± 4.8) | ↔ FN BMD, LS BMD, and TH BMD in the SPI+ group (vs. placebo) |
| Soy protein and MBP | Vupadhyayula et al., 2009 [146] | Parallel RCT: double blind | 157 healthy postmenopausal women Intervention (g/day): Soy protein: 25 of soy protein isolate; soy protein + isoflavone: 25 of soy protein isolate + 90 mg of isoflavone; milk protein: 25 of casein and whey | 2 years Soy protein: 63.6 ± 0.6 years Soy protein + isoflavone: 63.4 ± 0.6 years Milk protein: 63.8 ± 0.5 years | ↔ FN BMD, LS BMD, and TB BMD after adjustment |
| Total protein | Beasley et al., 2014 [148] | Prospective: Women’s Health Initiative clinical trials | 144,580 postmenopausal women Dietary protein intake (% of E): Q1: <13.3; Q3: 14.2–14.8; Q5: ≥15.6. | 6 years 50–79 years | ↑ TB BMD and hip BMD with each 20% increase in protein intake ↔ LS BMD with protein intake |
| Total protein | Dawson-Hughes et al., 2004 [150] | Parallel RCT | 32 healthy adults Protein intake (g/day): High protein: 57.6 ± 8.2; Low protein: 2.8 ± 0.5; All subjects: 800 mg of Ca. | 9 weeks ≥50 years (high protein, 71.8 ± 9.8; low protein, 64.6 ± 10.8) | ↑ TB BMC increased within high-protein group ↔ TB BMC between groups |
| Animal protein | Hunt et al., 1995 [151] | Parallel RCT | 14 women Meat consumption (% of E): High meat (HM): 289 g (20%); Low meat (LM): 38.5 g (10%); Low meat with mineral supplement (LS). | 7 weeks 51–70 years (62.9 ± 6.1) | ↔ LS BMC and LS BMD |
| Soy protein vs. animal protein | Alekel et al., 2000 [159] | Parallel RCT: double blind | 69 healthy perimenopausal women Intervention (g/day): Isoflavone soy protein (SPI) groups: 40 (soy protein) Control: 40 (whey protein) Co-intervention (/day): Isoflavone-rich soy protein (SPI+): 80.4 mg of aglycone components Isoflavone-poor soy protein (SPI−): 4.4 mg of aglycone components All subjects: 650 mg Ca | 6 months 50.6 years | ↑ LS BMD (5.6%) and LS BMC (10.1%) in the SPI+ group (treatment effect) ↑ LS BMD difference after adjustment for all covariates (SPI+ vs. whey; SPI+ vs. SPI plus whey; and SPI+ plus SPI vs. whey) ↑ LS BMC difference after adjustment for all covariates ((SPI+ vs. whey; SPI+ vs. SPI plus whey; and SPI+ plus SPI vs. whey) |
| Soy protein | Potter et al., 1998 [160] | Parallel RCT: double blind | 66 postmenopausal women with hypercholesterolemia Intervention (g/day): Isolated soy protein with higher isoflavones (ISP 90): 40 of soy protein + high isoflavone (2.25 mg) Isolated soy protein with moderate isoflavones (ISP 52): 40 of soy protein + moderate isoflavone (1.39 mg) Control: casein and nonfat dry milk protein (CNFDM) | 6 months intervention + 2 weeks basal lead-in period ISP 56: 49–73 years; ISP 90: 39–83 years; CNFDM: 51–74 years | ↑ LS BMD, BMC after 6 months only in the ISP 90 group (vs. control) ↔ FN BMD, BMC; TB BMD, and BMC |
| Total protein | Thorpe et al., 2008 [161] | Parallel RCT | 130 healthy, overweight adults Intervention (/day): Protein diet (P): 1.4 g/kg + three servings of dairy Carbohydrate diet (C): 0.8 g/kg + two servings of dairy | 12 months 45.6 ± 8.9 years | ↑ TB BMD in the P group (diet × time vs. the C group) ↑ TB BMD, LS BMD, and TH BMD in the P group (diet vs. C group) ↑ TB BMC in the P group (diet × time vs. the C group) ↑ LS BMC, TH BMC in the P group (diet vs. the C group) |
| Total protein | Dawson-Hughes et al., 2002 [162] | Parallel RCT | 342 healthy older adults Intervention (/day): Treatment: 500 mg of Ca + 700 IU vitamin D Placebo: placebo Protein intake (% of total E) Q1: 9.64–15.49; Q2: 15.53–18.15; Q3: 18.16–29.14 | 3 years ≥65 years | ↓ TB BMD, FN BMD loss with higher protein intake in the treatment group ↔ TB BMD loss with higher protein intake in the placebo group ↔ LS BMD |
| Total protein and animal protein | Hannan et al., 2000 [163] | Prospective: Framingham Osteoporosis Study | 615 old adults Protein intake (g/day): Q1: 17–51; Q2: 52–67; Q3: 68–83; Q4: 84–152 | 4 years 68–91 years (75 ± 4.4) | ↑ FN BMD, Ward BMD, and LS BMD loss in Q1 of total protein intake after multivariate adjustment (vs. Q4) ↔ troch BMD and radial shaft BMD loss in Q1 of total protein after multivariate adjustment (vs. Q4) ↑ FN BMD loss in Q1 and Q2 of animal protein intake after multivariate adjustment (vs. Q4) ↑ Ward BMD and LS BMD loss in Q1 of animal protein intake after multivariate adjustment (vs. Q4) ↔ troch BMD and radial shaft BMD loss in Q1 of animal protein intake after multivariate adjustment (vs. Q4) |
| Total protein and soy protein | Ho et al., 2008 [164] | Prospective: Framingham Osteoporosis Study | 483 women Total protein (g/day): Q1: 12.5–34.5; Q2: 34.6–43.8; Q3: 43.9–56.1; Q4: 56.2–181.1. Soy protein (g/day): Q1: 0–1.06; Q2: 1.07–2.84; Q3: 2.85–5.71; Q4: 5.72–38.55 | 2.5 years 45–55 years (49.9 ± 2.7) | ↔ LS BMD, FN BMD, TH BMC, and TB BMC with total protein and soy protein intake after adjustment for age–menopause stage and dietary E intake |
| Total protein | Promislow et al., 2002 [165] | Prospective: Rancho Bernardo Heart and Chronic Disease Study | 960 adults | 4 years 55–92 years (men: 70.0 ± 8.5; women: 71.2 ± 8.7) | ↔ TH BMD, FN BMD, and LS BMD with total protein |
| Total protein | Recker et al., 1992 [166] | Prospective | 156 healthy, nulliparous, young adult women | 3.4 years 18.5–26 years (21.4 ± 1.7) | ↔ LS BMD change rate with protein intake |
| Total protein | Sahni et al., 2014 [167] | Prospective: Framingham Offspring Study | 1175 men and women Exposure: protein intake (% of E) | 4.6 years 29–86 years (61 ± 9) | ↔ FN BMD, LS BMD with protein after multivariate adjustment |
| Total protein | Li et al., 2010 [168] | Parallel RCT | 70 healthy, overweight/obese adults Intervention (/day): High-protein-enriched (HP): 2.2 g/kg of LBM (30% of E) Standard protein (SP): 1.1 g/kg of LBM (15% of E) | 13 months 49.4 ± 11.0 years | ↔ TB BMD |
| Total protein | Gregg et al., 1999 [169] | Cross- sectional: Women’s Healthy Lifestyle Project (WHLP) | 393 women | N/A 45–53 years (48.8 ± 1.8) | ↑ BUA, SOS, and LS BMD with higher dietary protein intake ↔ FN BMD with higher dietary protein intake |
| Total protein | Lacey et al., 1991 [170] | Cross- sectional | 178 Japanese women | N/A Premenopausal: 35–40 years (37.6 ± 2.01), postmenopausal: 55–60 years (58.0 ± 1.84) | ↑ midradial BMC (r = 0.22; coefficient = 7.01) with % protein after adjusting for age, BMI, and kcal (for nutrients) among premenopausal women ↑ Correlation with protein and midradial BMC (r = 0.21; coefficient = 1.78) adjusting for age, BMI, and kcal (for nutrients) among postmenopausal women |
| Total protein | Metz et al., 1993 [171] | Cross- sectional | 38 Caucasian women | N/A 24–28 years (25.9 ± 1.4) | ↓ mid BMC (semipartial R2 = 0.153, regression coefficient = −0.503), distal BMC (semipartial R2 = 0.123, regression coefficient = −0.450) and distal BMD (semipartial R2 = 0.114, regression coefficient = −0.434) with protein intake ↔ mid BMD (semipartial R2 = 0.038, regression coefficient = −0.251) with protein intake |
| Total protein | Tylavsky et al., 1988 [172] | Cross- sectional | 366 postmenopausal women Lacto-ovo-vegetarian (L) Omnivore (O) | N/A 60–98 years (L, 73.0 ± 0.8; O, 78.8 ± 0.4) | ↑ distal BMC (β = 2.72) and mid BMC (β = 2.96) with protein intake ↔ distal BMD (β = 0.63) and mid BMD (β = 1.36) with protein intake |
| Total protein, dairy protein, nondairy protein, and vegetable protein | Langsetmo et al., 2017 [173] | Prospective: Osteoporotic in Men (MrOS) | 5875 men Protein intake (% of E): Q1: 6.0–14.1; Q2: 14.2–15.8; Q3: 15.9–17.7; Q4: 17.8–29.3 | 10.5–11.2 years >65 years (73.6 ± 5.9) | ↑ TH BMD with higher dairy protein (β = 0.10) and nondairy animal protein (β = 0.06) ↔ TH BMD with higher plant protein intake (β = −0.01) |
| MBP | Evans et al., 2007 [174] | Parallel RCT: double blind | 43 healthy postmenopausal women Intervention (g/day): Soy protein isolate (SPI), SPI + exercise (SPI+Ex): 25.6 g of soy protein + 91.2 mg of isoflavone Milk protein isolate (MPI), MPI + exercise (MPI+Ex): 25.6 MPI All subjects: 900 mg of Ca, 125 IU vitamin D | 9 months 62 ± 5 years | ↔ BMD at any site in all groups after adjustment for covariates |
| Soy protein | Gallagher et al., 2004 [175] | Parallel RCT: double blind | 50 postmenopausal women Intervention (g/day): SPI 96: 40 of soy protein + 96 mg of isoflavone; SPI 52: 40 of soy protein + 52 mg of isoflavone; SPI 4: 40 of soy protein + isoflavone (<4 mg) | 15 months (intervention, 9 months; follow-up, 6 months) 40–62 years (55) | ↔ LS BMD, FN BMD in all groups after adjusting for baseline u-NTX ↑troch BMD in SPI 4 at month 9 and 15 after adjusting for baseline u-NTX (vs. SPI 96; vs. SPI 52) |
| Soy protein | Lydeking-Olsen et al., 2004 [176] | Parallel RCT: double blind | 89 postmenopausal Caucasian women Intervention (/day): Soy+: 17.5 g of soy protein + 76 mg of isoflavone Transdermal progesterone (TPD+): 25.7 mg of TPD Combined: Soy+, TPD+Placebo All subjects: food supplement | 2 years 58.2 years | ↓ LS BMD and LS BMC within the combined group and placebo group ↔ LS BMD and BMC within the Soy+, TDP+ group ↓ LS BMD and BMC in placebo (vs. Soy+) ↓ LS BMC in placebo (vs. TPD+) ↔ FN BMD or BMC |
| Total protein | Devine et al., 2005 [177] | Cross- sectional and longitudinal | 1077 women not receiving pharmaceuticals that act on bone Protein intake (g/day): Low protein (T1): <66; Moderate protein (T2): 66–87; High protein (T3): >87 | 1 year >70 years (75 ± 3) | ↑ BUA, BMD of all hip sites (TH, FN, troch, and intertrochanter) in T3 of protein intake after adjustment for age and BMI (vs. T1) |
| Total protein and animal protein | Pedone et al., 2010 [178] | Prospective: Invecchiare in Chianti (InCHIANTI) study | 497 women | 6 years 60–96 years (74.8 ± 7.5) | ↑ total protein or animal protein/kg ideal weight with cortical BMD ↔ TB BMD and total trabecular BMD |
| Total protein and animal protein | Tucker et al., 2001 [179] | Prospective: Framingham Osteoporosis Study | 855 adults Total protein intake (g/kg per d): Q1: not shown; Q4: 1.2–2.8 g/kg. Animal protein intake (g/kg per d): Q1: not shown; Q4: not shown | 4 years 69–97 years | ↑ FN BMD loss in Q1 and Q2 of protein intake after adjustment for sex and total caloric intake (vs. Q4) ↑ LS BMD loss in Q1 of protein intake after adjustment for sex and total caloric intake (vs. Q4) ↔ radial shift BMD loss in Q1 of protein intake after adjustment for sex and total caloric intake (vs. Q4) ↑ FN BMD loss in Q1 and Q2 of animal protein intake after multivariate adjustment (vs. Q4) ↑ LS BMD loss in Q1 of animal protein intake after multivariate adjustment (vs. Q4) ↔ radial shift BMD loss in Q1 of animal protein intake after multivariate adjustment (vs. Q4) |
| Total protein | Ballard et al., 2006 [180] | Parallel RCT | 42 healthy adults Intervention (twice a day): Protein: 42 g of protein supplement; Control: isocaloric carbohydrate supplement | 6 months 18–25 years | ↔ total vBMD, trabecular vBMD, and TB BMC in the protein group after controlling for initial height, weight, and baseline bone values (vs. control) |
| Total protein | Meng et al., 2009 [181] | Prospective | 862 community-dwelling women Protein intake (g/day): High protein (T3): >87; Moderate protein (T2): 66–87; Low protein (T1): <66. | 5 years 70–85 years (75 ± 3) | ↑ TB BMC (r = 0.15) with protein intake ↑ TB BMC in T3 after multivariate adjustment (vs. T1) |
| Total protein | Ho-pham et al., 2012 [182] | Prospective | 181 women Total protein intake (mg/day): Vegans: 36; Omnivores: 62 | 2 years 61 ± 9.2 years | ↔ LS BMD, FN BMD, and TB BMD rate of change between groups |
| Nutrient Type | Ref | Study Type | N of Subjects Study Design | Follow-Up Period and Age | Bone Fracture Outcomes |
|---|---|---|---|---|---|
| Total protein | Munger et al., 1999 [91] | Prospective study: Iowa Women’s Health Study | 32,050 postmenopausal women Total protein (g/MJ): Q1: <9.56; Q2: 9.56–10.78; Q3: 10.78–12.05; Q4: >12.05 | 3 years 55–69 years | ↔ hip fracture risk in Q4 after multivariate adjustment (vs. Q1) |
| Animal protein | 32,050 postmenopausal women Animal protein (g/MJ) Q1: <6.48; Q2: 6.48–7.82; Q3: 7.82–9.26; Q4: >9.26 | 3 years 55–69 years | ↓ hip fracture risk by 69% in Q4 after multivariate adjustment (vs. Q1) | ||
| Vegetable protein | 32,050 postmenopausal women Vegetable protein (g/MJ) Q1: <2.51; Q2: 2.51–2.88; Q3: 2.88–3.28; Q4: >3.28 | 3 years 55–69 years | ↔ hip fracture risk in Q4 after multivariate risk adjustment (vs. Q1) | ||
| Total protein | Langsetmo et al., 2015 [119] | Prospective: Canadian Multicentre Osteoporosis Study | 4661 adults Protein intake (% of E): Q1: <12.6; Q2: 12.6–14.1; Q3: 14.1–15.7; Q4: >15.7 | 13 years >50 years | ↔ main fracture risk in Q4 of protein intake after multivariate risk adjustment among men and women (vs. Q1) |
| Total protein | Misra et al., 2011 [120] | Prospective: Framingham Osteoporosis Study | 946 adults Protein intake (g/day): Q1: 46.45; Q2: 59.61; Q3: 67.70; Q4: 82.74 | 17 years 28–62 years | ↔ hip fracture risk in Q4 of protein intake (vs. Q1) |
| Total protein, animal protein and vegetable protein | Sahni et al., 2010 [121] | Prospective: Framingham Offspring Study | 3656 adults Protein intake (g/day): <800 mg of Ca intake Total protein: Data not shown Animal protein: T1, 34; T3, 60 Vegetable protein: Data not shown ≥800 mg of Ca intake Total protein: T1, 79; T3, 103 Animal protein: T1, 48; T3, 76 Vegetable protein: T1, 22; T3, 34 | 12 years 55 years (men: 55.3 ± 9.9; women: 54.9 ± 9.8) | ↔ hip fracture risk in T3 of total protein and vegetable protein intake after multivariate risk adjustment with total Ca intake <800 mg/day (vs. T1) ↑ hip fracture risk by 217% in T3 of animal protein intake after multivariate risk adjustment with total Ca intake <800 mg/day (vs. T1) ↔ hip fracture risk in T3 of total protein, animal protein, and vegetable protein intake after multivariate risk adjustment with total Ca intake ≥800 mg/day (vs. T1) |
| Total protein, animal protein, vegetable protein, and animal protein/vegetable protein ratio | Martinez et al., 2012 [122] | Case– control | 334 patients who suffered a low-energy fracture 6–24 months before the inclusion and controls Total protein (g/day): Q1: <85; Q2: 85–99; Q3: 100–117; Q4: >118. Animal protein (g/day): Q1: <48; Q2: 49–63; Q3: 64–73; Q4: 74–87 Vegetable protein (g/day): Q1: <30; Q2: 31–34; Q3: 35–39; Q4: 40–47 | N/A ≥65 years (cases: 73.2, controls: 71.2) | ↓ low-energy fracture by 62% in T3 of animal/vegetable protein ratio after multivariate adjustment (vs. T1) ↔ low-energy fracture in Q4 of total, animal, and vegetable protein intake after multivariate adjustment (vs. Q1) |
| Total protein | Nieves et al., 1992 [123] | Case– control | 329 white women with first hip fracture and controls Protein intake (g/day): Q1: 0–24; Q2: 25–34; Q3: 35–44; Q4: 45–54; Q5: ≥55 | N/A 50–103 years | ↔ hip fracture |
| Total protein, animal protein and vegetable protein | Wengreen et al., 2004 [124] | Case–control | 2501 adults (cases with hip fracture or controls) Total protein intake (% of E): Q1: 5.6–13.9; Q2: 14.0–15.5; Q3: 15.6–17.3; Q4: 17.4–30.8 Animal protein intake (% of E): Q1: 0.0–8.2; Q2: 8.3–9.9; Q3: 10.0–11.7; Q4: 11.8–23.6. Vegetable protein intake (% of E): Q1: 0.0–5.0; Q2: 5.1–5.6; Q3: 5.7–6.2; Q4: 6.3–14.7 | N/A 50–89 years | ↓ hip fracture by 65% in Q4 of total protein intake among subjects aged 50–69 years after multivariate adjustment (Ptrend < 0.001) ↓ hip fracture by 57% in Q4 of animal protein intake among subjects aged 50–69 years after multivariate adjustment (Ptrend = 0.21) ↓ hip fracture by 48% in Q4 of vegetable protein intake among subjects aged 50–69 years after multivariate adjustment (Ptrend = 0.19) ↔ hip fracture with any type of protein intake among subjects aged 70–89 years |
| MBP | Meyer et al., 1997 [128] | Prospective | 39,787 middle-aged adults Milk consumption (glasses/day): ≤1 vs. ≥4 Nondairy animal protein (men/women) (g/day): Q1: <14.2/<13.6; Q2: 14.2–17.6/13.6–16.9; Q3: 17.6–21.6/16.9–20.6; Q4: >21.6/>20.6 | 11.4 years 35–49 years (men, 47.1 ± 4.5; women, 47.1 ± 4.6) | ↔ hip fracture risk in ≥4 among women after multivariate adjustment (vs. ≤1) ↓ hip fracture risk by 54% in ≥4 among men after multivariate adjustment (vs. ≤1) ↔ hip fracture risk in Q4 of nondairy animal protein intake among women and men after multivariate adjustment (vs. Q1) |
| Total protein | Feskanich et al., 1996 [129] | Prospective: Nurses’ Health Study (NHS) | 85,900 Caucasian females aged 34–59 years Total protein intake (g/day): Q1: <68; Q2: 68–77; Q3: 78–85; Q4: 86–95; Q5: >95 | 12 years 30–65 years | ↔ hip fracture in Q5 of total protein intake in multivariate model (vs. Q1) ↑ forearm fracture by 22% in Q5 of total protein intake in multivariate model (vs. Q1) |
| Animal protein | 85,900 Caucasian females aged 34–59 years Animal protein intake (g/day): Q1: <51; Q2: 52–61; Q3: 62–69; Q4: 70–80; Q5: >80 | ↔ hip fracture in Q5 of animal protein intake in multivariate model (vs. Q1) ↑ forearm fracture by 25% in Q5 of animal protein intake in multivariate model (vs. Q1) | |||
| Women aged 40–65 years Animal protein intake during teenage years (g/day): Q1: ≤30; Q2: 31–45; Q3: 46–55; Q4: 56–70; Q5: >70 Beef, pork, or lamb intake during teenage years (servings/week): Q1: ≤1; Q2: 2–4; Q3: 5–6; Q4: ≥7. | ↔ hip fracture and forearm fracture with highest daily intake of animal protein (vs. lowest) ↔ hip fracture and forearm fracture with highest serving of animal foods (vs. lowest) | ||||
| Vegetable protein | 85,900 Caucasian females aged 34–59 years Vegetable protein intake (g/day): Q1: <12; Q2: 12–14; Q3: 15–16; Q4: 17–19; Q5: >19. | ↔ hip fracture and forearm fracture risk in Q5 of vegetable protein intake in multivariate model (vs. Q1) | |||
| Total protein | Dargent-Molina et al., 2008 [130] | Prospective: E3N (Etude Epidémiologique de femmes de la Mutuelle Générale de l’Education Nationale (MGEN)) | 36,217 postmenopausal women Total protein intake (g/1000 kcal/day): Q1: <40.75; Q2: 40.75–45.16; Q3: 45.16–50.11; Q4: >50.11 | 12 years (8.37 ± 1.73) 40–65 years | ↔ fracture risk with total protein intake in overall population after multivariate adjustment ↑ fracture risk by 51% in Q4 of total protein intake in lowest Ca quartile after multivariate adjustment (vs. Q1) |
| Animal protein | 36,217 postmenopausal women Animal protein intake (g/1000 kcal/day): Q1: <22.42; Q2: 22.42–27.75; Q3: 27.75–33.52; Q4: >33.52. | ↔ fracture risk with animal protein intake in overall population after multivariate adjustment ↑ fracture risk by 66% in Q4 of animal protein intake in low-Ca quartile after multivariate adjustment (vs. Q1) | |||
| Vegetable protein | 36,217 postmenopausal women Vegetable protein intake (g/1000 kcal/day): Q1: <10.07; Q2: 10.07–12.01; Q3: 12.01–14.12; Q4: >14.12. | ↔ fracture risk with vegetable protein intake in overall population after multivariate adjustment ↓ fracture risk by 32% in Q4 of vegetable protein intake in low-Ca quartile after multivariate adjustment (vs. Q1) | |||
| Total protein by weight | 36,217 postmenopausal women Total protein intake by weight (g/kg/day): Q1: <1.15; Q2: 1.15–1.41; Q3: 1.41–1.71; Q4: >1.71. | ↔ fracture risk in Q4 of total protein by weight in overall population after multivariate adjustment (vs. Q1) ↑ fracture risk 46% in Q4 of total protein by weight in lowest quartile for Ca intake (vs. Q1) | |||
| Total protein | Mussolino et al., 1998 [131] | Prospective: NHANES Epidemiologic Follow-Up Study | 2249 Caucasian men Protein intake (g/day): Q1: <56; Q2: 56–73; Q3: 74–97; Q4: >97 | 13.9 years 45–74 years | ↔ hip fracture risk in Q4 of protein intake after multivariate risk adjustment (vs. Q1) |
| Total protein | Beasley et al., 2014 [148] | Prospective: Women’s Health Initiative clinical trials | 144,580 postmenopausal women Dietary protein intake (% of E): Q1: <13.3; Q3: 14.2–14.8; Q5: ≥15.6 | 6 years 50–79 years | ↔ hip fracture, LS fracture, and total fracture in higher than 20% protein intake per E ↓ forearm fracture by 7% in higher than 20% protein intake per E |
| Total protein | Fung et al., 2017 [149] | Prospective: Nurses’ Health Study (NHS) | 109,882 postmenopausal women and men Total protein intake (men/women) (g/day): Q1: 73.6/60.2; Q2: 83.1/68.0; Q3: 89.9/73.5; Q4: 97.1/79.3; Q5: 108.3/88.6 | 22 years Men: ≥50 years Women: menopause | ↓ hip fracture in Q5 of total protein intake among men after multivariable adjustment (RR for each 10 g increase = 0.92) (vs. Q1) ↔ hip fracture in Q5 of total protein intake among women after multivariable adjustment (vs. Q1) ↔ hip fracture risk in Q5 of total protein in pooled men and women (vs. Q1) |
| Animal protein | Animal protein intake (men/women) (g/day): Q1: 46.2/39.0; Q2: 56.3/47.0; Q3: 63.5/52.8; Q4: 71.3/59.0; Q5: 83.6/60.7 | ↓ hip fracture by 9% with Q5 of animal protein intake among men after multivariable adjustment (vs. Q1) ↔ hip fracture risk in Q5 of animal protein among women after adjustment for multivariable (vs. Q1) ↓ hip fracture risk by 5% in Q5 of animal protein in pooled men and women (vs. Q1) | |||
| Vegetable protein | Plant protein intake (men/women) (g/day) Q1: 19.6/14.7; Q2: 23.2/17.9; Q3: 25.8/19.9; Q4: 28.6/21.8; Q5: 33.4/25.1 | ↔ hip fracture in Q5 of plant protein intake among men after multivariable adjustment (vs. Q1) ↔ hip fracture in Q5 of plant protein intake among women after multivariable adjustment (vs. Q1) ↓ hip fracture risk in Q5 of plant protein intake (RR for each 10 g increase = 0.88) in pooled men and women (vs. Q1) | |||
| MBP | Dairy protein intake (g/day) Men: Q1: 6.8; Q2: 10.6; Q3: 14.0; Q4: 18.2; Q5: 26.5. Women: Q1: 6.8; Q2: 10.6; Q3: 13.8; Q4: 17.8; Q5: 24.6 | ↔ hip fracture in Q5 of dairy protein intake among men after multivariable adjustment (vs. Q1) ↔ hip fracture in Q5 of dairy protein intake among women after multivariable adjustment (vs. Q1) ↓ hip fracture risk in Q5 of dairy protein intake (RR for each 10 g increase = 0.91) in pooled men and women (vs. Q1) | |||
| Total protein, dairy protein, nondairy protein, and vegetable protein | Langsetmo et al., 2017 [173] | Prospective: Osteoporotic in Men (MrOS) | 5875 men Protein intake (% of E): Q1: 6.0–14.1; Q2: 14.2–15.8; Q3: 15.9–17.7; Q4: 17.8–29.3 | 10.5–11.2 years >65 years (73.6 ± 5.9) | ↓ low-trauma fracture by 8%, hip fracture by 16% with Q4 of total protein intake after multivariate adjustment (vs. Q1) ↓ low-trauma fracture by 7%, hip fracture by 20% with Q4 of dairy protein intake after multivariate adjustment (vs. Q1) ↓ hip fracture by 16% with Q4 of nondairy protein after multivariate adjustment (vs. Q1) ↔ all types of fracture with Q4 of plant protein after multivariate adjustment (vs. Q1) |
| Total protein | Ho-pham et al., 2012 [182] | Prospective | 181 women Total protein intake (mg/day): Vegans: 36; Omnivores: 62 | 2 years 61 ± 9.2 years | ↔ fracture incidence in groups |
| Soy protein | Koh et al., 2009 [183] | Prospective: Singapore Chinese Health Study | 63,154 adults Soy protein intake (g/day): Q1: <2.7; Q2: 2.7–4.7; Q3: 4.7–7.6; Q4: >7.6 | 8 years 45–74 years | ↔ hip fracture risk in Q4 of soy protein intake among men (vs. Q1) ↓ hip fracture risk by 21% in Q4 of soy protein intake among women (vs. Q1) |
| Soy protein | Zhang et al., 2005 [184] | Prospective study Study of Osteoporotic Fracture | 24,403 postmenopausal women Soy protein intake (g/day): Q1: <4.98; Q2: 4.98–7.32; Q3: 7.33–9.77; Q4: 9.78–13.26; Q5: ≥13.27 | 5 years 40–70 years (60) | ↓ hip fracture risk by 37% in Q5 of protein intake after multivariate risk adjustment (vs. Q1) |
| Total protein | Cauley et al., 2016 [185] | Prospective: Osteoporotic Fractures in Men Study (MrOS) | 5876 men Exposure: protein intake (% of E) | 8.6 years >65 years | ↓ hip fracture risk by 19% with protein intake |
| Nutrient Type | Ref | Study Type | N of Subjects Study Design | Follow-Up Period and Age | BTM Outcomes |
|---|---|---|---|---|---|
| Total protein | Cao et al., 2011 [73] | Crossover RCT | 16 postmenopausal women Protein intake (/day): High-protein, high-PRAL diet (HPHP diet): 118 g of protein and 33 mEq of PRAL Low-protein, low-PRAL diet (LPLP diet): 61 g, −48 mEq | 7 weeks (each separated by 1 week break) 40–75 years (56.9 ± 3.2) | ↑ serum IGF-1, Ca absorption, and urinary Ca excretion in HPHP diet (vs. LPLP diet) ↓ serum i-PTH decreased in HPHP diet (vs. LPLP diet) ↔ u-NTX, urinary DPD, serum biomarkers (Ca, TRAP, Cr, CTX, OC, OPG, and sRANKL) between the two diets |
| Total protein | Kerstetter et al., 1997 [82] | Parallel RCT | 16 healthy premenopausal women Protein intake (g/kg): High protein intake: 2.1; Medium protein intake: 1.0 Low protein intake: 0.7 | 4 days 20–40 years (26.7 ± 1.3) | ↑ serum ionized Ca in the low-protein diet (vs. medium) ↔ urinary fractional Ca excretion in the low-protein diet (vs. medium) ↑ midmolecule PTH, i-PTH, calcitriol, and NcAMP excretion in the low-protein diet (vs. moderate) ↓ urinary Ca excretion in the low-protein diet (vs. the medium-protein diet) ↑ urinary Ca and urinary fractional Ca excretion in the high-protein diet (vs. the medium-protein diet) ↔ midmolecule PTH, i-PTH, calcitriol, and NcAMP excretion in the high-protein diet (vs. moderate-protein diet) ↔ serum total Ca within all diets |
| Total protein | Rapuri et al., 2003 [109] | Cross- sectional and prospective | 473 postmenopausal women Exposure: protein intake (% of E) Q1: 13.1 ± 0.12; Q2: 15.1 ± 0.11; Q3: 16.7 ± 0.12; Q4: 19.8 ± 0.12 | N/A 65–77 years | Cross-sectional analysis: ↔ serum Ca, ionized Ca, P, ALP, albumin, i-PTH, 25(OH)D, 1,25(OH)2D, OC, urinary Ca:Cr, and u-NTX:Cr Prospective analysis: ↔ serum Ca, ALP, i-PTH, 25(OH)D, 1,25(OH)2D and OC, Ca absorption, and u-NTX:Cr |
| Total protein | Tkatch et al., 1992 [116] | Parallel RCT | 48 elderly men and women Intervention (g/day): Protein: 20.4; control: 0 | 7 months ≥60 years (82) | ↑ plasma OC within the protein group |
| MBP | Kerstetter et al., 2015 [117] | Parallel RCT: double blind | 208 men and women Intervention (g/day): Whey protein: 45 of whey protein Control: 0 All subjects: 400 IU vitamin D | 18 months men: ≥70 years women: ≥60 years | ↔ serum P1NP, OC between the groups ↑ serum CTX in the whey protein group (vs. control) ↑ serum IGF-1 in the whey protein group (vs. control) |
| MBP | Zhu et al., 2011 [118] | Parallel RCT: double blind | 186 healthy ambulant postmenopausal women Protein intake (g/day): Protein: 30 (whey protein + skim milk); Placebo: 2.1 (skim milk) | 2 years 70–80 years (74.3 ± 2.7) | ↑ serum IGF-1 at 1 year and 2 years in the protein group (vs. control) |
| MBP | Aoe et al., 2005 [125] | Parallel RCT: double blind | 27 healthy menopausal women Protein intake (mg/day): MBP group: 40; placebo group: 0 | 6 months 50.5 ± 3.0 years | ↓ u-NTX in the MBP group (vs. placebo) ↔ OC |
| MBP | Uenishi et al., 2007 [126] | Parallel RCT: double blind | 35 healthy young women Protein intake (mg/day): MBP: 40; Placebo: 0 | 6 months 21.3 ± 1.2 years | ↓ u-NTX in the MBP group (vs. placebo) ↑ serum OC in the MBP group (vs. placebo) |
| MBP | Zou et al., 2009 [127] | Parallel RCT | 81 healthy young women Intervention (/day): MBP (40 mg of milk) group: 250 mL of whole milk + 40 mg of MBP Whole-milk group: 250 mL Whole-milk control group: N/A | 8 months 19.6 ± 0.6 years | ↓ serum NTX within the MBP group at 8 months and the whole-milk group at 6 months ↔ serum NTX between MBP and whole milk ↔ BALP within both the MBP and whole-milk groups |
| Total protein | Jesudason et al., 2013 [133] | Parallel RCT | 136 postmenopausal women Protein intake (g/day) High protein (HP): >90 High normal protein (HNP): <80 | 24 months 40–70 years (HP: 59.5 ± 0.4; HNP: 59.4 ± 0.4) | ↔ PTH, serum ALP in the HP group (vs. the HNP group) ↓ 25(OH)D in the HP group (time, diet vs. the HNP group) ↓ CTX in the HP group (time, diet, diet × time vs. the HNP group) ↓ OC in the HP group (time, diet × time vs. the HNP group) ↑ urine Ca in the HP group (time, diet × time vs. the HNP group) |
| MBP | Kukuljan et al., 2009 [134] | Parallel RCT | 175 healthy men Protein intake (g/day): Milk: 13.2; Control: 0 | 12 months 50–79 years (MBP: 61.7 ± 7.7; control: 59.9 ± 7.4) | ↑ serum 25(OH)D in the milk group (vs. control) ↔ PTH |
| Total protein | Sukumar et al., 2011 [135] | Parallel RCT | 47 healthy overweight/obese postmenopausal women Protein intake (% of E): HP: 30; NP: 18 | 1 year 58 ± 4 years | ↔ OC |
| MBP | Flodin et al., 2014 [137] | Parallel RCT | 67 patients with a recent hip fracture Intervention (/day): Bisphosphonates + nutritional supplementation (BN): 40 g of MBP + 5 mg of risedronate Bisphosphonates (B): 0 g of MBP + 5 mg of risedronate Controls (C): placebo All subjects: 1000 mg of Ca + 800 IU vitamin D3 | 1 year >60 years (79 ± 9) | ↔ CTX |
| MBP | Bharadwaj et al., 2009 [138] | Parallel RCT | 31 healthy postmenopausal women Intervention (/day): Ribonuclease-enriched lactoferrin (R-ELF): 250 mg of R-ELF from milk; control: 0 All subjects: 100% RDA of Ca | 6 months 45–60 years (R-ELF, 53.5 ± 5.4; Control, 51.0 ± 4.4) | ↑ OC within the R-ELF group (vs. control) |
| MBP | Holm et al., 2008 [139] | Parallel RCT: double blind | 29 healthy, early postmenopausal women Intervention (/day): Nutrient (NUT): 10 g of whey protein, 31 g of carbohydrate, 1 g of fat, 5.0 μg of vitamin D, and 250 mg of Ca Control (C): 6 g of carbohydrate and 12 mg of Ca | 24 weeks Nut: 55 ± 1 years C: 55 ± 1 years | ↑ serum OC in NUT at week 12 and 24 (vs. C) ↔ CTX |
| MBP | Schürch et al., 1998 [140] | Parallel RCT: double blind | 82 orthopedic patients with recent hip fracture Intervention (g/day): Protein: 20 of milk protein (5 days/week); Control: 0 | 12 months >60 years (protein: 81.1 ± 7.4; control: 80.2 ± 7.4) | ↑ IGF-1 changes in the protein group at month 6 (vs. control) ↔ OC, PTH, 1,25(OH)2D, PD:Cr, and DPD:Cr between the groups |
| MBP | Tengstrand et al., 2007 [141] | Parallel RCT | 52 lean, postmenopausal patients with recent FN fracture Intervention (g/day): Nutrition (PR) and combined therapy (PR/N): 20 Controls (C): 0 All subjects: 1 g of Ca + 800 IE vitamin D | 12 months 70–92 years (83 ± 5) | ↑ OC within the PR group at month 6 and 12 ↔ CTX within the PR group |
| Soy protein | Arjmandi et al., 2005 [143] | Parallel RCT: double blind | 62 postmenopausal women Intervention (/day): Soy: 25 g of soy protein + 60 mg of isoflavones Control: 25 g of non-soy protein | 1 year <65 years (soy: 53 ± 6; control: 56 ± 5) | ↑ IGF-I in the soy group (vs. control) ↔ OC, BSAP, ALP, and urinary DPD |
| Soy protein | Kenny et al., 2009 [144] | Parallel RCT: double blind | 97 healthy ambulatory postmenopausal women Intervention (/day): Soy protein placebo (SPI−), soy protein isoflavones (SPI+): 18 g of soy protein Control protein placebo, control protein isoflavones: 18 g of milk and egg white protein Co-intervention (/day): SPI+: 35 mg isoflavones All subjects: if not achieving 1200–1500 mg of Ca via diet, they were administered 315 mg of Ca and 200 IU vitamin D | 1 year >60 years (73.1 ± 5.9) | ↔ BSAP, u-NTX/Cr between the groups |
| Soy protein | Kreijkamp et al., 2004 [145] | Parallel RCT: double blind | 175 healthy postmenopausal women Intervention (g/day): Soy protein + isoflavones (SPI+): 25.6 of isoflavone-rich soy protein Placebo: 25.6 of milk protein | 1 year 60–75 years (SPI+, 66.5 ± 4.7; placebo, 66.7 ± 4.8) | ↔ BSAP in the SPI+ group (vs. placebo) |
| Soy protein and MBP | Vupadhyayula et al., 2009 [146] | Parallel RCT: double blind | 157 healthy postmenopausal women Intervention (g/day): Soy protein: 25 of soy protein isolate; soy protein + isoflavone: 25 of soy protein isolate + 90 mg of isoflavones; milk protein: 25 of casein and whey | 2 years Soy protein: 63.6 ± 0.6 years Soy protein + isoflavone: 63.4 ± 0.6 years Milk protein: 63.8 ± 0.5 years | ↔ u-NTX |
| Total protein | Dawson-Hughes et al., 2004 [150] | Parallel RCT | 32 healthy adults Protein intake (g/day): High protein: 57.6 ± 8.2; Low protein: 2.8 ± 0.5. All subjects: 800 mg of Ca | 9 weeks ≥50 years (high protein, 71.8 ± 9.8; low protein, 64.6 ± 10.8) | ↑ serum IGF-1 in high-protein group over the period of 35–49 days or 63 days ↓ u-NTX in high-protein group over the period of 35–49 days or 63 days ↔ serum OC, PTH |
| Animal protein | Hunt et al., 1995 [151] | Parallel RCT | 14 women Meat consumption (% of E): High meat (HM): 289 g (20%); Low meat (LM): 38.5 g (10%). Low meat with mineral supplement (LS) | 7 weeks 51–70 years (62.9 ± 6.1) | ↔ Ca balance, urinary Ca, serum Ca, ionized Ca, and 25(OH)D ↓ serum ALP in the HM group (vs. LM) |
| Total protein | Jenkins et al., 2003 [152] | Crossover RCT | 20 men and postmenopausal women Total protein (g/day) High protein (HP): 189 ± 12; Control: 111 ± 6 | 4.3 weeks 35–71 years (56 ± 8.5) | ↔ serum Ca between groups ↔ PTH, BSAP, 25(OH)D, and u-NTX ↑ urinary Ca excretion in the HP group (vs. control) |
| Total protein | Kerstetter et al., 1998 [153] | Parallel RCT | 12 premenopausal women Protein intake (g/kg): High protein intake: 2.1 (134.9 g/day); Low protein intake: 0.7 (45.8 g/day) | 5 days 21–39 years (26.0 ± 1.8) | ↔ total or ionized serum Ca between the two diets ↔ fractional urinary Ca excretion in the high-protein diet (vs. low) ↑ urinary Ca in the high-protein diet (vs. low) ↑ serum PTH, 1,25(OH)2D in the low-protein diet (vs. high) ↓ fractional intestinal Ca absorption and true Ca absorption in the low-protein (vs. high-protein) diet |
| Total protein | Kerstetter et al., 2000 [154] | Parallel RCT | Eight premenopausal women One of four amounts of protein (g/kg/day): 1. 0.7 (44.3 g/day); 2. 0.8 (50.2 g/day); 3. 0.9 (56.7 g/day); 4. 1.0 (62.7 g/day) | 4 days 20–40 years (23.1 ± 2.3) | ↔ serum Ca, urine Ca between four protein intakes ↓ NcAMP was lower with 0.8 g/kg of protein intake (vs. 0.7 g/kg intake) (p < 0.05) ↓ i-PTH, calcitriol, and NcAMP lower with 0.9 g/kg of protein intake (vs. 0.8 g/kg of protein) ↓ midmolecule PTH lower with 0.9 g/kg of protein intake (vs. 0.8 g/kg of protein) (p < 0.0001) |
| Total protein, animal protein and soy protein | Kerstetter et al., 2006 [155] | Parallel RCT | 20 pre- and postmenopausal women Protein levels (g/kg): high protein, 2.1; low protein, 0.7 Protein types: meat and soy Median protein intake (g/day): Meat: high: 102.7 ± 3.4; low: 20.7 ± 1.1 Soy: high: 88.8 ± 2.9; low: 21.8 ± 0.8 | 4 days 20–66 years (29.2 ± 1.8) | ↑ urinary Ca and fractional Ca excretion in high-protein diets (vs. low-protein diets) ↔ urinary Ca or fractional Ca excretion (levels × types of protein) ↑ serum PTH in low-protein (vs. high-protein) and soy diets (vs. meat diets) ↔ PTH between protein level and protein type ↑ NcAMP in the soy diet (vs. meat) and with higher soy protein intake (vs. low soy) ↑ serum calcitriol concentration in the soy diet (vs. meat) ↔ u-NTX in the levels of protein and types of diet ↔ Ca absorption in the soy diet (vs. meat diet) |
| Total protein | Pannemans et al., 1997 [156] | Crossover RCT | 55 young and elderly adults Protein intake (% of total energy): Low-protein diet (Diet A): 12; High-protein diet (Diet B): 21. | 3 weeks Young adults: 29.3 years; elderly adults: 70.1 years | ↓ urinary Ca excretion in Diet A among young subjects and all subjects (vs. Diet B) |
| Total protein | Kerstetter et al., 1999 [157] | Parallel RCT | 16 healthy premenopausal women Protein intake (g/kg): High protein intake: 2.1; Moderate protein intake: 1.0; Low protein intake: 0.7 | 4 days 20–40 years (26.7 ± 1.3) | ↑ serum midmolecule PTH, i-PTH, 1,25(OH)2D, and NcAMP in low-protein diet (vs. moderate) ↔ calcitropic hormone within the moderate-protein diet ↔ i-PTH, 1,25(OH)2D, and NcAMP within the high-protein diet ↑ u-NTX excretion in the high-protein diet (vs. low) ↔ OC in all groups ↑ BSAP in the low-protein group (vs. moderate) ↔ BSAP in the high protein (vs. low; vs. moderate) |
| Soy protein vs. animal protein | Alekel et al., 2000 [159] | Parallel RCT: double blind | 69 healthy perimenopausal women Intervention (g/day): Isoflavone soy protein (SPI) groups: 40 of soy protein Control: 40 of whey protein Co-intervention (/day): Isoflavone-rich soy protein (SPI+): 80.4 mg of aglycone components Isoflavone-poor soy protein (SPI−): 4.4 mg of aglycone components All subjects: 650 mg of Ca | 6 months 50.6 years | ↔ BSAP, NTX |
| Total protein | Li et al., 2010 [168] | Parallel RCT | 70 healthy, overweight/obese adults Intervention (/day): High-protein enriched (HP): 2.2 g/kg of LBM (30% of E) Standard protein (SP): 1.1 g/kg of LBM (15% of E) | 13 months 49.4 ± 11.0 years | ↔ urine Ca, serum Cr |
| MBP | Evans et al., 2007 [174] | Parallel RCT: double blind | 43 healthy postmenopausal women Intervention (g/day): Soy protein isolate (SPI), SPI + exercise (SPI+Ex): 25.6 of soy protein + 91.2 mg of isoflavone Milk protein isolate (MPI), MPI + exercise (MPI+Ex): 25.6 of MPI All subjects: 900 mg of Ca, 125 IU vitamin D | 9 months 62 ± 5 years | ↓ serum BSAP, CTX in the SPI groups after adjustment for covariates (vs. MPI) |
| Soy protein | Gallagher et al., 2004 [175] | Parallel RCT: double blind | 50 postmenopausal women Intervention (g/day): SPI 96: 40 of soy protein + 96 mg of isoflavones; SPI 52: 40 of soy protein + 52 mg of isoflavones; SPI 4: 40 of soy protein + isoflavones (<4 mg) | 15 months (intervention, 9 months; follow-up, 6 months) 40–62 years (55) | ↔ serum OC, u-NTX within the groups |
| Soy protein | Lydeking-Olsen et al., 2004 [176] | Parallel RCT: double blind | 89 postmenopausal Caucasian women Intervention (/day): Soy+: 17.5 g of soy protein + 76 mg of isoflavones Transdermal progesterone (TPD+): 25.7 mg TPD Combined: Soy+, TPD+Placebo All subjects: food supplement | 2 years 58.2 years | ↔ P1NP, ICTP, or the P1NP/ICTP ratio |
| Total protein | Ho-pham et al., 2012 [182] | Prospective | 181 women Total protein intake (mg/day): Vegans: 36; omnivores: 62 | 2 years 61 ± 9.2 years | ↔ CTX, P1NP between the groups |
| MBP | Aoe et al., 2001 [186] | Parallel RCT | 33 healthy adult women Intervention (mg/day): MBP: 40 MBP; placebo: 0 | 6 months 28.8 ± 8.7 years | ↓ u-NTX, P1NP/Cr, DPD/Cr in MBP group (vs. placebo) ↔ serum OC, BSAP |
| Soy protein | George et al., 2020 [187] | Parallel RCT: double blind | 88 healthy adults Intervention(g/day): Soy: 40 of soy protein + 96 mg of isoflavones; control: 40 of casein | 3 months 27–87 years (soy, 60.3 ± 12.0; control, 60.6 ± 12.0) | ↑ IGF-1 within and between the groups ↔ serum estradiol, TRAP ↓ BSAP within the soy group |
| Total protein | Ince et al., 2004 [188] | Parallel RCT | 39 healthy premenopausal women consuming ad libitum diets Intervention (/day): Recommended dietary allowance (RDA): isocaloric diet containing US RDA protein (0.8 g/kg); ad libitum: free diet | 2 weeks (1 week ad libitum, 1 week RDA) 22–39 years (27.3 ± 1.8) | ↓ urinary Ca, u-NTX after RDA treatment ↔ serum Ca, OC, PTH, and 1,25(OH)2D |
| Soy protein | Murray et al., 2003 [189] | Parallel RCT: double blind | 30 healthy postmenopausal women Intervention(/day): Group 1: 0.5 mg of estradiol + placebo; Group 2: 1.0 mg of estradiol + placebo; Group 3: 0.5 mg of estradiol + 25 g of SPI with 120 mg of isoflavones; Group 4: 1.0 mg of estradiol + 25 g of SPI with 120 mg of isoflavones | 6 months >45 years (Group 1, 53.0 ± 3.4; Group 2, 53.4 ± 4.1; Group 3, 56.3 ± 7.4; Group 4, 56.6 ± 9.1) | ↔ serum NTX |
| Ref | Nutrient Type | Description | Studies | Study Type; N of Subjects | Follow-Up Period and Age Range or Mean Age | BMD and/or Bone Fracture and/or BTM Outcomes |
|---|---|---|---|---|---|---|
| Dou et al., 2022 [196] | N-3 PUFA | A meta- analysis of BMD outcomes | Six studies [197,198,199,200,201,202] | RCT; 491 subjects | 3 to 36 months 25–85 years | ↑ BMD with N-3 PUFA (WMD = 0.01; 95% CI 0.00 to 0.01 g/cm2; I2 = 27.4%; Phet = 0.219) |
| Four meta- analyses of BTM outcomes | Seven studies [197,200,203,204,205,206,207] | RCT; 475 subjects | 6 weeks to 18 months 25–85 years | ↔ BSAP with N-3 PUFA (WMD = −0.24; 95% CI −0.86 to 0.39; I2 = 47.4%; Phet = 0.076) | ||
| Five studies [197,200,201,203,208] | RCT; 380 subjects | 4 to 18 months 25–85 years | ↔ OC with N-3 PUFA (WMD = −0.63; 95% CI −1.84 to 0.57; I2 = 43.9%; Phet = 0.129) | |||
| Four studies [201,202,205,206] | RCT; 169 subjects | 6 weeks to 12 months 47–78 years | ↓ CTX with N-3 PUFA (WMD = −0.37; 95% CI −0.73 to −0.01; I2 = 94.8%; Phet = 0.000) | |||
| Three studies [197,203,205] | RCT; 224 subjects | 6 weeks to 12 months 25–85 years | ↔ NTX with N-3 PUFA (WMD = −1.74; 95% CI −3.97 to 0.48; I2 = 65.8%; Phet = 0.054) | |||
| Abdelhamid et al., 2019 [209] | Total PUFA | Two meta- analyses of BMD outcomes | Three studies [197,200,210] | RCT; 245 subjects | 12 to 18 months 25–80 years | ↔ LS BMD with total PUFA (SMD (random) = 0.15 g/cm2; 95% CI −0.21 to 0.51; I2 = 44%) |
| Three studies [197,200,210] | RCT; 245 subjects | 12 to 18 months 25–80 years | ↔ FN BMD with total PUFA (SMD (random) = 0.35 g/cm2; 95% CI −0.26 to 0.96; I2 = 79%) | |||
| Four meta- analyses of BTM outcomes | Three studies [197,200,211] | RCT; 195 subjects | 1 to 2 years 67.8 years | ↔ OC (MD (random) = 0.52 μg/L; 95% CI −1.99 to 0.95; I2 = 45%) | ||
| Two studies [197,200] | RCT; 102 subjects | 12 to 18 months 68 years | ↔ serum BSAP (MD (random) = 0.52 μg/L; 95% CI −1.99 to 0.95; I2 = 45%) | |||
| Three studies [197,200,210] | RCT; 246 subjects | 12 to 18 months 25–80 years | ↔ PTH (MD (random) = 4.70 pg/mL; 95% CI −0.43 to 9.83; I2 = 41%) | |||
| Two studies [200,210] | RCT; 203 subjects | 12 to 18 months 73.3 years | ↔ DPD/Cr (MD (random) = 0.28 nmol/nmol; 95% CI −0.23 to 0.78; I2 = N/A) | |||
| N-3 PUFA | Two meta- analyses of BMD outcomes | Four studies [199,201,202,212] | RCT; 463 subjects | 1 to 2 years 45–78 years | ↔ LS BMD by 2.6% with N-3 PUFA (MD (random) = 0.03 g/cm2, 95% CI −0.02 to 0.07; I2 = 72%) | |
| Four studies [199,201,202,212] | RCT; 463 subjects | 1 to 2 years 45–78 years | ↔ FN BMD by 4.1% with N-3 PUFA (MD (random) = 0.04 g/cm2; 95% CI 0.0 to 0.08; I2 = 71%) | |||
| Three meta- analyses of BTM outcomes | Three studies [201,203,213] | RCT; 213 subjects | 6 months 66 years | ↔ OC (MD (random) = 2.03 μg/L; 95% CI −2.31 to 6.36; I2 = 55%) | ||
| Two studies [201,202] | RCT; 116 subjects | 6 months to 1 year 60.1 years | ↔ CTX (MD (random) = −0.03 ng/mL; 95% CI −0.10 to 0.04; I2 = 0%) | |||
| Three studies [201,202,213] | RCT; 313 subjects | 6 months to 1 year 60.8 years | ↔ PTH (MD (random) = −3.85 pg/mL; 95% CI −18.53 to 10.82; I2 = 54%) | |||
| Sadeghi et al., 2019 [214] | Fish consumption | Four meta- analyses of bone fracture outcomes | Six studies [215,216,217,218,219,220] | Four prospective and two case–controls; 164,908 subjects | 1 to 24 years (10.2) 20–89 years | ↓ hip fracture risk with fish consumption (pooled effect size = 0.88; 95% CI 0.79–0.98; I2 = 57.9; Phet = 0.02) |
| N-3 PUFA | Five studies [90,217,218,221,222] | Prospective and case–control; 261,878 subjects | 7 to 24 years (13.95 except case–control) 20–96 years | ↓ hip fracture with dietary N-3 PUFA intake (pooled effect size = 0.89; 95% CI 0.80–0.99; p = 0.02; I2 = 17.3%; Phet = 0.29) | ||
| ALA | Three studies [217,218,222] | Prospective; 260,106 subjects | 7.8 to 24 years (16.2) 20–79 years | ↔ hip fracture risk with dietary ALA intake (pooled effect size = 1.01; 95% CI 0.90 to 1.13; p = 0.92; I2 = 70.6%; Phet = 0.01) | ||
| EPA + DHA | Four studies [216,217,218,222] | Prospective; 265,151 subjects | 7.8 to 24 years (15.0) 20–79 years | ↔ hip fracture risk with EPA + DHA intake (pooled effect size = 0.91; 95% CI 0.81 to 1.03; p = 0.12; I2 = 0.0%; Phet = 0.61) | ||
| Mozaffari et al., 2018 [223] | Total fat | Seven meta- analyses of bone fracture outcomes | Five studies [88,89,90,222,224] | Two prospective and three case–controls; 145,468 subjects | 8.2 years (N/A in case–control) 34–80 years | ↔ all fracture risk (including hip and total fracture) with total dietary fat (pooled effect size = 1.31; 95% CI 0.95 to 1.79; p = 0.09; I2 = 81.8%; Phet = 0.0001) |
| Three studies [89,222,224] | One prospective and two case–controls; 139,280 subjects | 7.8 years (N/A in case–control) 40–80 years | ↔ hip fracture risk with total dietary fat (pooled effect size = 1.52; 95% CI 0.84 to 2.74; p = 0.16; I2 = 83.2%, Phet = 0.0001) | |||
| SFA | Three studies [90,222,224] | One prospective and two case–controls; 138,474 subjects | 7.8 years (N/A in case–control) 50–80 years | ↔ all fracture risk (including hip and total fracture) with SFA (pooled effect size = 1.46; 95% CI 0.84 to 2.55; p = 0.18; I2 = 81.3%; Phet = 0.001) | ||
| Two studies [222,224] | One prospective and one case–control; 138,140 subjects | 7.8 years (N/A in case–control) 50–80 years | ↑ hip fracture with SFA (pooled effect size = 1.79; 95% CI 1.05 to 3.03; p = 0.03; I2 = 77.3%, Phet = 0.01) | |||
| MUFA+ olive oil | Four studies [90,222,224,225] | One prospective, two case–controls, and one RCT; 139,344 subjects | 6.5 years (N/A in case–control) 50–80 years | ↔ all fracture risk (including hip and total fracture) with MUFA + olive oil intake (pooled effect size = 1.22; 95% CI 0.73 to 2.04; p = 0.44; I2 = 81.3%; Phet = 0.0001) | ||
| MUFA | Three studies [90,222,224] | One prospective and two case–controls; 138,474 subjects | 7.8 years (N/A in case–control) 50–80 years | ↔ all fracture risk (including hip and total fracture) with MUFA (pooled effect size = 1.47; 95% CI 0.74 to 2.92, p = 0.27; I2 = 86.1%; Phet = 0.0001) | ||
| Two studies [222,224] | One prospective and one case–control; 138,140 subjects | 7.8 years (N/A in case–control) 50–80 years | ↔ hip fracture risk with MUFA (pooled effect size = 1.97; 95% CI 0.91 to 4.28; p = 0.08; I2 = 87.7%; Phet = 0.0001) | |||
| Shen et al., 2017 [226] | N-3 PUFA | Three meta- analyses of BTM outcomes | Six studies [197,200,203,204,206,213] | RCT; 368 subjects | 6 to 18 months 65.4 years | ↔ BALP with omega-3 fatty acids (SMD = 0.08; 95% CI −0.29 to 0.12; p = 0.429; I2 = 0.0%; Phet = 0.900) |
| Six studies [197,200,201,203,208,213] | RCT; 288 subjects | 4 to 18 months 68.6 years | ↓ OC with omega-3 fatty acids from (WMD = −0.86 ng/mL; 95% CI −1.68 to −0.04; I2 = 36.6%; Phet = 0.850) | |||
| Three studies [201,204,206] | RCT; 164 subjects | 3 to 12 months 61 years | ↔ CTX with omega-3 fatty acids among postmenopausal women (WMD = 0 ng/mL; 95% CI −0.04 to 0.04; p = 0.899; I2 = 0.0%; Phet = 0.785) |
| Nutrient Type | Ref | Study Type | N of Subjects Study Design | Follow-Up Period Age | BMD and/or Bone Fracture and/or BTM Outcomes |
|---|---|---|---|---|---|
| TF | Kato et al., 2000 [88] | Prospective: New York University Women’s Health Study | 5854 postmenopausal women TF intake (g/day): Q1: <57.2; Q2: 57.2–64.1; Q3: 64.1–69.2; Q4: 69.2–75.0; Q5: ≥75.0 | 0–12.4 years (8.6) 34–65 years | ↔ wrist fractures and hip fractures with TF in the age-adjusted model ↑ all fractures by 24% in Q5 of TF intake in the multivariate model (vs. Q1) |
| TF | Michaëlsson et al., 1995 [89] | Case–control | 1140 subjects TF intake (g/day): Q1: <39; Q2: 39–48; Q3: 49–60; Q4: >60 | N/A 40–75 years (cases, 67.6; control, 67.7) | ↔ fracture risk in Q4 of TF intake in the multivariate model (vs. Q1) |
| TF, MUFA, PUFA, SFA, MUFA/PUFA, N-3 PUFA and N-6 PUFA | Martínez-Ramírez et al., 2007 [90] | Case–control | 334 subjects TF intake (g/day): Q1: <87; Q2: 87–97; Q3: 98–112; Q4: ≥112 MUFA intake (g/day): Q1: <39; Q2: 39–46; Q3: 47–54; Q4: ≥54 PUFA intake (g/day): Q1: <11; Q2: 11–14; Q3: 15–17; Q4: ≥18 SFA (g/day): Q1: <23; Q2: 23–28; Q3: 29–33; Q4: ≥34 MUFA/PUFA ratio: Q1: <2.8; Q2: 2.8–3.3; Q3: 3.4–3.9; Q4: ≥4.0 N-3 PUFA intake (g/day): Q1: <11; Q2: 11–14; Q3: 15–17; Q4: ≥18 N-6 PUFA intake (g/day): Q1: <11; Q2: 11–14; Q3: 15–17; Q4: ≥18 | N/A ≥65 years (cases, 73.2; control, 71.2) | ↔ risk of low-energy fractures in Q4 of TF, MUFA, SFA, and omega-3 FA intake in the adjusted model (vs. Q1) ↑ risk of low-energy fractures in Q4 of PUFA (by 488%) and omega-6 FA intake (by 241%) in the adjusted model (vs. Q1) ↓ risk of low-energy fractures by 80% with the highest ratio of MUFA/PUFA in the adjusted model (vs. Q1) |
| TF, SFA, MUFA and PUFA | Benetou et al., 2011 [93] | Prospective: EPIC study | 29,122 subjects | 8 years 60–86 years (64.3) | ↔ hip fracture with TF, SFA, PUFA, and MUFA after multivariate adjustment |
| Evening primrose oil (EPO) | Bassey et al., 2000 [197] | Parallel RCT: double blind | 85 healthy pre- and postmenopausal women Intervention (/day): Efacal (E): 40 g of evening primrose oil, 440 mg of fish oil, and 1 g of Ca; Control: 1 g of Ca | 12 months Premenopausal: 25–40 years; Postmenopausal: 50–65 years (Efacal, 58 ± 4.6; control, 55 ± 4.6) | ↑ TB BMD within groups among premenopausal women ↓ TB BMD within groups among postmenopausal women ↔ TB BMD between groups among pre- and postmenopausal women ↑ serum Ca within groups among premenopausal women ↑ PTH within the E group among premenopausal women ↓ OC and BSAP within the E group among premenopausal women ↔ urinary hydroxyproline and NTX within groups among premenopausal women ↔ serum Ca, PTH within groups among postmenopausal women ↓ urinary hydroxyproline within the E group among postmenopausal women ↓ u-NTX, OC, BSAP within groups among postmenopausal women ↔ serum Ca, PTH, OC, BSAP, urinary hydroxyproline, and NTX between groups |
| ALA | Dodin et al., 2005 [199] | Parallel RCT: double blind | 179 menopausal women Intervention (g/day): Flaxseed: 40 of flaxseed (9.1 ALA); Placebo: 40 of wheat germs | 12 months 45–65 years (flaxseed, 54.0 ± 4.0; placebo, 55.4 ± 4.5) | ↓ LS BMD within groups ↔ LS BMD between groups ↔ FN BMD |
| GLA + EPA | Kruger et al., 1998 [200] | Parallel RCT | 60 women with osteoporosis or osteopenia Intervention (/day): Treatment: 6 g of evening primrose oil (EPO) and fish oil (FO) (60% LA + 8% GLA + 4% EPA + 3% DHA); Control: 6 g of coconut oil (placebo); All subjects: 600 mg Ca | 18 months 79.5 ± 5.56 years | ↔ LS BMD within the treatment group ↑ FN BMD by 1.3% within the treatment group ↓ LS BMD by 3.2% and FN BMD by 2.1% within the placebo group ↑ fracture risk in the placebo group (vs. treatment) ↔ serum Ca ↓ serum P in the treatment group (vs. placebo) ↑ urine Ca within groups ↔ urine P within groups ↓ urine P in the treatment group (vs. placebo) ↓ OC, u-DPD, and 1,25(OH)2D within both groups ↑ PICP, BSAP within both groups ↔ 25(OH)D within both groups |
| EPA + DHA | Tartibian et al., 2011 [201] | Parallel RCT | 79 healthy sedentary postmenopausal women Intervention (/day): Supplement (S): 1000 mg by capsule (180 mg of EPA + 120 mg of DHA) Exercise + supplement (E+S) Exercise only (E) Control (C): placebo | 6 months (24 weeks) 58–78 years (S, 63.1 ± 7.5; E+S, 59.7 ± 2.3; E, 61.4 ± 6.9; C, 58.9 ± 8.1) | ↑ LS BMD, FN BMD within the E+S group and S group ↑ LS BMD, FN BMD in the E+S group (vs. E; vs. S; vs. C) and S group (vs. C) ↔ LS BMD, FN BMD within the C group ↑ estrogen, OC, 1,25(OH)2D, and calcitonin within the E+S group ↓ TNF-α, IL-6, PGE2, CTX, and PTH within the E+S group ↑ estrogen, OC, 1,25(OH)2D, and calcitonin in the E+S group (vs. E; vs. S; vs. C) ↓ TNF-α, IL-6, PGE2, CTX, and PTH in the E+S group (vs. E; vs. S; vs. C) ↑ calcitonin within the S group ↓ TNF-α, PGE2 within the S group ↑ estrogen, 1,25(OH)2D, and calcitonin in the S group (vs. C) ↓ TNF-α, PTH in the S group (vs. E; vs. C) ↓ PGE2 in the S group (vs. C) ↔ OC, CTX within the S group ↔ serum Ca and P within and between groups |
| EPA + DHA | Vanlint et al., 2012 [202] | Parallel RCT: Double blind | 37 sedentary postmenopausal osteopenic women Intervention (/day): DHA: 400 mg of DHA (algal oil); Control: placebo (corn oil); All subjects: Ca and vitamin D3 supplement | 1 year 59.2 years | ↔ LS BMD, TH BMD, and FN BMD between groups ↓ CTX within groups ↔ CTX between groups |
| N-3 PUFA | Dong et al., 2014 [203] | Parallel RCT: double blind | 116 postmenopausal women Intervention (/day): n-3 LC PUFA: 1.2 g of fish oil capsules (EPA + DHA); Control: placebo capsule (olive oil); All subjects: 315 mg Ca, 1000 IU vitamin D3 | 6 months 75 ± 7 years | ↓ BSAP, OC within the N-3 LC PUFA group ↔ BSAP, OC between groups |
| EPA + DHA | Fonolla-Joya et al., 2016 [204] | Parallel RCT: double blind | 103 healthy postmenopausal women Intervention (/day): Treatment: 0.5 L of low-lactose skim milk (40 mg/100 mL EPA + DHA, 0.54 g/100 mL oleic acid); Control: 0.5 L of semi-skim milk | 12 months 50–70 years (59.7 ± 5.8) | ↔ 25(OH)D, BALP, OPG ↓ i-PTH and RANKL within groups |
| N-3 PUFA | Griel et al., 2007 [205] | Crossover RCT | 23 subjects Intervention (/day): Average American diet (AAD, control): 34% TF; 13% SFA; 13% MUFA; 9% PUFA (7.7% LA, 0.8% ALA) Linoleic acid diet (LA): 37% TF; 9% SFA; 12% MUFA; and 16% PUFA (12.6% LA, 3.6% ALA) A-Linolenic acid diet (ALA): 38% TF; 8% SFA; 12% MUFA; and 17% PUFA (10.5% LA, 6.5% ALA) | 6 weeks 49.3 ± 1.6 years (men: 48.6 ± 1.6; women: 58.3 ± 2.7) | ↓ NTX within ALA ↔ NTX in the ALA group (vs. the AAD group) ↔ BSAP between groups |
| EPA + DHA | Hutchins-Wiese et al., 2014 [206] | Parallel RCT: double blind | 30 postmenopausal breast cancer survivors Intervention (/day): Fish oil (FO): 4 g of EPA + DHA capsules; Control: placebo capsules; All subjects: 1000 mg of Ca, 800 IU vitamin D3 | 3 months 48–84 years (62) | ↔ 25(OH)D, PTH ↓ DPD, P1NP, and BSAP within the FO group ↓ serum CTX, P1NP, and DPD within the control group ↓ DPD in the FO group (vs. control) |
| PUFA | Lappe et al., 2013 [207] | Parallel RCT: double-blind pilot study | 58 subjects Intervention (/day): geniVida bone blend (GBB): 30 mg of genistein + 800 IU vitamin D3 + 150 µg of vitamin K1 + 1 g of PUFA Placebo: placebo | 6 months 45–55 years | ↑ Ward BMD in the GBB group (vs. the placebo group) ↓ FN BMD in the placebo group (vs. the GBB group) ↔ LS BMD, troch BMD, intertrochanter BMD, TH BMD, and TB BMD between groups ↑ BSAP, NTX at the 3 and 6 mo. time points in the GBB group (vs. placebo group) |
| LA + GLA and EPA + DHA | Van Papendorp et al., 1995 [208] | Intervention | 40 osteoporotic subjects Intervention (g/day): Evening primrose oil (EPO): 4 of EPO Fish oil (FO): 4 of fish oil EPO+fish oil (EF): 4 of EPO + fish oil Olive oil (OO): 4 of olive oil (control) | 16 weeks 80 ± 4 years | ↑ OC in the EF group (vs. EPO) ↑ PICP within the FO group ↓ ALP within the FO and EF groups ↑ urinary Ca/Cr ratio in the FO group |
| Virgin olive oil (VOO) and nuts | Bulló et al., 2009 [210] | RCT | 238 elderly people at high risk for CVD Intervention: MedDiet+virgin olive oil (EOO): Mediterranean diet + VOO 15 L/3 months; MedDiet+nuts: MedDiet + 29 g/day of mixed nuts Control: low-fat control diet | 12 months men: 55–80 years; women: 60–80 years (MedDiet+VOO, 67.8 ± 6.5; MedDiet+ nuts, 68.4 ± 6.0; control, 67.8 ± 6.1) | ↔ BMD ↔ serum Ca, ALP, BSAP, OPG, DPD:Cr, and urinary Ca between groups ↑ PTH in MedDiet+nuts group (vs. MedDiet+VOO; vs. control) |
| Virgin olive oil | Fernández-Real et al., 2012 [211] | Parallel RCT | 127 community-dwelling men with T2DM and risk factors for cardiovascular disease Intervention (/day): MedDiet+virgin olive oil (VOO): MedDiet + >50 mL VOO; MedDiet+nuts: MedDiet + 30 g of nuts; Control: low-fat control diet | 2 years Med+VOO, 67.9 ± 6.9 years; Med+nuts, 67.6 ± 6.0 years; control, 68.4 ± 6.0 years | ↑ OC, P1NP within the MedDiet+VOO group ↔ OC, P1NP within the MedDiet+nuts and control groups ↓ CTX within groups ↔ serum Ca within the MedDiet+VOO group ↓ serum Ca in the MedDiet+nuts and control groups ↔ UcOC |
| EPA + DHA | Chen et al., 2016 [212] | Parallel RCT: double blind | 168 subjects with knee osteoarthritis Fat intake with supplement (g/day) High dose: 4.5 of fish oil (EPA + DHA); Low dose: 0.45 of fish oil (EPA + DHA) | 2 years >40 years (low dose, 61.1 ± 9.6; high dose, 60.8 ± 10.4) | ↔ LS BMD, FN BMD after adjusting for multivariables |
| N-3 PUFA | Sharif et al., 2010 [213] | Parallel RCT | 18 osteoporotic postmenopausal women Intervention (/day): Treatment: 900 mg n-3 PUFA; Control: placebo | 6 months Treatment: 60 ± 5.6 years; control: 63 ± 8.92 years | ↔ OC, BSAP, serum Ca, vitamin D, and PTH ↓ urine PD within the treatment group |
| Dietary habits | Appleby et al., 2007 [215] | Prospective | 34,696 adults Exposure: dietary habit (meat eaters, fish eaters, vegetarians, and vegans) | 5.2 years 20–89 years (46.6) | ↔ fracture risk among meat eaters, fish eaters, vegetarians and vegans |
| EPA + DHA | Virtanen et al., 2010 [216] | Prospective: Cardiovascular Health Study | 5045 subjects (1305 for BMD data) Exposure: Tuna/other fish (servings): Q1: <1/month; Q2: 1–3/month; Q3: 1–2/week; Q4: ≥3/week Fried fish (servings) T1: <1/month; T2: 1–3/month; T3: ≥1/week EPA + DHA (mg/day) Q1: <145; Q2: 145–229; Q3: 230–411; Q4: 412–519; Q5: >519 | 11.1 years ≥65 years (72.8 ± 5.6) | ↔ FN BMD, TH BMD in quartiles of tuna/other fish, fried fish, and EPA + DHA intake ↓ FN BMD, TH BMD with higher EPA + DHA intake among those with LA intake above median ↔ FN BMD, TH BMD between higher and lower EPA + DHA intake among those with LA intake below median ↔ hip fracture risk with consumption of tuna/other fish, fried fish, and EPA + DHA |
| ALA, EPA, DHA, EPA + DHA, AA and N-6:N-3 FA ratio | Farina et al., 2011 [217] | Prospective: Framingham Osteoporosis Study | 904 older adults Total n-3 PUFA intake (g/day): not shown ALA (g/day): Q1: not shown, Q4: 0.84 AA intake (g/day): not shown EPA + DHA intake (g/day): not shown | 17 years (men: 10.4, women: 12.7) ≥20 years (~75) | ↓ hip fracture risk on ALA in both genders ↓ hip fracture risk by 54% in Q4 of ALA intake (vs. Q1) ↓ hip fracture risk by 80% in Q4 of AA intake (vs. Q1) ↔ hip fracture risk in Q4 of EPA, DHA, and EPA + DHA (vs. Q1) |
| Total PUFA, total n-3, PUFA, EPA + DHA, ALA, total n-6, PUFA and LA | Virtanen et al., 2012 [218] | Prospective: The Nurses’ Health Study (NHS) and Health Professionals Follow-up Study (HPFS) | 122,354 adults without osteoporosis Total PUFA intake (men/women) (g/day): Q1: 9.4/7.9; Q2: 11.3/9.4; Q3: 12.7/10.5; Q4: 14.2/11.8; Q5: 16.8/13.9 Total n-3 PUFA intake (men/women) (g/day): Q1: 1.0/0.9; Q2: 1.2/1.1; Q3: 1.4/1.2; Q4: 1.6/1.4; Q5: 1.9/1.9 EPA + DHA intake (men/women) (g/day): Q1: 0.09/0.07; Q2: 0.18/0.12; Q3: 0.26/0.18; Q4: 0.36/0.24; Q5: 0.57/0.37 ALA intake (men/women) (g/day): Q1: 0.8/0.7; Q2: 0.9/0.8; Q3: 1.1/0.9; Q4: 1.2/1.0; Q5: 1.5/1.2 Total n-6 PUFA intake (men/women) (g/day): Q1: 8.2/6.9; Q2: 10.0/8.3; Q3: 11.3/9.3; Q4: 12.7/10.4; Q5: 15.2/12.4 LA intake (men/women) (g/day): Q1: 8.2/6.8; Q2: 10.0/8.1; Q3: 11.3/9.1; Q4: 12.7/10.2, Q5: 15.2/12.1 | 24 years 30–75 years | ↔ hip fracture in Q4 of total PUFA intake and all types of PUFA subtypes in both genders (vs. Q1) ↓ hip fracture by 19% in Q4 of LA in women (vs. Q1) |
| Fish | Suzuki et al., 1997 [219] | Case–control: Mediterranean Osteoporosis Study (MEDOS) | 747 elderly Japanese people Fish intake (/week): Low: ≤2 times; Moderate: 3–4 times; High: >4 times | 1 year 65–89 years (cases: 78.6 ± 6.5, control: 78.3 ± 6.3) | ↓ hip fracture risk by 42% in moderate fish intake (vs. low) ↔ hip fracture risk in high fish intake (vs. low) |
| Fish | Fan et al., 2013 [220] | Case–control | 1162 cases and controls Freshwater fish intake (men/women) (g/day): Q1: 2.69/3.00; Q2: 10.90/10.49; Q3: 17.89/20.76; Q4: 39.10/55.81 Sea fish intake (men/women) (g/day): Q1: 0.54/0.12; Q2: 10.90/10.49; Q3: 17.86/20.76; Q4: 39.10/55.81 Mollusca and shellfish intake (men/women) (g/day): Q1: 0.27/0.08; Q2: 1.83/0.73; Q3: 4.15/2.88; Q4: 16.04/11.15 Total fish intake (men/women) (g/day): Q1: 9.75/7.88; Q2: 22.85/20.95; Q3: 35.25/36.33; Q4: 70.15/73.42 | 3 years 55–80 years (71) | ↓ hip fracture in Q4 of sea fish (by 69%), Mollusca and shellfish (45%) and total fish (53%) in adjusted model (vs. Q1) ↔ hip fracture with freshwater fish intake in adjusted model |
| SFA, MUFA, PUFA, N-3, N-6 FA, LA, AA, ALA, EPA, DHA and DPA | Harris et al., 2015 [221] | Prospective | 1438 subjects Exposure: fish oil (SFA, MUFA, PUFA: n-3, n-6 FA, LA, AA, ALA, EPA, DHA, and DPA) IQR of PUFA intake (men/women) (%): T1: 36.2–37.5/35.8–37.3; T2: 38.3–38.8/38.0–38.6; T3: 39.6–40.5/39.1–40.2 IQR of N-3 PUFA intake (men/women) (%): T1: 7.11–8.42/6.87–8.14; T2: 9.78–11.2/9.12–10.3; T3: 12.8–15.5/12.1–15.0 IQR of EPA intake (men/women) (%): T1: 1.27–1.71/1.20–1.63; T2: 2.23–2.96/2.04–2.52; T3: 3.97–5.46/3.40–5.24 | 7 years 66–96 years | ↓ osteoporotic fracture risk by 40% in T3 of PUFA intake (vs. T1) ↓ osteoporotic fracture risk by 34% in T3 of N-3 PUFA intake (vs. T1) ↓ osteoporotic fracture risk by 45% in T3 of EPA intake (vs. T1) ↔ osteoporotic fracture risk with SFA, MUFA, N-6 PUFA, LA, AA, ALA, DHA, and DPA intake in men ↔ osteoporotic fracture risk with all types of oil intake in women |
| TF, SFA, MUFA and PUFA | Orchard et al., 2010 [222] | Cohort study: The Women’s Health Initiative Observational Study and Clinical Trials | 136,848 postmenopausal women TF (% of E): Q1: 3.89–25.97; Q2: 25.98–32.24; Q3: 32.25–37.87; Q4: 37.88–51.35 SFA (% of E): Q1: 1.25–8.28; Q2: 8.29–10.52; Q3: 10.53–12.77; Q4: 12.78–36.70 MUFA (% of E): Q1: 1.03–9.63; Q2: 9.64–12.17; Q3: 12.18–14.51; Q4: 14.52–48.50 PUFA (% of E): Q1: 0.71–5.16; Q2: 5.17–6.42; Q3: 6.43–7.89; Q4: 7.90–31.84 | 7.8 years 50–79 years (63 ± 7) | ↔ hip fracture and total fracture in Q4 of total fat or MUFA intake after multivariate adjustment (vs. Q1) ↑ hip fracture by 31% in Q4 of SFA intake after multivariate adjustment (vs. Q1) ↔ total fracture in Q4 of SFA intake after multivariate adjustment (vs. Q1) ↔ hip fracture in Q4 of PUFA intake after multivariate adjustment (vs. Q1) ↓ hip fracture by 5% in Q4 of PUFA intake after multivariate adjustment (vs. Q1) ↔ hip fracture and total fracture in Q4 of n-3 FA, ALA, and EPA intake after multivariate adjustment (vs. Q1) ↔ hip fracture in Q4 of n-6 FA intake after multivariate adjustment (vs. Q1) ↓ total fracture by 6% in Q4 of n-6 FA intake after multivariate adjustment (vs. Q1) |
| TF, animal fat, plant fat, SFA, MUFA, PUFA and MUFA/SFA | Zeng et al., 2015 [224] | Case–control | 1292 elderly Chinese people TF (case–control) (% of E): Q1: 20.6/20.2; Q2: 25.3/25.3; Q3: 29.0/28.7; Q4: 35.3/34.3 Fat from an animal source (case–control) (% of E): Q1: 8.3/7.9; Q2: 11.4/11.5; Q3: 14.8/14.8; Q4: 22.4/20.3 Fat from a plant source (case–control) (% of E): Q1: 8.0/8.4; Q2: 11.6/11.4; Q3: 14.3/14.7; Q4: 18.9/18.9 SFA (case–control) (% of E): Q1: 4.8/4.7; Q2: 6.1/6.1; Q3: 7.1/7.2; Q4: 9.4/9.0 MUFA (case–control) (% of E): Q1: 7.2/6.8; Q2: 8.9/9.1; Q3: 10.7/10.6; Q4: 13.5/13.0 PUFA (case–control) (% of E): Q1: 4.4/4.5; Q2: 5.6/5.8; Q3: 7.0/6.9; Q4: 8.6/8.7 Ratio of MUFA to SFA (case–control) (%): Q1: 1.3/1.2; Q2: 1.4/1.4; Q3: 1.5/1.5; Q4: 1.7/1.7 MUFA from an animal source (case–control) (% of E): Q1: 2.7/2.6; Q2: 3.8/3.9; Q3: 5.1/5.1; Q4: 8.3/7.2 MUFA from a plant source (case–control) (% of E): Q1: 2.8/2.8; Q2: 4.2/4.1; Q3: 5.4/5.5; Q4: 8.1/7.5 | N/A 55–80 years (Men: Cases, 70; Control, 69.5; Women: Cases, 71.2; Control, 71.1) | ↑ hip fracture in Q4 of TF intake by 92%, fat intake from animal sources by 160%, SFA intake by 95%, MUFA intake by 122% and MUFA intake from animal sources by 155% in all covariate-adjusted models (vs. Q1) ↔ hip fracture in Q4 of fat from plant sources, PUFA intake, ratio of MUFA to SFA and MUFA intake from plant sources in all covariate-adjusted models (vs. Q1) ↑ hip fracture by 487% in Q4 of TF among men (vs. Q1) ↑ hip fracture in Q4 of fat from animal sources by 609% among men and by 82% among women (vs. Q1) ↑ hip fracture in Q4 of SFA intake by 610% and MUFA intake by 455% among men (vs. Q1) ↔ hip fracture for ratio of PUFA to SFA among men ↔ hip fracture in Q4 of fat from plant sources, PUFA intake, and ratio of MUFA to SFA among both genders (vs. Q1) ↔ hip fracture on TF and SFA intake among women ↓ hip fracture by 59% in Q4 of ratio of PUFA to SFA among women (vs. Q1) |
| EVOO | García-Gavilán et al., 2018 [225] | Parallel RCT | 870 subjects at high cardiovascular risk Intervention (/day): MedDiet+Extra virgin olive oil (EVOO): MedDiet + 50 g of EVOO; MedDiet+Nuts: MedDiet+30 g of mixed nuts; Control: advice on a low-fat diet | 5.2 years (follow-up: 8.9 years) 55–80 years | ↔ osteoporotic fracture risk in the MedDiet+EVOO group and MedDiet+Nuts group (vs. control) ↓ risk of osteoporosis-related fractures by 51% in T3 of EVOO consumption (vs. T1) |
| LCO3-PUFA (ALA, EPA and DHA) | Lavado-García et al., 2018 [227] | Cross-sectional | 1865 Spanish pre- and postmenopausal women Exposure: LCO3-PUFA (ALA, EPA, and DHA) | N/A 20–79 years (54 ± 10) | ↑ FN BMD with ALA, EPA, and DHA in total women and pre and postmenopausal women ↑ LS BMD with EPA and DHA in total women and premenopausal women ↔ LS BMD with ALA, EPA and DHA in postmenopausal women ↑ FN BMD with ALA, EPA and DHA in total and premenopausal women among normal women ↔ LS BMD and FN BMD with ALA, EPA and DHA in postmenopausal women among normal women ↑ LS BMD with EPA and DHA in total and premenopausal women among normal women ↑ FN BMD and LS BMD with total LCO3-PUFA in normal and osteopenic women ↔ FN BMD with total LCO3-PUFA in osteoporotic women ↑ LS BMD with total LCO3-PUFA in normal women ↔ LS BMD with total LCO3-PUFA in osteopenic women |
Disclaimer/Publisher’s Note: The statements, opinions and data contained in all publications are solely those of the individual author(s) and contributor(s) and not of MDPI and/or the editor(s). MDPI and/or the editor(s) disclaim responsibility for any injury to people or property resulting from any ideas, methods, instructions or products referred to in the content. |
© 2023 by the authors. Licensee MDPI, Basel, Switzerland. This article is an open access article distributed under the terms and conditions of the Creative Commons Attribution (CC BY) license (https://creativecommons.org/licenses/by/4.0/).
Share and Cite
Je, M.; Kang, K.; Yoo, J.-I.; Kim, Y. The Influences of Macronutrients on Bone Mineral Density, Bone Turnover Markers, and Fracture Risk in Elderly People: A Review of Human Studies. Nutrients 2023, 15, 4386. https://doi.org/10.3390/nu15204386
Je M, Kang K, Yoo J-I, Kim Y. The Influences of Macronutrients on Bone Mineral Density, Bone Turnover Markers, and Fracture Risk in Elderly People: A Review of Human Studies. Nutrients. 2023; 15(20):4386. https://doi.org/10.3390/nu15204386
Chicago/Turabian StyleJe, Minkyung, Kyeonghoon Kang, Jun-Il Yoo, and Yoona Kim. 2023. "The Influences of Macronutrients on Bone Mineral Density, Bone Turnover Markers, and Fracture Risk in Elderly People: A Review of Human Studies" Nutrients 15, no. 20: 4386. https://doi.org/10.3390/nu15204386
APA StyleJe, M., Kang, K., Yoo, J.-I., & Kim, Y. (2023). The Influences of Macronutrients on Bone Mineral Density, Bone Turnover Markers, and Fracture Risk in Elderly People: A Review of Human Studies. Nutrients, 15(20), 4386. https://doi.org/10.3390/nu15204386