Article

Selective Daily Mobility Bias in the Community Food Environment: Case Study of Greater Hartford, Connecticut

1
Department of Geography, University of Connecticut, Mansfield, CT 06269, USA
2
Department of Allied Health Sciences, University of Connecticut, Mansfield, CT 06269, USA
3
Department of Geosciences, University of Arkansas, Fayetteville, AR 72701, USA
4
Department of Geography, University of South Carolina, Columbia, SC 29208, USA
5
Rudd Center for Food Policy and Health, University of Connecticut, Hartford, CT 06103, USA
*
Author to whom correspondence should be addressed.
Nutrients 2023, 15(2), 404; https://doi.org/10.3390/nu15020404
Submission received: 13 December 2022 / Revised: 8 January 2023 / Accepted: 10 January 2023 / Published: 13 January 2023
(This article belongs to the Special Issue Diet Quality, Food Environment and Diet Diversity)

Abstract

:
The community food environment has potential influences on community members’ dietary health outcomes, such as obesity and Type II diabetes. However, most existing studies evaluating such health effects neglect human mobility. In food patrons’ daily travels, certain locations may be preferred and patronized more frequently than others. This behavioral uncertainty, known as the selective daily mobility bias (SDMB), is less explored in community-food-environment research. In this paper, we aim to confirm the existence of the SDMB by systematically exploring the large-scale GPS-based restaurant-visit patterns in the Greater Harford region, Connecticut. Next, we explore the restaurant and neighborhood characteristics that are associated with the restaurant-visit patterns. Our primary results demonstrate that (1) most restaurant customers originate from areas outside of the census tract where the restaurant is located, and (2) restaurants located in socially vulnerable areas attract more customers in total, more customers from local areas, and more customers from other socially vulnerable areas. These results confirm the relevance of the SDMB to the community food environment, and suggest ways that the SDMB can be moderated by an uneven socio-economic landscape. The findings demonstrate the necessity of incorporating human-mobility data into the study of the community food environment.

1. Introduction

Obesity is considered a widespread chronic disease, currently affecting 41.9% of adults over the age of 20 and 19.7% of children and adolescents in the United States (US) [1]. Factors in the built environment, such as access to less healthy food-retail and restaurants, are considered environmental drivers behind the development of obesity [2,3,4,5,6,7,8,9]. However, findings on the relationship between community food environments and obesity are equivocal. For example, some studies found a positive relationship between fast-food restaurant access and obesity, implying that easy access to fast-food restaurants would likely induce obesity cases [3,4,5,6], while others found negative [7], null [8], and mixed relationships [9]. A review article found that while many studies identified positive correlations between fast-food restaurants and obesity indicators in the same neighborhood, this correlation was not identified in nearly half of the studies under review [2,10].
While such inconsistencies could be induced by the heterogeneity of the measurement, such as measures of environmental exposures, units of analysis, and obesity indicators, one methodological limitation in previous studies is the neglect of human mobility [11]. Specifically, most studies have employed predefined administrative units (e.g., counties, census tracts) for analysis, assuming that people are only exposed to food retailers within an arbitrary administrative unit based on, for example, where they live [2]. However, people’s daily activities are not limited to a single analysis unit or the neighborhood they live in, but can expand to external regions [12]. In addition, people make active choices on a daily basis which reflect the locations they prefer and patronize [13]. Thus, it is uncertain if diet-related health outcomes (e.g., obesity) are primarily driven by food-environmental exposure or people’s active choices to go to certain places. This issue, known as the selective daily mobility bias (SDMB) [13,14], can lead to the unequal obesogenic roles that food retailers play while obfuscating obesogenic drivers in the food systems.
The SDMB originates from the concept of the “selective mobility bias (SMB)”, which focuses on selective residential migration, meaning that people intentionally select themselves into different neighborhoods based on various household and neighborhood characteristics [15,16]. The SDMB expands this concept to reflect the selective bias in peoples’ daily visited sites [17]. While the SDMB is an emerging issue that has been observed and identified across multiple contexts (e.g., choice of transportation mode, travel route, travel distance, daily travel time, facilities, and general choice of destinations in daily life [18,19,20,21,22,23,24,25,26]), to date, the SDMB has received scant attention in community food environmental research [15]. In addition, the issue has not been well discussed in the context of health inequity, meaning that people with different socioeconomic statuses could be affected by the SDMB unequally in their everyday procurement of food.
To account for the SDMB, researchers have relied on surveys and interviews to study residents’ choices and visits to food retailers [27]. However, these tools are usually time-consuming, not easily scalable, and can suffer from recall bias [28]. With the wide adoption of location-based services (LBS) such as GPS-tracking, researchers are able to study the SDMB in a scalable and cost-effective manner in terms of tracking peoples’ daily activity locations and trajectories [29]. Several studies have employed these LBS technologies to study the SDMB in a food environment context [30,31,32,33]. However, most GPS-based studies suffer from small sampling sizes and short timeframes, which limits their potential applications on a large scale.
To overcome the limitations of previous studies using GPS tracking and demonstrate the SDMB in the community food environment, this study adopts a large-scale human-mobility dataset collected from GPS-enabled smartphones in the US. We evaluate the visit pattern of Food-Away-From-Home (FAFH) in the Greater Hartford region, Connecticut. Specifically, we focus on the visit of full-service and fast-food restaurants, which are considered the main sources of FAFH, and then relate the visit patterns to the risk factors for poor diet and obesity development [34]. We then analyze various factors (i.e., the characteristics of the restaurant and the census tract where the restaurant is located) associated with the restaurant-visit patterns, with a specific focus on the socio-economic landscape of the neighborhood. To this end, this case study not only exhibits the SDMB in the community food environment but also demonstrates the potential to incorporate large-scale human-mobility data to assist health policymaking and health promotion.

2. Materials and Methods

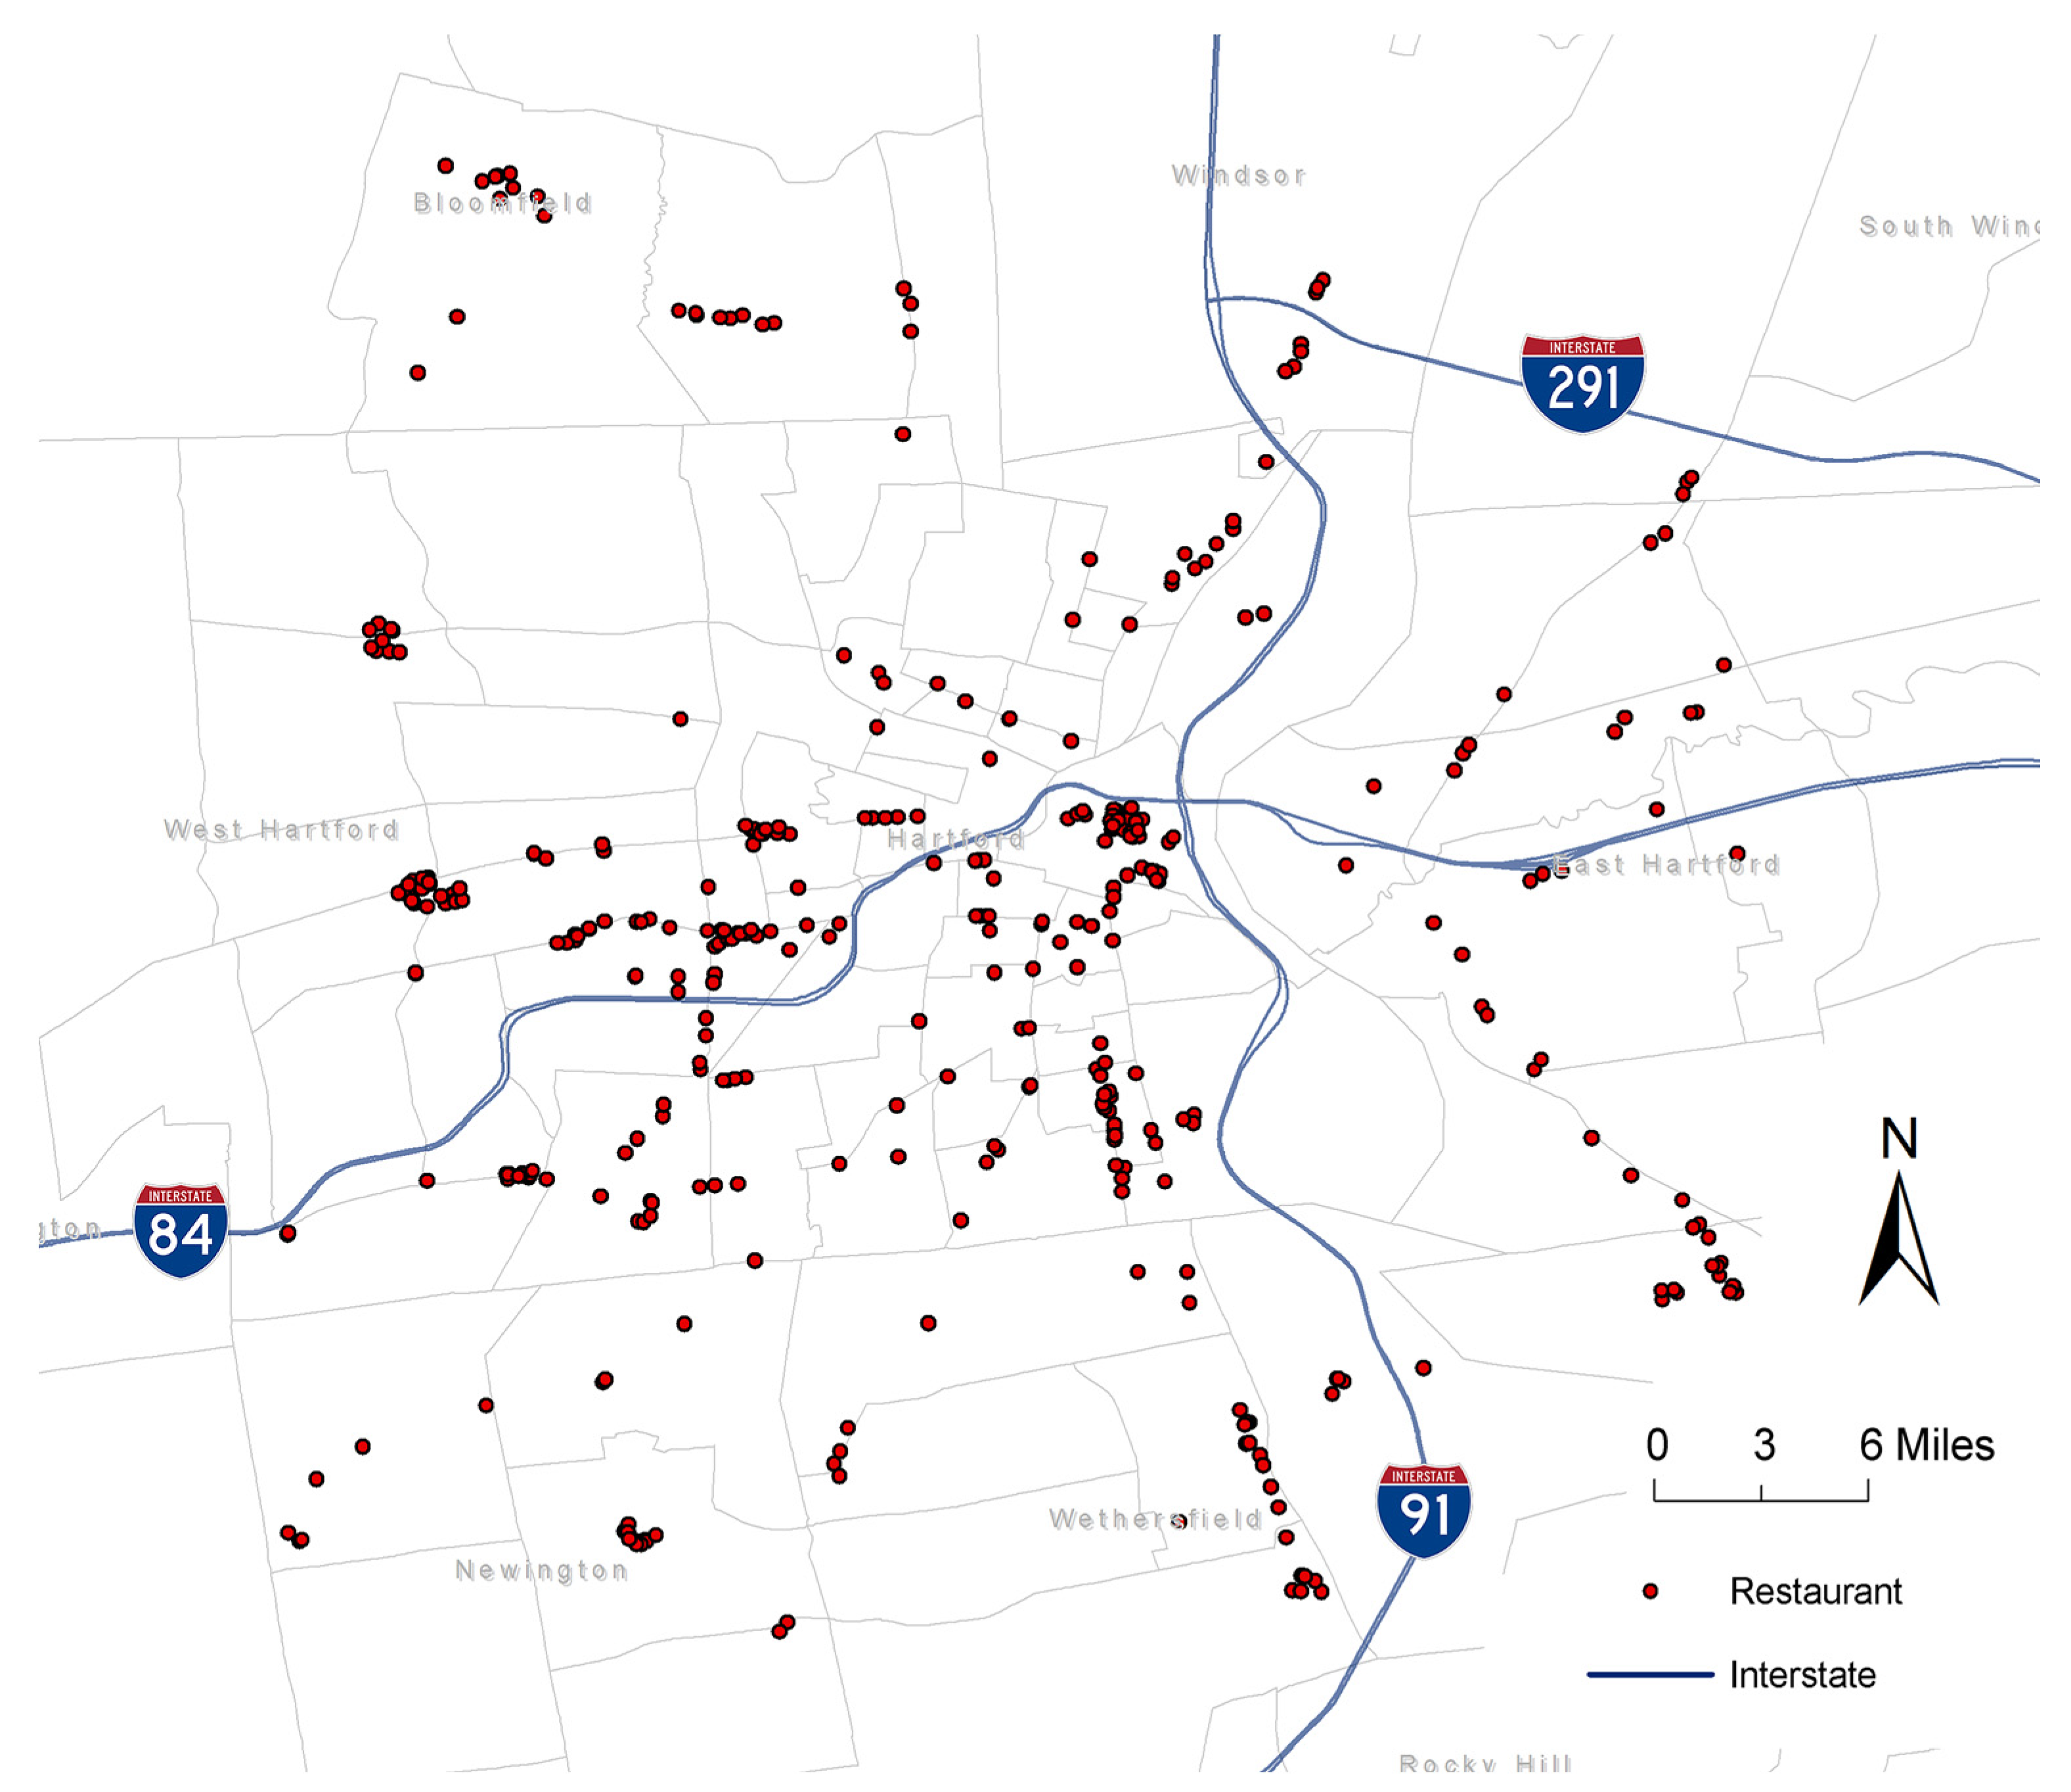
2.1. Sample and Study Design

We conducted an observational study in the Greater Hartford region, Connecticut, US. Hartford is the fourth most populous city in Connecticut, with a significant minority population [35]. As Hartford has intensive spatial interaction with surrounding areas in terms of traffic, human movements, and services, we expanded our study area to Hartford and its five adjacent towns, including Bloomfield, West Hartford, East Hartford, Newington, and Wethersfield.
The mobility data were sourced from SafeGraph, a data company that aggregates anonymized location data from mobile devices to provide insights into physical places [36,37]. We used the Safegraph’s Core Places and Patterns datasets, which aggregated data from approximately 10% of all the mobile devices in the US and contained information about the number of visits from people’s home census tract to each point of interest (POI). The data were made publicly available during the early stage of the Coronavirus Disease 2019 (COVID-19) pandemic. SafeGraph uses a validated algorithm to determine visits to POI, and the duration of the visit must last for at least 4 minutes to count as a visit to a given POI [37,38]. SafeGraph defines a person’s “home” to be the location where the mobile device is detected the most at night (i.e., from 18:00 to 07:00) over a 6-week period, and each location is defined at the Geohash-7 level (153 × 153-m grid). According to SafeGraph, no privacy rights were violated during data collection; the data do not contain individual information; and the data cannot be “de-anonymized” using any known method of re-identification [39]. Previous studies showed that the mobile-device sample in SafeGraph is generally representative of the general population in terms of sociodemographic variables (e.g., racial/ethnic composition, educational attainment, and income) and the overall US Census population count [40,41]. Using SafeGraph data, we included all restaurant POIs in the Greater Hartford region. After validating the restaurant locations and removing duplicates, we included a total of 396 restaurants, where 69 were full-service restaurants (defined by the North American Industry Classification System [NAICS] code 722211) and 327 were limited-service restaurants (NAICS code 722513). A cross-validation with restaurant directories from Yelp and Google Place showed that the SafeGraph data included more than 80% of the restaurant POIs in the study area. The 396 restaurants included in this study were visualized in ESRI ArcGIS Pro, as shown in Figure 1.
The raw visit data from SafeGraph contained 250,112 records, and each record indicated the number of visits from a home census tract to a POI in a given month in 2018–2019. If there were 1–4 visits from a home census tract to a POI in a given month, the number of visits was coded as 4 to protect privacy. As most of the visits were concentrated within Connecticut and a significant portion of the visits from home census tracts outside Connecticut were coded as 4 in the SafeGraph data, we focused on all home census tracts within Connecticut. We further aggregated all visit data over time, and the final data for analysis included 66,605 visit records, with each record containing the destination (restaurant POI), origin (people’s home census tract), and the total number of visits in 2018–2019. It is worth mentioning that since the study period was before the COVID-19 outbreak, the data can represent the general mobility patterns.

2.2. Measures

Visit Pattern. We aggregated the SafeGraph mobility data at the restaurant level. For each restaurant, we calculated (a) the median distance that the restaurant customers traveled, (b) the percentage of customers originating from the same census tract where the restaurant was located, (c) the percentage of customers originating within a 1-mile radius of the restaurant location, and (d) the total number of visits in 2018–2019.
Restaurant characteristics. We categorized the restaurants into full-service restaurants and limited-service restaurants, based on their NAICS code. In addition, we retrieved various restaurant characteristics from Yelp (up to 2019), including the number of reviews, ratings (1–5), and the average cost per person for a meal (1–3) (see details in Table 1).
Neighborhood characteristics. We obtained the characteristics of the customers’ home census tracts and the census tracts where restaurants are located from multiple sources. For each census tract, we obtained the social vulnerability index (SVI) in 2018 from CDC [42]. The SVI ranks each census tract, based on 15 sociodemographic factors which are originally derived from the 2014–2018 American Community Survey 5-Year Estimates. These factors can be categorized into four themes—socioeconomic status, household composition and disability, minority status, and housing-type and transportation. We obtained the overall percentile ranking of SVI (ranging from 0 to 1, where 1 means the most socially vulnerable) of the census tract where each restaurant is located. For each restaurant, we also calculated the overall SVI percentile-ranking of the customers’ home census tracts (weighted by the number of visits).
In addition, we collected the population counts for each census tract from the 2020 decennial censuses [43], and the food-desert label and urban-tract label from the United States Department of Agriculture (USDA) [44].

2.3. Analysis

To illustrate restaurant-visit patterns, we first performed visit-flow visualizations in ArcGIS, and then we summarized the percentage of customers originating from the census tract where each restaurant was located, as well as the percentage of customers originating from a radius of 1, 1 to 5, 5 to 10, and 10 to 20 miles of the restaurant location, separately. To explore how visit patterns differed by socioeconomic characteristics of the restaurant area, we further examined the restaurant-visit patterns for restaurants in the top 10% socially vulnerable areas (measured by the SVI) in our data.
To explore how neighborhood and restaurant-level characteristics were associated with the restaurant-visit patterns, we performed separate multivariate linear regressions at the restaurant level, with five outcomes: (a) the percentage of customers who originated from the same census tract where the restaurant was located, (b) the percentage of customers who originated within a 1-mile radius of the restaurant location, (c) the overall SVI percentile-ranking of the visitors’ home census tracts (weighted by the number of visits), (d) the total visit-count of the restaurant (log-transformed), and (e) the median distance customers traveled to get to each restaurant. In each regression, independent variables included restaurant characteristics (i.e., rating, price, log-transformed review counts, and restaurant category), and characteristics of the census tract where the restaurant was located (i.e., total population, overall SVI percentile-ranking, food-desert label, and urban-tract label).

3. Results

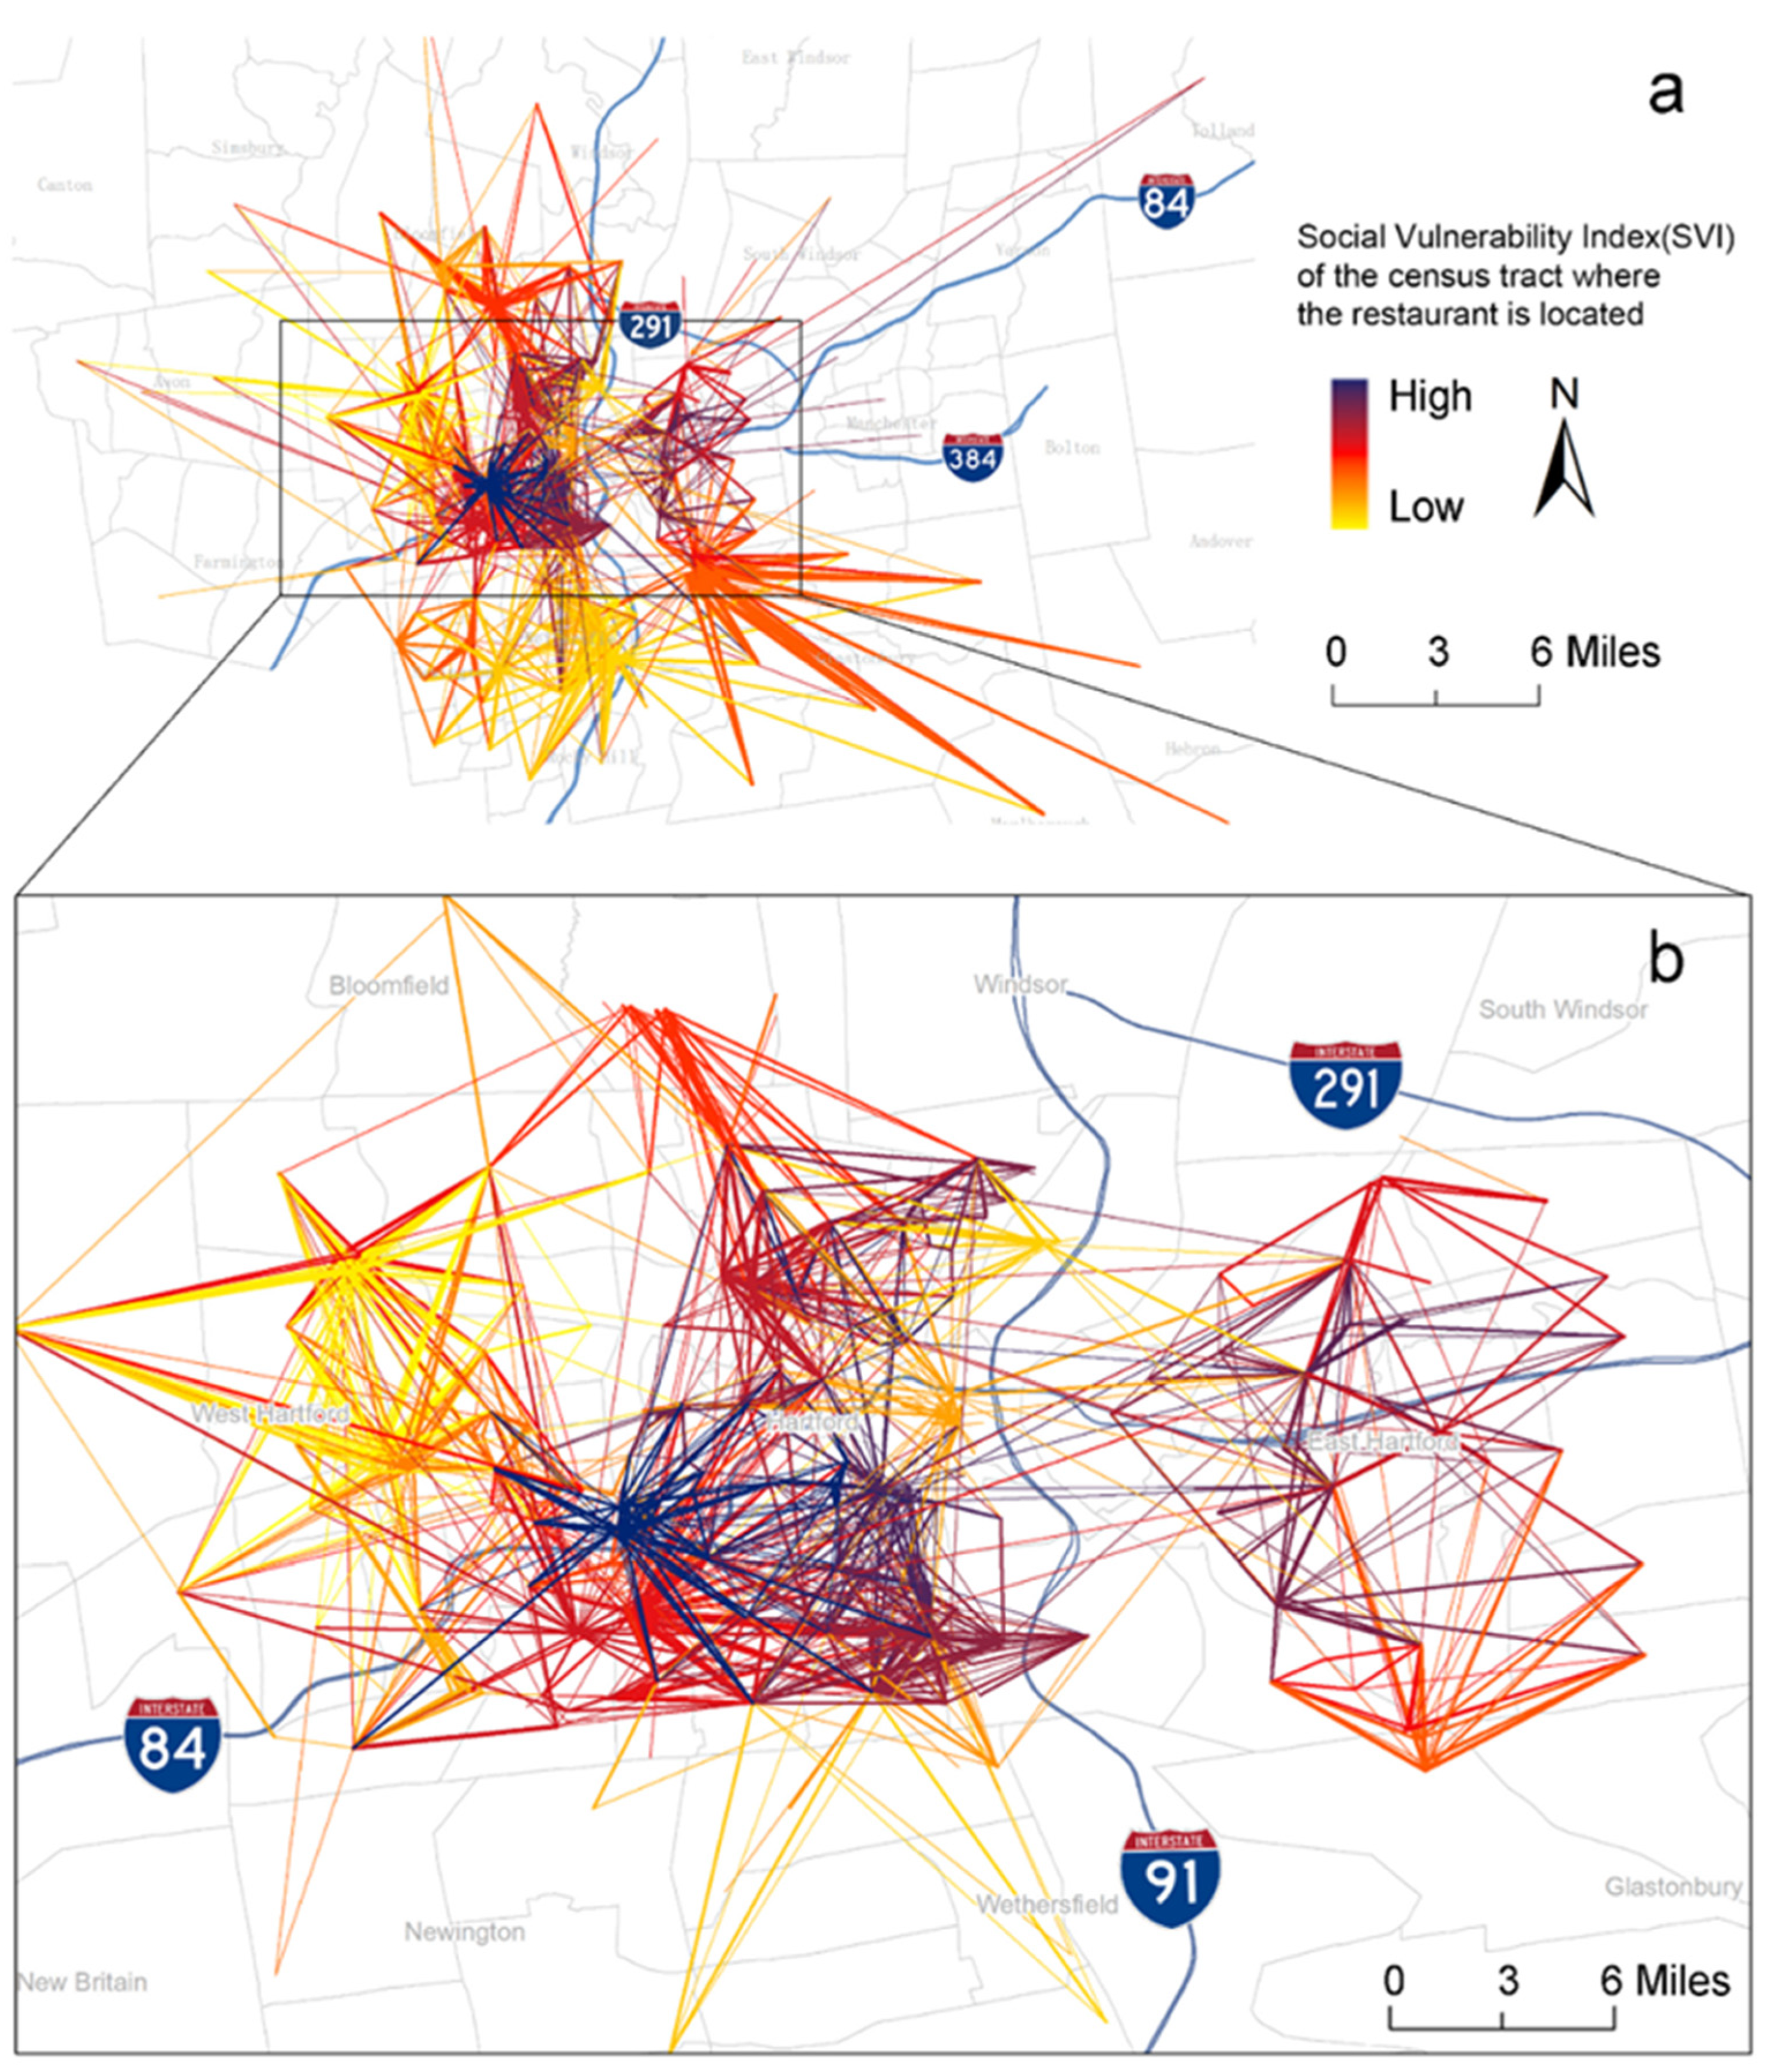
3.1. Restaurant-Visit Patterns

Figure 2 depicts the overall restaurant-visit patterns in the study area. The figure shows that a significant portion of the restaurant visits were from areas beyond the census tract where the restaurant was located. Spatial descriptive analyses further showed that on average only 8.4% (standard deviation [SD] = 5.8%) of the customers originated from the restaurant’s census tract; on average, 18.9% (SD = 11.8%), 43.5% (SD = 10.3%), 17.4% (SD = 5.8%), and 13.2% (SD = 6.6%) of the customers originated from within a radius of 1, 1 to 5, 5 to 10, and 10 to 20 miles, respectively, of the restaurant location; on average, customers traveled a median distance of 2.9 (interquartile range [IQR = 2.3–4.4] miles to patronize the restaurant.
Furthermore, Figure 2 shows that there was considerably less mobility in terms of restaurant visits in more socially vulnerable areas (i.e., higher SVI, dark-colored lines), and that restaurants in these high SVI areas mostly attracted visitors from nearby. However, a further spatial descriptive analysis showed that even in the top 10% most socially vulnerable areas, there were still considerable journeys originating from external tracts: only 9.7% (SD = 4.9%) of the customers originated from the restaurant’s census tract; on average, 28.7% (SD = 9.0%), 39.8% (SD = 6.1%), 14.9% (SD = 3.5%), and 10.3% (SD = 4.4%) of customers originated from within a radius of 1, 1 to 5, 5 to 10, and 10 to 20 miles, respectively, of the restaurant; on average customers, still traveled a median distance of 2.0 [IQR = 1.6–2.8] miles to patronize the restaurant.

3.2. Factors Associated with the Restaurant-Visit Patterns

Descriptive statistics of all the variables used in the restaurant-level analysis are summarized in Table 1. The table shows restaurants included in the study were mostly limited-service restaurants (82.58%), located in urban areas (99.24%), not in the food-desert census tract (71.21%), and within a cost range of between USD 11 and 30 (52.53%) per person for a meal. The average review-counts and the average rating were 86.00 (SD = 132.00) and 3.50 (SD = 0.85), respectively. The distribution of the overall SVI percentile-ranking of the customers’ home census tracts (mean (SD) = 0.61 (0.14)) was similar to the overall SVI percentile-ranking of the census tract where the restaurant was located (mean (SD) = 0.59 (0.29)). The median total number of visits recorded in SafeGraph was 2204 (IQR [1292–3593]) for a restaurant in 2018–2019.
Multivariate-linear-regression results are summarized in Table 2. Neighborhood characteristics of the restaurant location were associated with visit patterns. Specifically, the SVI of the census tract where the restaurant was located had strong associations with many visit patterns. A one-percentile increase in overall SVI ranking (more socially vulnerable) in the restaurant’s census tract was associated with a decrease of 0.0196 (95% confidence interval [CI]: 0.0125, 0.0267) miles in the median distance customers traveled, an increase of 0.1661% (95% CI: 0.1251, 0.2072) of customers originating within a 1-mile radius of the restaurant location, an increase of 0.45% (95%CI: 0.05, 0.84) in the total visit-count, and an increase of 0.28 (95% CI: 0.25, 0.32) in the overall SVI percentile-ranking of the customers’ home census tracts (results were robust after controlling for distance traveled). In addition, restaurants in food-desert tracts drew 2.48% (95% CI: 1.13, 3.83) more customers from the same census tract, and the overall SVI ranking of the customers’ home census tracts was 4 percentiles (95% CI: 1, 6) higher for those restaurants.
In terms of restaurant characteristics, we did not observe significant differences in visit patterns by restaurant category or price. The number of restaurant reviews on Yelp (log-transformed) had a negative association with the percentage of customers from the same census tract as the restaurant (β = −0.92 (95% CI: −1.35, −0.50)), the percentage of customers originating within a 1-mile radius of the restaurant location (β = −2.33 (95% CI: −3.16, −1.50)), and the overall SVI percentile-ranking of the customers’ home census tracts (β = −0.02 (95% CI: −0.03, −0.01)). Additionally, the number of restaurant reviews had a positive association with the median distance traveled (β = 0.33 (95% CI: 0.18, 0.47)) and the total number of visits (β = 0.17 (95% CI: 0.09, 0.25)). Lastly, restaurant rating was positively associated with the percentage of customers coming from the same census tract as the restaurant (β = 0.81 (95% CI: 0.18, 1.44)) but was negatively associated with the total number of visits (β = −0.25 (95% CI: −0.37, −0.14)).

4. Discussion

This study demonstrated the existence of the SDMB in the community food environment in relation to restaurant visits. Our study has two primary findings. First, the significant out-of-home tract visit-patterns reveal that the majority of the restaurant’s customers did not originate from the same census tract where the restaurant was located. Second, we found important restaurant and neighborhood characteristics that were associated with restaurant-visit patterns. Specifically, the SVI of the census tract where the restaurant was located played an important role—restaurants located in socially vulnerable areas not only attracted more customers in general, they also attracted more customers from local areas, as well as customers from other socially vulnerable areas.
By using large-scale human-mobility data, this study is one of the first to systematically demonstrate the existence of the SDMB in restaurant visits on the community level. Our results are in line with previous findings demonstrating the wide existence of the SDMB across various domains, such as choice of transportation mode, travel route, travel distance, daily travel-time, sports facility and general destinations in daily life [18,19,20,21,22,23,24,25,26]. For example, several studies examined the influence of individuals/households sociodemographic factors on travel route and mode [22], daily travel-time [25], and travel distance [26], and found peoples’ travel behaviors differ according to individual characteristics. In addition, previous studies observed that individuals make intentional choices of sport facilities for physical activity, which often go beyond their residential neighborhood [19,20]. Another study found individual environmental preferences, such as green environments, can result in differences in travel route and mode selection [22]. While the manifestation of the SDMB in food environment research is emerging, most of the existing studies do not empirically evaluate the SDMB or consider it as a potential limitation [15]. They suggest that ignoring the SDMB could lead to biased estimation and erroneous conclusions about the impact of food-environment exposure on food choices and dietary-related health outcomes [15]. Such bias can lead to the overestimation of the association between spatial accessibility and the actual use [15,45]. Our first finding is in line with previous research, showing that people’s activity space and access to food extended beyond residential neighborhoods, and there were significant differences between the place-based residential food-environment and the individual-based or activity-based food environment [16,31,32,46,47,48,49]. Because food activities are not restricted by the delineation of geographic units, such as census tracts or community boundaries, individuals may be exposed to a series of food opportunities in their daily travel, and these opportunities could reach far beyond their residential neighborhood [46]. This issue, as a result of the SDMB, suggests that using place-based measures of the community food environment (e.g., the number of food stores in a census tract) may misrepresent the true food-environment exposure and the related associations with dietary health indicators [33,45]. In addition, relying on residential boundaries to define food environments is subject to the uncertain geographic-environment problem (UGCoP) [50], meaning that geographically delineated food-environment indicators may obfuscate the spatial scope and time frame of an individual’s exposure to the food environment [19,32]. To this end, the mobility data-driven approach can provide more nuanced information on the exposure to FAFH in people’s daily travel [50]. Leveraging this emerging dataset to design food-environment measures can provide insights into the environmental drivers and pathways through which community food environments affect health.
Our second finding shows that the mobility pattern in food procurement differs according to socioeconomic variables. The results are consistent with previous findings, which show that residents in socially vulnerable areas have fewer resources, such as reliable transportation, to travel for food [51]. Our finding further corroborates this conclusion by substantiating the interplay between the community food environment and social determinants of health. Specifically, findings related to how restaurant-visit patterns are influenced by neighborhood SVI can help researchers understand how socioeconomic inequities may shape health inequities, which has policy implications for designing an equitable community food environment. By considering residents’ mobility patterns and their determinants in the food environment, health researchers and policymakers can offer more precise and contextualized health promotion and intervention strategies. For example, combining large-scale mobility data with data on the nutritional quality of the food retailers, researchers can more accurately measure food procurement and diet quality of the residents. Through tracking residents’ mobility patterns, policymakers can identify activity-based food deserts or food swamps, which may be significantly different from the place-based ones. Policymakers could use these new methods in designating which areas are appropriate for federal, state, or local-development funding (for example, through the Healthy Food Financing Initiative [52]). The finding that restaurants located in socially vulnerable areas attracted more customers as well as more local customers indicated that restaurants in socially vulnerable areas could be significant local dietary-health drivers. In considering health-promoting policies related to commercial zoning laws or local food-ordinances, targeting these areas could reduce diet-related disparities. Improving the nutritional quality of these restaurants should be prioritized in planning initiatives and health interventions. For example, an ongoing initiative in Hartford is working with local restaurants to modify current recipes to reduce both sodium and saturated fat, and increase whole grains, fruits, and vegetables [53].
The study has limitations. First, the mobility data used in this study were aggregated by customers’ home census tracts. This limitation cannot be easily overcome, as SafeGraph data were collected anonymously, without the inclusion of individual characteristics. Thus, translating these findings from an aggregate level into individual implications might be ecologically fallible. Second, we focused on the Greater Hartford region as a case study, and thus our results might not be generalizable to other study areas. Third, while we controlled for many restaurant-level and census tract-level characteristics, the established correlations should be interpreted with caution. To better establish causal relationships, future studies should collect longitudinal data with a rich set of covariates and should also corroborate the findings with qualitative inquiries, such as food diaries and interviews. Finally, we intentionally only included data from 2018 to 2019, to avoid the impact of the COVID-19 pandemic. There may be significant changes in food-procurement activities since the pandemic (e.g., an increase in food deliveries [54], which is generally not captured in SafeGraph mobility data). Future studies could use more recent data from multiple sources to investigate the impact of the pandemic on food-procurement activities.

5. Conclusions

Using large-scale mobility data on restaurant patronization in the Greater Hartford region, this study demonstrates the existence of the SDMB in the community food environment, and identifies important associations with sociodemographic variables. These results demonstrate the necessity of incorporating human-mobility data into the study of the community food environment. They also hold much potential in offering valuable tools for health policymakers to design more contextualized initiatives and interventions. Future studies should continue this line of research by incorporating related mobility components into the discussion of food-environment exposure and dietary health.

Author Contributions

Conceptualization, R.X. and X.C.; methodology, R.X. and X.C.; software, A.J. and X.C.; validation, R.X., X.C. and A.J; formal analysis, A.J.; investigation, A.J.; resources, R.X., X.C. and Z.L.; data curation, A.J., X.H. and Z.L.; writing—original draft preparation, A.J., R.X. and X.C.; writing—review and editing, C.E.C., X.H. and Z.L.; visualization, A.J. and X.C.; supervision, R.X. and X.C.; project administration, A.J.; funding acquisition, R.X. and X.C. All authors have read and agreed to the published version of the manuscript.

Funding

This research was supported by a Hatch grant from the College of Agriculture, Health, and Natural Resources, University of Connecticut, funded by the National Institute of Food and Agriculture, United States Department of Agriculture, grant number CONS01031.

Institutional Review Board Statement

Not applicable.

Informed Consent Statement

Not applicable.

Data Availability Statement

Data are available upon request.

Conflicts of Interest

The authors declare no conflict of interest.

References

  1. Stierman, B.; Afful, J.; Carroll, M.D.; Chen, T.-C.; Davy, O.; Fink, S.; Fryar, C.D.; Gu, Q.; Hales, C.M.; Hughes, J.P.; et al. National Health and Nutrition Examination Survey 2017–March 2020 Prepandemic Data Files Development of Files and Prevalence Estimates for Selected Health. Natl. Health Stat. Rep. Number 2021, 158, 1–21. [Google Scholar] [CrossRef]
  2. Fleischhacker, S.E.; Evenson, K.R.; Rodriguez, D.A.; Ammerman, A.S. A systematic review of fast food access studies. Obes. Rev. 2010, 12, e460–e471. [Google Scholar] [CrossRef]
  3. Kusuma, D.; Atanasova, P.; Pineda, E.; Anjana, R.M.; De Silva, L.; Hanif, A.A.; Hasan, M.; Hossain, M.; Indrawansa, S.; Jayamanne, D.; et al. Food environment and diabetes mellitus in South Asia: A geospatial analysis of health outcome data. PLoS Med. 2022, 19, e1003970. [Google Scholar] [CrossRef]
  4. Xu, Y.; Wang, F. Built environment and obesity by urbanicity in the U.S. Health Place 2015, 34, 19–29. [Google Scholar] [CrossRef] [Green Version]
  5. Li, F.; Harmer, P.; Cardinal, B.J.; Bosworth, M.; Johnson-Shelton, D. Obesity and the Built Environment: Does the Density of Neighborhood Fast-Food Outlets Matter? Am. J. Health Promot. 2009, 23, 203–209. [Google Scholar] [CrossRef] [Green Version]
  6. Pruchno, R.; Wilson-Genderson, M.; Gupta, A.K. Neighborhood Food Environment and Obesity in Community-Dwelling Older Adults: Individual and Neighborhood Effects. Am. J. Public Health 2014, 104, 924–929. [Google Scholar] [CrossRef] [PubMed]
  7. Mazidi, M.; Speakman, J.R. Higher densities of fast-food and full-service restaurants are not associated with obesity prevalence. Am. J. Clin. Nutr. 2017, 106, 603–613. [Google Scholar] [CrossRef] [Green Version]
  8. Paulitsch, R.G.; Dumith, S.C. Is food environment associated with body mass index, overweight and obesity? A study with adults and elderly subjects from southern Brazil. Prev. Med. Rep. 2021, 21, 101313. [Google Scholar] [CrossRef]
  9. Reitzel, L.R.; Regan, S.D.; Nguyen, N.; Cromley, E.K.; Strong, L.L.; Wetter, D.W.; McNeill, L.H. Density and Proximity of Fast Food Restaurants and Body Mass Index Among African Americans. Am. J. Public Health 2014, 104, 110–116. [Google Scholar] [CrossRef]
  10. Cobb, L.K.; Appel, L.J.; Franco, M.; Jones-Smith, J.C.; Nur, A.; Anderson, C.A.M. The relationship of the local food environment with obesity: A systematic review of methods, study quality, and results. Obesity 2015, 23, 1331–1344. [Google Scholar] [CrossRef]
  11. Holsten, J.E. Obesity and the community food environment: A systematic review. Public Health Nutr. 2008, 11, 397–405. [Google Scholar] [CrossRef] [PubMed] [Green Version]
  12. Chen, X. Take the edge off: A hybrid geographic food access measure. Appl. Geogr. 2017, 87, 149–159. [Google Scholar] [CrossRef]
  13. Chaix, B.; Kestens, Y.; Perchoux, C.; Karusisi, N.; Merlo, J.; Labadi, K. An Interactive Mapping Tool to Assess Individual Mobility Patterns in Neighborhood Studies. Am. J. Prev. Med. 2012, 43, 440–450. [Google Scholar] [CrossRef] [PubMed] [Green Version]
  14. Widener, M.J.; Minaker, L.M.; Reid, J.L.; Patterson, Z.; Ahmadi, T.K.; Hammond, D. Activity space-based measures of the food environment and their relationships to food purchasing behaviours for young urban adults in Canada. Public Health Nutr. 2018, 21, 2103–2116. [Google Scholar] [CrossRef] [Green Version]
  15. Plue, R.; Jewett, L.; Widener, M.J. Considerations When Using Individual GPS Data in Food Environment Research: A Scoping Review of ‘Selective (Daily) Mobility Bias’ in GPS Exposure Studies and Its Relevance to the Retail Food Environment. In Geospatial Technologies for Urban Health. Global Perspectives on Health Geography; Lu, Y., Delmelle, E., Eds.; Springer: Cham, Switzerland, 2020. [Google Scholar] [CrossRef]
  16. Zenk, S.N.; Schulz, A.J.; Matthews, S.A.; Odoms-Young, A.; Wilbur, J.; Wegrzyn, L.; Gibbs, K.; Braunschweig, C.; Stokes, C. Activity space environment and dietary and physical activity behaviors: A pilot study. Health Place 2011, 17, 1150–1161. [Google Scholar] [CrossRef] [Green Version]
  17. Kwan, M.-P. The Limits of the Neighborhood Effect: Contextual Uncertainties in Geographic, Environmental Health, and Social Science Research. Ann. Assoc. Am. Geogr. 2018, 108, 1482–1490. [Google Scholar] [CrossRef]
  18. Van Dinter, M.; Kools, M.; Dane, G.; Weijs-Perrée, M.; Chamilothori, K.; van Leeuwen, E.; Borgers, A.; Berg, P.V.D. Urban Green Parks for Long-Term Subjective Well-Being: Empirical Relationships between Personal Characteristics, Park Characteristics, Park Use, Sense of Place, and Satisfaction with Life in The Netherlands. Sustainability 2022, 14, 4911. [Google Scholar] [CrossRef]
  19. Shrestha, S.; Kestens, Y.; Thomas, F.; El Aarbaoui, T.; Chaix, B. Spatial access to sport facilities from the multiple places visited and sport practice: Assessing and correcting biases related to selective daily mobility. Soc. Sci. Med. 2019, 236, 112406. [Google Scholar] [CrossRef]
  20. Perchoux, C.; Chaix, B.; Brondeel, R.; Kestens, Y. Residential buffer, perceived neighborhood, and individual activity space: New refinements in the definition of exposure areas—The RECORD Cohort Study. Health Place 2016, 40, 116–122. [Google Scholar] [CrossRef]
  21. Amirgholy, M.; Golshani, N.; Schneider, C.; Gonzales, E.J.; Gao, H.O. An advanced traveler navigation system adapted to route choice preferences of the individual users. Int. J. Transp. Sci. Technol. 2017, 6, 240–254. [Google Scholar] [CrossRef]
  22. Klein, S.; Brondeel, R.; Chaix, B.; Klein, O.; Thierry, B.; Kestens, Y.; Gerber, P.; Perchoux, C. What triggers selective daily mobility among older adults? A study comparing trip and environmental characteristics between observed path and shortest path. Health Place 2021, 79, 102730. [Google Scholar] [CrossRef] [PubMed]
  23. Handy, S.; Cao, X.; Mokhtarian, P. Correlation or causality between the built environment and travel behavior? Evidence from Northern California. Transp. Res. Part D Transp. Environ. 2005, 10, 427–444. [Google Scholar] [CrossRef] [Green Version]
  24. Liu, Y.; Ji, Y.; Shi, Z.; He, B.; Liu, Q. Investigating the effect of the spatial relationship between home, workplace and school on parental chauffeurs’ daily travel mode choice. Transp. Policy 2018, 69, 78–87. [Google Scholar] [CrossRef] [Green Version]
  25. Delclòs-Alió, X.; Miralles-Guasch, C. A Relational Perspective on Everyday Mobility in the Barcelona Metropolitan Region: Individual and Household-Related Differences in Daily Travel Time. Tijdschr. Voor Econ. Soc. Geogr. 2018, 109, 561–574. [Google Scholar] [CrossRef]
  26. Dėdelė, A.; Miškinytė, A.; Andrušaitytė, S.; Nemaniūtė-Gužienė, J. Dependence between travel distance, individual socioeconomic and health-related characteristics, and the choice of the travel mode: A cross-sectional study for Kaunas, Lithuania. J. Transp. Geogr. 2020, 86, 102762. [Google Scholar] [CrossRef]
  27. Kestens, Y.; Lebel, A.; Daniel, M.; Thériault, M.; Pampalon, R. Using experienced activity spaces to measure foodscape exposure. Health Place 2010, 16, 1094–1103. [Google Scholar] [CrossRef]
  28. Bell, A.; Ward, P.; Tamal, E.H.; Killilea, M. Assessing recall bias and measurement error in high-frequency social data collection for human-environment research. Popul. Environ. 2019, 40, 325–345. [Google Scholar] [CrossRef] [Green Version]
  29. Dabiri, S.; Heaslip, K. Inferring transportation modes from GPS trajectories using a convolutional neural network. Transp. Res. Part C Emerg. Technol. 2018, 86, 360–371. [Google Scholar] [CrossRef] [Green Version]
  30. Burgoine, T.; Jones, A.P.; Brouwer, R.J.N.; Neelon, S.E.B. Associations between BMI and home, school and route environmental exposures estimated using GPS and GIS: Do we see evidence of selective daily mobility bias in children? Int. J. Health Geogr. 2015, 14, 8. [Google Scholar] [CrossRef]
  31. Kestens, Y.; Lebel, A.; Chaix, B.; Clary, C.; Daniel, M.; Pampalon, R.; Theriault, M.; Subramanian, S.V.P. Association between Activity Space Exposure to Food Establishments and Individual Risk of Overweight. PLoS ONE 2012, 7, e41418. [Google Scholar] [CrossRef]
  32. Raskind, I.G.; Kegler, M.C.; Girard, A.W.; Dunlop, A.L.; Kramer, M.R. An activity space approach to understanding how food access is associated with dietary intake and BMI among urban, low-income African American women. Health Place 2020, 66, 102458. [Google Scholar] [CrossRef]
  33. Plue, R. Evaluating the Role of Selective Daily Mobility Bias in Retail Food Environment Research. Master’s Thesis, University of Toronto, Toronto, ON, Canada, 2020. [Google Scholar]
  34. Patel, O.; Shahulhameed, S.; Shivashankar, R.; Tayyab, M.; Rahman, A.; Prabhakaran, D.; Tandon, N.; Jaacks, L.M. Association between full service and fast food restaurant density, dietary intake and overweight/obesity among adults in Delhi, India. BMC Public Health 2017, 18, 1–11. [Google Scholar] [CrossRef] [Green Version]
  35. U.S. Census Bureau. QuickFacts: Hartford County, Connecticut; Hartford City, Connecticut. 2021. Available online: https://www.census.gov/quickfacts/fact/table/hartfordcountyconnecticut,hartfordcityconnecticut/PST045221 (accessed on 5 January 2023).
  36. Places|SafeGraph Docs. Available online: https://docs.safegraph.com/docs/places (accessed on 5 January 2023).
  37. Patterns|SafeGraph Docs. Available online: https://docs.safegraph.com/docs/monthly-patterns (accessed on 5 January 2023).
  38. SafeGraph. Determining Points of Interest Visits from Location Data: A Technical Guide to Visit Attribution. Available online: https://www.safegraph.com/guides/visit-attribution-white-paper (accessed on 5 January 2023).
  39. SafeGraph. SafeGraph’s Response to Congressional Inquiry on User Privacy. Available online: https://www.safegraph.com/blog/safegraph-response-to-congressional-inquiry-on-user-privacy (accessed on 5 January 2023).
  40. Brazil, N. Environmental inequality in the neighborhood networks of urban mobility in US cities. Proc. Natl. Acad. Sci. USA 2022, 119, e2117776119. [Google Scholar] [CrossRef]
  41. Squire, R.F. Quantifying Sampling Bias in SafeGraph Patterns-BlogPost-2019-10.ipynb—Colaboratory. Available online: https://colab.research.google.com/drive/1u15afRytJMsizySFqA2EPlXSh3KTmNTQ#offline=true&sandboxMode=true (accessed on 5 January 2023).
  42. ATSDR’s Geospatial Research, Analysis & Services Program (GRASP). CDC SVI Documentation 2018|Place and Health|ATSDR. Available online: https://www.atsdr.cdc.gov/placeandhealth/svi/documentation/SVI_documentation_2018.html (accessed on 5 January 2023).
  43. U.S. Census Bureau. Decennial Census of Population and Housing Data. Available online: https://www.census.gov/programs-surveys/decennial-census/data.html (accessed on 5 January 2023).
  44. USDA ERS—Food Access Research Atlas. Available online: https://www.ers.usda.gov/data/fooddesert/ (accessed on 5 January 2023).
  45. Shearer, C.; Rainham, D.; Blanchard, C.; Dummer, T.; Lyons, R.; Kirk, S. Measuring food availability and accessibility among adolescents: Moving beyond the neighbourhood boundary. Soc. Sci. Med. 2015, 133, 322–330. [Google Scholar] [CrossRef]
  46. Christian, W.J. Using geospatial technologies to explore activity-based retail food environments. Spat. Spatio-Temporal Epidemiol. 2012, 3, 287–295. [Google Scholar] [CrossRef]
  47. Charreire, H.; Casey, R.; Salze, P.; Simon, C.; Chaix, B.; Banos, A.; Badariotti, D.; Weber, C.; Oppert, J.-M. Measuring the food environment using geographical information systems: A methodological review. Public Health Nutr. 2010, 13, 1773–1785. [Google Scholar] [CrossRef]
  48. Harrison, F.; Burgoine, T.; Corder, K.; van Sluijs, E.M.; Jones, A. How well do modelled routes to school record the environments children are exposed to?: A cross-sectional comparison of GIS-modelled and GPS-measured routes to school. Int. J. Health Geogr. 2014, 13, 5. [Google Scholar] [CrossRef] [Green Version]
  49. Li, J.; Kim, C. Exploring relationships of grocery shopping patterns and healthy food accessibility in residential neighborhoods and activity space. Appl. Geogr. 2020, 116, 102169. [Google Scholar] [CrossRef]
  50. Kwan, M.-P. The Uncertain Geographic Context Problem. Ann. Assoc. Am. Geogr. 2012, 102, 958–968. [Google Scholar] [CrossRef]
  51. Nayak, A.; Islam, S.J.; Mehta, A.; Ko, Y.-A.; Patel, S.A.; Goyal, A.; Sullivan, S.; Lewis, T.T.; Vaccarino, V.; Morris, A.A.; et al. Impact of Social Vulnerability on COVID-19 Incidence and Outcomes in the United States. MedRxiv 2020. [Google Scholar] [CrossRef]
  52. America’s Healthy Food Financing Initiative. Reinvestment Fund Awards $22.6 Million to Improve Healthy Food Access in Underserved Communities|America’s Healthy Food Finance Initiative. Available online: https://www.investinginfood.com/2021-awards-announcement/ (accessed on 5 January 2023).
  53. Woods, L. Hartford Calls on UConn Health to Make Restaurant Dining Healthier—UConn Today. Available online: https://today.uconn.edu/2022/06/hartford-calls-on-uconn-health-to-make-restaurant-dining-healthier/ (accessed on 5 January 2023).
  54. ResearchAndMarkets.com. Food Delivery on the Rise Due to COVID-19 Lockdown—ResearchAndMarkets.com|Business Wire. Available online: https://www.businesswire.com/news/home/20200428005464/en/Food-Delivery-on-the-Rise-Due-to-COVID-19-Lockdown---ResearchAndMarkets.com (accessed on 5 January 2023).
Figure 1. Spatial distribution of restaurants in the Greater Hartford region.
Nutrients 15 00404 g001
Figure 2. Restaurant-visit patterns in the Greater Hartford region. (a) shows overall restaurant-visit patterns in the Greater Hartford region, and (b) zooms into East Hartford, West Hartford, and Hartford. Each line connects a restaurant to a census tract. Line thickness indicates the number of visits; line color indicates the percentile-ranking of SVI for the census tract where the restaurant is located (darker means more socially vulnerable). Only relations with more than 41 visits (top 25% percentile) are included in the figure.
Nutrients 15 00404 g002
Table 1. Description of variables of interest.
N (Count)Min/MaxMean
(SD)
Median
[IQR]
Median distance customers traveled3960.66/10.103.55
(1.99)
2.87
[2.25–4.41]
Percentage of customers originating from the same census tract as the restaurant location3960.00/50.008.41
(5.84)
7.14
[4.24–11.17]
Percentage of customers originated from within a 1-mile radius of the restaurant location3960.00/75.0018.87
(11.79)
16.72
[10.21–26.70]
The SVI of the census tracts customers originated from (weighted by the number of visits)3960.32/0.870.61
(0.14)
0.59
[0.50–0.73]
The SVI of the census tract where the restaurant is located3960.02/1.000.59
(0.29)
0.51
[0.36–0.90]
Review counts3961.00/1260.0086.00
(132.00)
37.00
[13.00–105.00]
Rating3961.00/5.003.50
(0.85)
3.50
[3.00–4.00]
Total population of the census tract where the restaurant is located396907.00/6581.003821.00
(1356.00)
3492.00
[2681.00–4683.00]
Total visit count in 2018–201939616.00/14,686.002831.00
(2447.00)
2204.00
[1292.00–3593.00]
N (count)Percentage
Restaurant category
Limited-service restaurant (0)32782.58%
Full-service restaurant (1)6917.42%
Average cost per person for a meal in a restaurant
Under USD 10 (1)18145.71%
USD 11–30 (2)20852.53%
USD 31–60 (3)71.77%
Restaurant located in an urban tract
No (0)30.76%
Yes (1)39399.24%
Restaurant located in a food-desert census tract
No (0)28271.21%
Yes (1)11428.79%
Table 2. The results of multivariate-linear-regression models.
Percentage of Customers from the Same Census Tract as the Restaurant They Visit (%)Percentage of Customers within a 1-Mile Radius of the Restaurant LocationSVI of the Visitors’ Home Census TractMedian Distance TraveledTotal Visit-Count of the Restaurant (Log-Transformed)
SVI of the census tract where the restaurant is located0.33
[−1.79, 2.44]
16.61 ***
[12.51, 20.72]
0.28 ***
[0.25, 0.32]
−1.96 ***
[−2.67, −1.25]
0.45 *
[0.05, 0.84]
Total population of the census tract where the restaurant is located1.37 × 10−3 ***
[9.78 × 10⁻⁴, 1.76 × 10⁻³]
6.09 × 10⁻⁴
[−1.51 × 10⁻⁴, 1.37 × 10⁻³]
−1.07 × 10⁻⁵ **
[−1.73 × 10⁻⁵, −4.07 × 10⁻⁶]
−2.91 × 10⁻⁴ ***
[−4.22 × 10⁻⁴, −1.59 × 10⁻⁴]
−2.42 × 10⁻⁵
[−9.73 × 10⁻⁵, 4.89 × 10⁻⁵]
Restaurant located in an urban tract3.14
[−2.74, 9.03]
15.80 **
[4.39, 27.20]
0.09
[−0.01, 0.19]
−2.62 **
[−4.60, −0.65]
0.27
[−0.82, 1.37]
Restaurant located in a food-desert tract2.48 ***
[1.13, 3.83]
−0.23
[−2.85, 2.38]
0.04 **
[0.01, 0.06]
0.08
[−0.37, 0.53]
−0.09
[−0.34, 0.16]
Full-service restaurant−1.27
[−2.69, 0.16]
−0.14
[−2.89, 2.62]
−0.02
[−0.05, 3.16 × 10⁻³]
0.19
[−0.29, 0.66]
−0.06
[−0.32, 0.21]
Review counts (log-transformed)−0.92 ***
[−1.35, −0.50]
−2.33 ***
[−3.16, −1.50]
−0.02 ***
[−0.03, −0.01]
0.33 ***
[0.18, 0.47]
0.17 ***
[0.09, 0.25]
Price0.16
[−0.90, 1.22]
0.68
[−1.37, 2.74]
−0.01
[−0.03, 6.47 × 10⁻³]
0.39 *
[0.04, 0.75]
−0.08
[−0.28, 0.12]
Rating0.81 *
[0.18, 1.44]
0.80
[−0.43, 2.03]
−1.48 × 10⁻³
[−0.01, 9.24 × 10⁻³]
0.07
[−0.14, 0.28]
−0.25 ***
[−0.37, −0.14]
Constant−0.43
[−6.55, 5.68]
−4.41
[−16.27, 7.45]
0.48 ***
[0.38, 0.59]
6.35 ***
[4.29, 8.40]
7.74 ***
[6.60, 8.88]
95% CI in square brackets *** p < 0.001 ** p < 0.01 * p < 0.05.
Disclaimer/Publisher’s Note: The statements, opinions and data contained in all publications are solely those of the individual author(s) and contributor(s) and not of MDPI and/or the editor(s). MDPI and/or the editor(s) disclaim responsibility for any injury to people or property resulting from any ideas, methods, instructions or products referred to in the content.

