Article

Integrating Baseline Nutritional and Inflammatory Parameters with Post-Treatment EBV DNA Level to Predict Outcomes of Patients with De Novo Metastatic Nasopharyngeal Carcinoma Receiving Chemotherapy Combination PD-1 Inhibitor

1
State Key Laboratory of Oncology in South China, Guangdong Key Laboratory of Nasopharyngeal Carcinoma Diagnosis and Therapy, Guangdong Provincial Clinical Research Center for Cancer, Sun Yat-sen University Cancer Center, Guangzhou 510060, China
2
Department of Nasopharyngeal Carcinoma, Sun Yat-sen University Cancer Center, Guangzhou 510060, China
3
Department of Radiation Oncology, Sun Yat-sen University Cancer Center, Guangzhou 510060, China
*
Author to whom correspondence should be addressed.
Nutrients 2023, 15(19), 4262; https://doi.org/10.3390/nu15194262
Submission received: 4 September 2023 / Revised: 25 September 2023 / Accepted: 28 September 2023 / Published: 5 October 2023
(This article belongs to the Section Clinical Nutrition)

Abstract

:
Objectives: To develop and validate a prognostic nomogram based on baseline nutritional and inflammatory parameters for risk stratification in patients with de novo metastatic nasopharyngeal carcinoma (dmNPC) receiving chemotherapy combination programmed death-1 (PD-1) inhibitor. Methods: This retrospective study analyzed 131 patients with dmNPC (88 and 43 in the training and validation cohorts, respectively) between March 2017 and November 2020. All these patients received chemotherapy combined with PD-1 inhibitor treatment. We identified independent risk factors using univariate and multivariate Cox regression analyses and established a nomogram to predict the progression-free survival (PFS). The predictive accuracy of the nomogram was evaluated and independently validated. Results: Baseline nutritional risk index (NRI), prognostic nutritional index (PNI), systemic immune-inflammation index (SII), uric acid (UA), and post-treatment Epstein–Barr virus (EBV) DNA were used to develop a nomogram that could divide patients into favorable- and unfavorable-prognosis groups. The median PFS (mPFS) was significantly longer in the favorable-prognosis group compared to the unfavorable-prognosis group (35.10 months [95% CI: 27.36–42.84] vs. 7.23 months [95% CI: 6.50–7.97]; p = 0.001). All results were confirmed in the validation cohort. Conclusions: The proposed model improved the prognostic risk stratification for patients with dmNPC undergoing chemotherapy combined with PD-1 inhibitor treatment.

1. Introduction

Nasopharyngeal carcinoma (NPC) is one of the most common head and neck cancers and is prevalent in Southern China, North Africa, and Southeast Asia [1]. At the time of initial diagnosis, approximately 4–10% of patients exhibit distant metastasis, resulting in a diagnosis of de novo metastatic nasopharyngeal carcinoma (dmNPC). Patients who are diagnosed with dmNPC typically have a median overall survival (OS) of approximately 10–36 months [2]. In recent years, the combination of platinum-based systemic chemotherapy and programmed death-1 (PD-1) inhibitors has emerged as the preferred first-line treatment for dmNPC [3]. However, the efficacy of this treatment varies among patients with dmNPC. Considering such heterogeneity in prognosis, individualized treatment and surveillance strategies are of utmost importance to maximize the survival benefit. Patients with an unfavorable prognosis should receive more intense therapy and be closely monitored. However, no easy-to-use biomarkers are available in prognosis stratification for patients with dmNPC after chemotherapy combination PD-1 inhibitor treatment.
Numerous studies have been conducted to investigate the impact of nutritional status on the prognosis of cancer patients. Patients who are malnourished exhibit reduced tolerance to the adverse reactions of antitumor drugs, thus leading to inadequate responses to chemotherapy and unfavorable outcomes [4]. Various nutritional indicators, such as the nutritional risk index (NRI), prognostic nutritional index (PNI), and controlling nutritional status (CONUT) scores, have been found to have strong associations with therapeutic responses, survival outcomes, and treatment-related complications in patients with NPC [5,6,7]. However, data on the prognostic value of the nutritional indicators for patients with dmNPC who underwent combined chemoimmuocherapy are still unavailable. Moreover, which nutritional index has superior predictive power remains unclear.
In addition to nutritional status, emerging evidence suggests a close relationship between the initiation, progression, invasion, and metastasis of NPC and the inflammatory microenvironment within the tumor [8]. Several inflammatory biomarkers, including the systemic immune-inflammation index (SII), systemic inflammatory response index (SIRI), platelet-to-lymphocyte ratio (PLR), and neutrophil-to-lymphocyte ratio (NLR), have been demonstrated as effective prognostic factors in various types of cancer, representing diverse inflammatory and immune pathways in vivo [9,10,11]. Nevertheless, no reliable inflammatory biomarker is currently available to predict the efficacy of chemoimmunotherapy in patients with dmNPC.
However, the absence of tumor-related factors makes it unreliable to rely solely on nutritional or inflammatory parameters for predicting the outcomes of dmNPC. Plasma Epstein–Barr virus (EBV) deoxyribonucleic acid (DNA) level, one of the most dependable prognostic indicators for NPC, have been widely used for disease screening, prognosis evaluation, and monitoring of disease progression [12,13,14]. EBV-DNA titer has proven to be a valuable biomarker for predicting prognosis and monitoring disease progression in patients with RM-NPC undergoing immunotherapy [15]. Unfortunately, the time point at which the EBV DNA level measured could better reflect the tumor burden remains uncertain. Furthermore, an optimal cut-off value of plasma EBV DNA levels is still being determined.
To the best of our knowledge, no validated nutritional or inflammatory parameters exist that are capable of predicting the outcomes of patients with dmNPC who have been treated with chemotherapy combined with PD-1 inhibitor. Thus, this study is aimed at clarifying the prognostic and predictive values of the nutritional indicators, inflammatory biomarkers, and plasma EBV DNA level to predict survival among patients with dmNPC. Additionally, we established and validated a novel predictive model based on a combination of baseline nutritional, inflammatory, and other clinical indicators to optimize risk stratification of patients with dmNPC and to appropriately determine treatment and surveillance strategies following chemotherapy in combination with a PD-1 inhibitor.

2. Materials and Methods

2.1. Data Extraction and Study Population

Figure S1 illustrates a flowchart depicting the patient enrollment strategy and inclusion criteria. A total of 131 patients who were diagnosed with de novo metastatic NPC and received a first-line or subsequent-line chemotherapy combination PD-1 inhibitor in our institution between March 2017 and November 2020 were included in this study. Patients were excluded from the study if they had (i) a history of previous or synchronous malignant tumors (n = 19), (ii) asynchronous metastasis after curative treatment (n = 52), (iii) received less than two cycles of chemotherapy in combination with a PD-1 inhibitor (n = 30), or (iv) incomplete clinical data (n = 87). Patients were randomly assigned to either the training cohort (n = 88) or the validation cohort (n = 43) in a 2:1 ratio for model development and verification. The staging of all patients was determined using the 8th edition of the AJCC staging system. The study was approved by the Ethics Committee of our institution (approved number: B2023-492-01). Informed consent was waived due to the retrospective nature of the study and the anonymization of the patients’ data.

2.2. Data Collection and Classification

Candidate nutritional and inflammatory parameters were selected to develop a nomogram after reviewing the literature. This study focused on 18 indexes, including NRI, PNI, SII, SIRI, LMR, PLR, NLR, COUNT score, Glasgow prognostic score (GPS), lactate dehydrogenase-to-albumin ratio (LAR), lactate dehydrogenase (LDH) levels, gamma-glutamyl transferase (GGT) levels, C-reactive protein (CRP) levels, alkaline phosphatase (ALP) levels, uric acid (UA) levels, glucose (GLU) levels, creatine kinase (CK) levels, and serum amyloid A (SAA) levels. The levels of LDH, GGT, CRP, ALP, UA, GLU, CK, and SAA were obtained from routine laboratory examination results. EBV DNA concentrations were measured before and after treatment at diagnosis and within one week after completing chemotherapy, following the methods described in previous studies [16]. Other indicators were calculated according to the following formulas: NRI = 1.487 × albumin (g/L) + 41.7 × weight/ideal body weight (kg), where ideal body weight was defined as 22 × height (m)2 [17]; PNI = albumin (g/L) + 5 × lymphocyte counts (109/L) [18]; NLR, LAR, LMR, and PLR as the ratios of the absolute neutrophil count (109/L) to the absolute lymphocyte count (109/L), lactate dehydrogenase (U/L) to albumin (g/L), the absolute lymphocyte count (109/L) to the absolute monocyte count (109/L), and the absolute platelets count(109/L) to the absolute lymphocyte count(109/L), respectively; SII = platelet × NLR [19]; and SIRI = neutrophil × monocyte/lymphocyte counts [20]. The GPS and CONUT scores were estimated using the scoring systems described in Tables S1 and S2 (available in Supplementary Materials). The analysis also included other conventional factors, including demographic factors (age and sex), clinical factors (body mass index and comorbidity), tumor factors (TNM stage and number of metastatic sites), and laboratory factors (pretreatment and post-treatment EBV DNA levels). The calculated NRI, PNI, and other indicators were analyzed using Microsoft Excel (Redmond, WA, USA).

2.3. Treatments

All eligible patients received one of the following platinum-based chemotherapy regimens: (1) GP: gemcitabine (1000 mg/m2 intravenously on days 1 and 8 of a 21-day cycle) plus cisplatin (80–100 mg/m2 intravenously on day 1 of a 21-day cycle); (2) PF: cisplatin (80–100 mg/m2 intravenously on day 1 of a 21-day cycle) plus 5-fluorouracil (500 mg/m2 continuous intravenously infusion on days 1–5 of a 21-day cycle); (3) TP: paclitaxel (175–200 mg/m2 intravenously on day 1 of a 21-day cycle) or docetaxel (70–75 mg/m2 intravenously on day 1 of a 21-day cycle) plus cisplatin (75–80 mg/m2 intravenously on day 1 of a 21-day cycle); (4) TPF: paclitaxel (135 mg/m2 intravenously on day 1 of a 21-day cycle) or docetaxel (60 mg/m2 intravenously on day 1 of a 21-day cycle) plus cisplatin (60 mg/m2 intravenously on day 1 of a 21-day cycle) plus 5- fluorouracil (600 mg/m2, continuous intravenously infusion on days 1–5 of a 21-day cycle), or oral capecitabine (1000 mg/m2 orally twice daily, days 1–14 of a 21-day cycle) [21]. Patients received anti-PD-1 agents every 3 weeks, including camrelizumab (200 mg) [22], toripalimab (3 mg/kg) [23], sintilimab (200 mg) [24], tislelizumab (200 mg) [25], or nivolumab (3 mg/kg or 240 mg) [26], until unacceptable toxicity developed, the disease progressed, the patient withdrew informed consent, or the investigator deemed it necessary, up to a maximum of 2 years.

2.4. Endpoints and Follow-Up

The primary endpoint was progression-free survival (PFS), which was defined as the interval from the start date of chemotherapy combination PD-1 inhibitor to disease progression or death from any cause. The secondary endpoints included overall survival (OS), objective response rate (ORR), and disease control rate (DCR). OS duration was measured from the first day of treatment to death from any cause. Tumor response was assessed every two treatment cycles, starting with the initiation of chemotherapy combination PD-1 inhibitor until progression or the start of another anticancer treatment. Objective response (OR) was defined as complete response (CR) or partial response (PR) with at least one sequential tumor assessment confirmed, according to revised Response Evaluation Criteria in Solid Tumors (RECIST v1.1). Disease control (DC) was defined as radiologically confirmed CR, PR, and stable disease (SD). Patients were followed up at least every 3 months after treatment completion. Each follow-up visit assessment included a complete physical examination, nasopharyngoscopy, head and neck MRI, chest X-ray or computed tomography scan, abdominal sonography or computed tomography scan, bone scans or [18F] FDG PET–CT, and plasma EBV DNA assay.

2.5. Statistical Analysis

Categorical variables were compared using the chi-square test or Fisher’s exact test. All continuous variables were converted into binary based on the optimal cut-off point determined by maximally selected rank statistics. Cox proportional hazards models were used to assess the prognostic value of each candidate index and calculate the corresponding hazard ratio (HR). Covariates with a p-value < 0.1 in univariate analyses were included in subsequent backward stepwise multivariate analyses. The 6-month PFS has been recommended as an end-point for checkpoint-inhibitor monotherapy trials [27]. Consequently, we utilized 1-year and 18-month PFS as time points for constructing a nomogram to assess the effectiveness of combined immunochemotherapy. The nomogram model incorporated all significant factors identified in the multivariate analysis, as well as important prognostic factors. The calibration capacities were evaluated using a calibration plot. The predictive performance of the nomogram was evaluated using the area under the receiver operating characteristic (ROC) curve (AUC) and was compared with that of other traditional or constituent factors. Decision curve analysis (DCA) was conducted to estimate the clinical utility of this model. Bootstraps with 1000 re-samples and 10-fold cross-validation were applied to avoid overfitting. We then stratified the patients into two categories based on the cut-off value of the total points derived from the established nomogram: favorable- and unfavorable- prognosis. Kaplan–Meier curves were used to estimate the time-to-event data of the favorable- and unfavorable- prognosis groups and were compared using the log-rank test. All statistical analyses were performed using Jamovi 2.3.26, SPSS 24.0, or R 4.2.1 (R project, http://www.R-project.org/; accessed on 16 June 2022, version 4.2.1, R Core Team, Vienna, Austria). Statistical significance was defined as a two-sided p value of less than 0.05.

3. Results

3.1. Patient Characteristics and Treatment Outcomes

No significant differences existed between the training and validation cohorts in the baseline characteristics (Table 1). The patients included 110 men (84.0%) and 21 women (16.0%), with a median age of 46 years (interquartile range, 38–53 years).
As of the last follow-up date of 30 April 2023, the median patient follow-up time was 34.7 months (interquartile range, 23.8–58.3 months). Among the patients who received the chemotherapy combination PD-1 inhibitor, 84 (64.1%) patients experienced disease progression and 47 (35.9%) patients had died. The median progression-free survival (mPFS) of the entire cohort was 18.87 months (95% CI: 12.86–24.87 months) with 1-year, 2-year, and 3-year probabilities of PFS at 59.1%, 41.1%, and 25.9%, respectively. The objective response rate (ORR) was 72.5% (95% CI: 64.3–79.4%), and the disease control rate (DCR) was 84.0% (95% CI: 76.7–89.3%).

3.2. Factors Associated with Disease Progression

The optimal cut-off values determined by the maximally selected rank statistics in the whole dataset for BMI, NRI, PNI, SII, SIRI, LAR, LMR, NLR, PLR, and pretreatment and post-treatment EBV DNA were identified to be 19.19 kg/m2, 108.08, 49.20, 521.32, 2.42, 3.74, 2.87, 3.24, 123.0, 4760, and 99.50 copies/mL, respectively (Supplementary Materials). Univariate and multivariate Cox regression results are presented in Table 2. A total of 11 variables (p < 0.1) were selected for multivariate analysis from the univariate analysis of the training cohort. The stepwise multivariate analysis revealed that baseline UA level (HR: 5.026, 95% confidence interval (Cl): 1.532–16.497, p = 0.008), PNI (HR: 0.096, 95% Cl: 0.030–0.309, p < 0.001), NRI (HR: 0.176, 95% Cl: 0.066–0.464, p < 0.001), and post-treatment EBV DNA level (HR: 3.109, 95% CI: 1.502–6.437, p < 0.003) were identified as independent significant prognostic factors for PFS (Table S1). Notably, the SII showed a possible association with disease progression in the univariate analysis (HR: 2.088, 95% Cl: 0.987–4.418, p = 0.054), whereas it was not a significant predictor in the multivariate analysis (HR: 1.990, 95% Cl: 0.732–5.413, p = 0.177). Despite this, considering its potential prognostic value, the SII was incorporated into the final model as well.

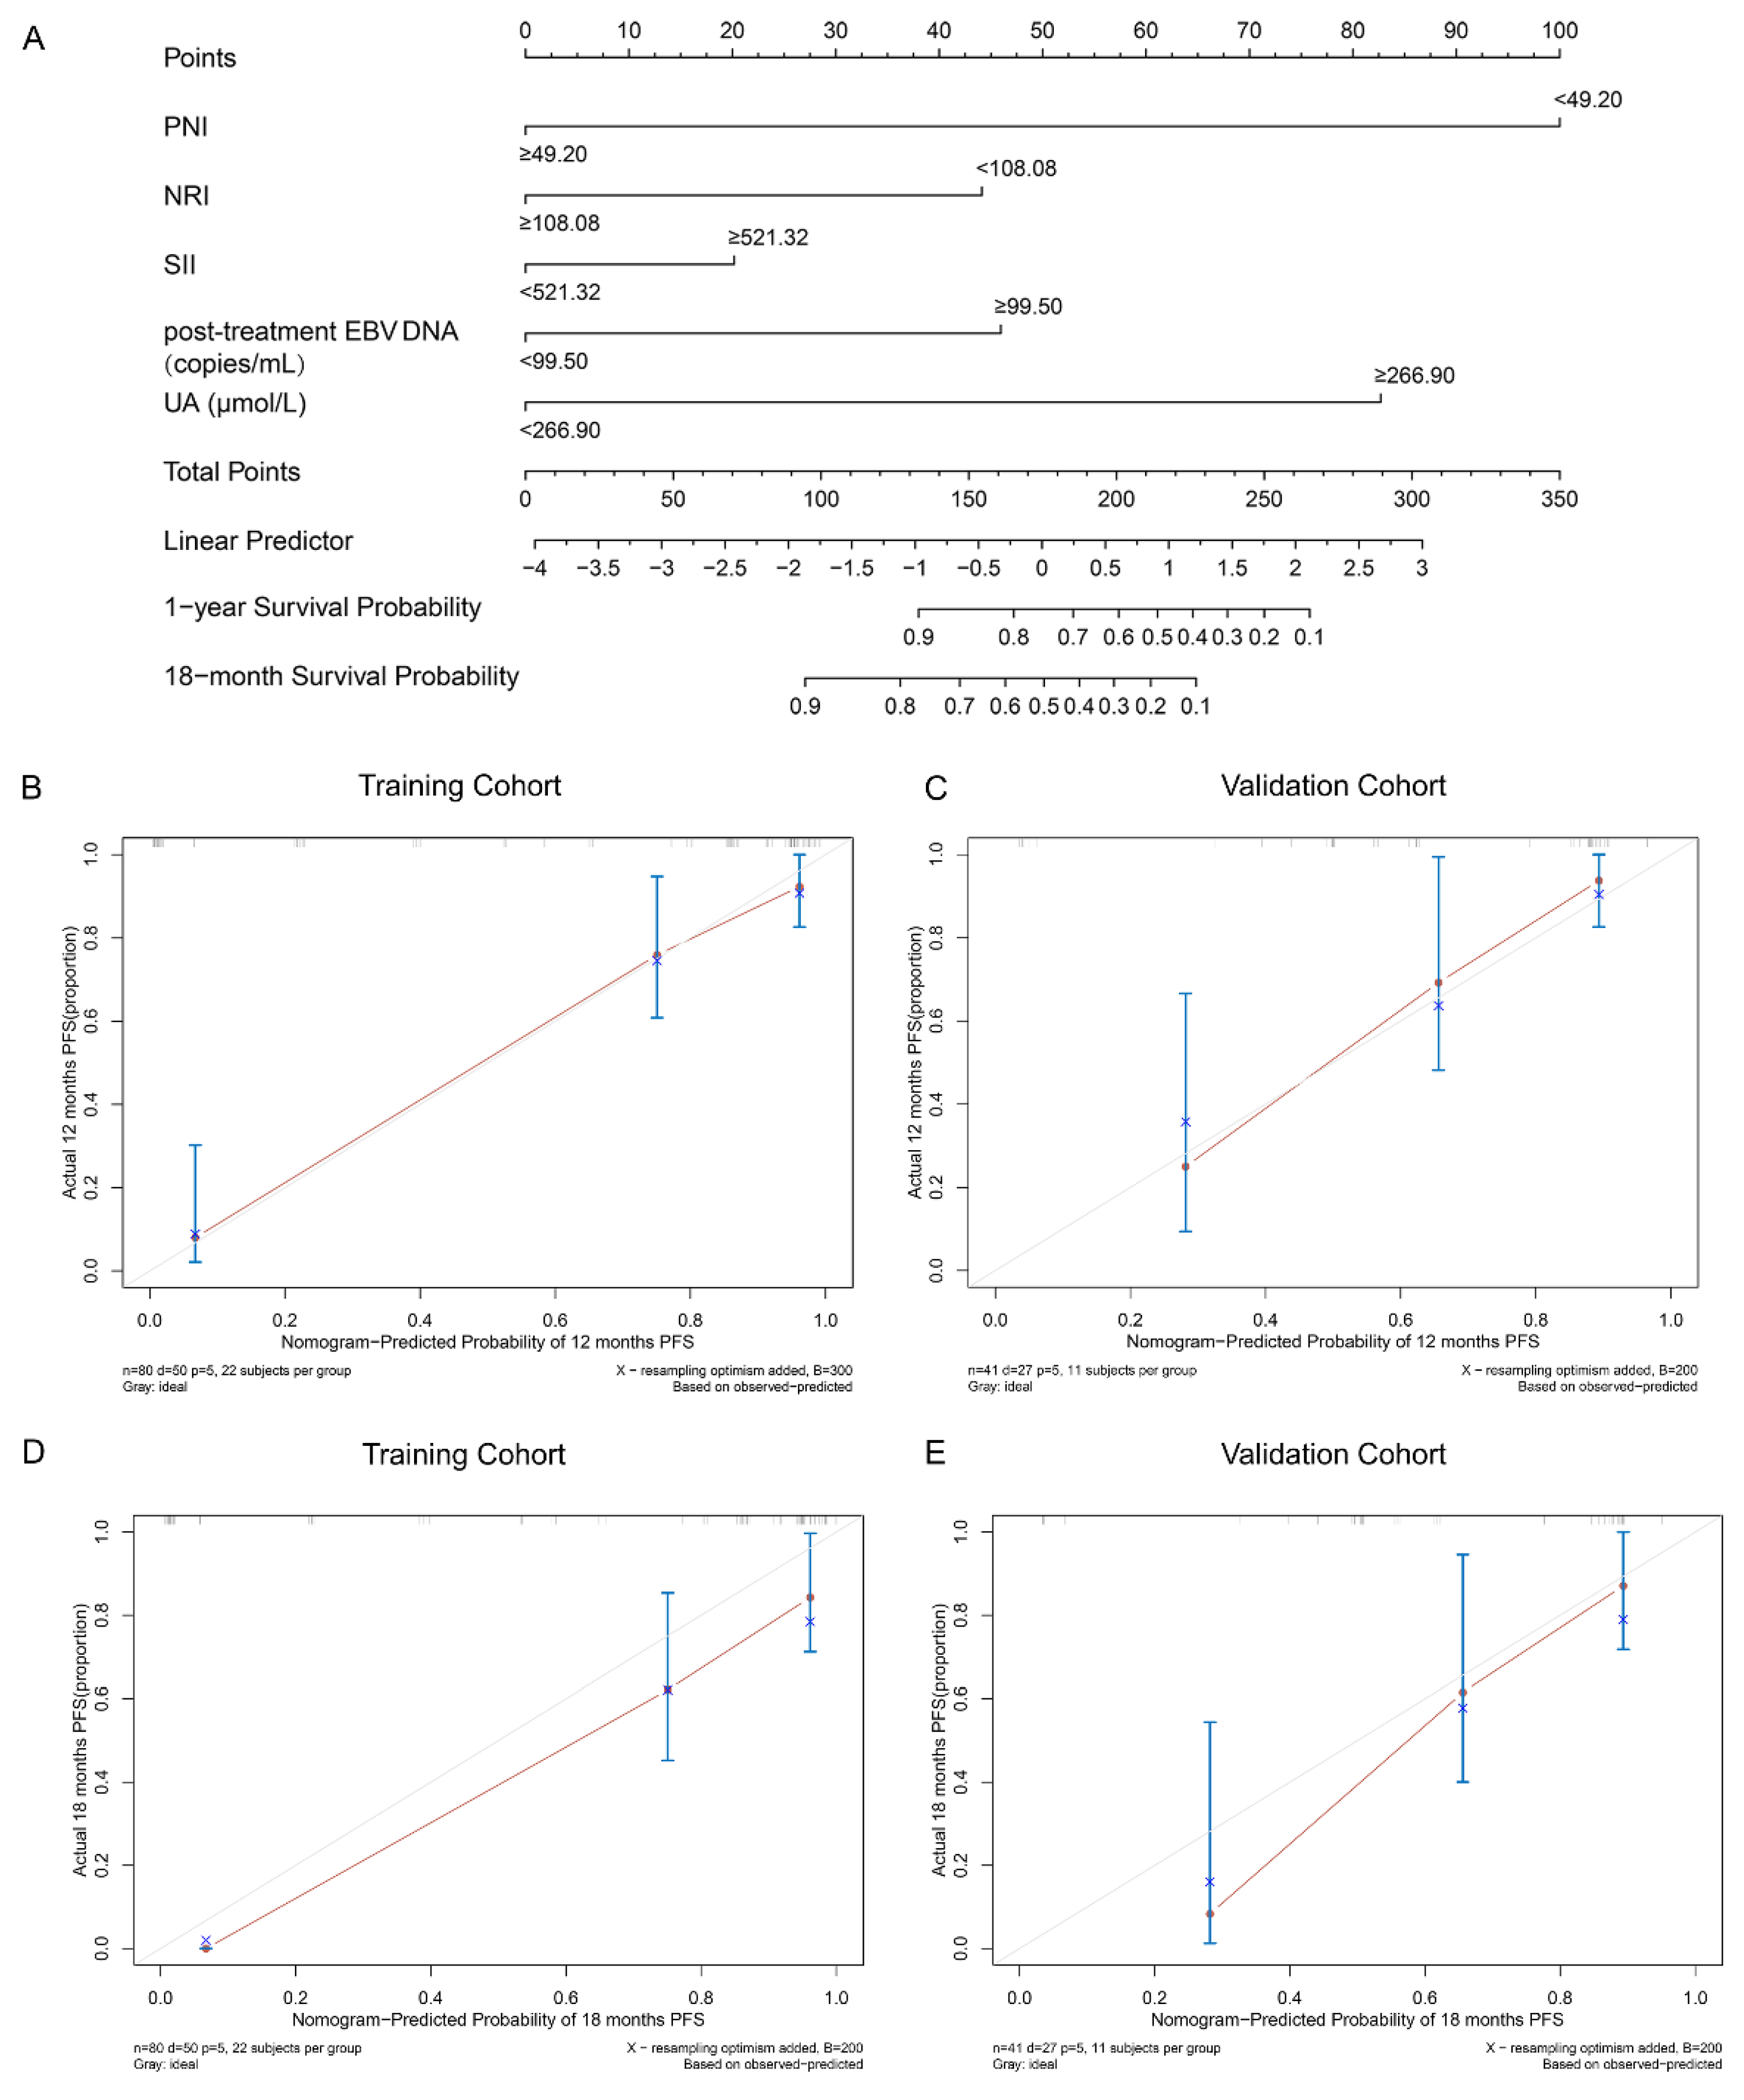
3.3. Development of a Nomogram Model for PFS

A nomogram was developed to predict the PFS of patients with dmNPC who received first-line or subsequent-line chemotherapy combined with PD-1 inhibitor. This nomogram was constructed based on several prognostic factors, including PNI (<49.20 or ≥49.20), NRI (<108.08 or ≥108.08), SII (<521.32 or ≥521.32), UA (<266.90 or ≥266.90 μmol/L), and post-treatment EBV DNA level (<99.50 or ≥99.50 copies/mL) (Figure 1A). The calibration of the established nomogram for predicting 1-year and 18-month PFS demonstrated good agreement between the nomogram-based predictions and the observed outcomes in both the training and validation cohorts (Figure 1B).
The DCA used to evaluate the potential clinical application of this nomogram in the training and validation cohorts is presented in Figure 2, which shows that the nomogram provided satisfactory performance.

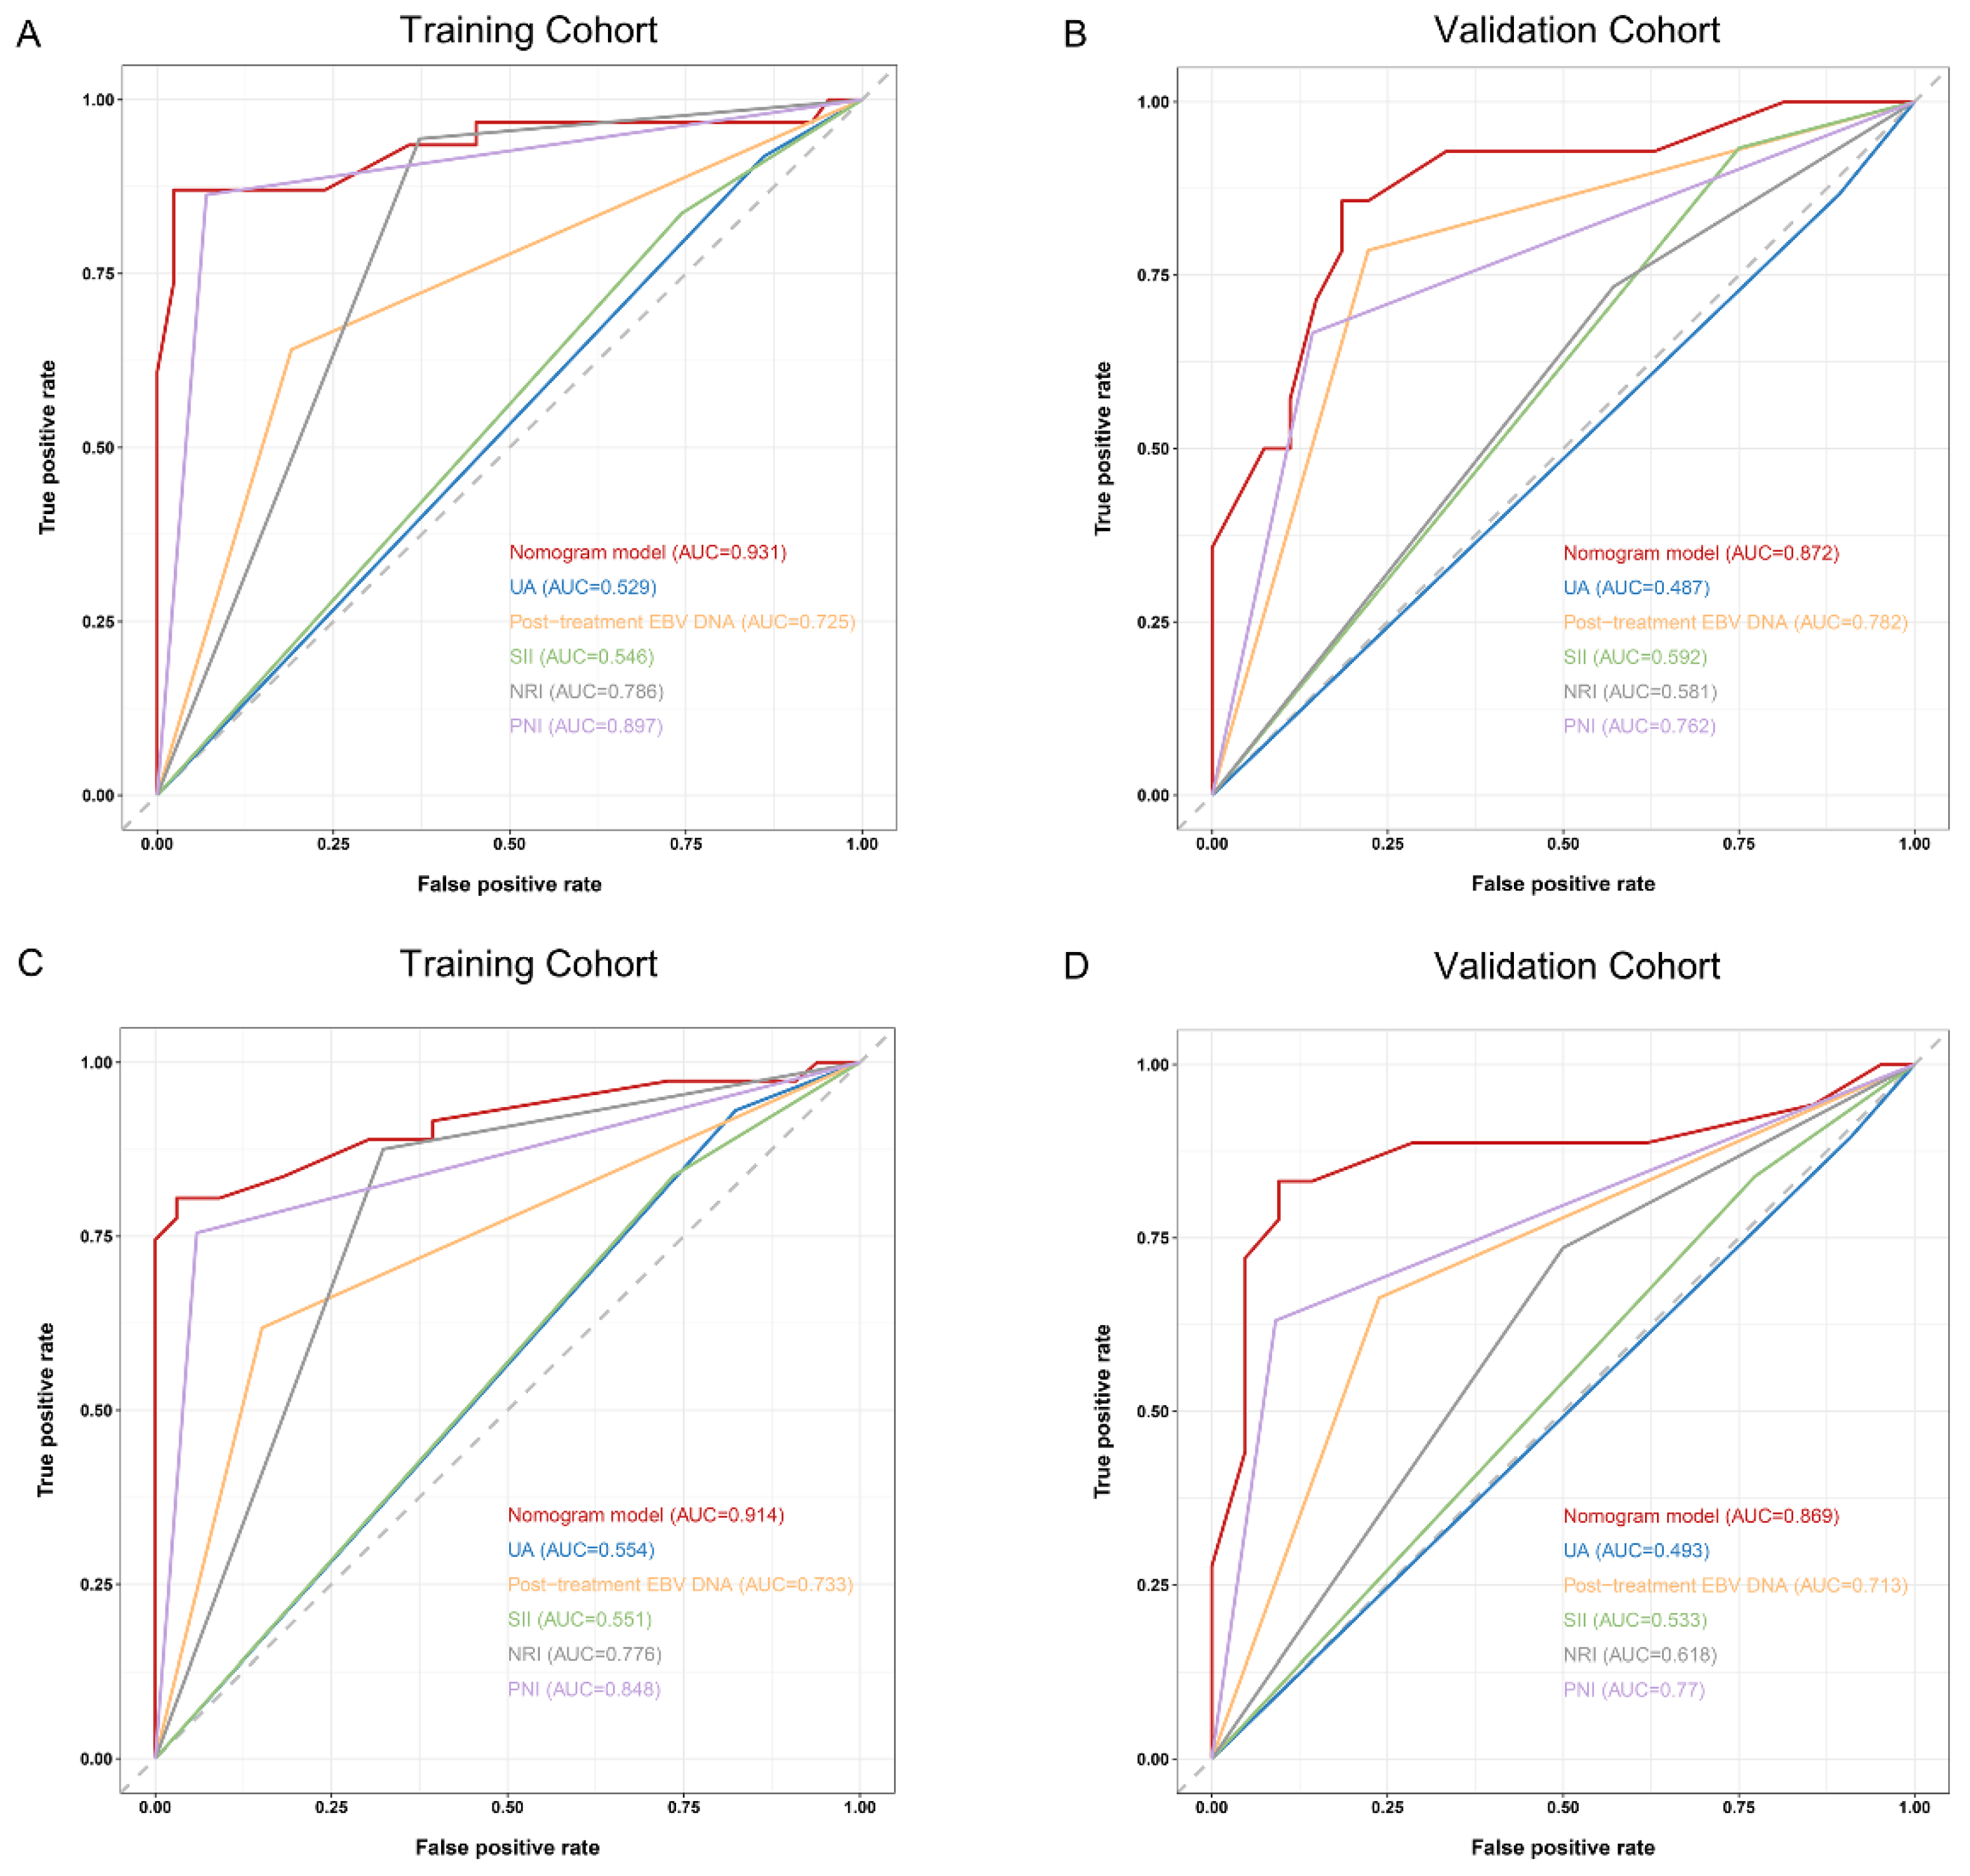
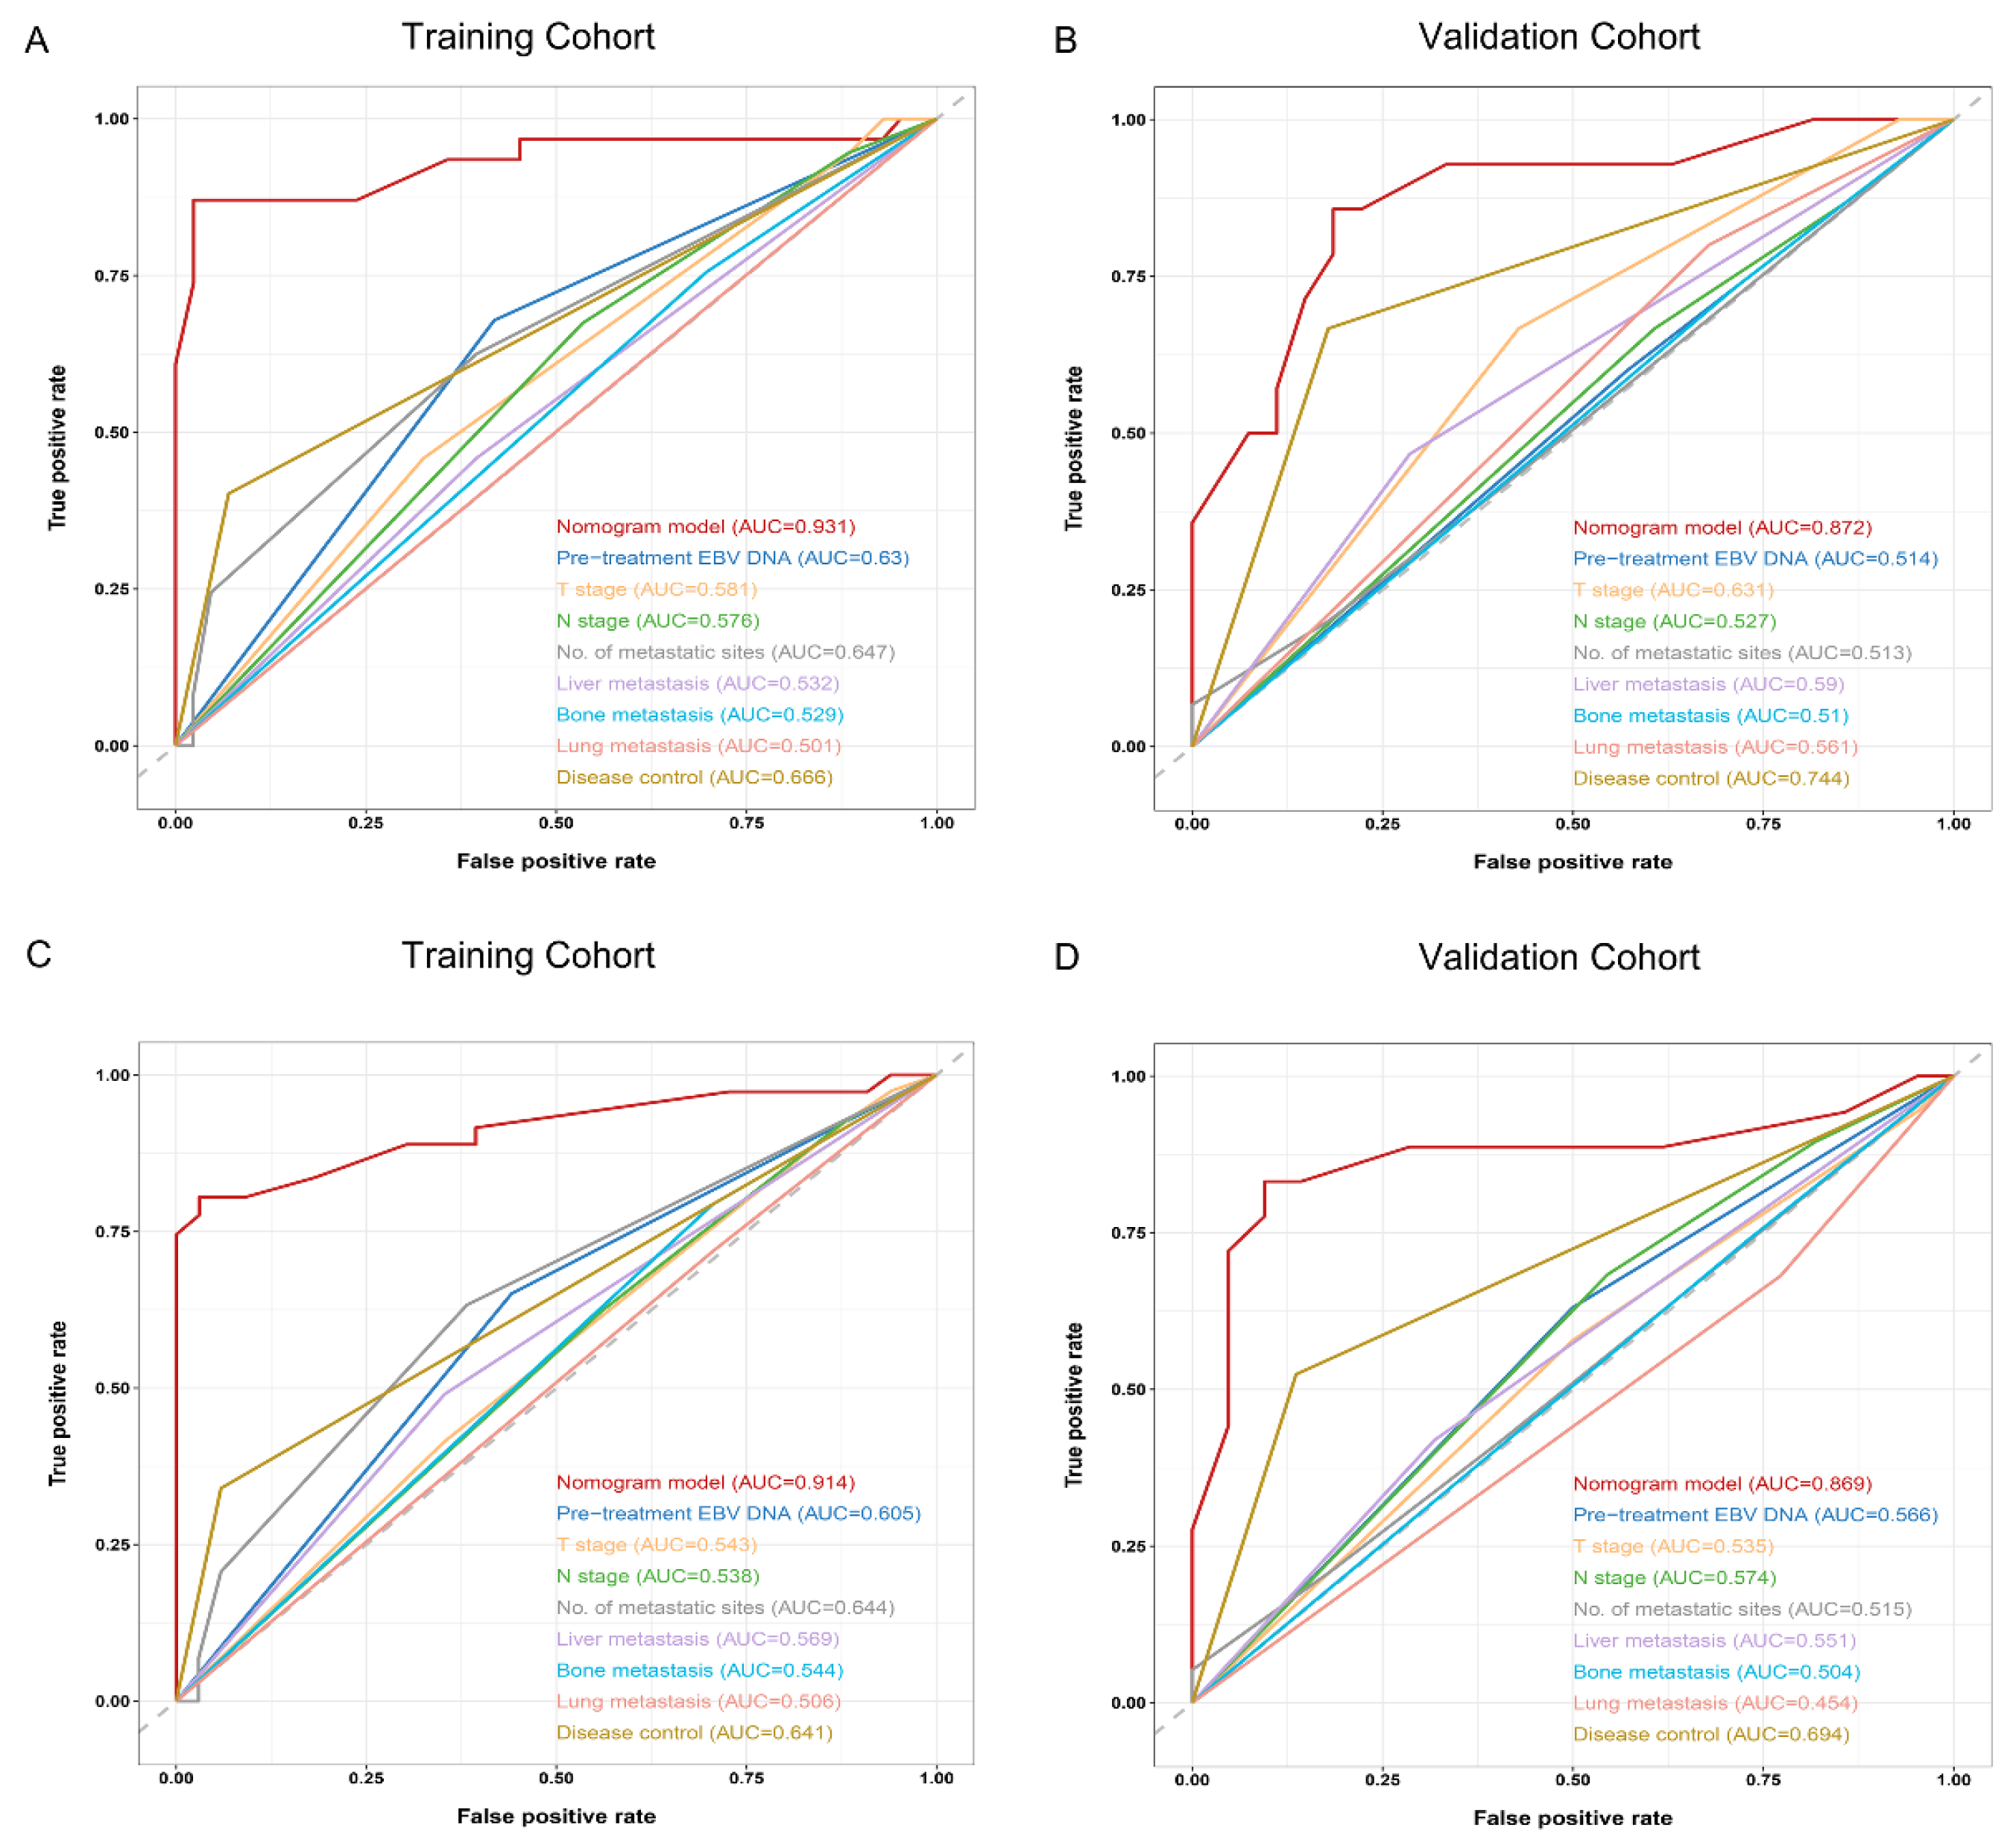
3.4. Comparison and Validation of the Predictive Accuracy of Nomogram and Other Traditional Factors

The ROC curves clearly demonstrated that the nomogram exhibited superior discriminative ability in predicting 1-year and 18-month PFS compared to any of the traditional baseline factors, as observed in both the training and validation cohorts (Figure 3).

3.5. Comparison and Validation of the Predictive Accuracy of Nomogram and Other Constituent Factors

The predictive efficiency for PFS in patients with dmNPC was compared among nomogram, PNI, NRI, SII, UA, and post-treatment EBV DNA. The AUC of the nomogram was also significantly superior to that of any independent factor, both in the training and validation cohorts (Figure 4).

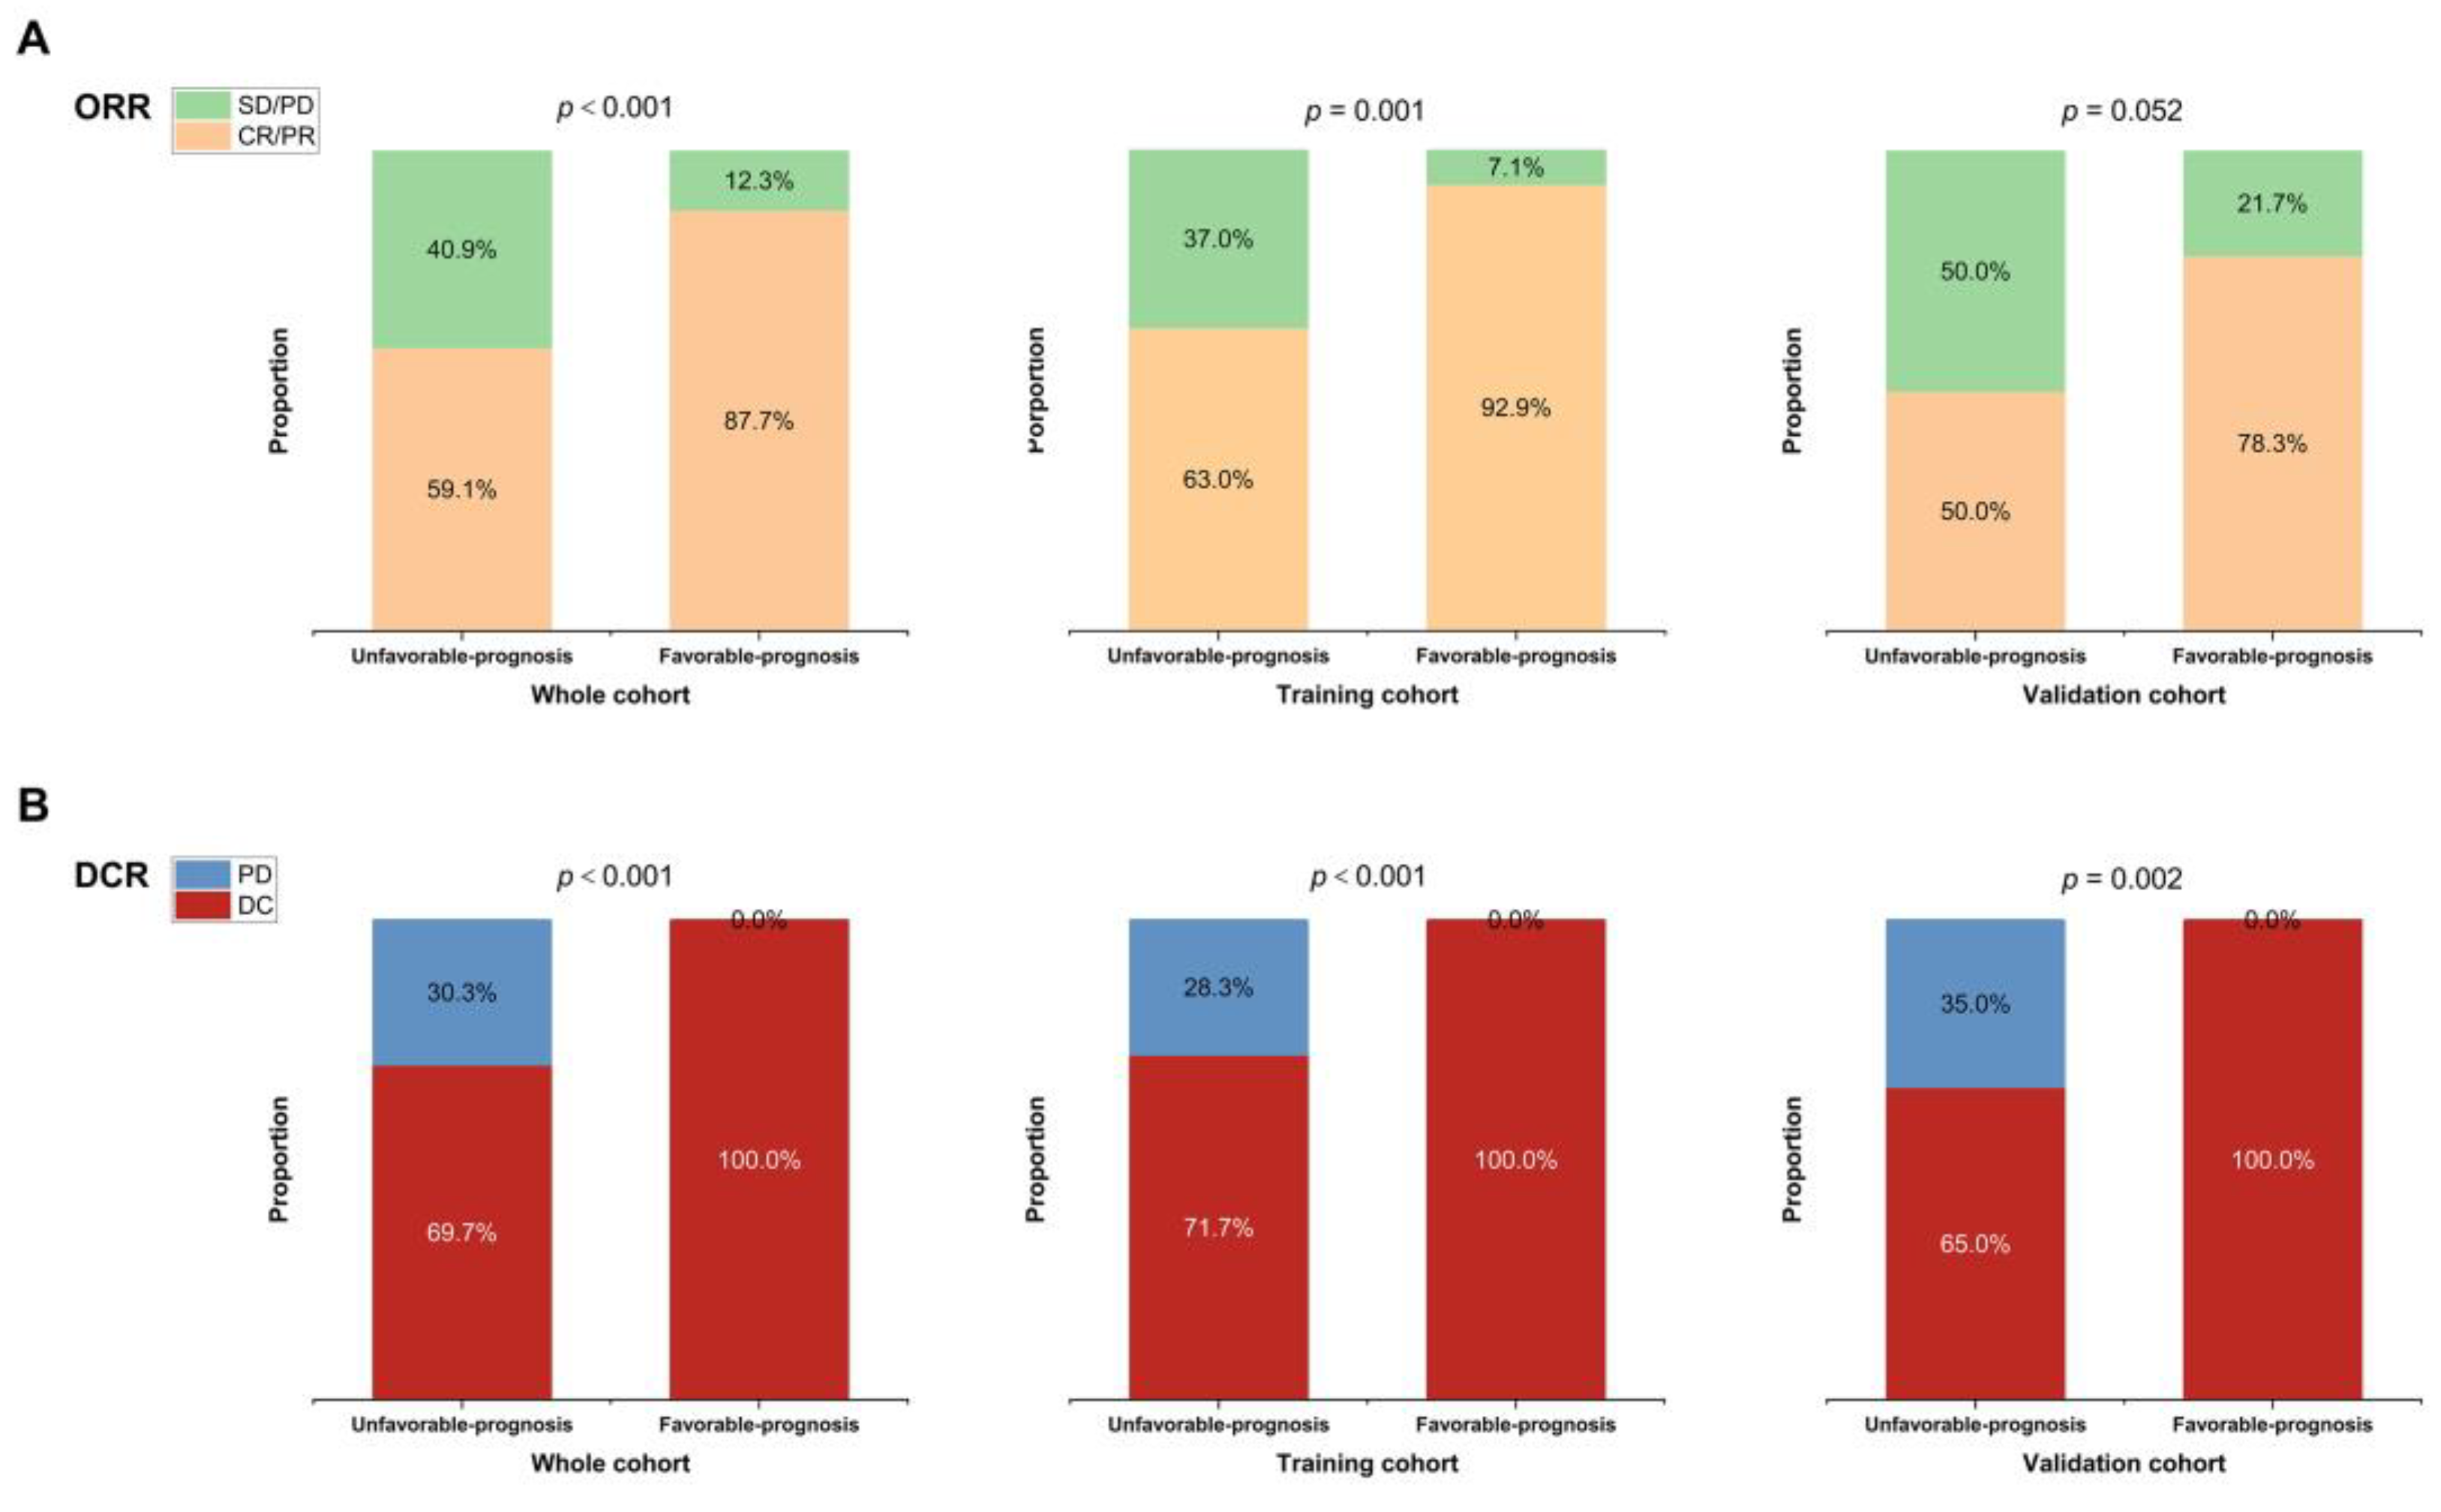
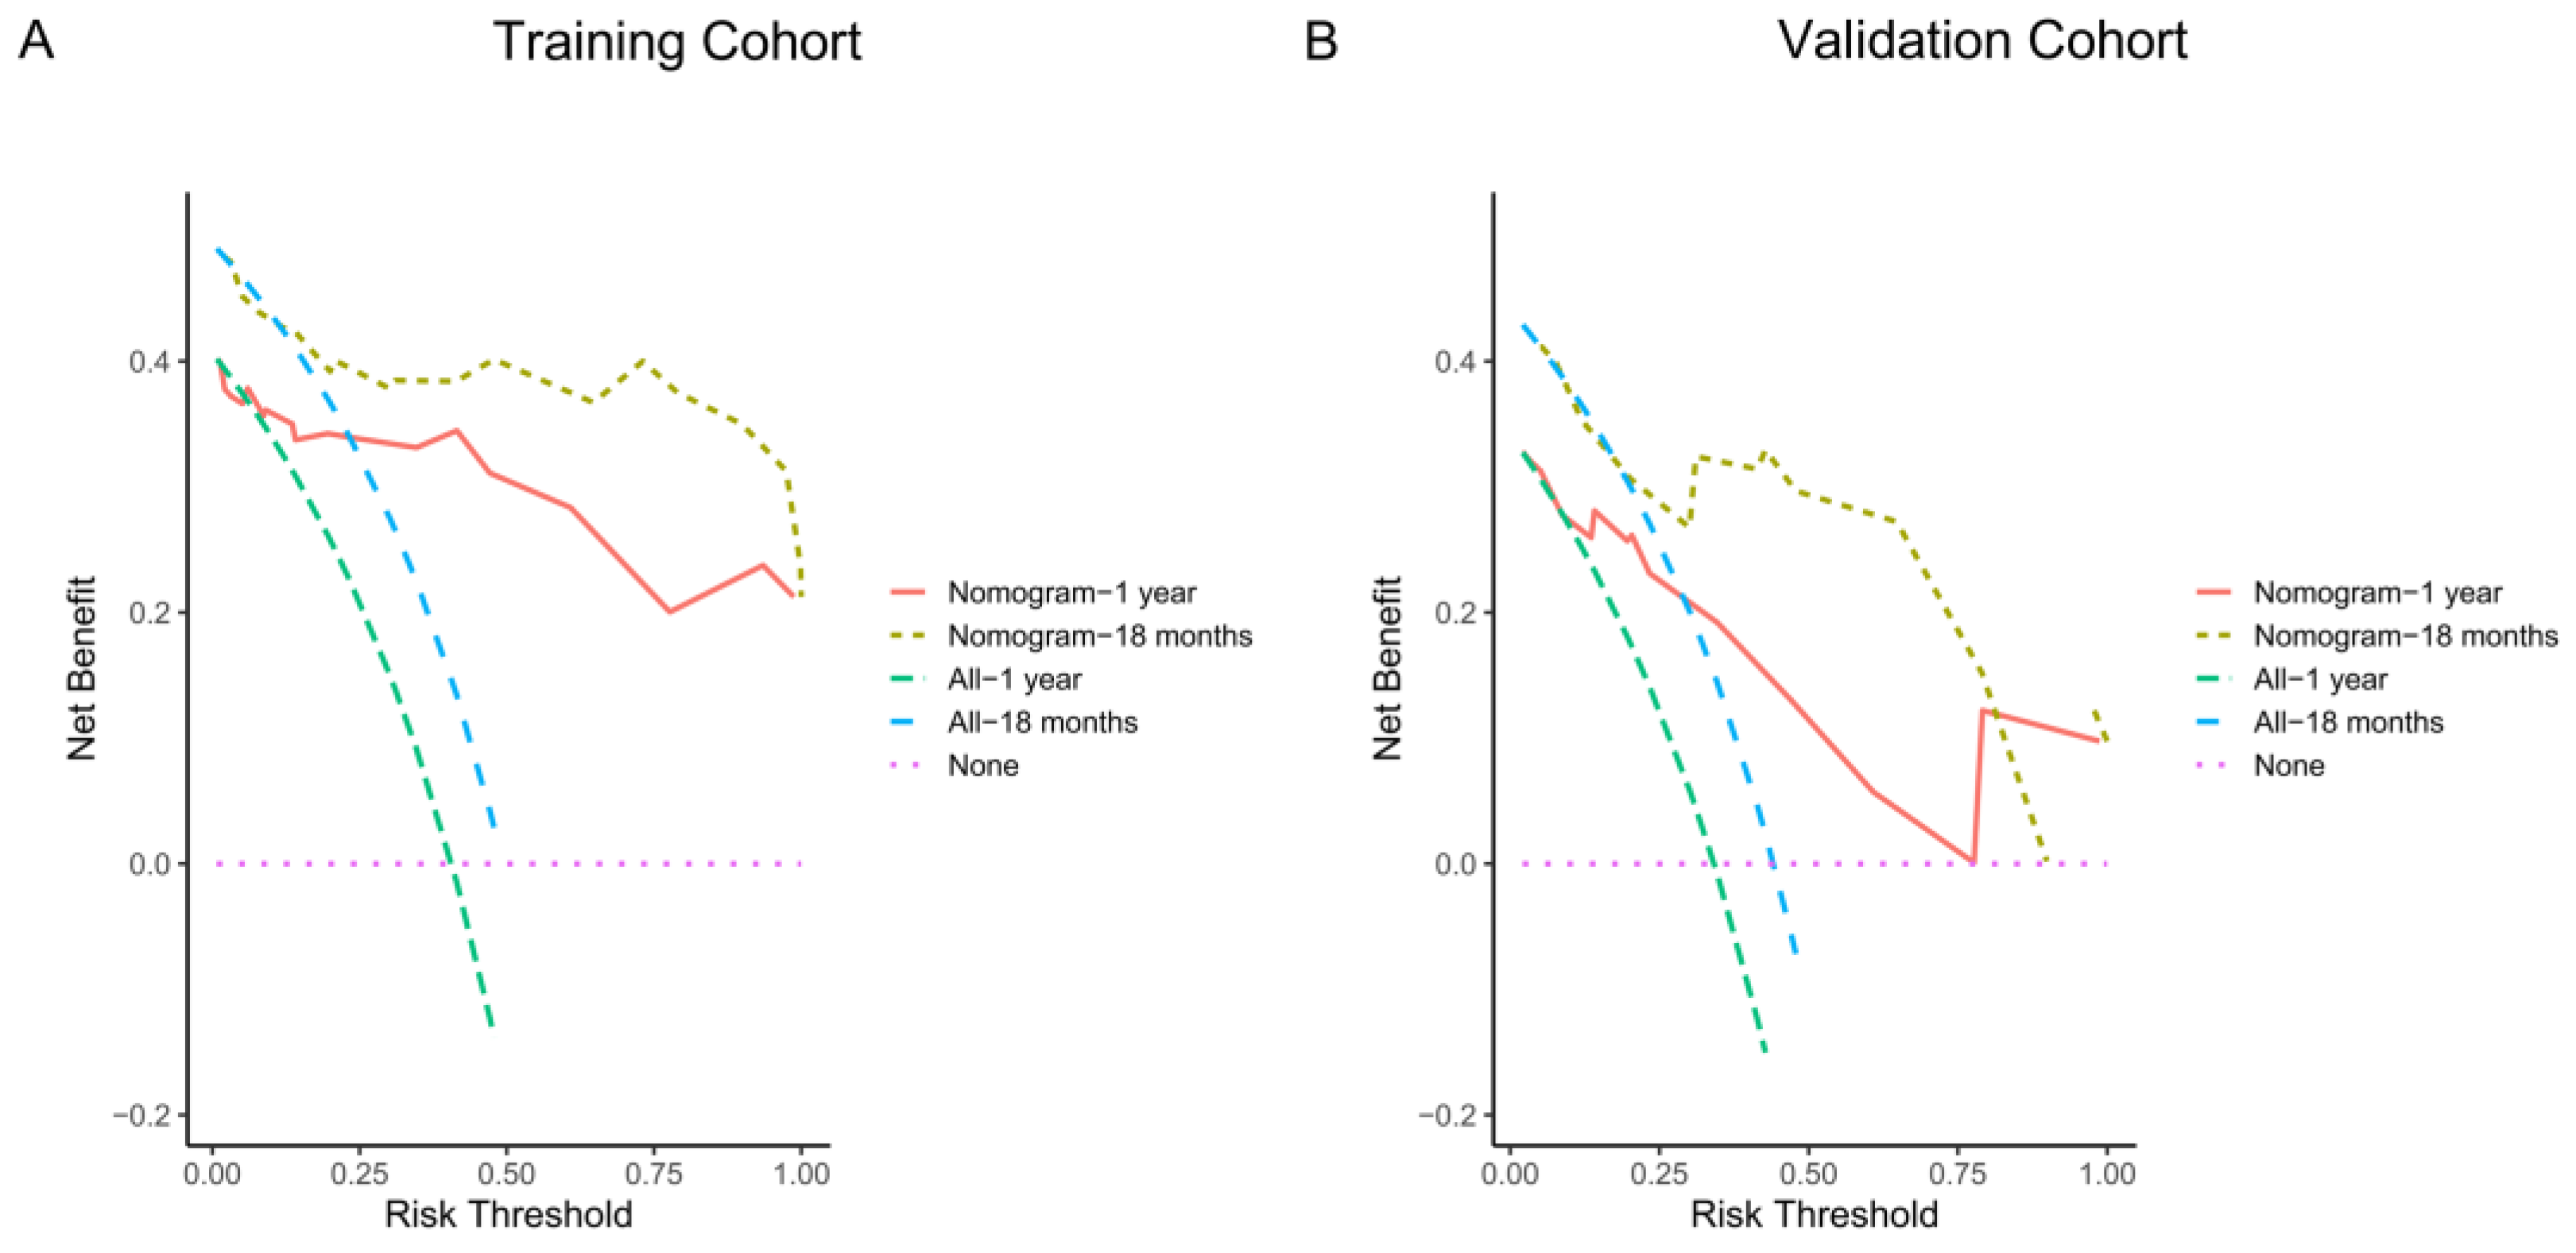
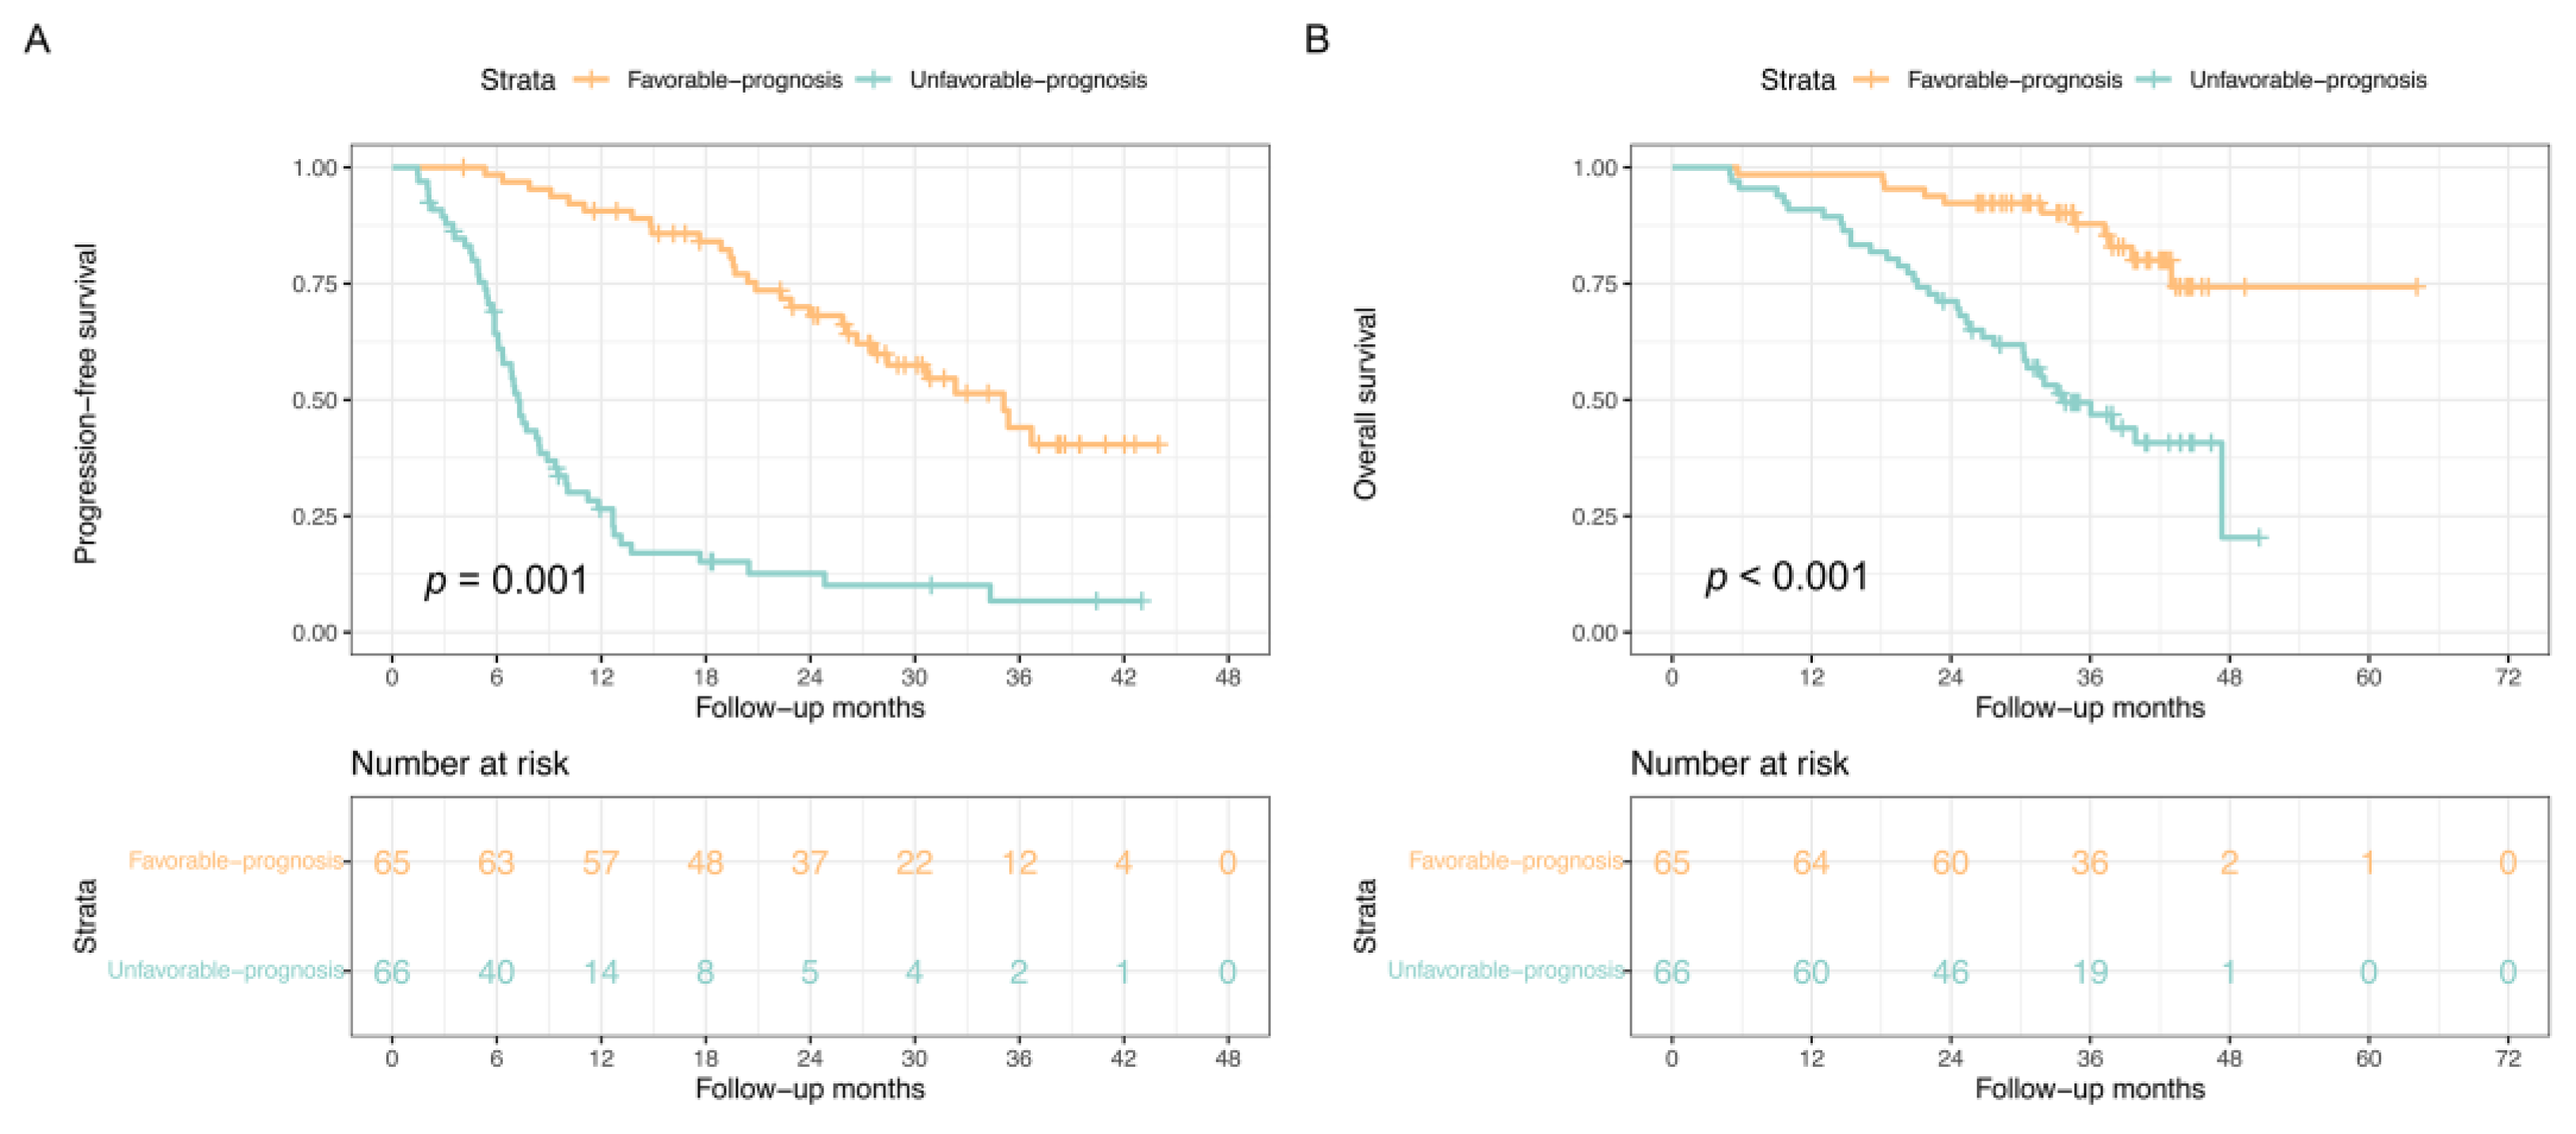
3.6. Separating Patients into Different Risk Groups

According to the best cut-off values of the total score derived from the nomogram, all patients were categorized into two risk groups: a favorable-prognosis group (total scores < 164 points) and an unfavorable-prognosis group (total scores ≥ 164 points). Figure 5 illustrates the survival curves for PFS and OS of these prognostic groups. The favorable-prognosis group exhibited significantly longer survival outcomes compared to the unfavorable-prognosis group (mPFS, 35.10 months [95%CI:27.36–42.84] vs. 7.23 months [95%CI: 6.50–7.97], p = 0.001; mOS, not reached vs. 33.73 months [95%CI: 36.73–40.73], p < 0.001) (Table 3).
In addition, we discovered that the ORR was higher in the favorable-prognosis group than in the unfavorable-prognosis group (pooled analysis, 87.7% [95% CI: 77.6–93.6%] vs. 59.1% [95% CI: 47.1–70.1%], p < 0.001; training cohort: 92.9% [95% CI: 81.0–40.0%] vs. 63.0% [95% CI: 48.6–75.5%], p = 0.001; validation cohort: 78.3% [95% CI: 58.1–90.3%] vs. 50.0% [95% CI: 30.0–70.1%], p = 0.052; Figure 6A). Additionally, the DCR was better in the favorable-prognosis group than in the unfavorable-prognosis group (pooled analysis, 100.0% [95% CI: 94.4–100.0%] vs. 69.7% [95% CI: 57.8–79.5%], p < 0.001; training cohort, 100.0% [95% CI: 91.6–100.0%] vs. 71.7% [95% CI: 57.5–82.7%], p < 0.001; validation cohort, 100.0% [95% CI: 85.7–100.0%] vs. 65.0% [95% CI: 43.3–81.9%], p = 0.002, Figure 6B).

4. Discussion

This study established and validated a combined model that integrates nutritional indexes, inflammatory parameters, EBV DNA, and biochemistry profiling to predict survival without disease progression in patients with dmNPC undergoing chemotherapy combination PD-1 inhibitor treatment. According to the nomogram scores, we developed a risk stratification system that could allocate patients into favorable- and unfavorable-prognosis groups. Furthermore, this prognostic model serves as a clinically useful tool for individualized survival prediction and aids in formulating personalized surveillance recommendations for dmNPC.
The development of NPC is strongly associated with EB virus infection in epidemic areas [28]. Therefore, there is abundant lymphocyte infiltration and high-level programmed death ligand-1 (PD-L1) expression in the tumor region, which makes immunotherapy a promising choice for the treatment of NPC [29]. Recently, platinum-based chemotherapy in combination with PD-1 inhibitor has been recommended as the primary treatment option for dmNPC [30]. However, the outcomes of patients at the same stage receiving the same treatment may be completely different. Moreover, there is currently no standard follow-up strategy for patients with dmNPC following combined chemoimmunotherapy treatment; treatment options beyond the first line of therapy are limited [31]. Thus, it is imperative to identify alternative biomarkers that can predict treatment outcomes.
Malnutrition has been proven to have adverse effects on the body’s immune system, therapeutic efficacy, and tolerance to interventions, thereby exacerbating disease progression, local recurrence, and distant metastasis [32]. Malnutrition has been reported to occur in 35–60% of patients with NPC, significantly impacting treatment responses [33]. However, traditional nutritional parameters such as body mass index (BMI) and serum albumin (ALB) have certain limitations in estimating the nutritional status of cancer patients. For example, BMI may not accurately reflect changes in body fat and muscle mass proportions with age [34]. In this study, we verified that the nutritional risk index (NRI), which is calculated based on the patient’s height, weight, and serum albumin level, provided more reliable predictive power for survival outcomes in patients with dmNPC compared to body mass index (BMI) and albumin alone. Our findings indicated that patients in the high NRI score group exhibited better PFS than those in the low NRI score group, which is in agreement with the results of a previous study investigating single nutritional parameter in NPC [35]. Regarding another nutritional parameter related to the PFS of patients with dmNPC in our study, the prognostic nutritional index (PNI) was also reported as a prognostic factor for the distant metastasis-free survival (DMFS), disease-specific survival (DSS) and overall survival (OS) in patients with NPC treated with intensity-modulated radiotherapy (IMRT) [6]. In addition to serum albumin, PNI also incorporates the lymphocyte count in the peripheral blood, which is a crucial biomarker of the host’s cellular adaptive immune response against cancer cells [36]. Therefore, PNI is widely regarded as a reliable indicator that reflects both the nutritional and immune status of patients [37].
On the other hand, inflammation associated with cancer is acknowledged as a cancer hallmark that affects all stages of malignancies, including tumorigenesis, proliferation, invasion, and metastasis [38]. In our study, high SII score was related to worse PFS in univariate Cox regression analyses (p = 0.054; HR, 2.088; 95% CI, 0.987–4.418); however, multivariate analyses revealed no significant impact of SII (p = 0.177; HR, 1.990; 95% CI, 0.732–5.413) in predicting PFS. Considering the correlation between SII scores and tumor progression, we also incorporated it into the final model. The underlying biological mechanism linking high inflammatory parameters to a poor prognosis in cancer patients remains controversial. The prognostic value of SII may be explained by the roles of its components. Firstly, circulating neutrophils secrete large amounts of arginase, nitric oxide, and ROS, which can interfere with T-cell activation [39]. Secondly, lymphocytes could inhibit the proliferation and metastasis of cancer cells and then affect the host immune response [40]. Lastly, platelets play a role in protecting circulating tumor cells (CTCs) from shear stresses in the circulation, inducing epithelial-to-mesenchymal transition (EMT) of CTCs and promoting their infiltration into metastatic sites [41].
In this study, it was demonstrated that post-treatment EBV- DNA, rather than pre-treatment EBV- DNA, was a prognostic factor that significantly correlated with the outcomes of patients receiving combined immunochemotherapy. This finding was consistent with a previous prospective multicenter study [42]. Most early events in NPC are caused by disease progression or recurrence, which can be predicted by post-treatment EBV- DNA. This is because post-treatment EBV- DNA may reflect minimal residual disease at the end of treatment. As for the biochemical indicators, both univariate and multivariate analyses indicated that a high baseline serum uric acid (UA) level (>266.90 μmol/L) was an unfavorable prognostic factor for dmNPC, which is in accordance with the research of Du et al. [43]. They reported that serum UA level (>353.4 μmol/L) was an adverse feature for patients with locally advanced NPC. Uric acid, an antioxidant, plays a crucial role in protecting against DNA damage, weakening cell migration ability, eliminating reactive oxygen free radicals, and regulating cell death [44]. High serum UA levels may represent tumor burden, as the rapid proliferation and destruction of tumor cells lead to increased nucleic acid turnover [45].
Nevertheless, the capacity of a single parameter to evaluate the benefit of combined chemoimmunotherapy remains limited. Therefore, we integrated the aforementioned five independent prognostic factors to construct a nomogram model that can predict the probability of PFS after chemotherapy combination PD-1 inhibitor treatment in individual dmNPC patients. The combination of these five risk factors showed superior predictive effeciency than the individual factor. Based on this model, we stratified patients with dmNPC into favorable- or unfavorable-prognosis groups. Patients with a favorable prognosis were more likely to benefit from chemotherapy combined with PD-1 inhibitor treatment, while those with an unfavorable prognosis may progress sooner. Hence, such unfavorable-prognosis patients might require additional intensive therapeutic interventions, such as a combination of anti-VEGF therapies, anti-EGFR therapies, and locoregional radiotherapy.
However, this study also has some limitations. Firstly, the presence of certain selection biases are unavoidable due to the retrospective nature of the study. Secondly, the most common type of NPC in epidemic areas is associated with EBV infection, which may exhibit different tumor characteristics compared to low-risk areas. Finally, our study only enrolled patients from a single center and lacked external validation. Thus, the power of this prognostic model should be further validated in prospective clinical studies with multi-center cohorts.

5. Conclusions

In conclusion, our study proposed a combination of baseline nutritional and inflammatory indicators, post-treatment EBV DNA level, and laboratory examinations in a nomogram as possible prognostic biomarkers to predict 1-year and 18-month PFS for patients with dmNPC receiving combined immunochemotherapy. The proposed risk model had significantly better discrimination over other traditional indicators. Thus, it may be a useful tool for individualized assessment of the prognosis and personalized surveillance for patients with dmNPC treated with immunotherapy and chemotherapy.

Supplementary Materials

The following supporting information can be downloaded at: https://www.mdpi.com/article/10.3390/nu15194262/s1, Figure S1. Flowchart showing the study design and patient selection process. Figure S2. Cutoff of body mass index (BMI) determined by maximally selected rank statistics and survival curves stratified by the cutoff. Figure S3. Cutoff of nutritional risk index (NRI) determined by maximally selected rank statistics and survival curves stratified by the cutoff. Figure S4. Cutoff of prognostic nutritional index (PNI) determined by maximally selected rank statistics and survival curves stratified by the cutoff. Figure S5. Cutoff of systemic immune-inflammation index (SII) determined by maximally selected rank statistics and survival curves stratified by the cutoff. Figure S6. Cutoff of systemic inflammatory response index (SIRI) determined by maximally selected rank statistics and survival curves stratified by the cutoff. Figure S7. Cutoff of lactate dehydrogenase-to-albumin ratio (LAR) determined by maximally selected rank statistics and survival curves stratified by the cutoff. Figure S8. Cutoff of lymphocyte-to-monocyte ratio (LMR) determined by maximally selected rank statistics and survival curves stratified by the cutoff. Figure S9. Cutoff of neutrophil-to-lymphocyte ratio (NLR) determined by maximally selected rank statistics and survival curves stratified by the cutoff. Figure S10. Cutoff of platelet-to-lymphocyte ratio (PLR) determined by maximally selected rank statistics and survival curves stratified by the cutoff. Figure S11. Cutoff of pretreatment Epstein–Barr virus DNA (EBV DNA) determined by maximally selected rank statistics and survival curves stratified by the cutoff. Figure S12. Cutoff of post-treatment Epstein–Barr virus DNA (EBV DNA) determined by maximally selected rank statistics and survival curves stratified by the cutoff. Table S1. Screening tool for Glasgow prognostic score. Table S2. Screening tool for controlling nutritional status score.

Author Contributions

Conceptualization, H.L.; methodology, J.G.; software, J.G. and Q.J.; formal analysis, J.G., Q.Y. and L.-W.G.; data curation, Q.Y.; writing—original draft, J.G., Q.Y. and Q.J.; writing—review & editing, L.-W.G., H.L. and L.G. All authors have read and agreed to the published version of the manuscript.

Funding

This work was supported by grants from the National Natural Science Foundation of China (No. 82272739 and No. 82002854) and the Natural Science Foundation of Guangdong Province (Grant No. 2023A1515010229).

Institutional Review Board Statement

This study was performed in line with the principles of the Declaration of Helsinki. Approval was granted by the Ethics Committee of the Sun Yat-sen University Cancer Center (approved number: B2023-492-01; date of approval: 20 July 2023).

Informed Consent Statement

The informed consent has been waived.

Data Availability Statement

The datasets generated during and/or analysed during the current study are available from the corresponding author on reasonable request.

Conflicts of Interest

The authors declare no conflict of interest.

Abbreviations

De novo metastatic nasopharyngeal carcinoma (dmNPC), programmed death-1(PD-1), nutritional risk index (NRI), prognostic nutritional index (PNI), Epstein–Barr virus DNA (EBV DNA), systemic immune-inflammation index (SII), uric acid (UA), progression-free survival (PFS), overall survival (OS).

References

  1. Bray, F.; Ferlay, J.; Soerjomataram, I.; Siegel, R.L.; Torre, L.A.; Jemal, A. Global Cancer Statistics 2018: GLOBOCAN Estimates of Incidence and Mortality Worldwide for 36 Cancers in 185 Countries. CA Cancer J. Clin. 2018, 68, 394–424. [Google Scholar] [CrossRef] [PubMed]
  2. Qu, W.; Li, S.; Zhang, M.; Qiao, Q. Pattern and Prognosis of Distant Metastases in Nasopharyngeal Carcinoma: A Large-Population Retrospective Analysis. Cancer Med. 2020, 9, 6147–6158. [Google Scholar] [CrossRef] [PubMed]
  3. Yang, Y.; Qu, S.; Li, J.; Hu, C.; Xu, M.; Li, W.; Zhou, T.; Shen, L.; Wu, H.; Lang, J.; et al. Camrelizumab versus Placebo in Combination with Gemcitabine and Cisplatin as First-Line Treatment for Recurrent or Metastatic Nasopharyngeal Carcinoma (CAPTAIN-1st): A Multicentre, Randomised, Double-Blind, Phase 3 Trial. Lancet Oncol. 2021, 22, 1162–1174. [Google Scholar] [CrossRef] [PubMed]
  4. Alwarawrah, Y.; Kiernan, K.; MacIver, N.J. Changes in Nutritional Status Impact Immune Cell Metabolism and Function. Front. Immunol. 2018, 9, 1055. [Google Scholar] [CrossRef]
  5. Tu, X.; Ren, J.; Zhao, Y. Prognostic Value of Prognostic Nutritional Index in Nasopharyngeal Carcinoma: A Meta-Analysis Containing 4511 Patients. Oral. Oncol. 2020, 110, 104991. [Google Scholar] [CrossRef]
  6. Miao, J.; Xiao, W.; Wang, L.; Han, F.; Wu, H.; Deng, X.; Guo, X.; Zhao, C. The Value of the Prognostic Nutritional Index (PNI) in Predicting Outcomes and Guiding the Treatment Strategy of Nasopharyngeal Carcinoma (NPC) Patients Receiving Intensity-Modulated Radiotherapy (IMRT) with or without Chemotherapy. J. Cancer Res. Clin. Oncol. 2017, 143, 1263–1273. [Google Scholar] [CrossRef]
  7. Lu, H.; Guo, S.; Liu, L.; Chen, Q.; Liang, Y.; Liu, S.; Sun, X.; Tang, Q.; Li, X.; Guo, L.; et al. Prognostic Significance of a Combined and Controlled Nutritional Status Score and EBV-DNA in Patients with Advanced Nasopharyngeal Carcinoma: A Long-Term Follow-up Study. Cancer Biol. Med. 2021, 19, 551–564. [Google Scholar] [CrossRef]
  8. Jin, S.; Li, R.; Chen, M.-Y.; Yu, C.; Tang, L.-Q.; Liu, Y.-M.; Li, J.-P.; Liu, Y.-N.; Luo, Y.-L.; Zhao, Y.; et al. Single-Cell Transcriptomic Analysis Defines the Interplay between Tumor Cells, Viral Infection, and the Microenvironment in Nasopharyngeal Carcinoma. Cell Res. 2020, 30, 950–965. [Google Scholar] [CrossRef]
  9. Hu, B.; Yang, X.-R.; Xu, Y.; Sun, Y.-F.; Sun, C.; Guo, W.; Zhang, X.; Wang, W.-M.; Qiu, S.-J.; Zhou, J.; et al. Systemic Immune-Inflammation Index Predicts Prognosis of Patients after Curative Resection for Hepatocellular Carcinoma. Clin. Cancer Res. 2014, 20, 6212–6222. [Google Scholar] [CrossRef]
  10. Liu, D.; Czigany, Z.; Heij, L.R.; Bouwense, S.A.W.; van Dam, R.; Lang, S.A.; Ulmer, T.F.; Neumann, U.P.; Bednarsch, J. The Value of Platelet-to-Lymphocyte Ratio as a Prognostic Marker in Cholangiocarcinoma: A Systematic Review and Meta-Analysis. Cancers 2022, 14, 438. [Google Scholar] [CrossRef]
  11. Valero, C.; Lee, M.; Hoen, D.; Weiss, K.; Kelly, D.W.; Adusumilli, P.S.; Paik, P.K.; Plitas, G.; Ladanyi, M.; Postow, M.A.; et al. Pretreatment Neutrophil-to-Lymphocyte Ratio and Mutational Burden as Biomarkers of Tumor Response to Immune Checkpoint Inhibitors. Nat. Commun. 2021, 12, 729. [Google Scholar] [CrossRef]
  12. Chan, K.C.A.; Woo, J.K.S.; King, A.; Zee, B.C.Y.; Lam, W.K.J.; Chan, S.L.; Chu, S.W.I.; Mak, C.; Tse, I.O.L.; Leung, S.Y.M.; et al. Analysis of Plasma Epstein-Barr Virus DNA to Screen for Nasopharyngeal Cancer. N. Engl. J. Med. 2017, 377, 513–522. [Google Scholar] [CrossRef] [PubMed]
  13. Lo, Y.M.; Chan, A.T.; Chan, L.Y.; Leung, S.F.; Lam, C.W.; Huang, D.P.; Johnson, P.J. Molecular Prognostication of Nasopharyngeal Carcinoma by Quantitative Analysis of Circulating Epstein-Barr Virus DNA. Cancer Res. 2000, 60, 6878–6881. [Google Scholar] [PubMed]
  14. Lo, Y.M.; Chan, L.Y.; Chan, A.T.; Leung, S.F.; Lo, K.W.; Zhang, J.; Lee, J.C.; Hjelm, N.M.; Johnson, P.J.; Huang, D.P. Quantitative and Temporal Correlation between Circulating Cell-Free Epstein-Barr Virus DNA and Tumor Recurrence in Nasopharyngeal Carcinoma. Cancer Res. 1999, 59, 5452–5455. [Google Scholar] [PubMed]
  15. Xu, J.-Y.; Wei, X.-L.; Ren, C.; Zhang, Y.; Hu, Y.-F.; Li, J.-Y.; Chen, J.-L.; Wang, Y.-Q.; Han, F.; Wang, F.-H. Association of Plasma Epstein-Barr Virus DNA with Outcomes for Patients with Recurrent or Metastatic Nasopharyngeal Carcinoma Receiving Anti-Programmed Cell Death 1 Immunotherapy. JAMA Netw. Open 2022, 5, e220587. [Google Scholar] [CrossRef]
  16. Tang, L.-Q.; Li, C.-F.; Li, J.; Chen, W.-H.; Chen, Q.-Y.; Yuan, L.-X.; Lai, X.-P.; He, Y.; Xu, Y.-X.-X.; Hu, D.-P.; et al. Establishment and Validation of Prognostic Nomograms for Endemic Nasopharyngeal Carcinoma. J. Natl. Cancer Inst. 2016, 108, djv291. [Google Scholar] [CrossRef]
  17. Bouillanne, O.; Morineau, G.; Dupont, C.; Coulombel, I.; Vincent, J.-P.; Nicolis, I.; Benazeth, S.; Cynober, L.; Aussel, C. Geriatric Nutritional Risk Index: A New Index for Evaluating at-Risk Elderly Medical Patients. Am. J. Clin. Nutr. 2005, 82, 777–783. [Google Scholar] [CrossRef]
  18. Onodera, T.; Goseki, N.; Kosaki, G. Prognostic nutritional index in gastrointestinal surgery of malnourished cancer patients. Nihon Geka Gakkai Zasshi 1984, 85, 1001–1005. [Google Scholar]
  19. Ding, P.; Yang, P.; Sun, C.; Tian, Y.; Guo, H.; Liu, Y.; Li, Y.; Zhao, Q. Predictive Effect of Systemic Immune-Inflammation Index Combined with Prognostic Nutrition Index Score on Efficacy and Prognosis of Neoadjuvant Intraperitoneal and Systemic Paclitaxel Combined with Apatinib Conversion Therapy in Gastric Cancer Patients with Positive Peritoneal Lavage Cytology: A Prospective Study. Front. Oncol. 2021, 11, 791912. [Google Scholar] [CrossRef]
  20. Schietroma, M.; Romano, L.; Schiavi, D.; Pessia, B.; Mattei, A.; Fiasca, F.; Carlei, F.; Giuliani, A. Systemic Inflammation Response Index (SIRI) as Predictor of Anastomotic Leakage after Total Gastrectomy for Gastric Cancer. Surg. Oncol. 2022, 43, 101791. [Google Scholar] [CrossRef]
  21. Sun, Y.; Li, W.F.; Chen, N.Y.; Zhang, N.; Hu, G.Q.; Xie, F.Y.; Sun, Y.; Chen, X.Z.; Li, J.G.; Zhu, X.D.; et al. Induction chemotherapy plus concurrent chemoradiotherapy versus concurrent chemoradiotherapy alone in locoregionally advanced nasopharyngeal carcinoma: A phase 3, multicentre, randomised controlled trial. Lancet Oncol. 2016, 17, 1509–1520. [Google Scholar] [CrossRef]
  22. Yang, Y.; Zhou, T.; Chen, X.; Li, J.; Pan, J.; He, X.; Lin, L.; Shi, Y.-R.; Feng, W.; Xiong, J.; et al. Efficacy, Safety, and Biomarker Analysis of Camrelizumab in Previously Treated Recurrent or Metastatic Nasopharyngeal Carcinoma (CAPTAIN Study). J. Immunother. Cancer 2021, 9, e003790. [Google Scholar] [CrossRef] [PubMed]
  23. Wang, F.-H.; Wei, X.-L.; Feng, J.; Li, Q.; Xu, N.; Hu, X.-C.; Liao, W.; Jiang, Y.; Lin, X.-Y.; Zhang, Q.-Y.; et al. Efficacy, Safety, and Correlative Biomarkers of Toripalimab in Previously Treated Recurrent or Metastatic Nasopharyngeal Carcinoma: A Phase II Clinical Trial (POLARIS-02). J. Clin. Oncol. 2021, 39, 704–712. [Google Scholar] [CrossRef] [PubMed]
  24. Lu, S.; Wu, L.; Jian, H.; Chen, Y.; Wang, Q.; Fang, J.; Wang, Z.; Hu, Y.; Sun, M.; Han, L.; et al. Sintilimab plus Bevacizumab Biosimilar IBI305 and Chemotherapy for Patients with EGFR-Mutated Non-Squamous Non-Small-Cell Lung Cancer Who Progressed on EGFR Tyrosine-Kinase Inhibitor Therapy (ORIENT-31): First Interim Results from a Randomised, Double-Blind, Multicentre, Phase 3 Trial. Lancet Oncol. 2022, 23, 1167–1179. [Google Scholar] [CrossRef] [PubMed]
  25. Yang, Y.; Pan, J.; Wang, H.; Zhao, Y.; Qu, S.; Chen, N.; Chen, X.; Sun, Y.; He, X.; Hu, C.; et al. Tislelizumab plus Chemotherapy as First-Line Treatment for Recurrent or Metastatic Nasopharyngeal Cancer: A Multicenter Phase 3 Trial (RATIONALE-309). Cancer Cell 2023, 41, 1061–1072.e4. [Google Scholar] [CrossRef]
  26. Ma, B.B.Y.; Lim, W.-T.; Goh, B.-C.; Hui, E.P.; Lo, K.-W.; Pettinger, A.; Foster, N.R.; Riess, J.W.; Agulnik, M.; Chang, A.Y.C.; et al. Antitumor Activity of Nivolumab in Recurrent and Metastatic Nasopharyngeal Carcinoma: An International, Multicenter Study of the Mayo Clinic Phase 2 Consortium (NCI-9742). J. Clin. Oncol. 2018, 36, 1412–1418. [Google Scholar] [CrossRef]
  27. Ritchie, G.; Gasper, H.; Man, J.; Lord, S.; Marschner, I.; Friedlander, M.; Lee, C.K. Defining the Most Appropriate Primary End Point in Phase 2 Trials of Immune Checkpoint Inhibitors for Advanced Solid Cancers: A Systematic Review and Meta-Analysis. JAMA Oncol. 2018, 4, 522–528. [Google Scholar] [CrossRef]
  28. Wong, K.C.W.; Hui, E.P.; Lo, K.-W.; Lam, W.K.J.; Johnson, D.; Li, L.; Tao, Q.; Chan, K.C.A.; To, K.-F.; King, A.D.; et al. Nasopharyngeal Carcinoma: An Evolving Paradigm. Nat. Rev. Clin. Oncol. 2021, 18, 679–695. [Google Scholar] [CrossRef]
  29. Huang, Z.-L.; Liu, S.; Wang, G.-N.; Zheng, S.-H.; Ding, S.-R.; Tao, Y.-L.; Chen, C.; Liu, S.-R.; Yang, X.; Chang, H.; et al. The Prognostic Significance of PD-L1 and PD-1 Expression in Patients with Nasopharyngeal Carcinoma: A Systematic Review and Meta-Analysis. Cancer Cell Int. 2019, 19, 141. [Google Scholar] [CrossRef]
  30. Caudell, J.J.; Gillison, M.L.; Maghami, E.; Spencer, S.; Pfister, D.G.; Adkins, D.; Birkeland, A.C.; Brizel, D.M.; Busse, P.M.; Cmelak, A.J.; et al. NCCN Guidelines® Insights: Head and Neck Cancers, Version 1.2022. J. Natl. Compr. Cancer Netw. 2022, 20, 224–234. [Google Scholar] [CrossRef]
  31. Prawira, A.; Oosting, S.F.; Chen, T.W.; Delos Santos, K.A.; Saluja, R.; Wang, L.; Siu, L.L.; Chan, K.K.W.; Hansen, A.R. Systemic Therapies for Recurrent or Metastatic Nasopharyngeal Carcinoma: A Systematic Review. Br. J. Cancer 2017, 117, 1743–1752. [Google Scholar] [CrossRef]
  32. Barao, K.; Abe Vicente Cavagnari, M.; Silva Fucuta, P.; Manoukian Forones, N. Association Between Nutrition Status and Survival in Elderly Patients with Colorectal Cancer. Nutr. Clin. Pract. 2017, 32, 658–663. [Google Scholar] [CrossRef] [PubMed]
  33. Zeng, Q.; Shen, L.-J.; Guo, X.; Guo, X.-M.; Qian, C.-N.; Wu, P.-H. Critical Weight Loss Predicts Poor Prognosis in Nasopharyngeal Carcinoma. BMC Cancer 2016, 16, 169. [Google Scholar] [CrossRef] [PubMed]
  34. Rothman, K.J. BMI-Related Errors in the Measurement of Obesity. Int. J. Obes. 2008, 32 (Suppl 3), S56–S59. [Google Scholar] [CrossRef]
  35. Tang, Q.-N.; Qiu, H.-Z.; Sun, X.-Q.; Guo, S.-S.; Liu, L.-T.; Wen, Y.-F.; Liu, S.-L.; Xie, H.-J.; Liang, Y.-J.; Sun, X.-S.; et al. Geriatric Nutritional Risk Index as an Independent Prognostic Factor in Locally Advanced Nasopharyngeal Carcinoma Treated Using Radical Concurrent Chemoradiotherapy: A Retrospective Cohort Study. Ann. Transl. Med. 2021, 9, 532. [Google Scholar] [CrossRef] [PubMed]
  36. Huemer, F.; Lang, D.; Westphal, T.; Gampenrieder, S.P.; Hutarew, G.; Weiss, L.; Hackl, H.; Lamprecht, B.; Rinnerthaler, G.; Greil, R. Baseline Absolute Lymphocyte Count and ECOG Performance Score Are Associated with Survival in Advanced Non-Small Cell Lung Cancer Undergoing PD-1/PD-L1 Blockade. J. Clin. Med. 2019, 8, 1014. [Google Scholar] [CrossRef]
  37. Ikeya, T.; Shibutani, M.; Maeda, K.; Sugano, K.; Nagahara, H.; Ohtani, H.; Hirakawa, K. Maintenance of the nutritional prognostic index predicts survival in patients with unresectable meta static colorectal cancer. J. Cancer Res. Clin. Oncol. 2015, 141, 307–313. [Google Scholar] [CrossRef]
  38. Schetter, A.J.; Heegaard, N.H.H.; Harris, C.C. Inflammation and Cancer: Interweaving microRNA, Free Radical, Cytokine and P53 Pathways. Carcinogenesis 2010, 31, 37–49. [Google Scholar] [CrossRef] [PubMed]
  39. Kusumanto, Y.H.; Dam, W.A.; Hospers, G.A.P.; Meijer, C.; Mulder, N.H. Platelets and Granulocytes, in Particular the Neutrophils, Form Important Compartments for Circulating Vascular Endothelial Growth Factor. Angiogenesis 2003, 6, 283–287. [Google Scholar] [CrossRef]
  40. Marra, P.; Mathew, S.; Grigoriadis, A.; Wu, Y.; Kyle-Cezar, F.; Watkins, J.; Rashid, M.; De Rinaldis, E.; Hessey, S.; Gazinska, P.; et al. IL15RA Drives Antagonistic Mechanisms of Cancer Development and Immune Control in Lymphocyte-Enriched Triple-Negative Breast Cancers. Cancer Res. 2014, 74, 4908–4921. [Google Scholar] [CrossRef]
  41. Labelle, M.; Begum, S.; Hynes, R.O. Direct Signaling between Platelets and Cancer Cells Induces an Epithelial-Mesenchymal-like Transition and Promotes Metastasis. Cancer Cell 2011, 20, 576–590. [Google Scholar] [CrossRef] [PubMed]
  42. Hui, E.P.; Li, W.F.; Ma, B.B.; Lam, W.K.J.; Chan, K.C.A.; Mo, F.; Ai, Q.Y.H.; King, A.D.; Wong, C.H.; Guo, R.; et al. Integrating Postradiotherapy Plasma Epstein-Barr Virus DNA and TNM Stage for Risk Stratification of Nasopharyngeal Carcinoma to Adjuvant Therapy. Ann. Oncol. 2020, 31, 769–779. [Google Scholar] [CrossRef] [PubMed]
  43. Du, X.-J.; Chen, L.; Li, W.-F.; Tang, L.-L.; Mao, Y.-P.; Guo, R.; Sun, Y.; Lin, A.-H.; Ma, J. Use of Pretreatment Serum Uric Acid Level to Predict Metastasis in Locally Advanced Nasopharyngeal Carcinoma. Head. Neck 2017, 39, 492–497. [Google Scholar] [CrossRef] [PubMed]
  44. Fini, M.A.; Elias, A.; Johnson, R.J.; Wright, R.M. Contribution of Uric Acid to Cancer Risk, Recurrence, and Mortality. Clin. Transl. Med. 2012, 1, 16. [Google Scholar] [CrossRef]
  45. Dhankhar, R.; Dahiya, K.; Sharma, T.K.; Ghalaut, V.S.; Atri, R.; Kaushal, V. Diagnostic Significance of Adenosine Deaminase, Uric Acid and C-Reactive Protein Levels in Patients of Head and Neck Carcinoma. Clin. Lab. 2011, 57, 795–798. [Google Scholar]
Figure 1. Nomogram (A) established based on nutritional indexes, inflammatory parameter, and post-treatment EBV DNA level for predicting 1-year and 18-month PFS in patients with dmNPC undergoing chemotherapy combination PD-1 inhibitor. Each variable was assigned a score based on its contribution to the outcome event. The total points for each patient can be calculated by summing the allocated scores for each factor in the nomogram. A higher total score was associated with a poorer prognosis. The calibration curves in the training cohort ((B,D), respectively) and validation ((C,E), respectively) cohorts. Abbreviations: NRI = nutritional risk index; PNI = prognostic nutritional index; SII = systemic immune-inflammation index; EBV DNA = Epstein–Barr virus DNA; UA = uric acid; PFS = progression-free survival.
Nutrients 15 04262 g001
Figure 2. Decision curves analyses of the established nomogram predicting progression-free survival (PFS) at 1 year and 18 months in the training (A) and validation (B) cohort.
Nutrients 15 04262 g002
Figure 3. The predictive accuracy of the established nomogram against other traditional baseline factors for 1-year and 18-month PFS in the training ((A,C), respectively) and validation ((B,D), respectively) cohorts. Abbreviations: EBV DNA = Epstein–Barr virus DNA; PFS = progression-free survival.
Nutrients 15 04262 g003
Figure 4. The predictive accuracy of the established nomogram against other constituent factors for 1-year and 18-month progression-free survival (PFS) in the training ((A,C), respectively) and validation ((B,D), respectively) cohorts.
Nutrients 15 04262 g004
Figure 5. Survival curves of the favorable- and unfavorable-prognosis groups stratified by the nomogram for progression-free survival (A) and overall survival (B) in the whole cohort. Log-tank test was used to calculate the p-value.
Nutrients 15 04262 g005
Figure 6. The distribution of ORR (A) and DCR (B) for the favorable- and unfavorable-prognosis groups in the whole cohort, training cohort, and validation cohort. Chi-square tests were performed to compare the distribution between different prognosis groups. Abbreviations: ORR = objective response rate; DCR = disease control rate; CR = complete response; PR = partial response; SD = stable disease; PD = progressive disease; DC = disease control.
Nutrients 15 04262 g006
Table 1. Patient demographics and clinical characteristics of the whole cohort *.
CharacteristicTraining Cohort (n = 88)
No. (%)
Validation Cohort (n = 43)
No. (%)
p Value
Sex 0.842
Female15 (17%)6 (14%)
Male73 (83%)37 (86%)
Smoking 0.362
No57 (64.8%)32 (74.4%)
Yes31 (35.2%)11 (25.6%)
Drinking 0.480
No72 (81.8%)38 (88.4%)
Yes16 (18.2%)5 (11.6%)
Family history 0.394
No85 (96.6%)40 (93%)
Yes3 (3.4%)3 (7%)
Age45.85 ± 11.1447.63 ± 11.500.404
Height (cm)165.85 ± 6.17164.17 ± 8.090.233
Weight (kg)63.30 ± 10.5061.49 ± 11.580.174
a Tumor stage 0.487
T13 (3.4%)0 (0%)
T24 (4.5%)2 (4.7%)
T345 (51.1%)19 (44.2%)
T436 (40.9%)22 (51.2%)
a Node stage 0.488
N18 (9.1%)6 (14.0%)
N228 (31.8%)10 (23.3%)
N352 (59.1%)27 (62.8%)
Pretreatment EBV DNA, copies/mL 0.527
<476042 (47.7%)18 (41.9%)
≥476046 (52.3%)25 (58.1%)
Post-treatment EBV DNA, copies/mL 0.821
<99.5050 (62.5%)24 (58.5%)
≥99.5030 (37.5%)17 (41.5%)
Liver metastasis 0.472
No50 (56.8%)28 (65.1%)
Yes38 (43.2%)15 (34.9%)
Bone metastasis 0.952
No25 (28.4%)12 (27.9%)
Yes63 (71.6%)31 (72.1%)
Lung metastasis 0.799
No60 (68.2%)31 (72.1%)
Yes28 (31.8%)12 (27.9%)
Distance LN metastasis 0.939
No64 (72.7%)31 (72.1%)
Yes24 (27.3%)12 (27.9%)
No of metastatic sites 0.333
142 (47.7%)26 (60.5%)
2–341 (46.6%)16 (37.2%)
≥45 (5.7%)1 (2.3%)
Chemotherapy combination PD-1 inhibitor lines 0.363
166 (75.0%)29 (67.4%)
≥222 (25.0%)14 (32.6%)
Response 0.233
CR2 (2.3%)0 (0%)
PR66 (75.0%)28 (65.1%)
SD7 (8.0%)8 (18.6%)
PD13 (14.8%)7 (16.3%)
Anti-PD-1 agent 0.651
Camrelizumab27 (30.7%)14 (32.6%)
Toripalimab44 (50.0%)18 (41.9%)
Sintilimab7 (8.0%)7 (16.3%)
Tislelizumab8 (9.1%)3 (7.0%)
Nivolumab2 (2.3%)1 (2.3%)
Chemotherapy regimens 0.470
GP60 (68.2%)23 (53.5%)
PF3 (3.4%)3 (7.0%)
TP10 (11.4%)6 (14.0%)
Capecitabine4 (4.6%)4 (9.3%)
TPF1 (1.1%)2 (4.7%)
Others10 (11.4%)5 (11.6%)
BMI (kg/m2) 0.816
<19.1911 (12.5%)6 (14%)
≥19.1977 (87.5%)37 (86%)
NRI 0.876
<108.0858 (65.9%)27 (62.8%)
≥108.0830 (34.1%)16 (37.2%)
PNI 0.223
<49.2040 (45.5%)14 (32.6%)
≥49.2048 (54.5%)29 (67.4%)
SII 0.754
<521.3220 (22.7%)8 (18.6%)
≥521.3268 (77.3%)35 (81.4%)
SIRI 0.447
<2.4274 (84.1%)39 (90.7%)
≥2.4214 (15.9%)4 (9.3%)
GPS
058 (65.9%)34 (79.1%)
1–230 (34.1%)9 (20.9%)
CONUT score
0–150 (56.8%)25 (58.1%)
2–638 (43.2%)18 (41.9%)
NLR 0.608
<3.2458 (65.9%)31 (72.1%)
≥3.2430 (34.1%)12 (27.9%)
LAR 0.359
<3.7415 (17%)11 (25.6%)
≥3.7473 (83%)32 (74.4%)
LMR 0.443
<2.8721 (23.9%)7 (16.3%)
≥2.8767 (76.1%)36 (83.7%)
PLR 0.999
<123.022 (25%)10 (23.3%)
≥123.066 (75%)33 (76.7%)
WBC (109/L) 0.652
<9.1872 (81.8%)33 (76.7%)
≥9.1816 (18.2%)10 (23.3%)
Neutrophil (109/L) 0.390
<7.2678 (88.6%)35 (81.4%)
≥7.2610 (11.4%)8 (18.6%)
Lymphocyte (109/L) 0.727
<2.0353 (60.2%)28 (65.1%)
≥2.0335 (39.8%)15 (34.9%)
Monocyte (109/L) 0.987
<0.5561 (69.3%)29 (67.4%)
≥0.5527 (30.7%)14 (32.6%)
RBC (1012/L) 0.987
<4.4918 (20.5%)8 (18.6%)
≥4.4970 (79.5%)35 (81.4%)
PLT (109/L) 0.340
<374.075 (85.2%)33 (76.7%)
≥374.013 (14.8%)10 (23.3%)
HGB (g/L) 0.421
<145.047 (53.4%)19 (44.2%)
≥145.041 (46.6%)24 (55.8%)
ALP (U/L) 0.074
<94.1073 (83%)29 (67.4%)
≥94.1015 (17%)14 (32.6%)
GGT (U/L) 0.356
<32.8054 (61.4%)22 (51.2%)
≥32.8034 (38.6%)21 (48.8%)
LDH (U/L) 0.231
<163.3010 (11.4%)9 (20.9%)
≥163.3078 (88.6%)34 (79.1%)
UA (μmol/L) 0.825
<266.9013 (14.8%)5 (11.6%)
≥266.9075 (85.2%)38 (88.4%)
GLU (mmol/L) 0.921
<4.9734 (38.6%)17 (39.5%)
≥4.9754 (61.4%)26 (60.5%)
CRP (mg/L) 0.772
<27.077 (87.5%)39 (90.7%)
≥27.011 (12.5%)4 (9.3%)
CK (U/L) 0.822
<47.013 (14.8%)7 (16.3%)
≥47.075 (85.2%)36 (83.7%)
SAA (mg/L) 0.444
<19.3056 (63.6%)31 (72.1%)
≥19.3032 (36.4%)12 (27.9%)
* p-value was conducted with the chi-square test (categorical variables) and Mann–Whitney U test (continuous variables), respectively. Abbreviations: EBV DNA, Epstein–Barr virus DNA; LN, lymph nodes; PD-1, programmed death-1; CR, complete response; PR, partial response; SD, stable disease; PD, progressive disease; BMI, body mass index; NRI, nutritional risk index; PNI, prognostic nutritional index; SII, systemic immune-inflammation index; SIRI, systemic inflammatory response index; GPS, Glasgow prognostic score; CONUT, controlling nutritional status; NLR, neutrophil-to-lymphocyte ratio; LAR, lactate dehydrogenase-to-albumin ratio; LMR, lymphocyte-to-monocyte ratio; PLR, platelet-to-lymphocyte ratio; WBC, white blood cell; RBC, red blood cell; HGB, hemoglobin; ALP, alkaline phosphatase; GGT, gamma-glutamyl transferase; LDH, lactate dehydrogenase; UA, uric acid; GLU, glucose; CRP, C-reactive protein; CK, creatine kinase; SAA, serum amyloid A. a According to the eighth edition of UICC/AJCC staging system.
Table 2. Univariate and multivariable analysis of the training cohort *.
VariablesUnivariate
HR (95%CI)
p ValueMultivariate
HR (95%CI)
p Value
Sex 0.555
FemaleReference
Male1.254 (0.592, 2.654)
Smoking 0.942
NoReference
Yes1.020 (0.593, 1.755)
Drinking 0.247
NoReference
Yes1.451 (0.773, 2.722)
Family history 0.665
NoReference
Yes1.369 (0.330, 5.675)
Age1.011 (0.987, 1.036)0.369
a Tumor stage 0.620
T1Reference
T21.501 (0.136, 16.601)0.740
T32.704 (0.368, 19.878)0.328
T42.888 (0.389, 21.413)0.300
a Node stage 0.543
N1Reference
N21.808 (0.618, 5.296)0.280
N31.747 (0.616, 4.954)0.294
Pretreatment EBV DNA, copies/mL 0.128
<4760Reference
≥47601.516 (0.887, 2.592)
Post-treatment EBV DNA, copies/mL <0.001 0.003
<99.50Reference Reference
≥99.500.387 (0.253, 0.592) 3.109 (1.502, 6.437)
Liver metastasis 0.420
NoReference
Yes1.243 (0.733, 2.106)
Bone metastasis 0.181
NoReference
Yes1.534 (0.820, 2.871)
Lung metastasis 0.342
NoReference
Yes0.750 (0.415, 1.356)
Distance LN metastasis 0.146
NoReference
Yes1.535 (0.861, 2.736)
No of metastatic sites 0.175
1Reference
2–32.200 (0.871, 5.559)0.096
≥42.884 (0.833, 9.987)0.095
Chemotherapy combination PD-1 inhibitor lines 0.395
1Reference
≥21.339 (0.683, 2.626)
Response <0.001 0.791
CRReference Reference
PR2.325 (0.318, 17.004)0.4062.159 (0.242, 19.237)0.490
SD2.489 (0.253, 24.469)0.4341.651 (0.125, 21.738)0.703
PD17.029 (2.108, 137.588)0.0081.558 (0.139, 17.476)0.719
Anti-PD-1 agent 0.923
CamrelizumabReference
Toripalimab0.958 (0.530, 1.733)0.888
Sintilimab0.704 (2.108, 137.588)0.574
Tislelizumab17.029 (2.108, 137.588)0.682
Nivolumab17.029 (2.108, 137.588)0.573
Chemotherapy regimens 0.005 0.197
GPReference Reference
PF0.290 (0.040, 2.134)0.2240.100 (0.012, 0.805)0.030
TP0.742 (0.265, 2.081)0.5710.526 (0.172, 1.603)0.258
Capecitabine0.816 (0.195, 3.411)0.7800.954 (0.168, 5.434)0.958
TPF13.237 (1.608, 108.983)0.0160 (0, -)0.983
Others3.121 (1.467, 6.637)0.0030.427 (0.147, 1.242)0.118
BMI (kg/m2) 0.064 0.291
<19.19Reference Reference
≥19.190.507 (0.248, 1.040) 1.849 (0.590, 5.791)
NRI <0.001 <0.001
<108.08Reference Reference
≥108.080.201 (0.104, 0.389) 0.176 (0.066, 0.464)
PNI <0.001 <0.001
<49.20Reference Reference
≥49.200.092 (0.047, 0.180) 0.096 (0.030, 0.309)
SII 0.054 0.177
<521.32Reference Reference
≥521.322.088 (0.987, 4.418) 1.990 (0.732, 5.413)
SIRI 0.583
<2.42Reference
≥2.420.810 (0.383, 1.717)
GPS 0.875
0Reference
1–20.958 (0.563, 1.631)
CONUT score 0.222
0–1Reference
2–61.130 (0.928, 1.376)
NLR 0.130
<3.24Reference
≥3.241.824 (1.058, 3.143)
LAR 0.289
<3.74Reference
≥3.741.536 (0.695, 3.395)
LMR 0.276
<2.87Reference
≥2.871.444 (0.746, 2.794)
PLR 0.088 0.754
<123.0Reference Reference
≥123.01.815 (0.915, 3.601) 1.154 (0.472, 2.821)
WBC (109/L) 0.093 0.199
<9.18Reference Reference
≥9.180.506 (0.228, 1.120) 0.439 (0.125, 1.542)
Neutrophil (109/L) 0.559
<7.26Reference
≥7.260.759 (0.301, 1.913)
Lymphocyte (109/L) 0.168
<2.03Reference
≥2.030.682 (0.396, 1.175)
Monocyte (109/L) 0.297
<0.55Reference
≥0.550.734 (0.411, 1.312)
RBC (1012/L) 0.143
<4.49Reference
≥4.490.604 (0.308, 1.186)
PLT (109/L) 0.386
<374.0Reference
≥374.00.703 (0.317, 1.558)
HGB (g/L) 0.639
<145.0Reference
≥145.00.882 (0.521, 1.492)
ALP (U/L) 0.282
<94.10Reference
≥94.100.662 (0.312, 1.404)
GGT (U/L) 0.911
<32.80Reference
≥32.800.970 (0.568, 1.655)
LDH (U/L) 0.530
<163.30Reference
≥163.301.344 (0.534, 3.382)
UA (μmol/L) 0.077 0.008
<266.90Reference Reference
≥266.902.513 (0.906, 6.969) 5.026 (1.532, 16.497)
GLU (mmol/L) 0.007 0.393
<4.97Reference Reference
≥4.970.479 (0.279, 0.821) 0.763 (0.411, 1.419)
CRP (mg/L) 0.587
<27.0Reference
≥27.00.791 (0.339, 1.846)
CK (U/L) 0.373
<47.0Reference
≥47.01.435 (0.649, 3.177)
SAA (mg/L) 0.380
<19.30Reference
≥19.300.780 (0.448, 1.358)
* Hazard ratios estimated by Cox proportional hazard model. All variables were transformed into categorical variables. Abbreviations: HR, hazard ratio; CI, confidence interval; EBV DNA, Epstein–Barr virus DNA; LN, lymph nodes; PD-1, programmed death-1; CR, complete response; PR, partial response; SD, stable disease; PD, progressive disease; BMI, body mass index; NRI, nutritional risk index; PNI, prognostic nutritional index; SII, systemic immune-inflammation index; SIRI, systemic inflammatory response index; GPS, Glasgow prognostic score; CONUT, controlling nutritional status; NLR, neutrophil-to-lymphocyte ratio; LAR, lactate dehydrogenase-to-albumin ratio; LMR, lymphocyte-to-monocyte ratio; PLR, platelet-to-lymphocyte ratio; WBC, white blood cell; RBC, red blood cell; HGB, hemoglobin; ALP, alkaline phosphatase; GGT, gamma-glutamyl transferase; LDH, lactate dehydrogenase; UA, uric acid; GLU, glucose; CRP, C-reactive protein; CK, creatine kinase; SAA, serum amyloid A. a According to the eighth edition of UICC/AJCC staging system.
Table 3. Comparison of the survival of patients in different prognosis groups *.
VariablePFS (Month)OS (Month)
Median (95% CI)pMedian (95% CI)p
Favorable- prognosis35.10 (27.36, 42.84)0.001- (-,-)<0.001
Unfavorable- prognosis7.23 (6.50, 7.97)33.73 (36.73, 40.73)
* p-value estimated by log-rank test. All statistical tests were two-sided. Abbreviations: CI, confidence interval; PFS, progression-free survival; OS, overall survival.
Disclaimer/Publisher’s Note: The statements, opinions and data contained in all publications are solely those of the individual author(s) and contributor(s) and not of MDPI and/or the editor(s). MDPI and/or the editor(s) disclaim responsibility for any injury to people or property resulting from any ideas, methods, instructions or products referred to in the content.

