
Intakes of Added Sugars, with a Focus on Beverages and the Associations with Nutrient Adequacy in US Adults (NHANES 2003–2018)

 , , , and
Abstract
:1. Introduction
2. Materials and Methods
2.1. Data
2.2. Added Sugars Intake
2.3. Added Sugars Intake and Nutrient Adequacy
2.4. Statistical Analyses
3. Results
3.1. Demographics
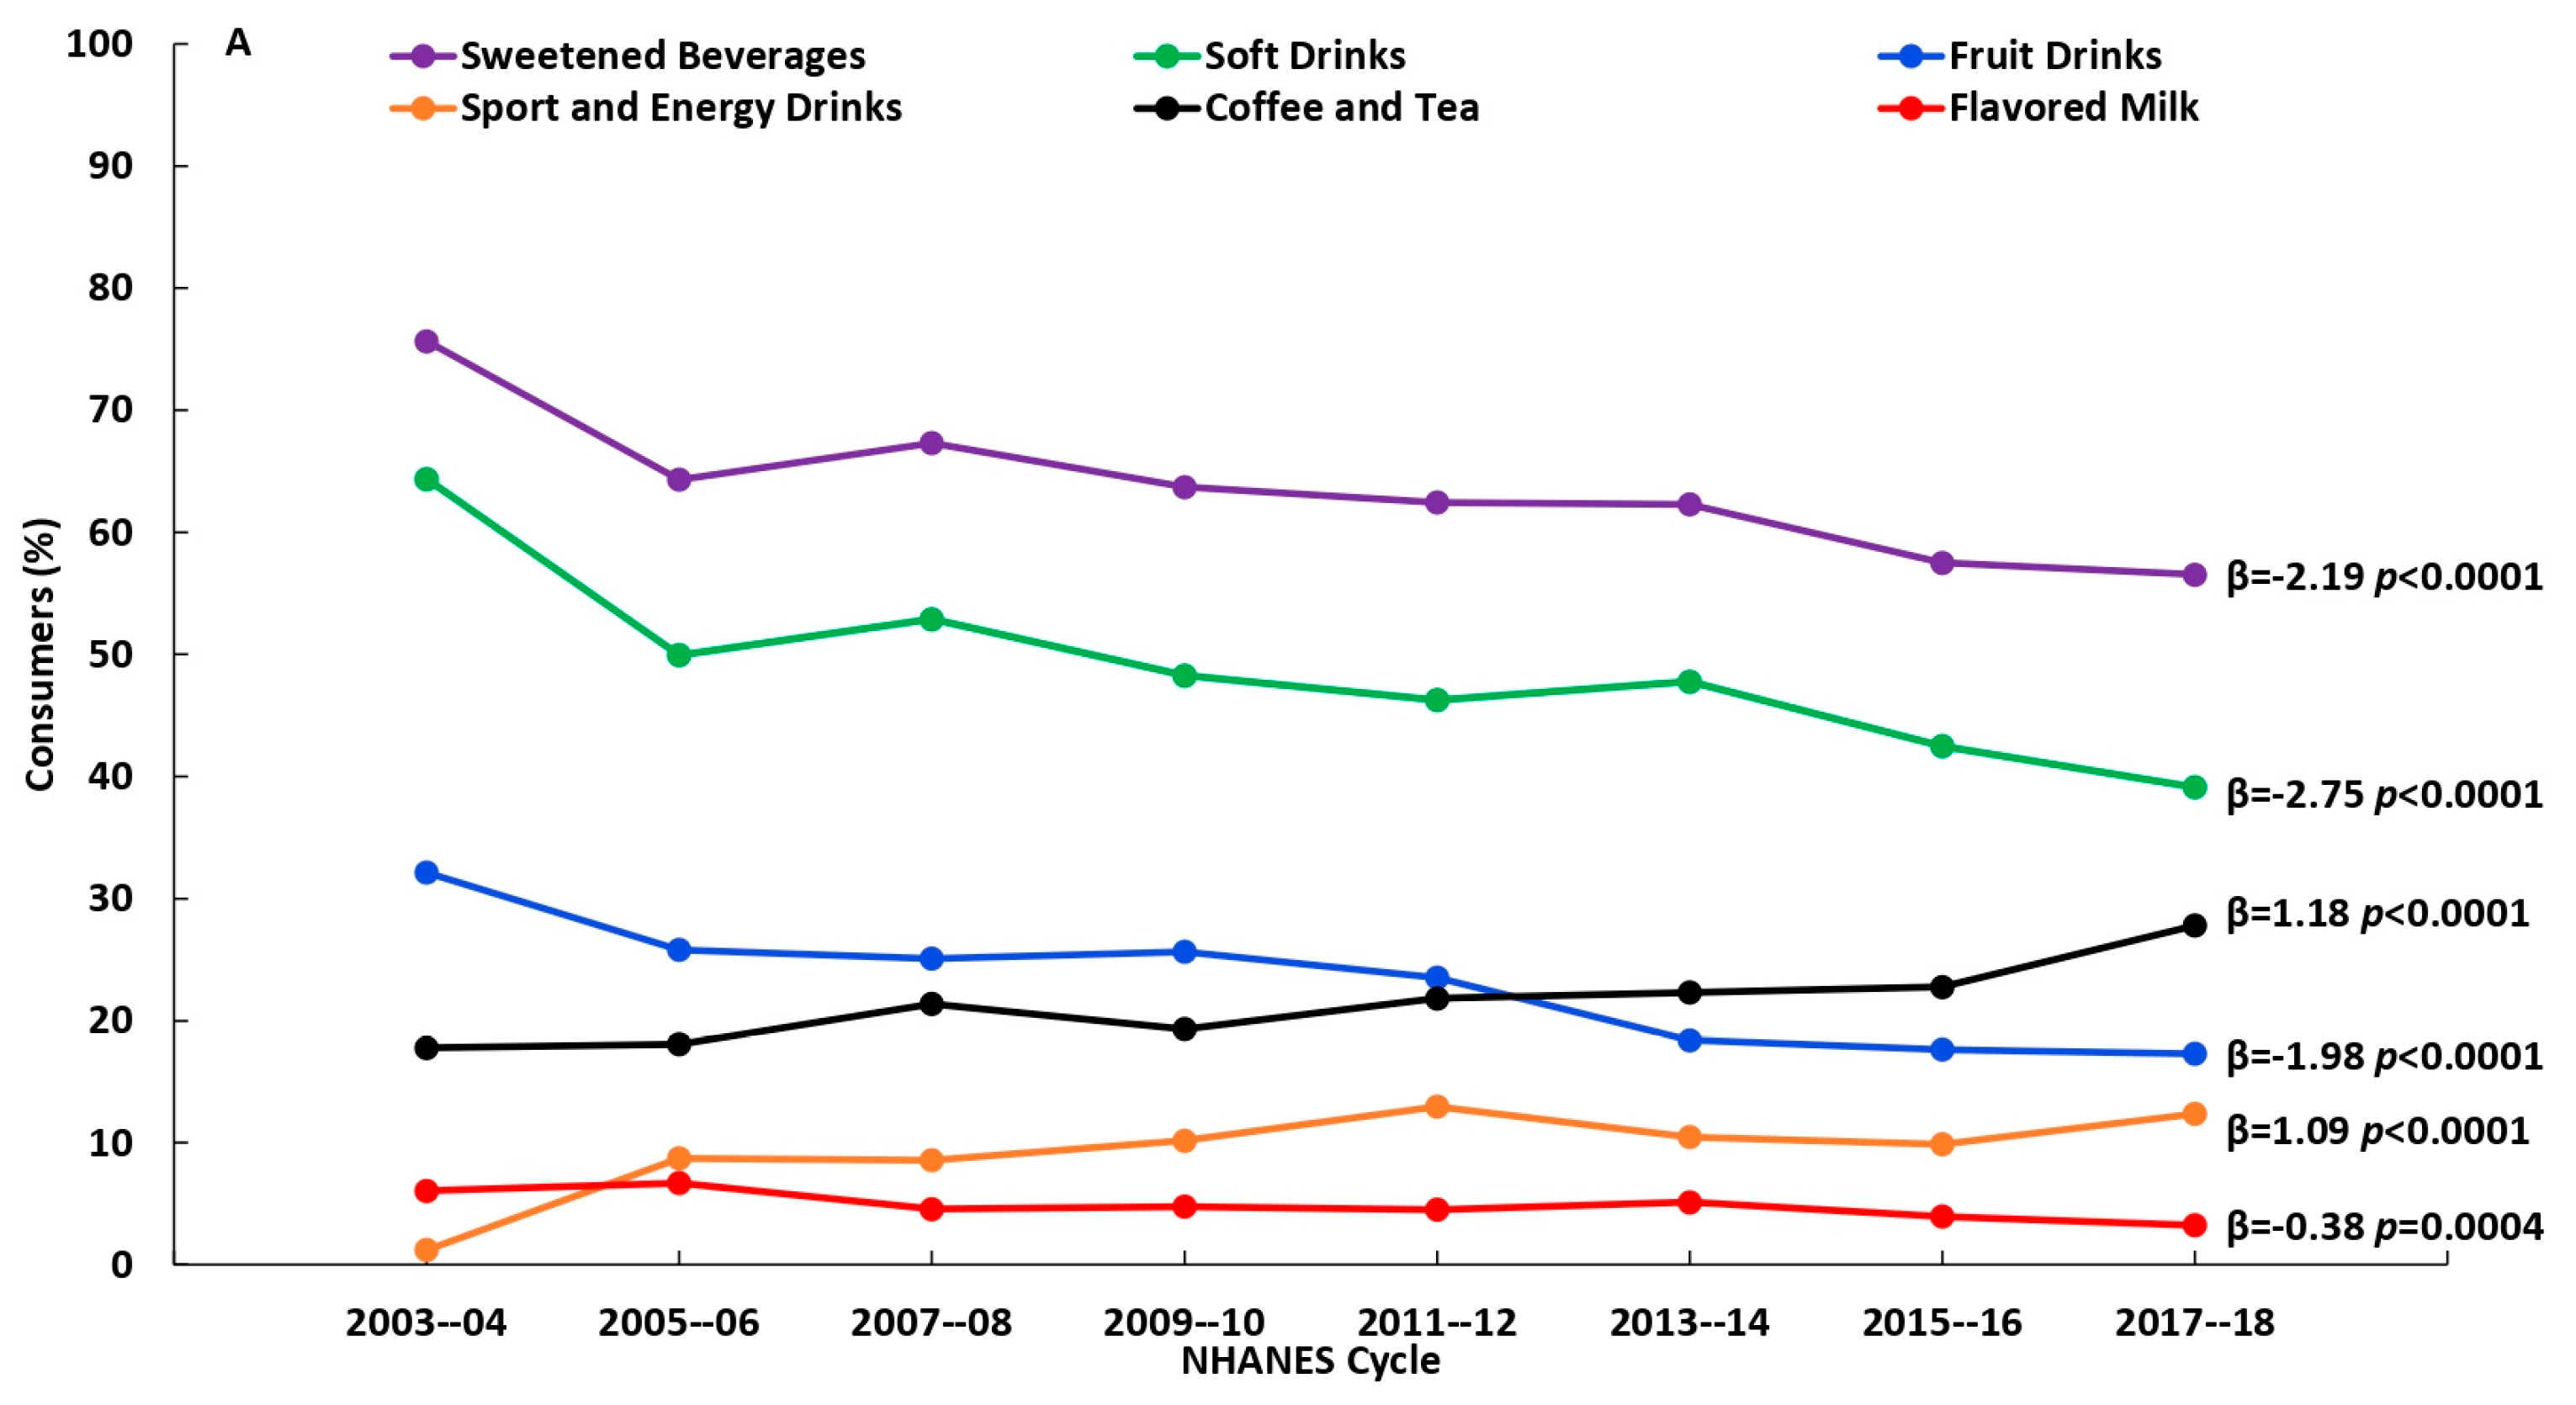
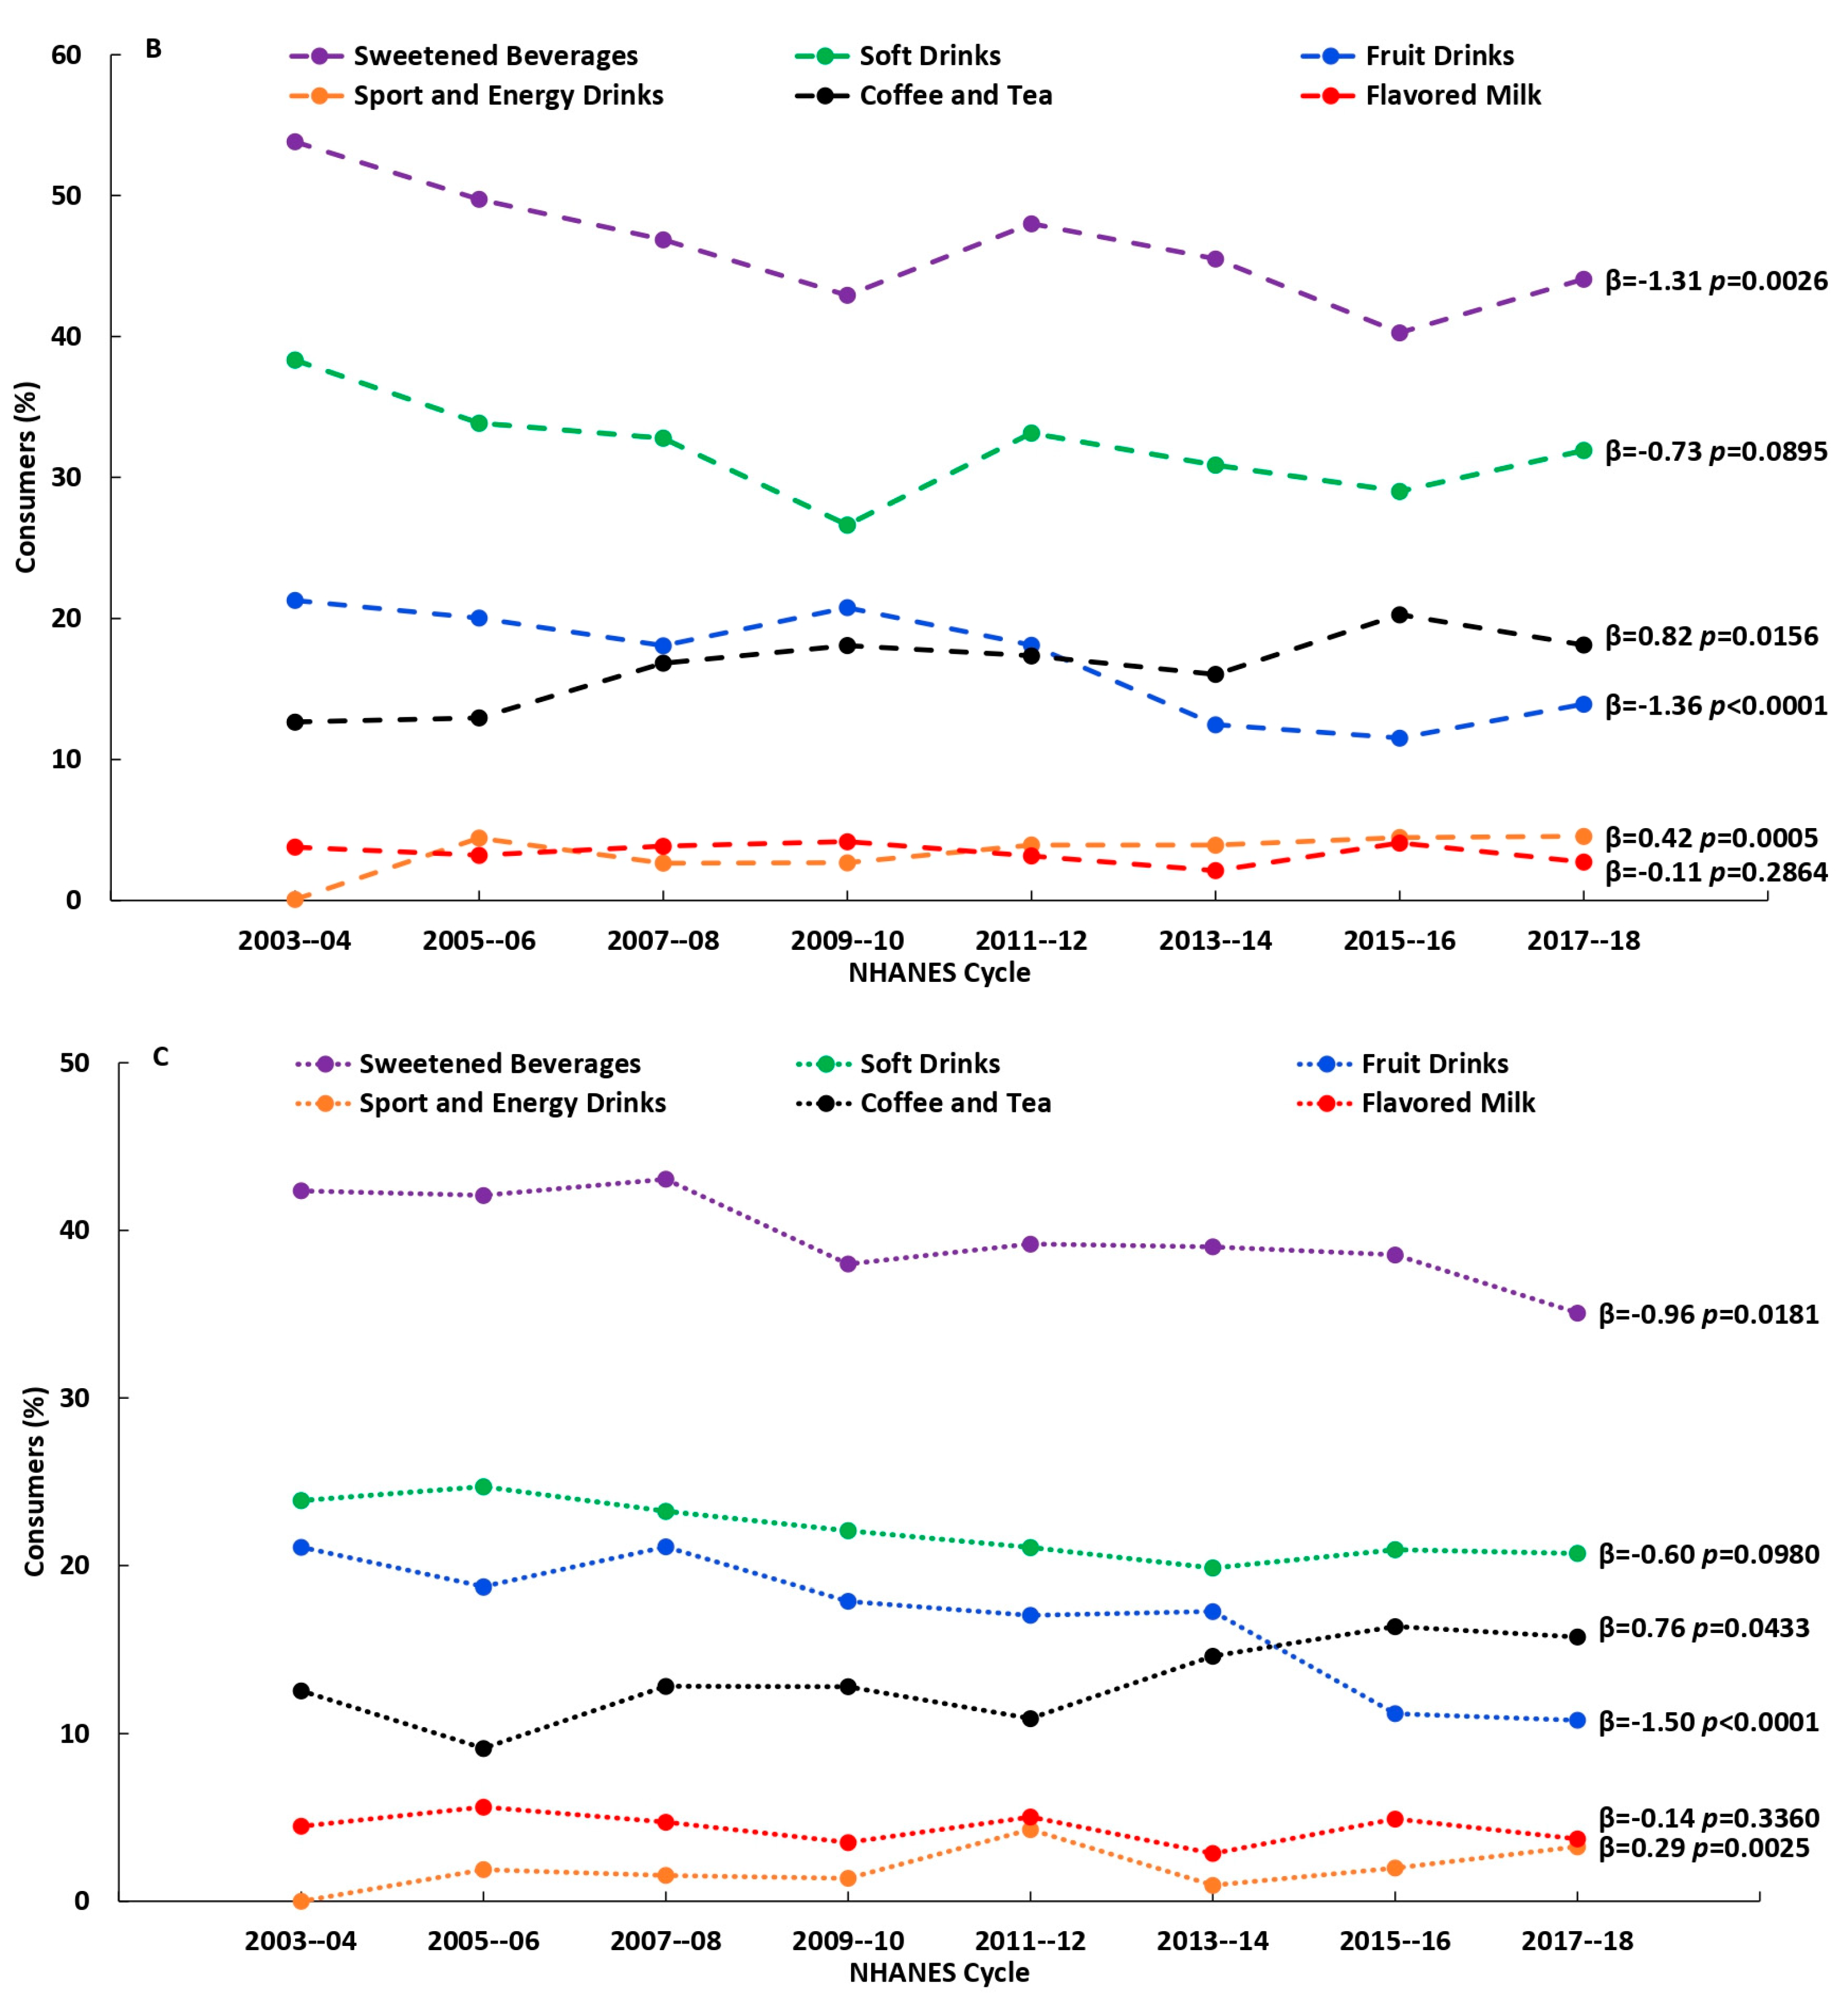
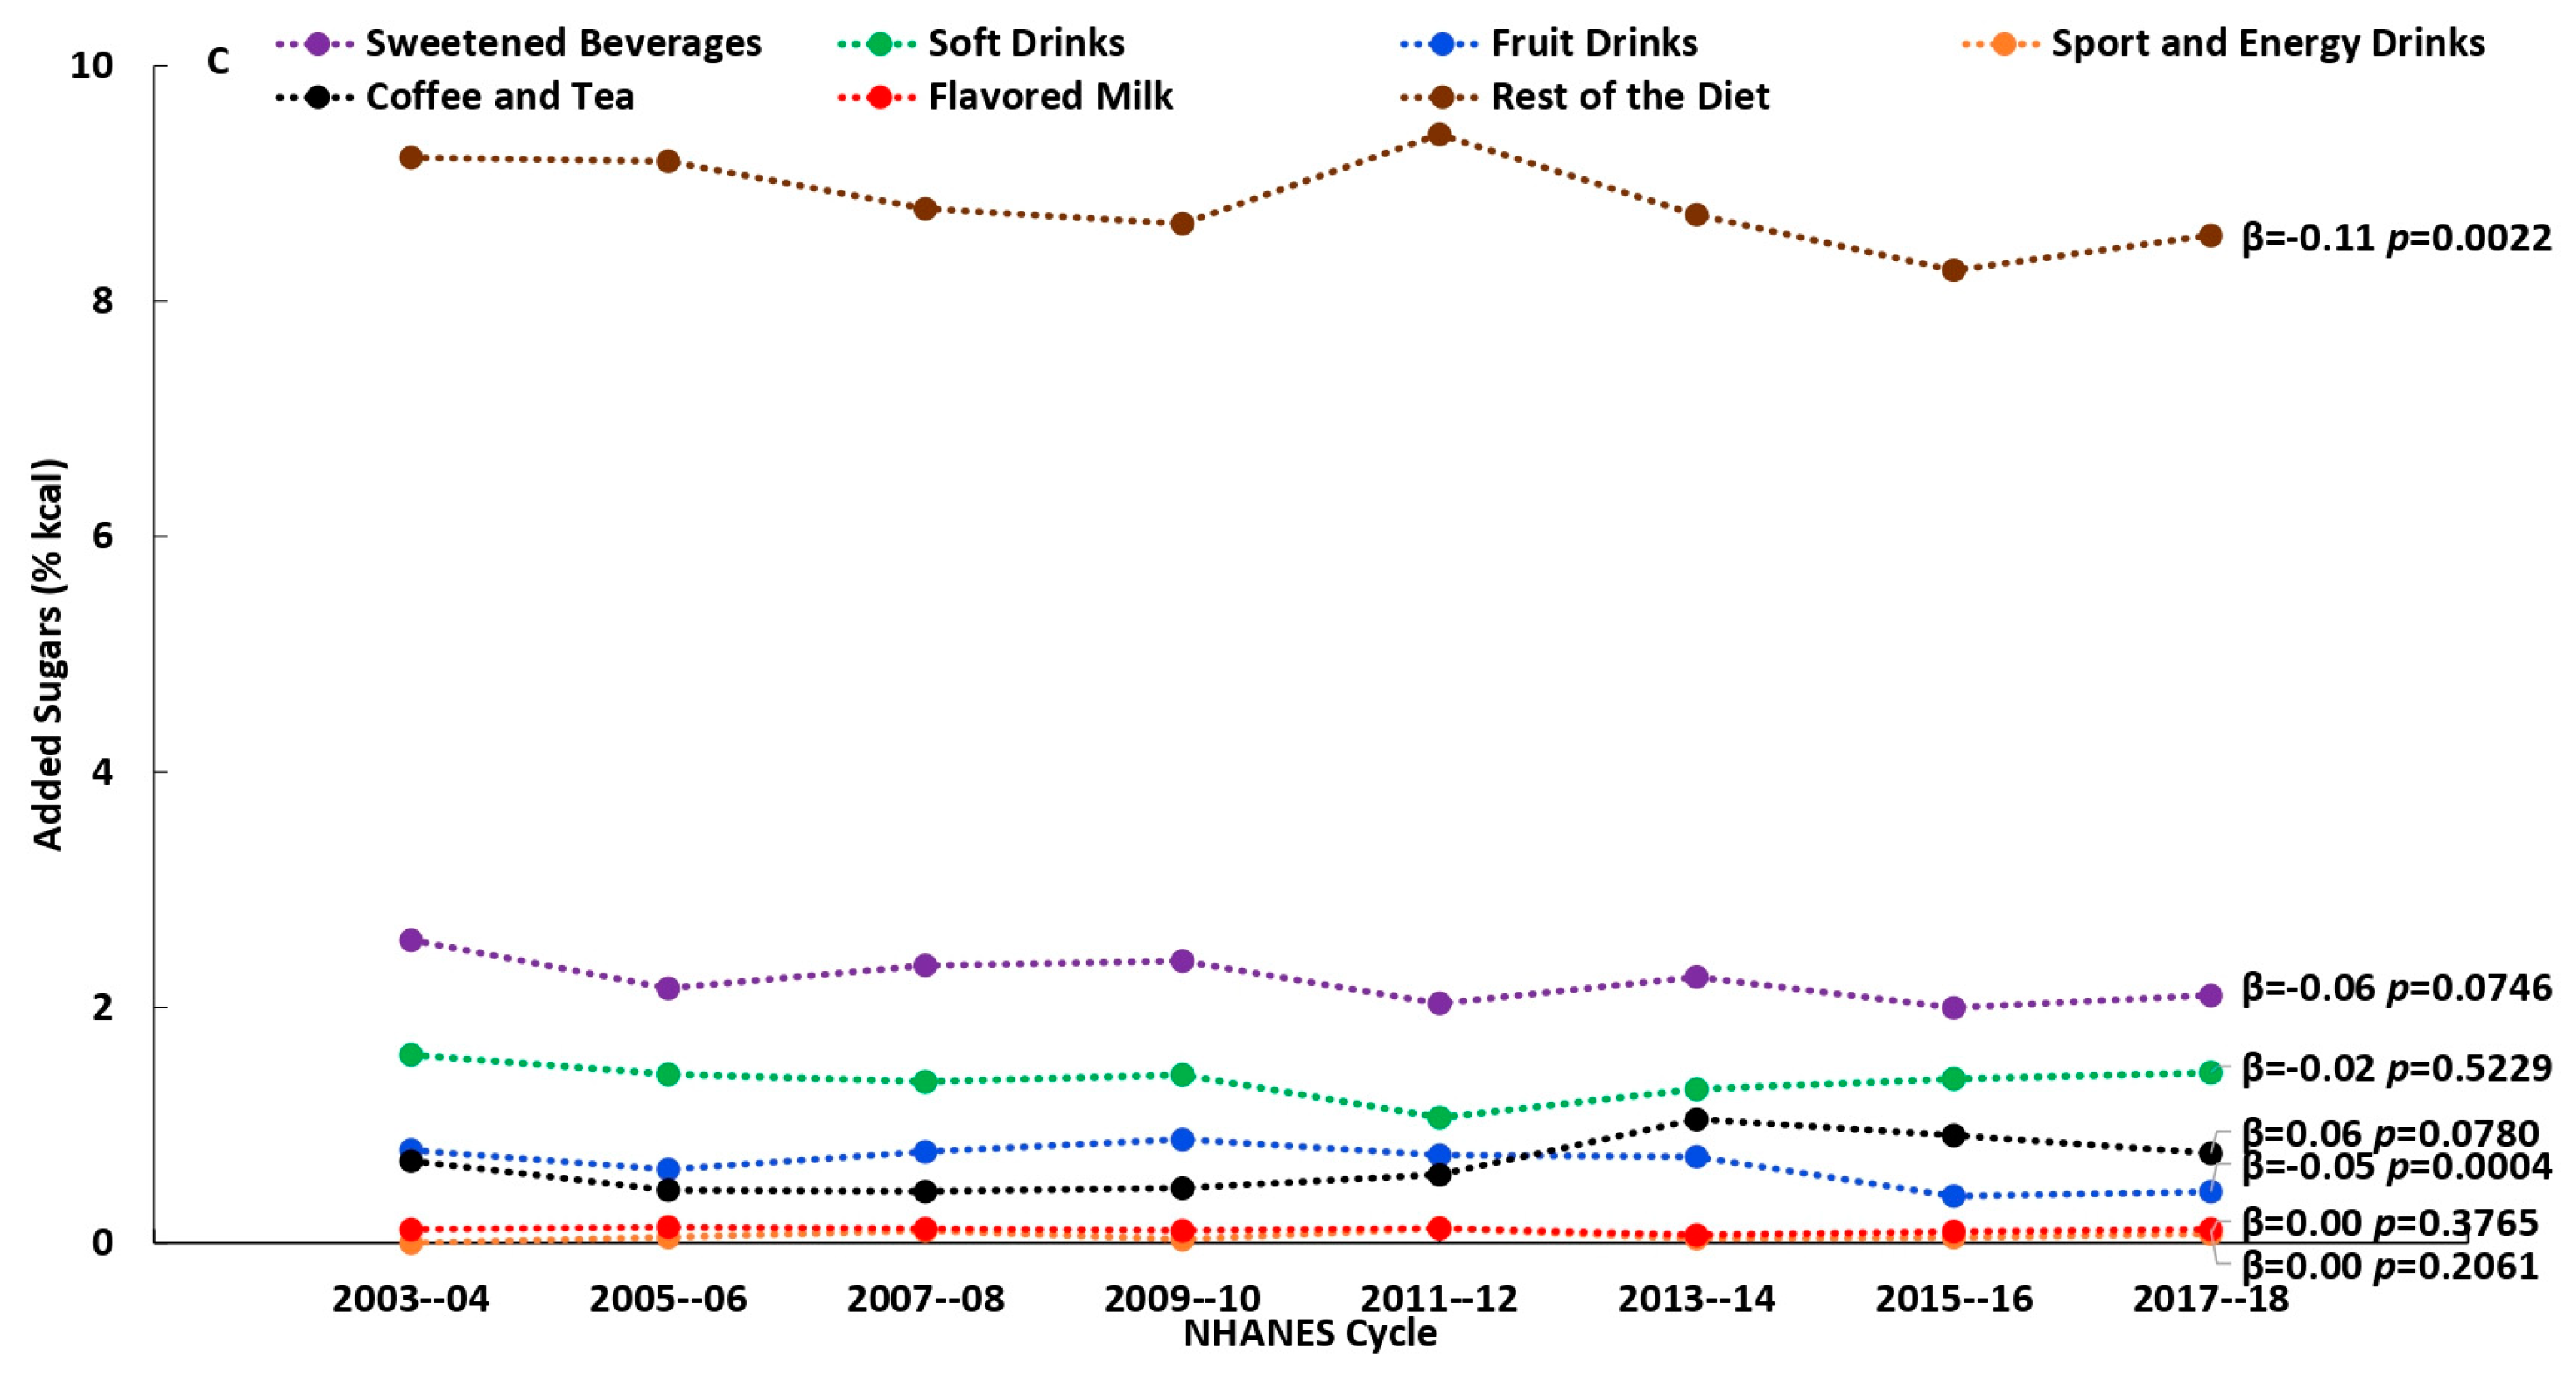
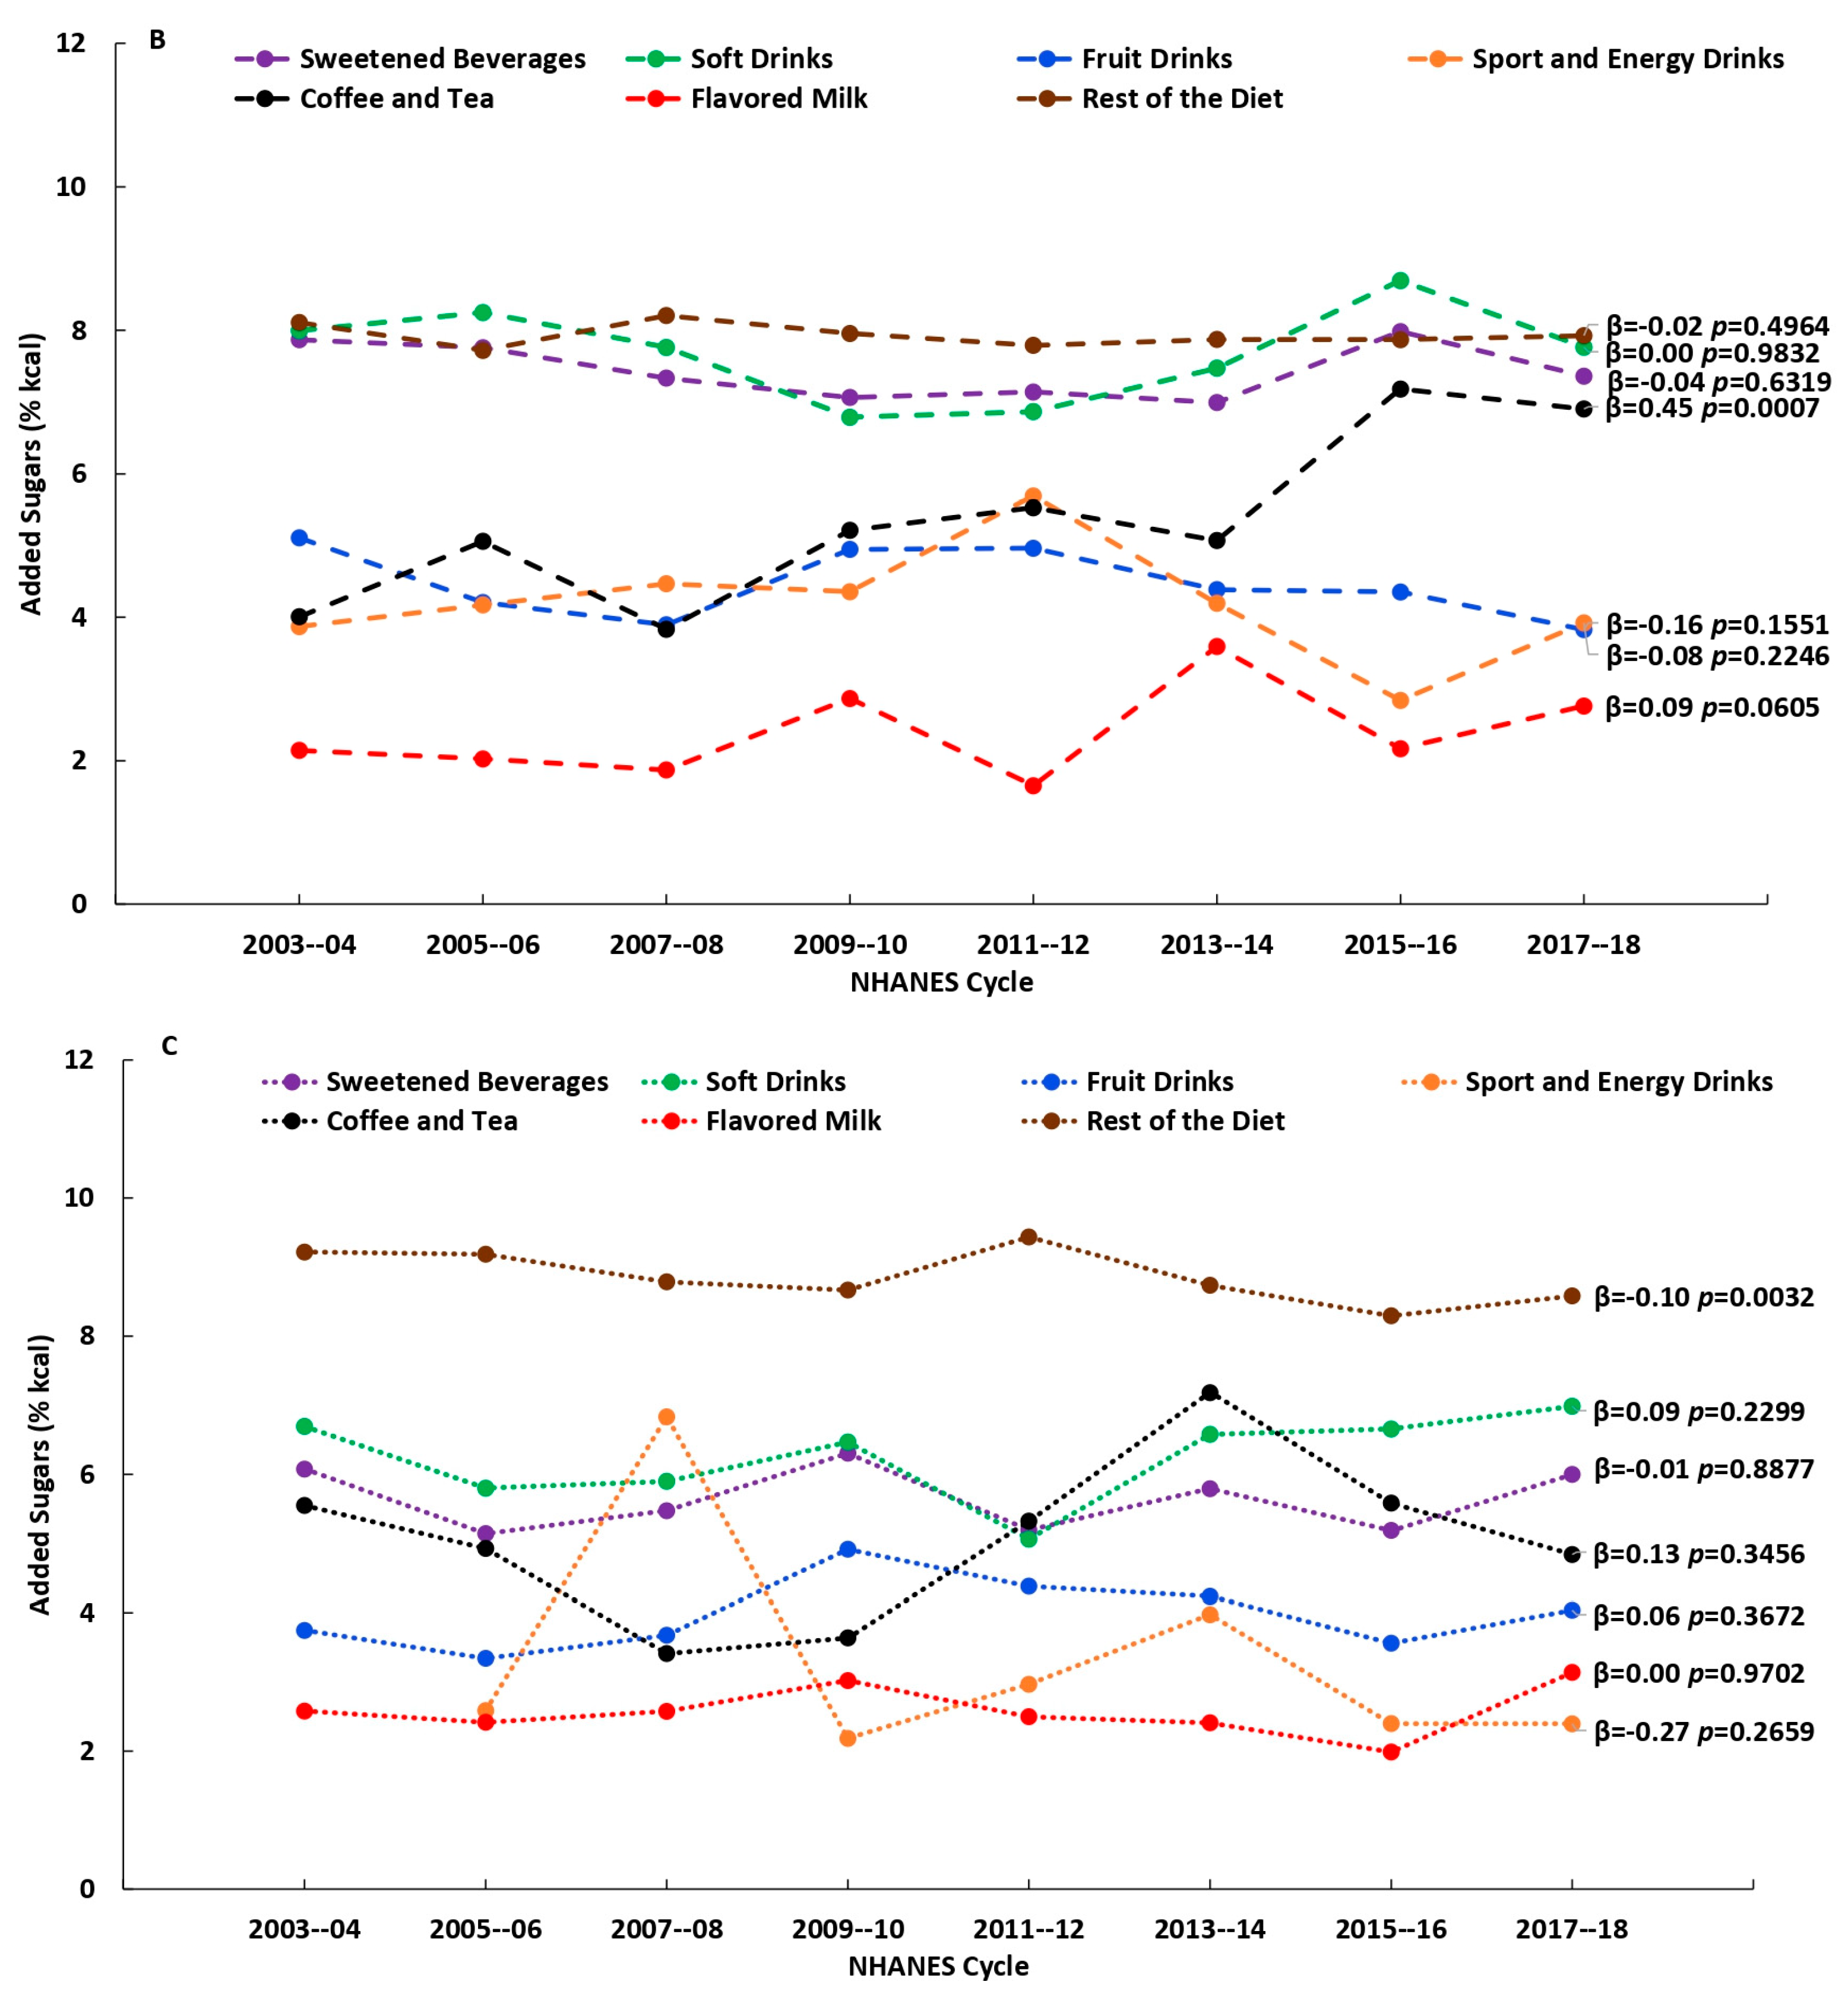
3.2. Consumption of Beverage Sources of Added Sugars and Added Sugars Intake and Patterns over Time
3.3. Associations between Added Sugars Intake and Nutrient Adequacy by Beverage Source
3.4. Associations between Added Sugars from the Rest of the Diet and Nutrient Adequacy
4. Discussion
5. Conclusions
Supplementary Materials
Author Contributions
Funding
Institutional Review Board Statement
Informed Consent Statement
Data Availability Statement
Acknowledgments
Conflicts of Interest
Abbreviations
References
- U.S. Department of Agriculture and U.S. Department of Health and Human Services. Dietary Guidelines for Americans, 2020–2025. 2020. Available online: https://www.dietaryguidelines.gov/ (accessed on 26 July 2023).
- Huth, P.J.; Fulgoni, V.L., III; Keast, D.R.; Park, K.; Auestad, N. Major food sources of calories, added sugars, and saturated fat and their contribution to essential nutrient intakes in the U.S. diet: Data from the national health and nutrition examination survey (2003–2006). Nutr. J. 2013, 12, 116. [Google Scholar] [CrossRef] [PubMed]
- Ricciuto, L.; Fulgoni, V.L., III; Gaine, P.C.; Scott, M.O.; DiFrancesco, L. Sources of added sugars intake among the U.S. population: Analysis by selected sociodemographic factors using the National Health and Nutrition Examination Survey 2011–18. Front. Nutr. 2021, 8, 687643. [Google Scholar] [CrossRef] [PubMed]
- Martin, C.L.; Clemens, J.C.; Moshfegh, A.J. Beverage Choices among Adults: What We Eat in America, NHANES 2017–2018. In Food Surveys Research Group Dietary Data Brief No. 32; United States Department of Agriculture: Beltsville, MD, USA, 2020. [Google Scholar]
- Centers for Disease Control and Prevention, National Center for Health Statistics. About the National Health and Nutrition Examination Survey. Available online: https://www.cdc.gov/nchs/nhanes/about_nhanes.htm (accessed on 26 July 2023).
- Centers for Disease Control and Prevention, National Center for Health Statistics. Survey Methods and Analytic Guidelines. Available online: https://wwwn.cdc.gov/Nchs/Nhanes/AnalyticGuidelines.aspx (accessed on 26 July 2023).
- Food and Nutrition Board, Institute of Medicine. Dietary Reference Intakes: Applications in Dietary Assessment; National Academies Press: Washington, DC, USA, 2000. [Google Scholar]
- USDA, Agricultural Research Service. Food Patterns Equivalents Database (FPED). Available online: https://www.ars.usda.gov/northeast-area/beltsville-md-bhnrc/beltsville-human-nutrition-research-center/food-surveys-research-group/docs/fped-overview/ (accessed on 26 July 2023).
- U.S. Department of Agriculture, Agricultural Research Service, Food Surveys Research Group. What We Eat in America: Documentation and Datasets. Available online: https://www.ars.usda.gov/northeast-area/beltsville-md-bhnrc/beltsville-human-nutrition-research-center/food-surveys-research-group/docs/wweia-documentation-and-data-sets/ (accessed on 26 July 2023).
- USDA, Agricultural Research Service. What We Eat in America (WWEIA): Usual Intakes. Available online: https://www.ars.usda.gov/ARSUserFiles/80400530/pdf/usual/Usual_Intake_gender_WWEIA_2015_2018.pdf (accessed on 26 July 2023).
- Tooze, J.A.; Kipnis, V.; Buckman, D.W.; Carroll, R.J.; Freedman, L.S.; Guenther, P.M.; Krebs-Smith, S.M.; Subar, A.F.; Dodd, K.W. A mixed-effects model approach for estimating the distribution of usual intake of nutrients: The NCI method. Stat. Med. 2010, 29, 2857–2868. [Google Scholar] [CrossRef] [PubMed]
- Centers for Disease Control and Prevention, National Center for Health Statistics. Unweighted Response Rates for NHANES 2017–2018 by Age and Gender. Available online: https://wwwn.cdc.gov/nchs/data/nhanes3/ResponseRates/NHANES-2017-2018-Response-Rates-508.pdf (accessed on 22 August 2023).
- Wang, Y.; Chiavaroli, L.; Roke, K.; DiAngelo, C.; Marsden, S.; Sievenpiper, J. Canadian adults with moderate intakes of total sugars have greater intakes of fibre and key micronutrients: Results from the Canadian Community Health Survey 2015 Public Use Microdata File. Nutrients 2020, 12, 1124. [Google Scholar] [CrossRef] [PubMed]
- Fulgoni, V.L.; Gaine, C.; Scott, M.O.; Ricciuto, L.; Di Francesco, L. Micronutrient dilution and added sugars intake in U.S. adults: Examining the association using NHANES 2009–2014. Nutrients 2020, 12, 985. [Google Scholar] [CrossRef] [PubMed]
- Moshtaghian, H.; Louie, J.C.Y.; Charlton, K.E.; Probst, Y.C.; Gopinath, B.; Mitchell, P.; Flood, V.M. Added sugar intake that exceeds current recommendations is associated with nutrient dilution in older Australians. Nutrition 2016, 32, 937–942. [Google Scholar] [CrossRef] [PubMed]
- Barraj, L.M.; Bi, X.; Murphy, M.M.; Scrafford, C.G.; Tran, N.L. Comparison of nutrient intakes and diet quality among water-based beverage consumers. Nutrients 2019, 11, 314. [Google Scholar] [CrossRef] [PubMed]
- Doherty, A.M.; Lacko, A.M.; Popkin, B.M. Sugar-sweetened beverage (SSB) consumption is associated with lower quality of the non-SB diet in US adolescents and young adults. Am. J. Clin. Nutr. 2021, 113, 657–664. [Google Scholar] [CrossRef] [PubMed]
- Dietary Guidelines Advisory Committee. Scientific Report of the 2020 Dietary Guidelines Advisory Committee: Advisory Report to the Secretary of Agriculture and the Secretary of Health and Human Services; U.S. Department of Agriculture, Agricultural Research Service: Washington, DC, USA, 2020. [CrossRef]
- Hedrick, V.E.; Day, B.M.; You, W.; Porter, K.J.; Estabrooks, P.A.; Zoellner, J.M. Dietary quality changes in response to a sugar-sweetened beverage-reduction intervention: Results from the Talking Health randomized controlled clinical trial. Am. J. Clin. Nutr. 2017, 105, 824–833. [Google Scholar] [PubMed]
- Chiavaroli, L.; Cheung, A.; Ayoub-Charette, S.; Ahmed, A.; Lee, D.; Au-Yeung, F.; Qi, X.Y.; Back, S.; McGlynn, N.; Ha, V.; et al. Important food sources of fructose-containing sugars and adiposity: A systematic review and meta-analysis of controlled feeding trials. Am. J. Clin. Nutr. 2023, 117, 741–765. [Google Scholar] [CrossRef]


| Added Sugars Source | Description |
|---|---|
| Sweetened Beverages | soft drinks; fruit drinks; sports and energy drinks; nutritional beverages; smoothies and grain drinks |
| Soft Drinks | |
| Fruit Drinks | |
| Sports and Energy Drinks | |
| Coffee and Tea | coffee; tea (pre-sweetened and plain) |
| Flavored Milk | flavored milk: whole; reduced fat; low-fat; nonfat |
| Rest of the Diet * | milk and dairy (flavored milk excluded); protein foods; mixed dishes; grains; snacks and sweets; fruit; vegetables; beverages (sweetened beverages and coffee and tea excluded); alcoholic beverages; water, fats and oils; condiments and sauces; sugars; baby foods and formulas; other |
| Added Sugars Source | Consumers (%) Mean ± SE | ||
|---|---|---|---|
| 19–50 y (n = 18,110) | 51–70 y (n = 11,379) | 71+ y (n = 5639) | |
| Sweetened Beverages | 63.68 ± 0.73 | 46.06 ± 0.92 | 39.49 ± 0.87 |
| Soft Drinks | 48.83 ± 0.78 | 31.86 ± 0.90 | 21.98 ± 0.78 |
| Fruit Drinks | 23.16 ± 0.61 | 16.64 ± 0.55 | 16.55 ± 0.67 |
| Sports and Energy Drinks | 9.33 ± 0.41 | 3.47 ± 0.27 | 1.95 ± 0.26 |
| Coffee and Tea | 21.43 ± 0.60 | 16.74 ± 0.76 | 13.32 ± 0.80 |
| Flavored Milk | 4.85 ± 0.24 | 3.35 ± 0.26 | 4.35 ± 0.36 |
| Rest of the Diet | 99.48 ± 0.08 | 99.81 ± 0.05 | 99.85 ± 0.06 |
| Added Sugars (% kcal) Mean ± SE | ||||||
|---|---|---|---|---|---|---|
| 19–50 y (n = 18,110) | 51–70 y (n = 11,379) | 71+ y (n = 5639) | ||||
| All Individuals | Consumers Only | All Individuals | Consumers Only | All Individuals | Consumers Only | |
| Sweetened Beverages | 6.19 ± 0.14 | 9.73 ± 0.16 | 3.42 ± 0.11 | 7.43 ± 0.17 | 2.22 ± 0.07 | 5.63 ± 0.12 |
| Soft Drinks | 4.52 ± 0.13 | 9.26 ± 0.17 | 2.45 ± 0.10 | 7.70 ± 0.21 | 1.38 ± 0.06 | 6.29 ± 0.17 |
| Fruit Drinks | 1.15 ± 0.04 | 4.95 ± 0.10 | 0.75 ± 0.04 | 4.49 ± 0.15 | 0.66 ± 0.04 | 3.98 ± 0.17 |
| Sports and Energy Drinks | 0.45 ± 0.02 | 4.86 ± 0.18 | 0.14 ± 0.01 | 4.16 ± 0.32 | 0.06 ± 0.01 | 3.06 ± 0.43 |
| Coffee and Tea | 1.07 ± 0.04 | 5.00 ± 0.14 | 0.93 ± 0.07 | 5.57 ± 0.29 | 0.68 ± 0.08 | 5.12 ± 0.43 |
| Flavored Milk | 0.12 ± 0.01 | 2.40 ± 0.10 | 0.08 ± 0.01 | 2.35 ± 0.13 | 0.11 ± 0.01 | 2.54 ± 0.10 |
| Rest of the Diet * | 6.92 ± 0.06 | 6.95 ± 0.06 | 7.91 ± 0.07 | 7.92 ± 0.07 | 8.82 ± 0.09 | 8.84 ± 0.09 |
| Total Added Sugars | 14.3 ± 0.16 | 12.3 ± 0.15 | 11.8 ± 0.16 | |||
| Added Sugars Source | Quantile | 19–50 y (n = 18,110) Range (% kcal) | 51–70 y (n = 11,379) Range (% kcal) | 71+ y (n = 5639) Range (% kcal) |
|---|---|---|---|---|
| Sweetened Beverages | 1 * | 0 | 0 | 0 |
| 2 | >0 to ≤4.90 | >0 to ≤3.66 | >0 to ≤2.83 | |
| 3 | >4.90 to ≤10.87 | >3.66 to ≤8.31 | >2.83 to ≤6.05 | |
| 4 | >10.87 | >8.31 | >6.05 | |
| Soft Drinks | 1 * | 0 | 0 | 0 |
| 2 | >0 to ≤4.76 | >0 to ≤3.94 | >0 to ≤3.40 | |
| 3 | >4.76 to ≤10.04 | >3.94 to ≤8.35 | >3.40 to ≤6.82 | |
| 4 | >10.04 | >8.35 | >6.82 | |
| Fruit Drinks | 1 * | 0 | 0 | 0 |
| 2 | >0 to ≤2.39 | >0 to ≤2.22 | >0 to ≤1.89 | |
| 3 | >2.39 to ≤5.15 | >2.22 to ≤4.90 | >1.89 to ≤4.19 | |
| 4 | >5.15 | >4.90 | >4.19 | |
| Sports and Energy Drinks | 1 * | 0 | 0 | 0 |
| 2 | >0 to ≤2.46 | >0 to ≤2.34 | >0 to ≤1.28 | |
| 3 | >2.46 to ≤4.90 | >2.34 to ≤4.25 | >1.28 to ≤3.31 | |
| 4 | >4.90 | >4.25 | >3.31 | |
| Coffee and Tea | 1 * | 0 | 0 | 0 |
| 2 | >0 to ≤2.36 | >0 to ≤2.40 | >0 to ≤2.26 | |
| 3 | >2.36 to ≤5.14 | >2.40 to ≤5.27 | >2.26 to ≤5.05 | |
| 4 | >5.14 | >5.27 | >5.05 | |
| Flavored Milk | 1 * | 0 | 0 | 0 |
| 2 | >0 to ≤1.37 | >0 to ≤1.41 | >0 to ≤1.75 | |
| 3 | >1.37 to ≤2.39 | >1.41 to ≤2.42 | >1.75 to ≤2.81 | |
| 4 | >2.39 | >2.42 | >2.81 |
| Sweetened Beverages | |||||||
|---|---|---|---|---|---|---|---|
| Q1 2 n = 45,870,329 % <EAR (SE) | Q2 n = 26,738,412 % <EAR (SE) | Q3 n = 26,858,208 % <EAR (SE) | Q4 n = 26,819,883 % <EAR (SE) | Quantile Trend 3 Beta (SE), p | Q1 vs. Q2,3,4 4 Beta (SE), p | Q2–Q4 Trend 5 Beta (SE), p | |
| Calcium | 33.82 (1.08) | 34.32 (1.45) | 34.01 (1.58) | 35.60 (1.49) | 0.49 (0.24), 0.18 | 0.83 (0.88), 0.44 | 0.65 (0.55), 0.45 |
| Magnesium | 44.86 (1.15) | 51.31 (1.49) | 58.22 (1.54) | 65.32 (1.34) | 6.81 (0.10), 0.00 † | 13.56 (7.19), 0.20 | 7.00 (0.06), 0.01 † |
| Potassium 1 | 35.54 (1.14) | 30.94 (1.39) | 28.07 (1.45) | 24.66 (1.32) | −3.59 (0.23), 0.00 † | −7.71 (3.23), 0.14 | −3.14 (0.16), 0.03 § |
| Vitamin A | 40.88 (1.44) | 48.10 (1.72) | 56.22 (1.61) | 62.29 (1.64) | 7.25 (0.26), 0.00 † | 14.82 (7.30), 0.18 | 7.09 (0.60), 0.05 |
| Vitamin B12 | 5.51 (0.55) | 3.69 (0.81) | 2.96 (0.66) | 2.45 (0.55) | −1.02 (0.21), 0.04 § | −2.49 (0.64), 0.06 | −0.62 (0.07), 0.07 |
| Vitamin C | 49.15 (1.42) | 43.07 (1.70) | 47.48 (1.72) | 51.36 (1.61) | 0.84 (1.68), 0.67 | −1.76 (4.25), 0.72 | 4.14 (0.16), 0.02 § |
| Vitamin D | 95.62 (0.54) | 95.24 (0.67) | 96.37 (0.69) | 96.85 (0.49) | 0.45 (0.19), 0.15 | 0.55 (0.84), 0.58 | 0.80 (0.19), 0.15 |
| Vitamin E | 81.91 (0.97) | 80.86 (1.65) | 88.96 (1.24) | 89.78 (1.12) | 3.06 (1.12), 0.11 | 4.75 (5.04), 0.45 | 4.42 (2.12), 0.28 |
| Dietary Fiber 1 | 5.09 (0.48) | 2.90 (0.45) | 1.46 (0.29) | 0.71 (0.16) | −1.49 (0.22), 0.02 § | −3.43 (1.14), 0.10 | −1.09 (0.20), 0.12 |
| Protein | 1.45 (0.21) | 1.17 (0.38) | 1.28 (0.32) | 0.84 (0.23) | −0.17 (0.07), 0.12 | −0.35 (0.24), 0.28 | −0.17 (0.16), 0.48 |
| Soft Drinks | |||||||
| Q1 2 n = 64,624,982 % <EAR (SE) | Q2 n = 20,527,842 % <EAR (SE) | Q3 n = 20,569,006 % <EAR (SE) | Q4 n = 20,565,002 % <EAR (SE) | Quantile Trend 3 Beta (SE), p | Q1 vs. Q2,3,4 4 Beta (SE), p | Q2–Q4 Trend 5 Beta (SE), p | |
| Calcium | 32.55 (0.93) | 36.62 (1.67) | 34.77 (1.70) | 36.86 (1.70) | 1.34 (0.67), 0.19 | 3.53 (0.96), 0.07 | 0.09 (1.14), 0.95 |
| Magnesium | 44.52 (1.04) | 57.34 (1.58) | 62.67 (1.76) | 70.27 (1.53) | 8.68 (0.98), 0.01 § | 18.73 (5.44), 0.07 | 6.45 (0.65), 0.06 |
| Potassium 1 | 36.21 (0.96) | 26.49 (1.55) | 25.38 (1.53) | 21.56 (1.42) | −4.99 (1.12), 0.05 § | −11.66 (2.16), 0.03 § | −2.45 (0.78), 0.20 |
| Vitamin A | 40.69 (1.27) | 56.72 (1.80) | 59.54 (2.07) | 65.52 (2.14) | 8.53 (1.80), 0.04 § | 19.79 (3.75), 0.03 § | 4.38 (0.91), 0.13 |
| Vitamin B12 | 4.92 (0.51) | 2.74 (0.59) | 3.26 (0.73) | 2.04 (0.60) | −0.92 (0.31), 0.10 | −2.23 (0.51), 0.05 § | −0.34 (0.50), 0.62 |
| Vitamin C | 41.17 (1.21) | 47.71 (1.71) | 53.32 (2.01) | 66.69 (1.89) | 7.89 (1.05), 0.02 § | 14.48 (8.14), 0.22 | 9.44 (2.24), 0.15 |
| Vitamin D | 95.46 (0.44) | 95.90 (0.87) | 97.09 (0.57) | 96.61 (0.56) | 0.49 (0.18), 0.12 | 1.06 (0.51), 0.17 | 0.37 (0.48), 0.59 |
| Vitamin E | 79.72 (0.95) | 88.28 (1.59) | 92.54 (1.21) | 91.65 (1.31) | 4.57 (1.33), 0.08 | 11.06 (1.91), 0.03 § | 1.72 (1.49), 0.46 |
| Dietary Fiber 1 | 4.90 (0.42) | 1.45 (0.33) | 0.94 (0.23) | 0.33 (0.09) | −1.63 (0.46), 0.07 | −3.98 (0.47), 0.01 § | −0.56 (0.03), 0.03 § |
| Protein | 1.43 (0.20) | 1.04 (0.30) | 1.09 (0.31) | 0.76 (0.28) | −0.21 (0.05), 0.06 | −0.46 (0.15), 0.09 | −0.14 (0.11), 0.44 |
| Fruit Drinks | |||||||
| Q1 2 n = 97,041,663 % <EAR (SE) | Q2 n = 9,649,034 % <EAR (SE) | Q3 n = 9,843,621 % <EAR (SE) | Q4 n = 9,752,514 % <EAR (SE) | Quantile Trend 3 Beta (SE), p | Q1 vs. Q2,3,4 4 Beta (SE), p | Q2–Q4 Trend 5 Beta (SE), p | |
| Calcium | 34.26 (0.85) | 36.09 (2.47) | 36.67 (2.01) | 30.23 (2.03) | −0.60 (1.00), 0.61 | −0.15 (2.48), 0.96 | −3.05 (2.02), 0.37 |
| Magnesium | 53.27 (0.98) | 53.35 (2.84) | 57.45 (2.18) | 48.36 (2.05) | −0.65 (1.32), 0.67 | −0.42 (3.17), 0.91 | −2.73 (3.79), 0.60 |
| Potassium 1 | 30.44 (0.83) | 29.20 (2.44) | 27.00 (2.06) | 38.35 (2.04) | 1.42 (1.61), 0.47 | 1.43 (4.21), 0.77 | 4.82 (3.90), 0.43 |
| Vitamin A | 49.66 (1.08) | 46.04 (3.52) | 54.59 (2.58) | 52.08 (2.18) | 1.07 (1.11), 0.43 | 1.44 (2.89), 0.67 | 2.83 (3.18), 0.54 |
| Vitamin B12 | 4.10 (0.33) | 2.74 (1.05) | 6.38 (1.29) | 2.51 (1.17) | −0.14 (0.64), 0.85 | −0.24 (1.47), 0.88 | −0.25 (2.16), 0.93 |
| Vitamin C | 57.84 (1.06) | 26.50 (3.38) | 10.71 (3.91) | 1.66 (1.05) | −20.36 (2.70), 0.02 § | −45.76 (8.45), 0.03 § | −12.30 (1.94), 0.10 |
| Vitamin D | 95.91 (0.36) | 96.35 (0.90) | 95.68 (1.00) | 96.89 (0.90) | 0.22 (0.16), 0.31 | 0.42 (0.42), 0.42 | 0.30 (0.54), 0.68 |
| Vitamin E | 84.39 (0.68) | 82.88 (2.31) | 87.38 (2.60) | 86.53 (1.65) | 0.83 (0.54), 0.27 | 1.33 (1.57), 0.49 | 1.73 (1.54), 0.46 |
| Dietary Fiber 1 | 3.00 (0.28) | 3.05 (0.73) | 1.27 (0.36) | 2.62 (0.65) | −0.30 (0.27), 0.38 | −0.70 (0.62), 0.38 | −0.16 (0.90), 0.89 |
| Protein | 1.27 (0.16) | 0.98 (0.45) | 1.50 (0.52) | 0.78 (0.42) | −0.10 (0.11), 0.45 | −0.19 (0.25), 0.53 | −0.12 (0.36), 0.79 |
| Sports and Energy Drinks | |||||||
| Q1 2 n = 114,501,042 % <EAR (SE) | Q2 n = 3,911,941 % <EAR (SE) | Q3 n = 3,884,247 % <EAR (SE) | Q4 n = 3,989,602 % <EAR (SE) | Quantile Trend 3 Beta (SE), p | Q1 vs. Q2,3,4 4 Beta (SE), p | Q2–Q4 Trend 5 Beta (SE), p | |
| Calcium | 35.08 (0.77) | 24.83 (4.20) | 24.94 (2.74) | 26.60 (3.69) | −3.99 (1.48), 0.12 | −9.65 (0.59), 0.00 † | 0.87 (0.45), 0.30 |
| Magnesium | 53.39 (0.90) | 51.62 (4.27) | 52.95 (4.48) | 51.83 (3.83) | −0.52 (0.28), 0.21 | −1.25 (0.44), 0.10 | 0.12 (0.72), 0.89 |
| Potassium 1 | 30.81 (0.72) | 25.37 (5.39) | 32.39 (3.76) | 33.33 (4.30) | 0.41 (1.21), 0.77 | −0.51 (2.64), 0.86 | 4.02 (1.78), 0.27 |
| Vitamin A | 49.35 (0.99) | 56.08 (5.43) | 60.29 (4.40) | 55.45 (4.34) | 3.37 (1.33), 0.13 | 7.97 (1.60), 0.04 § | −0.26 (2.65), 0.94 |
| Vitamin B12 | 4.66 (0.33) | 0.02 (0.17) | 0.45 (0.54) | 0.00 (0.02) | −1.92 (0.59), 0.08 | −4.50 (0.15), 0.00 † | −0.01 (0.25), 0.98 |
| Vitamin C | 47.94 (1.01) | 48.38 (5.37) | 53.97 (4.68) | 55.32 (3.66) | 2.49 (0.46), 0.03 § | 4.55 (2.23), 0.18 | 3.50 (1.24), 0.22 |
| Vitamin D | 95.99 (0.31) | 96.14 (1.14) | 96.25 (1.44) | 95.09 (2.64) | −0.14 (0.15), 0.45 | −0.15 (0.38), 0.74 | −0.52 (0.37), 0.40 |
| Vitamin E | 85.24 (0.63) | 79.40 (5.64) | 83.77 (4.37) | 73.56 (4.60) | −3.08 (1.20), 0.12 | −6.18 (3.08), 0.18 | −2.82 (4.27), 0.63 |
| Dietary Fiber 1 | 3.06 (0.25) | 0.92 (0.75) | 1.00 (0.52) | 1.28 (0.76) | −0.82 (0.31), 0.11 | −2.00 (0.11), 0.00 † | 0.18 (0.05), 0.19 |
| Protein | 1.21 (0.14) | 0.68 (0.92) | 1.71 (1.15) | 2.50 (0.90) | 0.31 (0.18), 0.23 | 0.40 (0.55), 0.54 | 0.91 (0.07), 0.05 |
| Coffee and Tea | |||||||
| Q1 2 n = 99,219,698 % <EAR (SE) | Q2 n = 8,638,066 % <EAR (SE) | Q3 n = 9,403,285 % <EAR (SE) | Q4 n = 9,025,782 % <EAR (SE) | Quantile Trend 3 Beta (SE), p | Q1 vs. Q2,3,4 4 Beta (SE), p | Q2–Q4 Trend 5 Beta (SE), p | |
| Calcium | 34.03 (0.87) | 36.70 (2.36) | 34.64 (2.56) | 35.84 (3.13) | 0.62 (0.44), 0.30 | 1.67 (0.68), 0.13 | −0.43 (0.96), 0.73 |
| Magnesium | 52.98 (0.94) | 54.61 (2.37) | 55.95 (2.74) | 53.62 (2.86) | 0.65 (0.49), 0.31 | 1.78 (0.77), 0.15 | −0.49 (1.08), 0.73 |
| Potassium 1 | 30.48 (0.85) | 30.57 (2.55) | 28.22 (2.59) | 37.20 (2.54) | 1.15 (1.20), 0.44 | 1.39 (3.02), 0.69 | 3.29 (3.36), 0.51 |
| Vitamin A | 49.43 (1.02) | 50.86 (2.80) | 51.60 (2.81) | 54.08 (3.17) | 1.41 (0.16), 0.01 § | 2.73 (1.08), 0.13 | 1.60 (0.51), 0.20 |
| Vitamin B12 | 4.23 (0.31) | 4.38 (1.26) | 3.92 (1.32) | 1.44 (0.65) | −0.65 (0.32), 0.18 | −0.95 (1.02), 0.45 | −1.47 (0.60), 0.25 |
| Vitamin C | 46.93 (1.03) | 43.97 (3.48) | 55.08 (2.48) | 60.68 (3.00) | 4.06 (1.47), 0.11 | 6.30 (5.48), 0.37 | 8.36 (1.63), 0.12 |
| Vitamin D | 95.74 (0.37) | 96.56 (1.00) | 96.93 (0.77) | 97.34 (0.64) | 0.56 (0.06), 0.01 † | 1.20 (0.25), 0.04 § | 0.39 (0.01), 0.02 § |
| Vitamin E | 84.33 (0.78) | 85.19 (2.62) | 86.28 (2.36) | 87.28 (1.81) | 0.98 (0.02), 0.00 † | 1.92 (0.68), 0.11 | 1.05 (0.03), 0.02 § |
| Dietary Fiber 1 | 3.19 (0.29) | 2.95 (0.75) | 2.06 (0.81) | 0.66 (0.36) | −0.73 (0.14), 0.04 § | −1.28 (0.74), 0.23 | −1.15 (0.15), 0.08 |
| Protein | 1.21 (0.15) | 1.79 (0.65) | 0.99 (0.53) | 0.85 (0.32) | −0.08 (0.14), 0.63 | 0.00 (0.33), 0.99 | −0.47 (0.20), 0.25 |
| Flavored Milk | |||||||
| Q1 2 n = 120,167,033 % <EAR (SE) | Q2 n = 2,033,860 % <EAR (SE) | Q3 n = 2,024,315 % <EAR (SE) | Q4 n = 2,061,624 % <EAR (SE) | Quantile Trend 3 Beta (SE), p | Q1 vs. Q2,3,4 4 Beta (SE), p | Q2–Q4 Trend 5 Beta (SE), p | |
| Calcium | 35.62 (0.78) | 22.08 (4.14) | 7.64 (3.11) | 3.40 (2.18) | −11.85 (1.10), 0.01 † | −24.51 (5.82), 0.05 | −9.36 (2.94), 0.19 |
| Magnesium | 54.10 (0.87) | 43.66 (5.38) | 33.50 (8.79) | 25.54 (5.31) | −9.81 (0.28), 0.00 † | −19.81 (5.39), 0.07 | −9.07 (0.64), 0.04 § |
| Potassium 1 | 29.86 (0.72) | 38.17 (6.92) | 49.06 (6.61) | 63.15 (5.19) | 10.48 (0.65), 0.00 † | 20.19 (7.43), 0.11 | 12.48 (0.92), 0.05 § |
| Vitamin A | 51.08 (0.99) | 39.34 (5.53) | 31.50 (5.99) | 19.03 (3.68) | −10.50 (0.38), 0.00 † | −21.06 (6.07), 0.07 | −10.15 (1.33), 0.08 |
| Vitamin B12 | 4.32 (0.30) | 1.50 (1.18) | 0.25 (0.42) | 0.02 (0.06) | −1.70 (0.30), 0.03 § | −3.72 (0.47), 0.02 § | −0.74 (0.29), 0.24 |
| Vitamin C | 48.45 (0.97) | 51.21 (4.99) | 40.81 (8.50) | 49.42 (5.25) | −0.68 (1.50), 0.69 | −1.28 (3.29), 0.74 | −0.93 (5.47), 0.89 |
| Vitamin D | 96.52 (0.29) | 93.18 (2.51) | 94.16 (5.65) | 64.50 (7.78) | −7.48 (3.16), 0.14 | −12.51 (9.96), 0.34 | −14.29 (8.82), 0.35 |
| Vitamin E | 84.66 (0.65) | 78.89 (4.83) | 89.97 (4.26) | 84.83 (3.60) | 0.39 (1.50), 0.82 | −0.14 (3.29), 0.97 | 3.00 (4.67), 0.64 |
| Dietary Fiber 1 | 2.84 (0.24) | 2.70 (1.73) | 1.64 (1.20) | 4.47 (2.21) | 0.17 (0.37), 0.69 | 0.10 (0.84), 0.92 | 0.88 (1.12), 0.58 |
| Protein | 1.29 (0.16) | 0.45 (0.52) | 0.16 (0.26) | 0.08 (0.10) | −0.48 (0.09), 0.03 § | −1.06 (0.11), 0.01 § | −0.18 (0.06), 0.20 |
| Sweetened Beverages | |||||||
|---|---|---|---|---|---|---|---|
| Q1 2 n = 37,742,394 % <EAR (SE) | Q2 n = 9,641,654 % <EAR (SE) | Q3 n = 10,517,451 % <EAR (SE) | Q4 n = 12,072,235 % <EAR (SE) | Quantile Trend 3 Beta (SE), p | Q1 vs. Q2,3,4 4 Beta (SE), p | Q2–4 Trend 5 Beta (SE), p | |
| Calcium | 54.98 (1.14) | 49.43 (2.17) | 51.25 (2.21) | 56.20 (2.12) | −0.07 (1.42), 0.97 | −2.42 (2.93), 0.49 | 3.45 (0.90), 0.16 |
| Magnesium | 49.30 (1.33) | 51.85 (2.08) | 55.95 (2.11) | 68.36 (1.67) | 5.69 (1.36), 0.05 | 10.06 (7.20), 0.30 | 8.42 (2.41), 0.18 |
| Potassium 1 | 40.13 (1.27) | 38.26 (2.04) | 35.83 (1.82) | 27.45 (1.83) | −3.77 (0.91), 0.05 | −6.70 (4.75), 0.29 | −5.52 (1.72), 0.19 |
| Vitamin A | 39.50 (1.49) | 39.38 (2.10) | 46.15 (2.16) | 53.12 (2.41) | 4.30 (1.02), 0.052 | 7.25 (5.65), 0.33 | 6.87 (0.06), 0.01 † |
| Vitamin B12 | 5.23 (0.55) | 3.92 (0.90) | 3.96 (0.87) | 3.39 (0.82) | −0.62 (0.15), 0.05 | −1.50 (0.27), 0.03 § | −0.28 (0.18), 0.37 |
| Vitamin C | 45.12 (1.26) | 35.45 (2.17) | 39.46 (2.39) | 45.82 (2.10) | −0.40 (2.24), 0.88 | −4.48 (4.34), 0.41 | 5.23 (0.68), 0.08 |
| Vitamin D | 95.82 (0.50) | 93.40 (0.92) | 95.02 (1.01) | 96.14 (0.64) | 0.01 (0.54), 0.99 | −0.86 (1.12), 0.53 | 1.36 (0.15), 0.07 |
| Vitamin E | 82.49 (1.05) | 82.53 (2.00) | 85.51 (1.75) | 91.29 (1.22) | 2.63 (0.77), 0.08 | 4.29 (3.71), 0.37 | 4.44 (0.81), 0.11 |
| Dietary Fiber 1 | 15.99 (1.01) | 13.91 (1.47) | 9.12 (1.17) | 4.47 (0.68) | −3.76 (0.38), 0.01 § | −7.18 (3.88), 0.21 | −4.72 (0.04), 0.01 † |
| Protein | 1.98 (0.27) | 2.02 (0.56) | 1.71 (0.39) | 1.55 (0.39) | −0.14 (0.04), 0.06 | −0.23 (0.19), 0.34 | −0.23 (0.04), 0.11 |
| Soft Drinks | |||||||
| Q1 2 n = 47,679,443 % <EAR (SE) | Q2 n = 6,587,851 % <EAR (SE) | Q3 n = 7,594,210 % <EAR (SE) | Q4 n = 8,112,229 % <EAR (SE) | Quantile Trend 3 Beta (SE), p | Q1 vs. Q2,3,4 4 Beta (SE), p | Q2–4 Trend 5 Beta (SE), p | |
| Calcium | 52.72 (0.95) | 51.97 (2.43) | 53.93 (2.50) | 58.97 (2.54) | 1.60 (0.73), 0.16 | 2.28 (2.58), 0.47 | 3.52 (0.91), 0.16 |
| Magnesium | 47.87 (1.18) | 59.62 (2.57) | 63.70 (2.81) | 76.48 (1.72) | 9.15 (0.84), 0.01 † | 18.85 (6.30), 0.10 | 8.49 (2.58), 0.19 |
| Potassium 1 | 41.76 (1.10) | 30.86 (2.06) | 28.40 (2.21) | 21.42 (2.00) | −6.86 (0.85), 0.02 § | −14.93 (3.50), 0.05 | −4.75 (1.34), 0.17 |
| Vitamin A | 38.20 (1.20) | 49.85 (2.56) | 48.86 (3.09) | 58.27 (3.02) | 6.45 (1.23), 0.03 § | 14.13 (3.74), 0.06 | 4.27 (3.08), 0.40 |
| Vitamin B12 | 5.03 (0.53) | 2.95 (0.72) | 4.59 (1.10) | 3.19 (1.03) | −0.55 (0.36), 0.27 | −1.43 (0.64), 0.16 | 0.10 (0.90), 0.93 |
| Vitamin C | 38.81 (1.06) | 46.49 (2.54) | 49.10 (3.18) | 60.60 (2.76) | 6.70 (0.84), 0.02 § | 13.34 (5.38), 0.13 | 7.11 (2.63), 0.23 |
| Vitamin D | 95.02 (0.44) | 94.90 (1.29) | 96.56 (0.76) | 96.29 (0.73) | 0.51 (0.19), 0.12 | 0.93 (0.63), 0.28 | 0.68 (0.57), 0.44 |
| Vitamin E | 81.17 (0.96) | 87.26 (2.14) | 92.06 (1.38) | 93.40 (1.28) | 4.51 (0.61), 0.02 § | 9.85 (2.28), 0.05 § | 3.05 (1.03), 0.21 |
| Dietary Fiber 1 | 16.23 (0.92) | 8.21 (1.19) | 6.58 (1.17) | 2.22 (0.43) | −4.80 (0.68), 0.02 § | −10.60 (2.21), 0.04 § | −3.01 (0.81), 0.17 |
| Protein | 1.93 (0.24) | 1.69 (0.50) | 1.89 (0.45) | 1.94 (0.57) | −0.01 (0.05), 0.89 | −0.08 (0.09), 0.48 | 0.12 (0.05), 0.23 |
| Fruit Drinks | |||||||
| Q1 2 n = 58,332,159 % <EAR (SE) | Q2 n = 3,528,538 % <EAR (SE) | Q3 n = 3,672,186 % <EAR (SE) | Q4 n = 4,440,850 % <EAR (SE) | Quantile Trend 3 Beta (SE), p | Q1 vs. Q2,3,4 4 Beta (SE), p | Q2–4 Trend 5 Beta (SE), p | |
| Calcium | 53.79 (0.90) | 52.06 (3.03) | 57.72 (3.21) | 47.84 (2.74) | −0.96 (1.35), 0.55 | −1.42 (3.24), 0.70 | −2.30 (4.43), 0.70 |
| Magnesium | 53.82 (1.10) | 52.78 (2.76) | 55.87 (3.45) | 47.75 (2.57) | −1.20 (1.03), 0.37 | −1.86 (2.69), 0.56 | −2.65 (3.20), 0.56 |
| Potassium 1 | 36.53 (1.03) | 36.48 (2.52) | 34.58 (2.94) | 46.80 (2.63) | 2.14 (1.54), 0.30 | 3.08 (4.33), 0.55 | 5.33 (4.03), 0.41 |
| Vitamin A | 43.02 (1.21) | 36.13 (3.33) | 42.69 (3.89) | 42.40 (3.38) | −0.50 (1.26), 0.73 | −2.49 (2.35), 0.40 | 3.05 (1.95), 0.36 |
| Vitamin B12 | 4.48 (0.42) | 3.06 (1.48) | 8.13 (2.22) | 2.31 (1.10) | −0.10 (0.90), 0.92 | −0.04 (2.04), 0.99 | −0.50 (3.10), 0.90 |
| Vitamin C | 49.89 (1.14) | 17.55 (2.81) | 3.79 (2.58) | 2.32 (1.54) | −18.45 (3.62), 0.04 § | −42.33 (5.35), 0.02 § | −7.47 (3.51), 0.28 |
| Vitamin D | 95.52 (0.34) | 92.55 (1.65) | 95.42 (1.12) | 96.12 (1.47) | −0.01 (0.59), 0.99 | −0.75 (1.21), 0.60 | 1.76 (0.62), 0.21 |
| Vitamin E | 83.99 (0.92) | 84.15 (2.22) | 89.25 (2.16) | 84.38 (2.17) | 0.77 (0.86), 0.46 | 1.90 (1.84), 0.41 | 0.00 (2.84), 1.00 |
| Dietary Fiber 1 | 12.95 (0.77) | 11.77 (1.79) | 8.31 (1.94) | 13.90 (1.82) | −0.43 (0.90), 0.68 | −1.53 (1.84), 0.49 | 1.18 (2.58), 0.73 |
| Protein | 1.90 (0.21) | 1.99 (0.83) | 1.76 (0.73) | 1.06 (0.51) | −0.21 (0.09), 0.15 | −0.32 (0.31), 0.42 | −0.47 (0.13), 0.18 |
| Sports and Energy Drinks | |||||||
| Q1 2 n = 67,548,696 % <EAR (SE) | Q2 n = 831,108 % <EAR (SE) | Q3 n = 816,301 % <EAR (SE) | Q4 n = 881,517 % <EAR (SE) | Quantile Trend 3 Beta (SE), p | Q1 vs. Q2,3,4 4 Beta (SE), p | Q2–4 Trend 5 Beta (SE), p | |
| Calcium | 54.22 (0.83) | 44.33 (9.35) | 33.43 (8.40) | 33.98 (5.40) | −7.86 (1.19), 0.02 § | −17.43 (3.46), 0.04 § | −4.91 (3.29), 0.38 |
| Magnesium | 53.77 (1.03) | 63.96 (7.04) | 45.65 (8.22) | 48.02 (7.25) | −1.81 (2.22), 0.50 | −1.93 (5.60), 0.76 | −7.48 (5.94), 0.43 |
| Potassium 1 | 36.88 (0.91) | 24.95 (8.37) | 46.98 (8.14) | 42.74 (6.71) | 2.00 (2.64), 0.53 | 2.12 (6.57), 0.78 | 8.28 (7.54), 0.47 |
| Vitamin A | 42.53 (1.16) | 53.83 (7.54) | 43.40 (8.99) | 56.88 (8.69) | 4.02 (1.87), 0.16 | 9.05 (4.21), 0.16 | 2.09 (6.87), 0.81 |
| Vitamin B12 | 4.71 (0.41) | 0.10 (0.36) | 0.33 (0.50) | 0.00 (0.07) | −1.90 (0.52), 0.07 | −4.57 (0.10), 0.00 † | −0.06 (0.16), 0.77 |
| Vitamin C | 43.05 (1.04) | 53.01 (8.99) | 39.76 (9.13) | 49.68 (8.69) | 1.64 (1.90), 0.48 | 4.34 (3.96), 0.39 | −1.12 (6.65), 0.89 |
| Vitamin D | 95.47 (0.35) | 96.58 (1.84) | 90.72 (5.91) | 90.50 (4.30) | −1.69 (0.54), 0.09 | −3.14 (1.95), 0.25 | −2.91 (1.62), 0.32 |
| Vitamin E | 84.69 (0.83) | 78.04 (7.61) | 78.11 (8.97) | 79.05 (5.01) | −2.50 (0.85), 0.10 | −6.24 (0.34), 0.00 † | 0.52 (0.25), 0.28 |
| Dietary Fiber 1 | 12.68 (0.64) | 7.17 (3.85) | 13.69 (6.15) | 6.72 (2.47) | −1.54 (1.05), 0.28 | −3.55 (2.29), 0.26 | −0.54 (3.87), 0.91 |
| Protein | 1.87 (0.20) | 0.20 (0.64) | 1.16 (0.98) | 1.98 (1.14) | −0.16 (0.29), 0.64 | −0.68 (0.52), 0.32 | 0.88 (0.04), 0.03 § |
| Coffee and Tea | |||||||
| Q1 2 n = 58,259,558 % <EAR (SE) | Q2 n = 3,642,763 % <EAR (SE) | Q3 n = 3,965,805 % <EAR (SE) | Q4 n = 4,105,608 % <EAR (SE) | Quantile Trend 3 Beta (SE), p | Q1 vs. Q2,3,4 4 Beta (SE), p | Q2–4 Trend 5 Beta (SE), p | |
| Calcium | 52.93 (0.90) | 63.97 (2.91) | 51.04 (3.68) | 57.15 (3.53) | 1.37 (2.36), 0.62 | 4.79 (4.22), 0.37 | −3.78 (5.46), 0.61 |
| Magnesium | 53.13 (1.06) | 59.40 (3.11) | 52.39 (3.56) | 55.50 (3.38) | 0.82 (1.31), 0.60 | 2.82 (2.29), 0.34 | −2.15 (2.91), 0.59 |
| Potassium 1 | 37.16 (0.99) | 29.31 (2.72) | 38.10 (4.11) | 41.15 (3.19) | 0.46 (1.91), 0.83 | −1.47 (3.97), 0.75 | 6.04 (1.65), 0.17 |
| Vitamin A | 42.00 (1.15) | 44.86 (3.75) | 44.40 (3.85) | 51.03 (4.46) | 2.47 (0.63), 0.06 | 4.54 (2.27), 0.18 | 2.95 (2.03), 0.38 |
| Vitamin B12 | 4.37 (0.43) | 6.43 (1.78) | 3.80 (1.27) | 2.83 (1.06) | −0.27 (0.54), 0.66 | 0.13 (1.20), 0.92 | −1.84 (0.48), 0.16 |
| Vitamin C | 41.96 (1.06) | 37.60 (3.96) | 49.06 (3.99) | 57.63 (4.53) | 4.08 (2.00), 0.18 | 5.32 (6.42), 0.49 | 10.07 (0.83), 0.05 |
| Vitamin D | 95.09 (0.38) | 97.24 (0.89) | 95.64 (1.33) | 97.19 (0.81) | 0.67 (0.37), 0.21 | 1.61 (0.58), 0.11 | −0.09 (0.90), 0.94 |
| Vitamin E | 84.00 (0.93) | 89.05 (2.41) | 84.48 (2.53) | 85.45 (2.94) | 0.72 (0.99), 0.54 | 2.48 (1.58), 0.26 | −1.91 (1.59), 0.44 |
| Dietary Fiber 1 | 13.18 (0.71) | 12.26 (2.16) | 11.21 (2.41) | 5.79 (1.67) | −1.92 (0.55), 0.07 | −3.18 (2.15), 0.28 | −3.15 (1.25), 0.24 |
| Protein | 1.79 (0.22) | 4.47 (1.20) | 0.95 (0.43) | 1.80 (0.61) | 0.06 (0.62), 0.93 | 0.74 (1.20), 0.60 | −1.42 (1.25), 0.46 |
| Flavored Milk | |||||||
| Q1 2 n = 67,632,660 % <EAR (SE) | Q2 n = 741,030 % <EAR (SE) | Q3 n = 761,003 % <EAR (SE) | Q4 n = 839,040 % <EAR (SE) | Quantile Trend 3 Beta (SE), p | Q1 vs. Q2,3,4 4 Beta (SE), p | Q2–4 Trend 5 Beta (SE), p | |
| Calcium | 54.48 (0.88) | 50.32 (7.71) | 26.34 (8.98) | 21.19 (6.63) | −11.41 (1.71), 0.02 § | −21.85 (9.22), 0.14 | −14.51 (5.27), 0.22 |
| Magnesium | 53.87 (1.03) | 59.56 (6.99) | 43.66 (12.76) | 32.13 (6.60) | −5.80 (2.37), 0.13 | −8.88 (8.21), 0.39 | −13.70 (1.22), 0.06 |
| Potassium 1 | 36.76 (0.92) | 36.15 (10.67) | 53.99 (9.42) | 60.33 (6.48) | 7.48 (1.62), 0.04 § | 13.42 (7.45), 0.21 | 12.06 (3.22), 0.17 |
| Vitamin A | 43.09 (1.10) | 53.03 (7.87) | 25.60 (10.51) | 20.56 (5.34) | −6.64 (3.31), 0.18 | −9.99 (10.35), 0.44 | −16.17 (6.27), 0.24 |
| Vitamin B12 | 4.70 (0.41) | 1.89 (1.63) | 0.19 (0.71) | 0.07 (0.13) | −1.82 (0.30), 0.03 § | −3.98 (0.60), 0.02 § | −0.90 (0.44), 0.29 |
| Vitamin C | 42.88 (1.04) | 56.50 (6.41) | 32.18 (10.22) | 47.04 (6.85) | 0.45 (3.36), 0.91 | 2.69 (7.11), 0.74 | −4.62 (10.97), 0.75 |
| Vitamin D | 95.89 (0.31) | 95.08 (3.49) | 91.81 (11.34) | 73.01 (7.38) | −5.69 (1.99), 0.10 | −9.54 (7.10), 0.31 | −11.08 (4.35), 0.24 |
| Vitamin E | 84.38 (0.85) | 87.14 (5.76) | 90.63 (4.46) | 82.39 (3.90) | 0.57 (1.26), 0.70 | 2.19 (2.43), 0.46 | −2.41 (3.28), 0.60 |
| Dietary Fiber 1 | 12.74 (0.65) | 2.80 (1.60) | 6.67 (2.70) | 12.01 (4.17) | −1.64 (1.86), 0.47 | −5.51 (2.76), 0.18 | 4.61 (0.41), 0.06 |
| Protein | 1.92 (0.21) | 1.36 (1.41) | 0.27 (0.45) | 0.14 (0.32) | −0.65 (0.07), 0.013 § | −1.32 (0.40), 0.08 | −0.61 (0.27), 0.26 |
| Sweetened Beverages | |||||||
|---|---|---|---|---|---|---|---|
| Q1 2 n = 15,059,331 % <EAR (SE) | Q2 n = 4,368,470 % <EAR (SE) | Q3 n = 3,489,802 % <EAR (SE) | Q4 n = 1,968,156 % <EAR (SE) | Quantile Trend 3 Beta (SE), p | Q1 vs. Q2,3,4 4 Beta (SE), p | Q2–4 Trend 5 Beta (SE), p | |
| Calcium | 71.08 (1.31) | 69.14 (1.83) | 75.08 (2.09) | 73.95 (2.64) | 1.20 (1.00), 0.35 | 1.17 (2.58), 0.69 | 2.84 (2.12), 0.41 |
| Magnesium | 63.48 (1.19) | 66.70 (2.17) | 71.61 (2.19) | 74.92 (2.55) | 3.88 (0.22), 0.00 † | 6.71 (3.08), 0.16 | 4.21 (0.48), 0.07 |
| Potassium 1 | 32.45 (1.24) | 27.65 (2.19) | 22.42 (2.01) | 23.16 (2.55) | −3.85 (0.81), 0.04 § | −7.59 (2.30), 0.08 | −2.62 (1.78), 0.38 |
| Vitamin A | 31.18 (1.50) | 30.41 (2.27) | 40.14 (2.64) | 41.62 (3.10) | 3.65 (1.33), 0.11 | 5.04 (4.79), 0.40 | 6.12 (2.47), 0.24 |
| Vitamin B12 | 5.02 (0.73) | 3.42 (0.93) | 4.71 (1.27) | 4.18 (1.08) | −0.29 (0.37), 0.52 | −0.98 (0.54), 0.21 | 0.49 (0.55), 0.53 |
| Vitamin C | 40.36 (1.47) | 30.91 (2.27) | 37.30 (2.44) | 31.76 (3.03) | −2.67 (2.01), 0.32 | −7.05 (2.73), 0.12 | 1.17 (3.57), 0.80 |
| Vitamin D | 92.99 (0.76) | 91.71 (1.11) | 95.42 (0.91) | 94.42 (1.15) | 0.67 (0.64), 0.41 | 0.60 (1.58), 0.74 | 1.65 (1.41), 0.45 |
| Vitamin E | 87.98 (0.81) | 87.84 (1.57) | 91.92 (1.13) | 94.08 (1.57) | 1.92 (0.58), 0.08 | 2.64 (2.39), 0.38 | 3.24 (0.57), 0.11 |
| Dietary Fiber 1 | 13.51 (0.78) | 10.35 (1.32) | 6.22 (0.97) | 5.65 (1.08) | −3.01 (0.42), 0.02 § | −5.62 (2.02), 0.11 | −2.57 (1.07), 0.25 |
| Protein | 5.69 (0.60) | 6.10 (1.25) | 6.58 (0.95) | 4.69 (1.31) | −0.03 (0.33), 0.94 | 0.27 (0.66), 0.72 | −0.56 (0.71), 0.58 |
| Soft Drinks | |||||||
| Q1 2 n = 19,417,069 % <EAR (SE) | Q2 n = 2,365,757 % <EAR (SE) | Q3 n = 1,957,503 % <EAR (SE) | Q4 n = 1,145,430% <EAR (SE) | Quantile Trend 3 Beta (SE), p | Q1 vs. Q2,3,4 4 Beta (SE), p | Q2–4 Trend 5 Beta (SE), p | |
| Calcium | 69.00 (1.18) | 76.51 (1.96) | 81.17 (2.24) | 80.07 (3.02) | 4.92 (1.12), 0.05 § | 9.91 (1.76), 0.03 § | 2.19 (1.76), 0.43 |
| Magnesium | 61.85 (1.02) | 77.72 (2.20) | 81.14 (2.48) | 81.06 (2.70) | 8.42 (2.33), 0.07 | 17.79 (1.37), 0.01 † | 1.92 (1.07), 0.32 |
| Potassium 1 | 32.82 (1.10) | 19.18 (2.26) | 16.73 (2.60) | 18.76 (2.93) | −6.71 (2.23), 0.10 | −14.61 (0.92), 0.00 † | −0.53 (1.37), 0.76 |
| Vitamin A | 30.00 (1.24) | 42.26 (2.93) | 46.67 (4.05) | 49.63 (4.61) | 7.70 (1.39), 0.03 § | 15.35 (2.39), 0.02 § | 3.79 (0.44), 0.07 |
| Vitamin B12 | 4.76 (0.65) | 3.55 (1.01) | 5.80 (1.51) | 5.43 (2.03) | 0.22 (0.41), 0.65 | −0.02 (0.86), 0.99 | 1.12 (0.80), 0.39 |
| Vitamin C | 34.49 (1.27) | 44.16 (2.99) | 52.34 (3.68) | 43.49 (4.48) | 5.82 (2.40), 0.14 | 12.48 (3.30), 0.06 | 0.87 (5.20), 0.89 |
| Vitamin D | 92.09 (0.65) | 95.00 (1.12) | 97.39 (0.76) | 96.02 (1.07) | 1.96 (0.55), 0.07 | 3.99 (0.87), 0.04 § | 0.78 (1.15), 0.62 |
| Vitamin E | 86.62 (0.81) | 95.03 (1.14) | 96.88 (0.88) | 96.52 (1.35) | 4.42 (1.26), 0.07 | 9.38 (0.71), 0.01 † | 0.90 (0.68), 0.41 |
| Dietary Fiber 1 | 13.57 (0.70) | 5.75 (1.04) | 3.40 (0.81) | 3.55 (1.10) | −4.38 (1.12), 0.06 | −9.12 (0.93), 0.01 § | −1.27 (0.76), 0.34 |
| Protein | 5.74 (0.57) | 5.69 (1.18) | 6.90 (1.26) | 5.70 (1.57) | 0.21 (0.23), 0.46 | 0.38 (0.47), 0.50 | 0.18 (0.74), 0.85 |
| Fruit Drinks | |||||||
| Q1 2 n = 20,768,028 % <EAR (SE) | Q2 n = 1,708,930 % <EAR (SE) | Q3 n = 1,541,335 % <EAR (SE) | Q4 n = 867,465 % <EAR (SE) | Quantile Trend 3 Beta (SE), p | Q1 vs. Q2,3,4 4 Beta (SE), p | Q2–4 Trend 5 Beta (SE), p | |
| Calcium | 71.22 (1.06) | 68.38 (3.02) | 74.85 (3.10) | 66.46 (4.28) | −0.43 (1.37), 0.78 | −0.89 (2.76), 0.78 | −0.15 (4.55), 0.98 |
| Magnesium | 65.42 (0.93) | 62.05 (3.01) | 69.47 (3.59) | 65.72 (3.99) | 0.53 (1.21), 0.70 | 0.20 (2.54), 0.94 | 2.44 (3.42), 0.61 |
| Potassium 1 | 29.40 (1.05) | 33.33 (3.33) | 23.86 (3.48) | 33.82 (3.65) | 0.10 (1.81), 0.96 | 0.56 (3.63), 0.89 | −0.81 (5.95), 0.91 |
| Vitamin A | 33.33 (1.33) | 25.38 (2.83) | 34.43 (3.95) | 35.88 (3.82) | 0.02 (2.00), 0.99 | −2.23 (3.70), 0.61 | 5.66 (2.33), 0.25 |
| Vitamin B12 | 4.75 (0.62) | 2.43 (1.22) | 5.13 (1.74) | 2.32 (1.29) | −0.57 (0.57), 0.43 | −1.36 (1.03), 0.32 | 0.24 (1.69), 0.91 |
| Vitamin C | 42.39 (1.21) | 14.90 (3.11) | 4.65 (3.87) | 1.54 (1.37) | −16.69 (3.26), 0.04 § | −34.30 (4.47), 0.02 § | −7.06 (2.19), 0.19 |
| Vitamin D | 93.21 (0.54) | 93.15 (1.63) | 93.52 (1.49) | 92.22 (2.54) | −0.13 (0.17), 0.53 | −0.14 (0.38), 0.75 | −0.38 (0.51), 0.60 |
| Vitamin E | 88.74 (0.65) | 89.06 (2.20) | 94.42 (1.94) | 90.74 (2.36) | 1.44 (0.83), 0.23 | 2.67 (1.86), 0.29 | 1.33 (2.77), 0.72 |
| Dietary Fiber 1 | 11.49 (0.57) | 13.56 (1.90) | 6.64 (1.67) | 8.50 (1.93) | −1.27 (0.99), 0.33 | −1.62 (2.44), 0.57 | −3.01 (2.69), 0.46 |
| Protein | 5.48 (0.47) | 4.69 (1.68) | 8.05 (2.15) | 4.31 (1.46) | 0.20 (0.65), 0.79 | 0.36 (1.32), 0.81 | 0.19 (2.18), 0.94 |
| Sports and Energy Drinks | |||||||
| Q1 2 n = 24,399,415 % <EAR (SE) | Q2 n = 230,617 % <EAR (SE) | Q3 n = 192,969 % <EAR (SE) | Q4 n = 132,236 % <EAR (SE) | Quantile Trend 3 Beta (SE), p | Q1 vs. Q2,3,4 4 Beta (SE), p | Q2–4 Trend 5 Beta (SE), p | |
| Calcium | 71.32 (0.96) | 70.47 (8.48) | 46.56 (12.07) | 75.64 (8.58) | −3.01 (4.45), 0.57 | −6.92 (8.69), 0.51 | 0.72 (14.93), 0.97 |
| Magnesium | 65.70 (0.91) | 57.64 (7.44) | 44.56 (14.31) | 67.07 (6.99) | −3.76 (3.67), 0.41 | −9.60 (6.17), 0.26 | 3.46 (10.03), 0.79 |
| Potassium 1 | 29.43 (0.96) | 43.37 (9.51) | 46.18 (10.97) | 31.06 (7.04) | 4.28 (3.41), 0.34 | 11.50 (4.35), 0.12 | −5.52 (5.05), 0.47 |
| Vitamin A | 32.89 (1.20) | 30.40 (8.98) | 29.01 (11.18) | 50.04 (8.50) | 2.56 (2.73), 0.45 | 2.36 (6.41), 0.75 | 9.03 (6.32), 0.39 |
| Vitamin B12 | 4.51 (0.53) | 0.00 (0.68) | 2.68 (4.57) | 0.43 (1.33) | −1.54 (0.73), 0.17 | −3.56 (0.84), 0.05 | 0.39 (1.39), 0.83 |
| Vitamin C | 37.09 (1.12) | 39.71 (13.07) | 29.32 (10.17) | 39.76 (14.35) | −0.39 (1.69), 0.84 | −0.61 (3.44), 0.88 | −0.71 (5.87), 0.92 |
| Vitamin D | 93.30 (0.49) | 89.88 (7.63) | 91.06 (3.60) | 95.12 (2.58) | −0.33 (0.93), 0.76 | −1.65 (1.54), 0.40 | 2.52 (0.81), 0.20 |
| Vitamin E | 89.41 (0.63) | 85.16 (5.54) | 58.87 (19.32) | 90.67 (5.06) | −4.83 (5.01), 0.44 | −10.97 (9.53), 0.37 | 0.70 (16.36), 0.97 |
| Dietary Fiber 1 | 11.27 (0.56) | 11.89 (6.51) | 20.27 (9.08) | 10.70 (4.94) | 1.32 (1.51), 0.47 | 2.91 (2.94), 0.43 | 0.03 (5.05), 1.00 |
| Protein | 5.59 (0.47) | 4.01 (4.65) | 2.18 (3.40) | 10.39 (4.72) | 0.27 (1.14), 0.83 | −0.43 (2.33), 0.87 | 2.83 (2.83), 0.50 |
| Coffee and Tea | |||||||
| Q1 2 n = 21,570,292 % <EAR (SE) | Q2 n = 1,358,056 % <EAR (SE) | Q3 n = 1,043,372 % <EAR (SE) | Q4 n = 914,039 % <EAR (SE) | Quantile Trend 3 Beta (SE), p | Q1 vs. Q2,3,4 4 Beta (SE), p | Q2–4 Trend 5 Beta (SE), p | |
| Calcium | 70.42 (1.00) | 78.43 (2.84) | 71.42 (3.30) | 74.94 (5.01) | 1.91 (1.75), 0.39 | 5.12 (2.30), 0.16 | −2.40 (2.98), 0.57 |
| Magnesium | 64.81 (0.95) | 71.02 (3.19) | 65.15 (4.42) | 68.79 (5.97) | 1.49 (1.39), 0.39 | 3.94 (1.92), 0.18 | −1.71 (2.69), 0.64 |
| Potassium 1 | 29.82 (1.12) | 23.50 (3.24) | 28.82 (3.85) | 29.93 (5.84) | −0.86 (1.54), 0.63 | −3.29 (2.21), 0.27 | 3.48 (1.19), 0.21 |
| Vitamin A | 31.96 (1.18) | 39.53 (4.33) | 33.23 (4.78) | 44.00 (7.01) | 3.30 (1.67), 0.19 | 6.64 (2.99), 0.16 | 1.18 (4.83), 0.85 |
| Vitamin B12 | 4.55 (0.56) | 5.50 (1.91) | 3.02 (1.76) | 4.17 (2.45) | −0.22 (0.40), 0.64 | −0.09 (0.82), 0.92 | −0.89 (1.03), 0.55 |
| Vitamin C | 36.24 (1.16) | 40.56 (4.31) | 39.35 (3.97) | 51.36 (7.25) | 3.81 (1.19), 0.09 | 6.32 (3.56), 0.22 | 4.58 (3.74), 0.44 |
| Vitamin D | 92.72 (0.52) | 96.87 (1.04) | 91.97 (2.20) | 97.02 (1.82) | 1.14 (1.05), 0.39 | 2.70 (1.73), 0.26 | −0.54 (2.81), 0.88 |
| Vitamin E | 88.83 (0.72) | 93.05 (1.55) | 88.25 (2.94) | 92.27 (3.48) | 1.02 (1.03), 0.43 | 2.59 (1.60), 0.25 | −0.94 (2.49), 0.77 |
| Dietary Fiber 1 | 11.75 (0.66) | 9.64 (2.04) | 9.12 (2.22) | 5.23 (2.68) | −1.88 (0.30), 0.02 § | −3.23 (1.33), 0.14 | −2.00 (0.95), 0.28 |
| Protein | 5.34 (0.49) | 8.54 (1.90) | 4.34 (1.81) | 6.47 (1.95) | 0.40 (0.84), 0.68 | 1.47 (1.38), 0.40 | −1.43 (1.79), 0.57 |
| Flavored Milk | |||||||
| Q1 2 n = 23,803,445 % <EAR (SE) | Q2 n = 375,093 % <EAR (SE) | Q3 n = 382,403 % <EAR (SE) | Q4 n = 324,817 % <EAR (SE) | Quantile Trend 3 Beta (SE), p | Q1 vs. Q2,3,4 4 Beta (SE), p | Q2–4 Trend 5 Beta (SE), p | |
| Calcium | 72.01 (0.97) | 61.22 (7.24) | 58.26 (7.57) | 30.89 (7.78) | −11.49 (2.20), 0.03 § | −21.05 (9.70), 0.16 | −14.80 (6.94), 0.28 |
| Magnesium | 65.75 (0.91) | 71.19 (7.36) | 52.40 (8.96) | 36.71 (6.14) | −7.61 (2.98), 0.13 | −11.22 (10.28), 0.39 | −17.29 (0.88), 0.03 § |
| Potassium 1 | 29.14 (0.95) | 21.30 (7.46) | 32.28 (8.56) | 54.15 (6.44) | 5.09 (3.53), 0.29 | 5.79 (9.83), 0.62 | 16.26 (3.10), 0.12 |
| Vitamin A | 33.12 (1.20) | 28.84 (8.47) | 23.18 (9.00) | 19.99 (6.45) | −4.54 (0.20), 0.00 † | −8.83 (2.68), 0.08 | −4.46 (0.70), 0.10 |
| Vitamin B12 | 4.62 (0.54) | 8.62 (5.31) | 0.22 (0.80) | 0.34 (0.40) | −1.22 (1.16), 0.40 | −1.25 (2.91), 0.71 | −4.27 (2.42), 0.33 |
| Vitamin C | 37.11 (1.16) | 35.64 (7.88) | 30.16 (7.69) | 37.72 (6.25) | −1.00 (1.19), 0.49 | −2.60 (2.26), 0.37 | 0.84 (3.71), 0.86 |
| Vitamin D | 93.74 (0.48) | 93.49 (3.64) | 97.99 (3.60) | 75.30 (8.07) | −3.28 (2.73), 0.35 | −4.38 (6.90), 0.59 | −8.69 (7.73), 0.46 |
| Vitamin E | 89.47 (0.65) | 92.07 (2.72) | 93.30 (3.95) | 76.92 (7.28) | −1.88 (2.18), 0.48 | −1.66 (5.26), 0.78 | −7.31 (5.01), 0.38 |
| Dietary Fiber 1 | 11.39 (0.57) | 5.53 (2.97) | 7.15 (3.34) | 13.58 (5.77) | −0.62 (1.45), 0.71 | −2.87 (2.48), 0.37 | 3.95 (1.37), 0.21 |
| Protein | 5.62 (0.45) | 9.58 (4.66) | 2.71 (1.68) | 0.73 (1.00) | −1.14 (1.10), 0.41 | −0.98 (2.79), 0.76 | −4.50 (1.39), 0.19 |
Disclaimer/Publisher’s Note: The statements, opinions and data contained in all publications are solely those of the individual author(s) and contributor(s) and not of MDPI and/or the editor(s). MDPI and/or the editor(s) disclaim responsibility for any injury to people or property resulting from any ideas, methods, instructions or products referred to in the content. |
© 2023 by the authors. Licensee MDPI, Basel, Switzerland. This article is an open access article distributed under the terms and conditions of the Creative Commons Attribution (CC BY) license (https://creativecommons.org/licenses/by/4.0/).
Share and Cite
Ricciuto, L.; Fulgoni, V.L., III; Gaine, P.C.; Scott, M.O.; DiFrancesco, L. Intakes of Added Sugars, with a Focus on Beverages and the Associations with Nutrient Adequacy in US Adults (NHANES 2003–2018). Nutrients 2023, 15, 3916. https://doi.org/10.3390/nu15183916
Ricciuto L, Fulgoni VL III, Gaine PC, Scott MO, DiFrancesco L. Intakes of Added Sugars, with a Focus on Beverages and the Associations with Nutrient Adequacy in US Adults (NHANES 2003–2018). Nutrients. 2023; 15(18):3916. https://doi.org/10.3390/nu15183916
Chicago/Turabian StyleRicciuto, Laurie, Victor L. Fulgoni, III, P. Courtney Gaine, Maria O. Scott, and Loretta DiFrancesco. 2023. "Intakes of Added Sugars, with a Focus on Beverages and the Associations with Nutrient Adequacy in US Adults (NHANES 2003–2018)" Nutrients 15, no. 18: 3916. https://doi.org/10.3390/nu15183916
APA StyleRicciuto, L., Fulgoni, V. L., III, Gaine, P. C., Scott, M. O., & DiFrancesco, L. (2023). Intakes of Added Sugars, with a Focus on Beverages and the Associations with Nutrient Adequacy in US Adults (NHANES 2003–2018). Nutrients, 15(18), 3916. https://doi.org/10.3390/nu15183916