
Dietary ω3 Fatty Acids and Phytosterols in the Modulation of the HDL Lipidome: A Longitudinal Crossover Clinical Study

 ,
,  , ,
, , 

Abstract
:1. Introduction
2. Materials and Methods
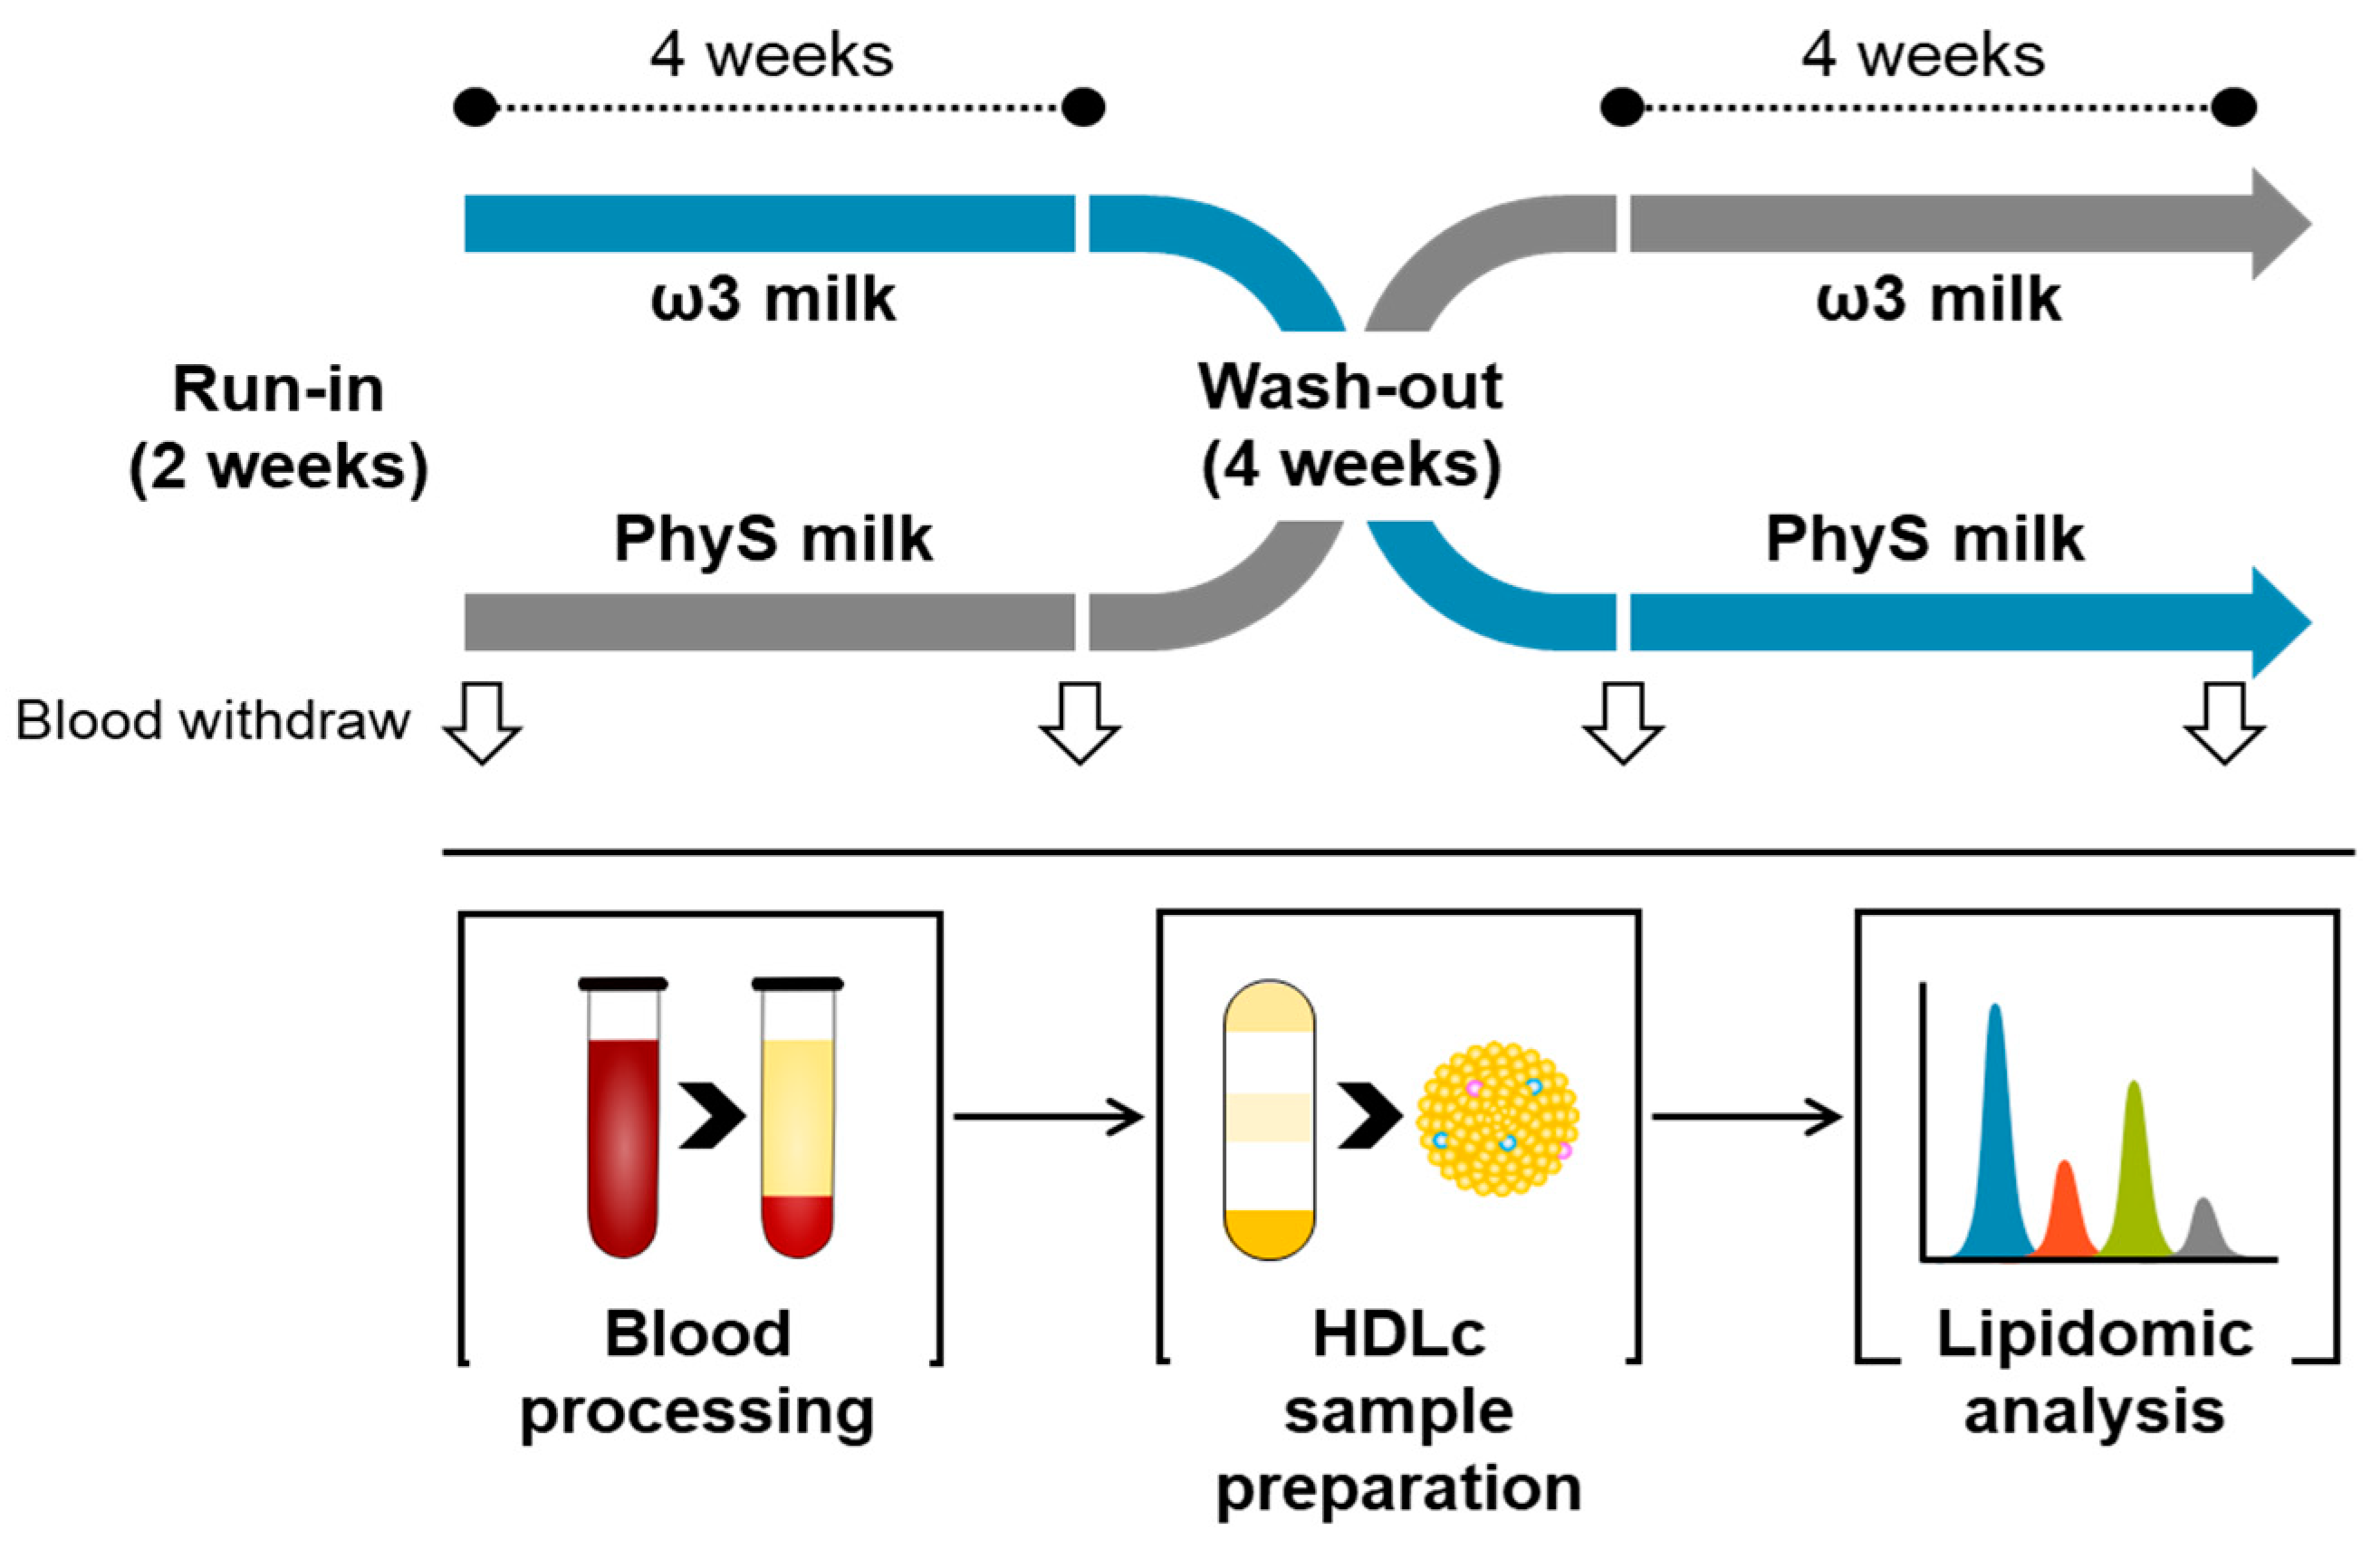
2.1. Study Design
2.2. Blood Sampling
2.3. HDL Sample Preparation and Purity Control
2.4. Metabolite Extraction
2.5. Lipidomic Pattern Analysis
2.6. Statistics
3. Results
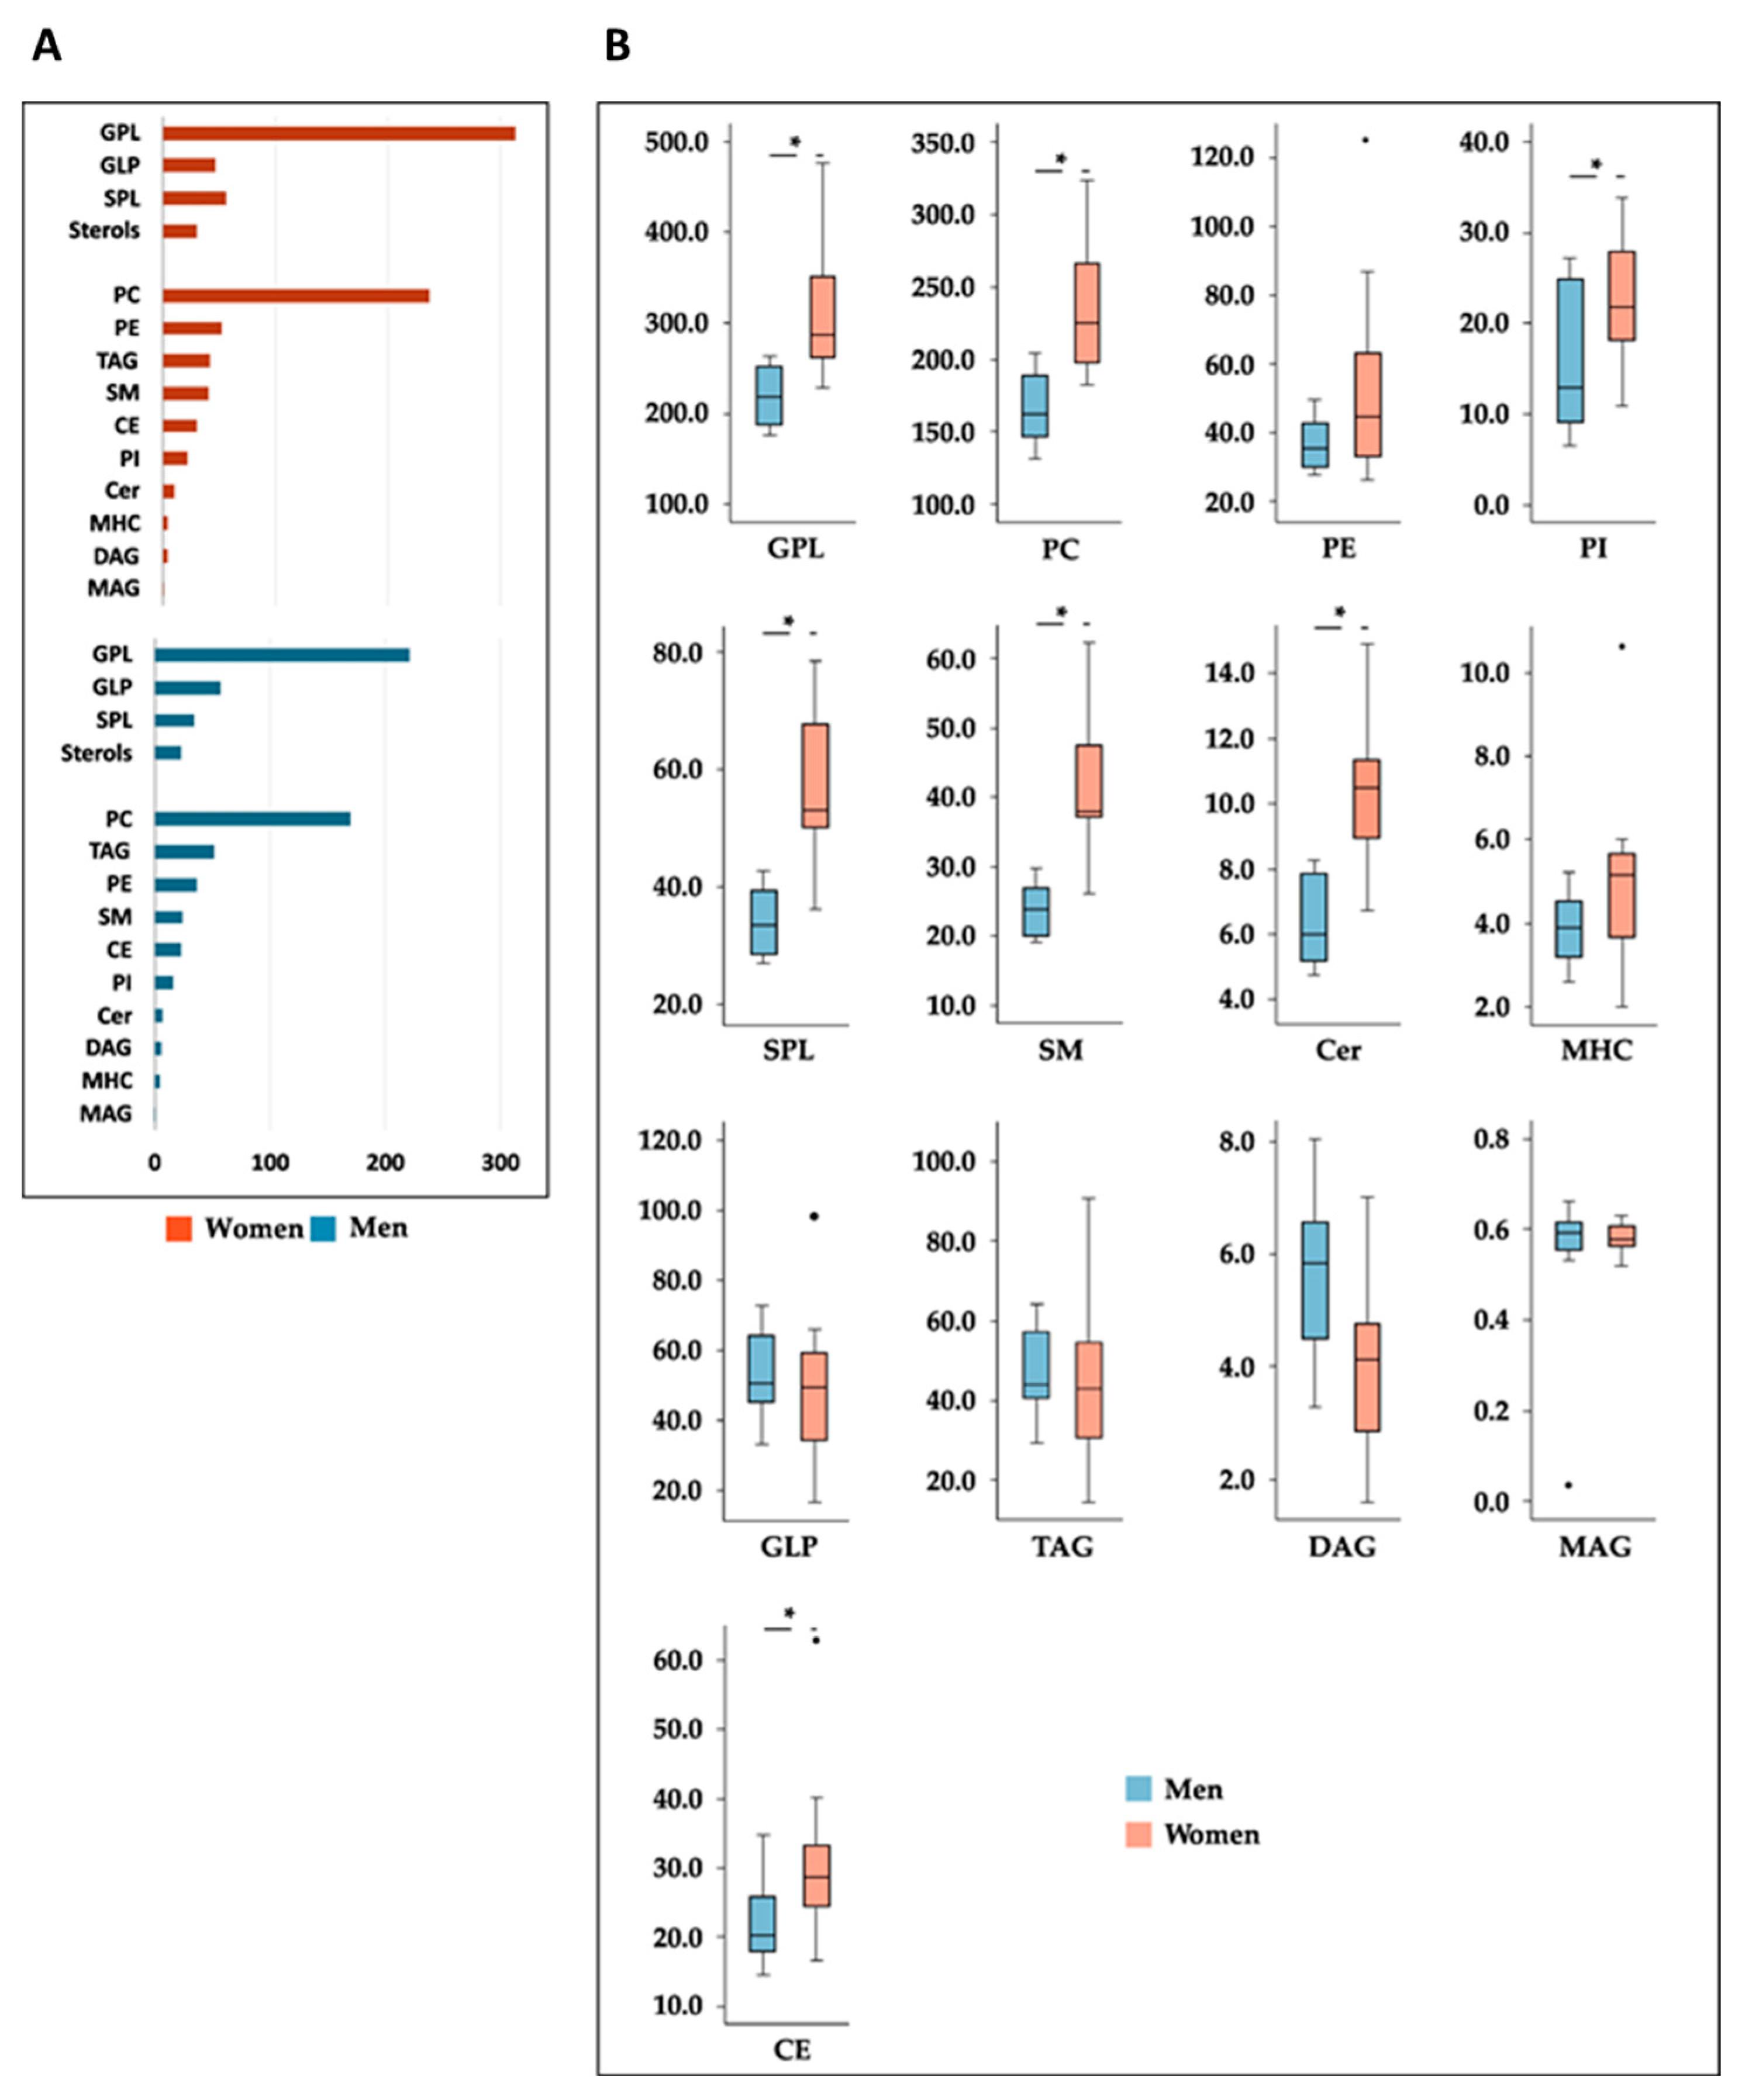
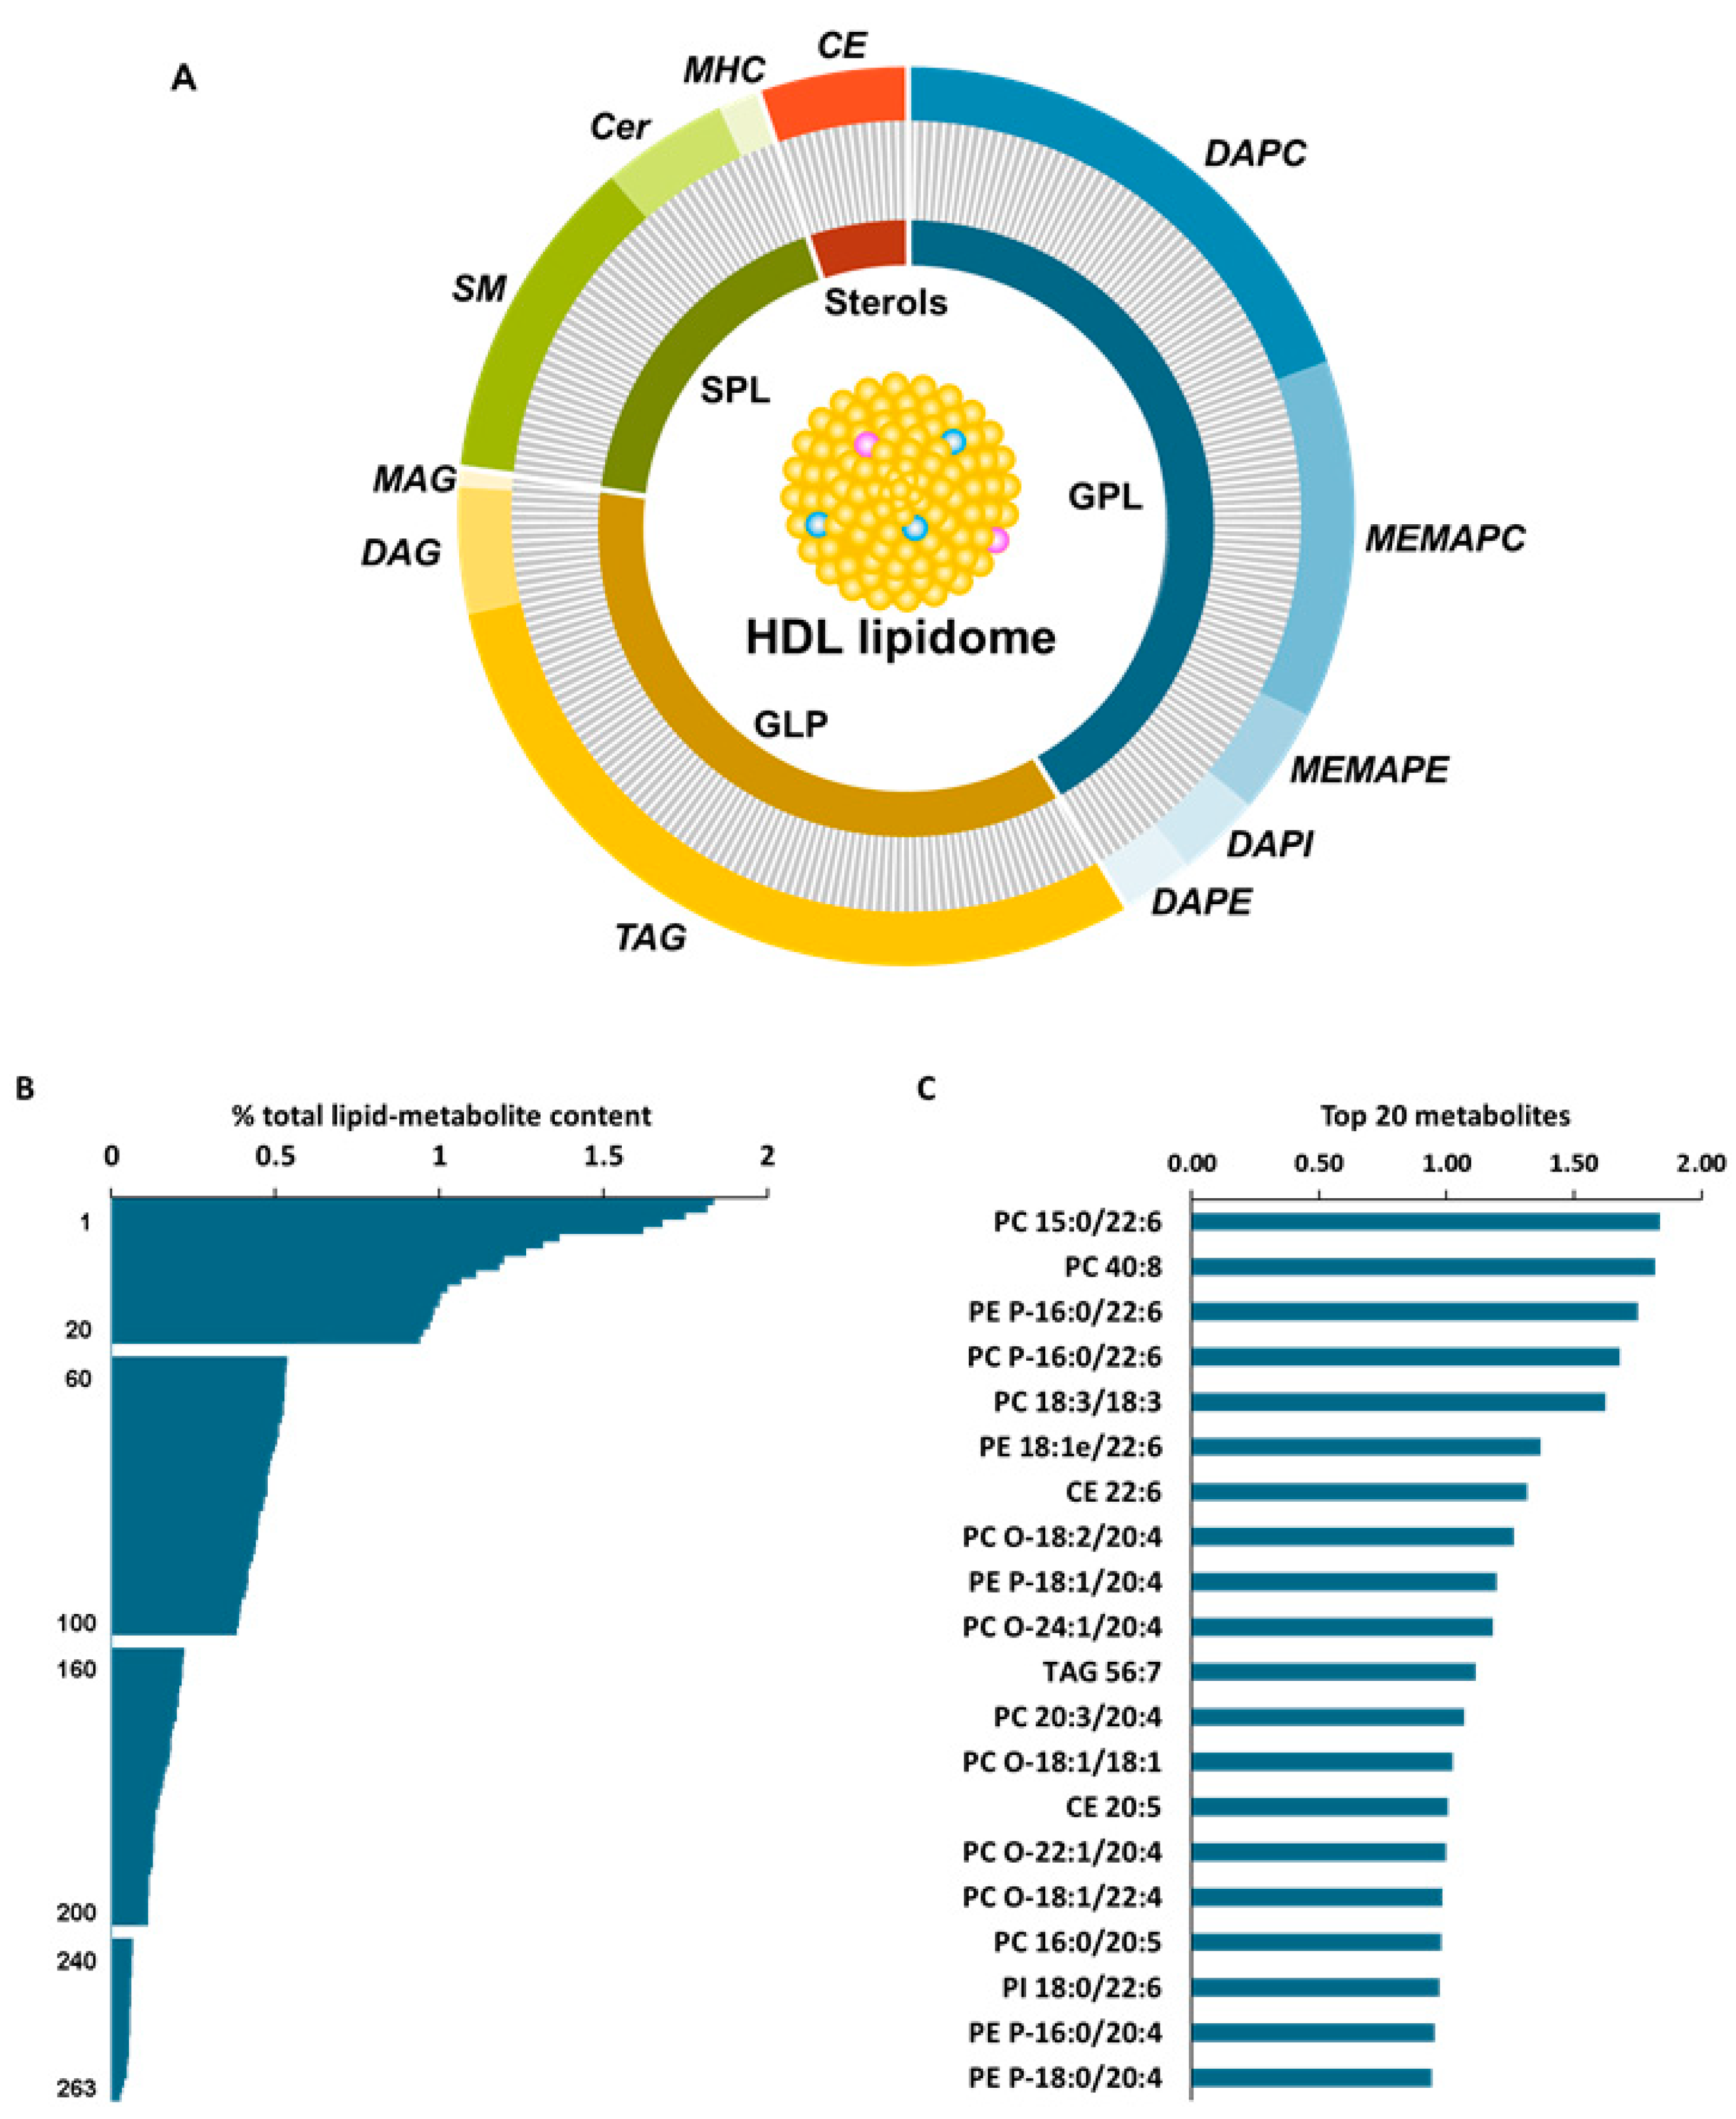
3.1. HDL Lipidome
3.2. Effects of Dietary Treatments on HDL Lipid Profile
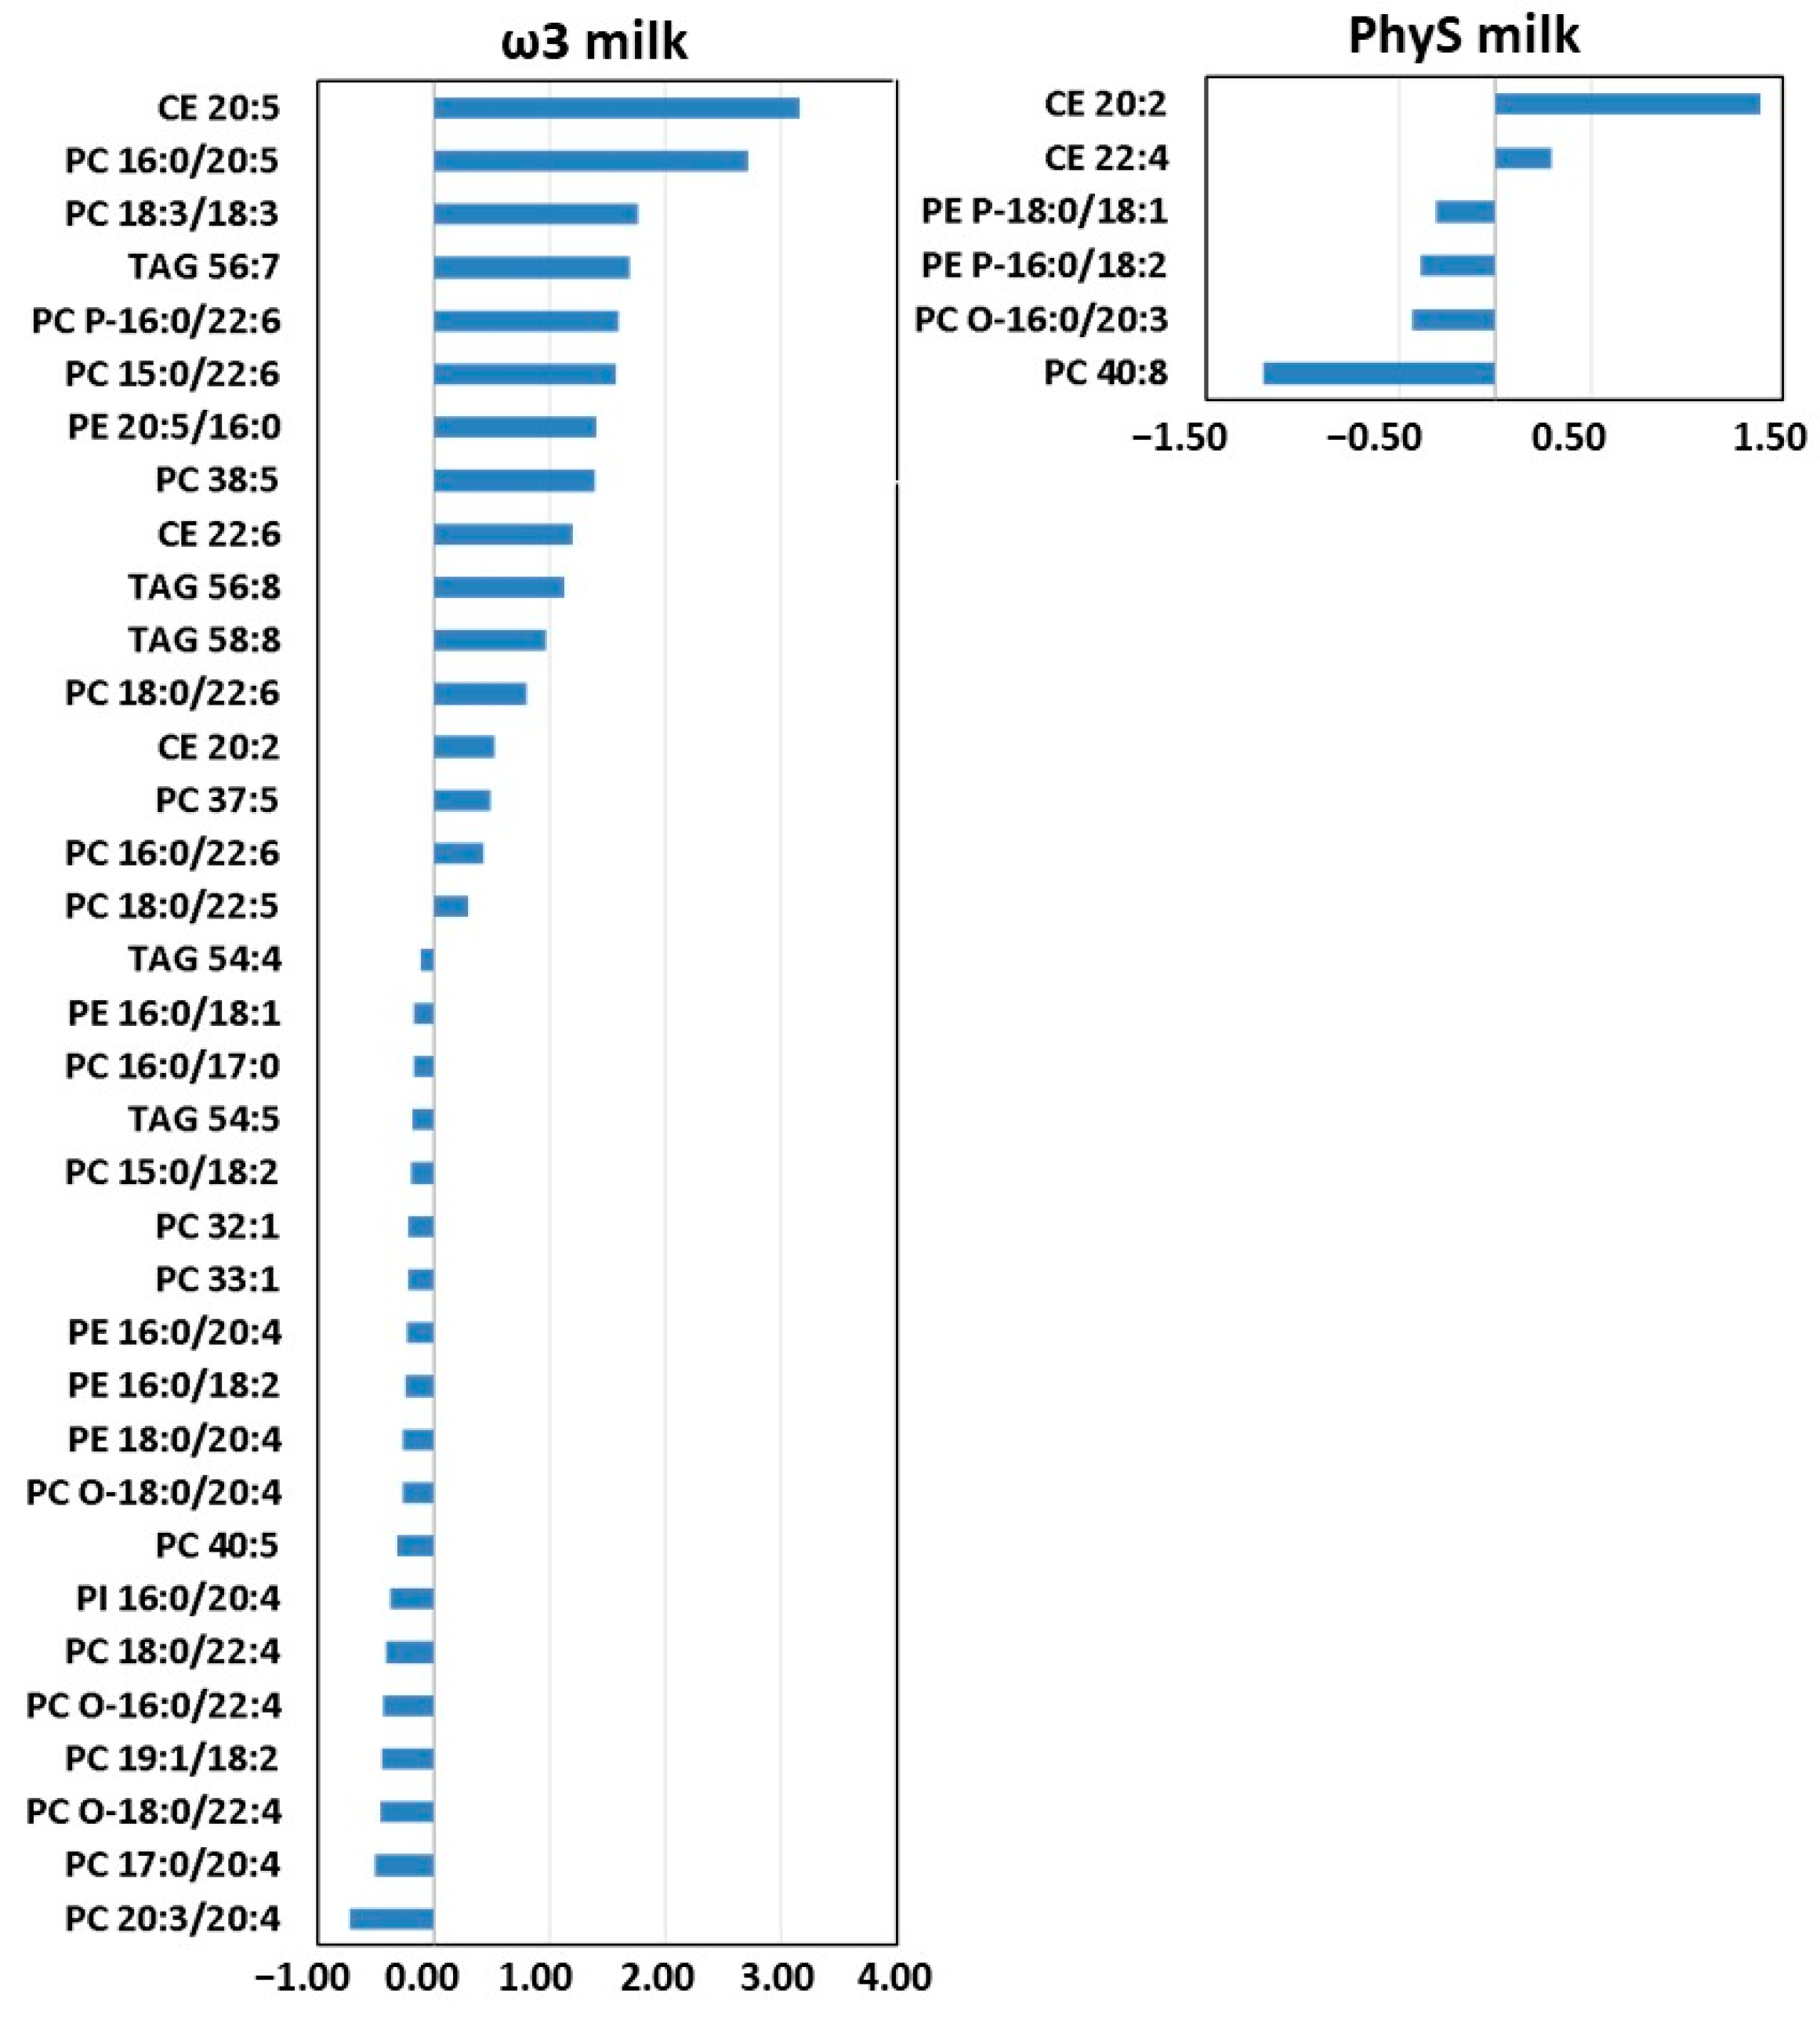
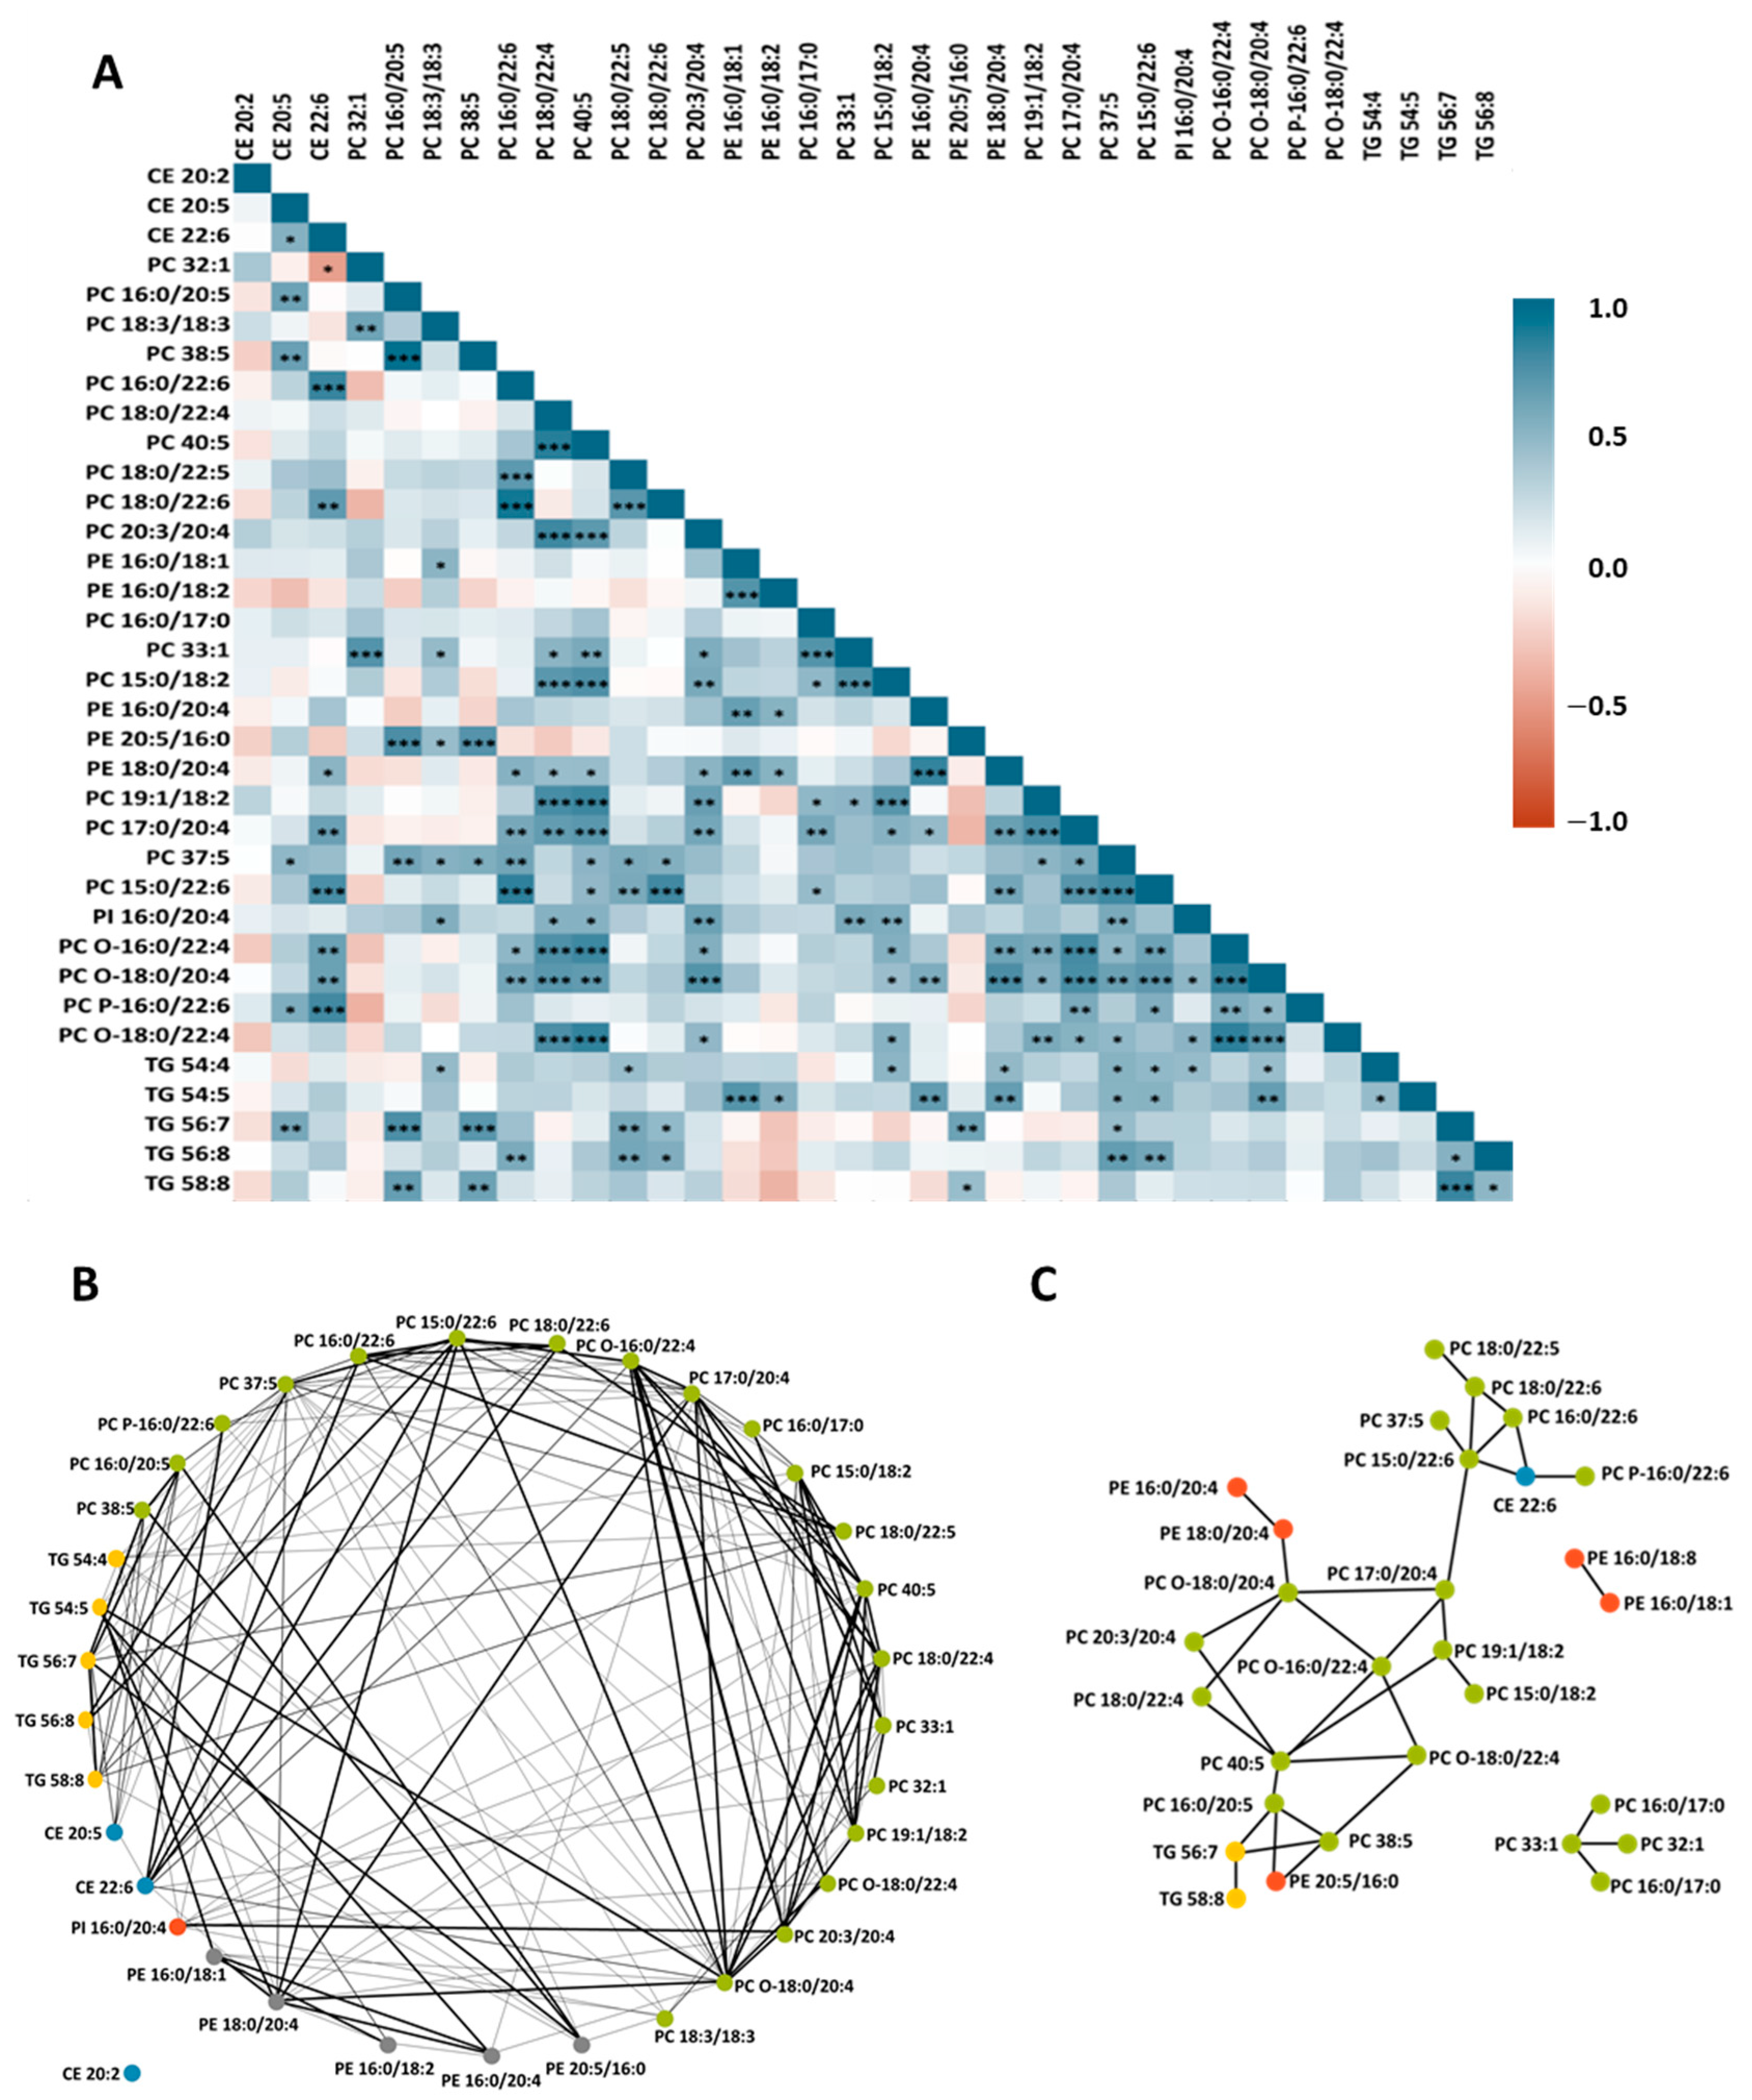
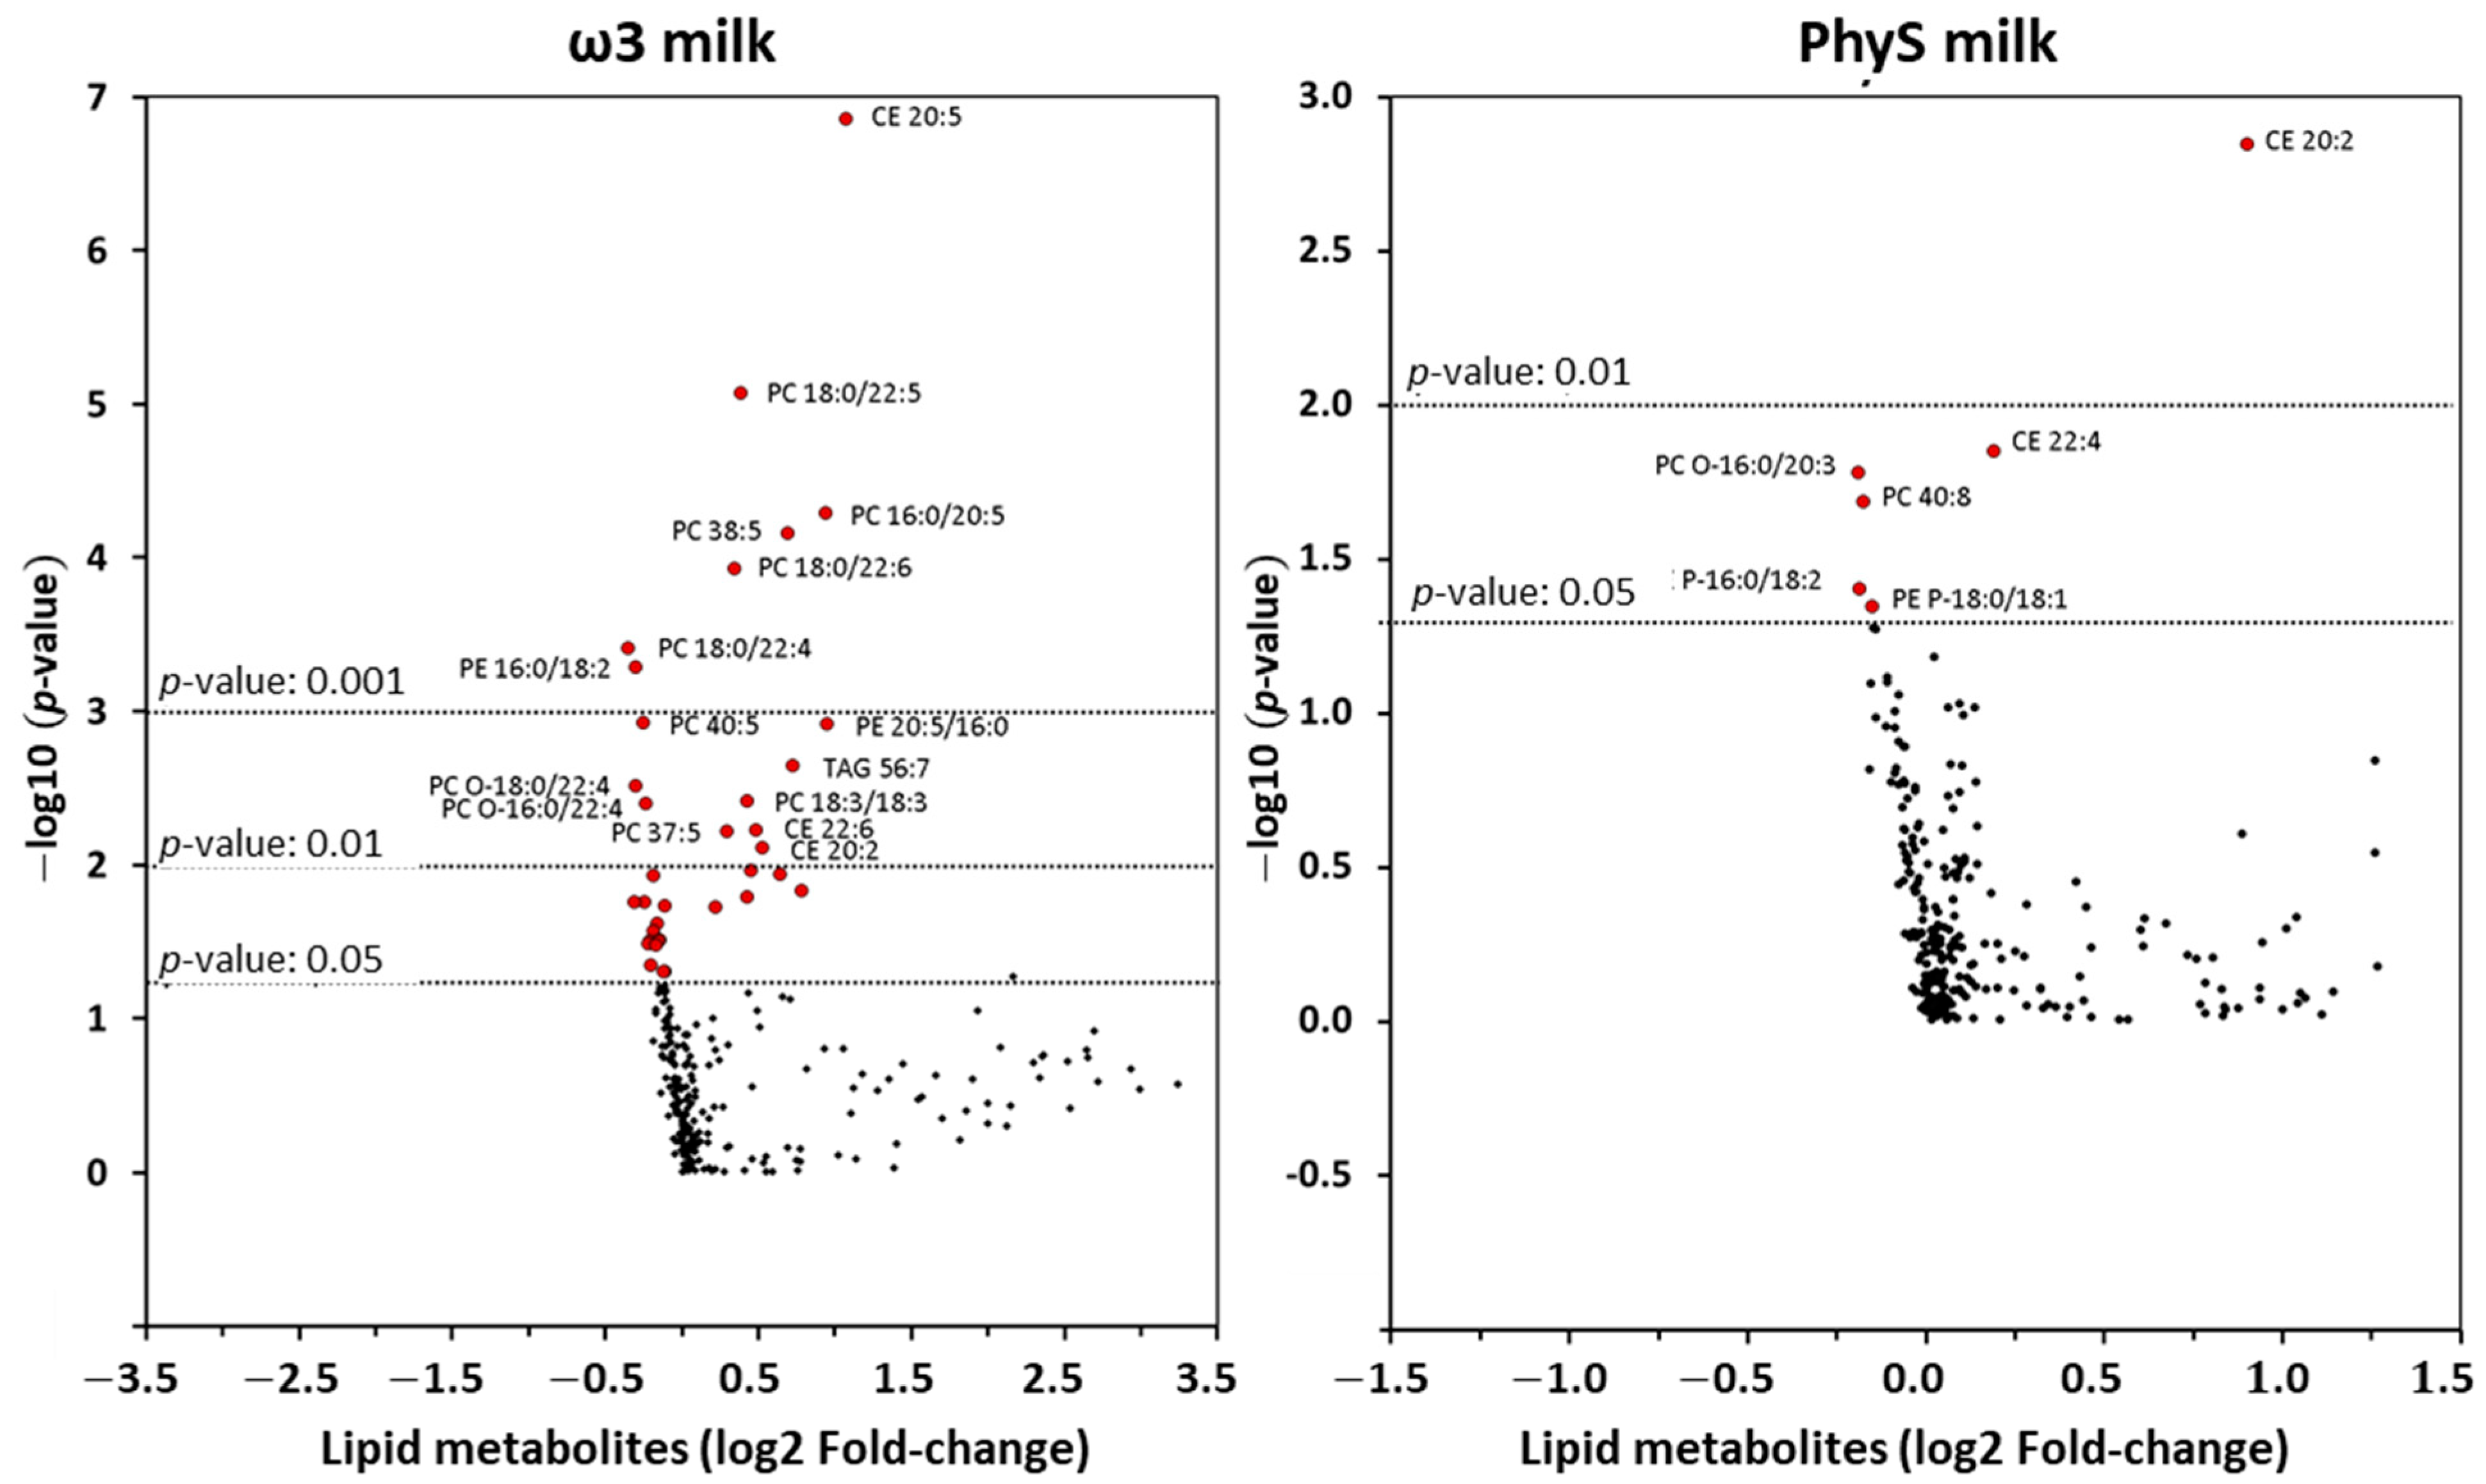
3.2.1. Effect of ω3 Milk on the HDL Lipidome
3.2.2. Effect of PhyS Milk on the HDL Lipidome
3.3. Sex-Related Differences in the Effects of Milk Supplementation
4. Discussion
5. Conclusions
Supplementary Materials
Author Contributions
Funding
Institutional Review Board Statement
Informed Consent Statement
Data Availability Statement
Acknowledgments
Conflicts of Interest
References
- Badimon, L.; Vilahur, G. LDL-cholesterol versus HDL-cholesterol in the Atherosclerotic Plaque: Inflammatory Resolution versus Thrombotic Chaos. Ann. N. Y. Acad. Sci. 2012, 1254, 18–32. [Google Scholar] [CrossRef]
- Rye, K.-A.; Bursill, C.A.; Lambert, G.; Tabet, F.; Barter, P.J. The Metabolism and Anti-Atherogenic Properties of HDL. J. Lipid Res. 2009, 50, S195–S200. [Google Scholar] [CrossRef] [PubMed]
- Ben-Aicha, S.; Badimon, L.; Vilahur, G. Advances in HDL: Much More than Lipid Transporters. Int. J. Mol. Sci. 2020, 21, 732. [Google Scholar] [CrossRef] [PubMed]
- Kontush, A.; Lhomme, M.; Chapman, M.J. Unraveling the Complexities of the HDL Lipidome1. J. Lipid Res. 2013, 54, 2950–2963. [Google Scholar] [CrossRef] [PubMed]
- Lo Prete, A.C.; Dina, C.H.; Azevedo, C.H.; Puk, C.G.; Lopes, N.H.M.; Hueb, W.A.; Maranhão, R.C. In Vitro Simultaneous Transfer of Lipids to HDL in Coronary Artery Disease and in Statin Treatment. Lipids 2009, 44, 917–924. [Google Scholar] [CrossRef] [PubMed]
- Wiesner, P.; Leidl, K.; Boettcher, A.; Schmitz, G.; Liebisch, G. Lipid Profiling of FPLC-Separated Lipoprotein Fractions by Electrospray Ionization Tandem Mass Spectrometry. J. Lipid Res. 2009, 50, 574–585. [Google Scholar] [CrossRef]
- Thakkar, H.; Vincent, V.; Sen, A.; Singh, A.; Roy, A. Changing Perspectives on HDL: From Simple Quantity Measurements to Functional Quality Assessment. J. Lipids 2021, 2021, 5585521. [Google Scholar] [CrossRef]
- Kostara, C.E.; Ferrannini, E.; Bairaktari, E.T.; Papathanasiou, A.; Elisaf, M.; Tsimihodimos, V. Early Signs of Atherogenic Features in the HDL Lipidomes of Normolipidemic Patients Newly Diagnosed with Type 2 Diabetes. Int. J. Mol. Sci. 2020, 21, 8835. [Google Scholar] [CrossRef]
- Stadler, J.T.; Lackner, S.; Mörkl, S.; Trakaki, A.; Scharnagl, H.; Borenich, A.; Wonisch, W.; Mangge, H.; Zelzer, S.; Meier-Allard, N. Obesity Affects HDL Metabolism, Composition and Subclass Distribution. Biomedicines 2021, 9, 242. [Google Scholar] [CrossRef]
- Averill, M.; Rubinow, K.B.; Cain, K.; Wimberger, J.; Babenko, I.; Becker, J.O.; Foster-Schubert, K.E.; Cummings, D.E.; Hoofnagle, A.N.; Vaisar, T. Postprandial Remodeling of High-Density Lipoprotein Following High Saturated Fat and High Carbohydrate Meals. J. Clin. Lipidol. 2020, 14, 66–76. [Google Scholar] [CrossRef]
- Fernández-Castillejo, S.; Pedret, A.; Catalán, Ú.; Valls, R.; Farràs, M.; Rubió, L.; Castañer, O.; Macià, A.; Fitó, M.; Motilva, M.J. Virgin Olive Oil Phenolic Compounds Modulate the HDL Lipidome in Hypercholesterolaemic Subjects: A Lipidomic Analysis of the VOHF Study. Mol. Nutr. Food Res. 2021, 65, 2001192. [Google Scholar] [CrossRef] [PubMed]
- Zhu, C.; Sawrey-Kubicek, L.; Beals, E.; Hughes, R.L.; Rhodes, C.H.; Sacchi, R.; Zivkovic, A.M. The HDL Lipidome Is Widely Remodeled by Fast Food versus Mediterranean Diet in 4 Days. Metabolomics 2019, 15, 114. [Google Scholar] [CrossRef] [PubMed]
- Andersen, C.J.; Blesso, C.N.; Lee, J.; Barona, J.; Shah, D.; Thomas, M.J.; Fernandez, M.L. Egg Consumption Modulates HDL Lipid Composition and Increases the Cholesterol-Accepting Capacity of Serum in Metabolic Syndrome. Lipids 2013, 48, 557–567. [Google Scholar] [CrossRef]
- Peña-de-la-Sancha, P.; Muñoz-García, A.; Espínola-Zavaleta, N.; Bautista-Pérez, R.; Mejía, A.M.; Luna-Luna, M.; López-Olmos, V.; Rodríguez-Pérez, J.-M.; Fragoso, J.-M.; Carreón-Torres, E. Eicosapentaenoic and Docosahexaenoic Acid Supplementation Increases HDL Content in N-3 Fatty Acids and Improves Endothelial Function in Hypertriglyceridemic Patients. Int. J. Mol. Sci. 2023, 24, 5390. [Google Scholar] [CrossRef] [PubMed]
- Lambert, C.; Cubedo, J.; Padró, T.; Sánchez-Hernández, J.; Antonijoan, R.M.; Perez, A.; Badimon, L. Phytosterols and Omega 3 Supplementation Exert Novel Regulatory Effects on Metabolic and Inflammatory Pathways: A Proteomic Study. Nutrients 2017, 9, 599. [Google Scholar] [CrossRef] [PubMed]
- Padro, T.; Vilahur, G.; Sánchez-Hernández, J.; Hernández, M.; Antonijoan, R.M.; Perez, A.; Badimon, L. Lipidomic Changes of LDL in Overweight and Moderately Hypercholesterolemic Subjects Taking Phytosterol-and Omega-3-Supplemented Milk. J. Lipid Res. 2015, 56, 1043–1056. [Google Scholar] [CrossRef]
- Cubedo, J.; Padró, T.; Alonso, R.; Mata, P.; Badimon, L. ApoL1 Levels in High Density Lipoprotein and Cardiovascular Event Presentation in Patients with Familial Hypercholesterolemia [S]. J. Lipid Res. 2016, 57, 1059–1073. [Google Scholar] [CrossRef]
- Barr, J.; Vazquez-Chantada, M.; Alonso, C.; Pérez-Cormenzana, M.; Mayo, R.; Galán, A.; Caballería, J.; Martín-Duce, A.; Tran, A.; Wagner, C. Liquid Chromatography− Mass Spectrometry-Based Parallel Metabolic Profiling of Human and Mouse Model Serum Reveals Putative Biomarkers Associated with the Progression of Nonalcoholic Fatty Liver Disease. J. Proteome Res. 2010, 9, 4501–4512. [Google Scholar] [CrossRef]
- Barr, J.; Caballería, J.; Martínez-Arranz, I.; Domínguez-Díez, A.; Alonso, C.; Muntané, J.; Pérez-Cormenzana, M.; García-Monzón, C.; Mayo, R.; Martín-Duce, A. Obesity-Dependent Metabolic Signatures Associated with Nonalcoholic Fatty Liver Disease Progression. J. Proteome Res. 2012, 11, 2521–2532. [Google Scholar] [CrossRef]
- Martínez-Arranz, I.; Mayo, R.; Pérez-Cormenzana, M.; Mincholé, I.; Salazar, L.; Alonso, C.; Mato, J.M. Enhancing Metabolomics Research through Data Mining. J. Proteom. 2015, 127, 275–288. [Google Scholar] [CrossRef]
- Fahy, E.; Subramaniam, S.; Brown, H.A.; Glass, C.K.; Merrill, A.H.; Murphy, R.C.; Raetz, C.R.H.; Russell, D.W.; Seyama, Y.; Shaw, W. A Comprehensive Classification System for Lipids1. J. Lipid Res. 2005, 46, 839–861. [Google Scholar] [CrossRef] [PubMed]
- Benjamini, Y.; Hochberg, Y. Controlling the False Discovery Rate: A Practical and Powerful Approach to Multiple Testing. J. R. Stat. Soc. Ser. B 1995, 57, 289–300. [Google Scholar] [CrossRef]
- Cano, A.; Alonso, C. Deciphering Non-Alcoholic Fatty Liver Disease through Metabolomics. Biochem. Soc. Trans. 2014, 42, 1447–1452. [Google Scholar] [CrossRef]
- Stadler, J.T.; Marsche, G. Dietary Strategies to Improve Cardiovascular Health: Focus on Increasing High-Density Lipoprotein Functionality. Front. Nutr. 2021, 8, 761170. [Google Scholar] [CrossRef] [PubMed]
- Yoshinaga, M.Y.; Quintanilha, B.J.; Chaves-Filho, A.B.; Miyamoto, S.; Sampaio, G.R.; Rogero, M.M. Postprandial Plasma Lipidome Responses to a High-Fat Meal among Healthy Women. J. Nutr. Biochem. 2021, 97, 108809. [Google Scholar] [CrossRef] [PubMed]
- Wang, D.D.; Zheng, Y.; Toledo, E.; Razquin, C.; Ruiz-Canela, M.; Guasch-Ferre, M.; Yu, E.; Corella, D.; Gomez-Gracia, E.; Fiol, M. Lipid Metabolic Networks, Mediterranean Diet and Cardiovascular Disease in the PREDIMED Trial. Int. J. Epidemiol. 2018, 47, 1830–1845. [Google Scholar] [CrossRef]
- Stegemann, C.; Pechlaner, R.; Willeit, P.; Langley, S.R.; Mangino, M.; Mayr, U.; Menni, C.; Moayyeri, A.; Santer, P.; Rungger, G. Lipidomics Profiling and Risk of Cardiovascular Disease in the Prospective Population-Based Bruneck Study. Circulation 2014, 129, 1821–1831. [Google Scholar] [CrossRef]
- Razquin, C.; Liang, L.; Toledo, E.; Clish, C.B.; Ruiz-Canela, M.; Zheng, Y.; Wang, D.D.; Corella, D.; Castaner, O.; Ros, E. Plasma Lipidome Patterns Associated with Cardiovascular Risk in the PREDIMED Trial: A Case-Cohort Study. Int. J. Cardiol. 2018, 253, 126–132. [Google Scholar] [CrossRef]
- Watkins, S.M.; Zhu, X.; Zeisel, S.H. Phosphatidylethanolamine-N-Methyltransferase Activity and Dietary Choline Regulate Liver-Plasma Lipid Flux and Essential Fatty Acid Metabolism in Mice. J. Nutr. 2003, 133, 3386–3391. [Google Scholar] [CrossRef]
- DeLong, C.J.; Shen, Y.-J.; Thomas, M.J.; Cui, Z. Molecular Distinction of Phosphatidylcholine Synthesis between the CDP-Choline Pathway and Phosphatidylethanolamine Methylation Pathway. J. Biol. Chem. 1999, 274, 29683–29688. [Google Scholar] [CrossRef]
- Vance, D.E.; Walkey, C.J.; Cui, Z. Phosphatidylethanolamine N-Methyltransferase from Liver. Biochim. Biophys. Acta Lipids Lipid Metab. 1997, 1348, 142–150. [Google Scholar] [CrossRef] [PubMed]
- Wang, D.D.; Toledo, E.; Hruby, A.; Rosner, B.A.; Willett, W.C.; Sun, Q.; Razquin, C.; Zheng, Y.; Ruiz-Canela, M.; Guasch-Ferré, M. Plasma Ceramides, Mediterranean Diet, and Incident Cardiovascular Disease in the PREDIMED Trial (Prevencion Con Dieta Mediterranea). Circulation 2017, 135, 2028–2040. [Google Scholar] [CrossRef] [PubMed]
- Tabassum, R.; Ruotsalainen, S.; Ottensmann, L.; Gerl, M.J.; Klose, C.; Tukiainen, T.; Pirinen, M.; Simons, K.; Widén, E.; Ripatti, S. Lipidome-and Genome-Wide Study to Understand Sex Differences in Circulatory Lipids. J. Am. Heart Assoc. 2022, 11, e027103. [Google Scholar] [CrossRef]
- Wong, M.W.K.; Braidy, N.; Pickford, R.; Vafaee, F.; Crawford, J.; Muenchhoff, J.; Schofield, P.; Attia, J.; Brodaty, H.; Sachdev, P. Plasma Lipidome Variation during the Second Half of the Human Lifespan Is Associated with Age and Sex but Minimally with BMI. PLoS ONE 2019, 14, e0214141. [Google Scholar] [CrossRef]
- Kostara, C.E.; Bairaktari, E.T.; Tsimihodimos, V. Effect of Clinical and Laboratory Parameters on HDL Particle Composition. Int. J. Mol. Sci. 2023, 24, 1995. [Google Scholar] [CrossRef] [PubMed]
- Link, J.C.; Reue, K. Genetic Basis for Sex Differences in Obesity and Lipid Metabolism. Annu. Rev. Nutr. 2017, 37, 225–245. [Google Scholar] [CrossRef] [PubMed]
- Padró, T.; Cubedo, J.; Camino, S.; Béjar, M.T.; Ben-Aicha, S.; Mendieta, G.; Escolà-Gil, J.C.; Escate, R.; Gutiérrez, M.; Casani, L. Detrimental Effect of Hypercholesterolemia on High-Density Lipoprotein Particle Remodeling in Pigs. J. Am. Coll. Cardiol. 2017, 70, 165–178. [Google Scholar] [CrossRef]
- Sayanova, O.V.; Napier, J.A. Eicosapentaenoic Acid: Biosynthetic Routes and the Potential for Synthesis in Transgenic Plants. Phytochemistry 2004, 65, 147–158. [Google Scholar] [CrossRef]
- Wang, Z.; Park, H.G.; Wang, D.H.; Kitano, R.; Kothapalli, K.S.D.; Brenna, J.T. Fatty Acid Desaturase 2 (FADS2) but Not FADS1 Desaturates Branched Chain and Odd Chain Saturated Fatty Acids. Biochim. Biophys. Acta Mol. Cell Biol. Lipids 2020, 1865, 158572. [Google Scholar] [CrossRef]


| ω3 Milk | PhyS Milk | |||||||
|---|---|---|---|---|---|---|---|---|
| Before | After | ∆ | p | Before | After | ∆ | p | |
| Male/female | 8/v12 | - | - | - | - | - | - | - |
| Age (years) | 50.60 ± 1.81 | - | - | - | - | - | - | - |
| Weight (kg) | 73.77 ± 2.40 | 73.35 ± 2.39 | −0.42 | 0.061 | 73.64 ± 2.44 | 73.32 ± 2.42 | −0.32 | 0.215 |
| BMI (kg/m2) | 27.04 ± 0.42 | 26.88 ± 0.42 | −0.15 | 0.062 | 26.98 ± 0.43 | 26.87 ± 0.44 | −0.11 | 0.268 |
| WC (cm) | ||||||||
| Females | 90.00 ± 1.85 | 89.42 ± 1.79 | 0.58 | 0.538 | 90.67 ± 1.26 | 89.33 ± 1.15 | 1.33 | 0.092 |
| Males | 96.75 ± 2.93 | 95.88 ± 3.08 | 0.88 | 0.111 | 97.13 ± 2.34 | 97.13 ± 2.94 | 0.00 | 1.000 |
| WHtR (cm/cm) | 0.56 ± 0.01 | 0.56 ± 0.01 | −0.01 | 0.180 | 0.57 ± 0.01 | 0.56 ± 0.01 | −0.01 | 0.234 |
| Glucose (mM) | 4.76 ± 0.22 | 4.95 ± 0.26 | 0.19 | 0.070 | 4.74 ± 0.14 | 4.84 ± 0.27 | 0.10 | 0.647 |
| Urea (mM) | 6.15 ± 0.28 | 6.33 ± 0.22 | 0.18 | 0.464 | 5.79 ± 0.20 | 5.64 ± 0.23 | −0.15 | 0.460 |
| Uric acid (mM) | 298.95 ± 17.10 | 304.45 ± 19.87 | 5.50 | 0.494 | 295.50 ± 18.48 | 297.30 ± 17.93 | 1.80 | 0.752 |
| Creatinine (µM) | 67.87 ± 2.68 | 70.07 ± 2.77 | 2.20 | 0.369 | 66.94 ± 2.21 | 67.50 ± 2.04 | 0.56 | 0.320 |
| Total protein (U/l) | 69.46 ± 0.68 | 68.76 ± 0.83 | −0.71 | 0.257 | 68.65 ± 0.58 | 68.33 ± 0.65 | −0.32 | 0.589 |
| GGT (U/l) | 30.40 ± 2.35 | 29.15 ± 4.62 | −1.25 | 0.355 | 32.05 ± 6.51 | 28.90 ± 5.06 | −3.15 | 0.078 |
| ALT (U/l) | 27.10 ± 3.60 | 24.90 ± 3.52 | −2.20 | 0.567 | 23.90 ± 3.08 | 23.50 ± 2.72 | −0.40 | 0.800 |
| AST (U/l) | 22.65 ± 2.03 | 22.50 ± 2.14 | −0.15 | 0.930 | 21.65 ± 1.65 | 21.65 ± 2.00 | 0.00 | 1.000 |
| TBARS * | 6.60 ± 0.63 | 6.09 ± 0.49 | −0.43 | 0.325 | 6.97 ± 0.87 | 5.04 ± 0.46 | −1.64 | 0.032 |
| TAG (mg/dL) | 131.44 ± 21.89 | 102.74 ± 12.49 | −28.70 | 0.018 | 120.37 ± 15.46 | 122.23 ± 2.45 | 1.86 | 0.913 |
| TC (mg/dL) | 216.72 ± 8.33 | 214.24 ± 7.67 | −2.48 | 0.432 | 218.53 ± 8.10 | 202.37 ± 7.61 | −16.16 | <0.01 |
| HDLc (mg/dL) | 56.22 ± 3.77 | 55.45 ± 3.60 | −0.77 | 0.521 | 54.30 ± 4.14 | 54.19 ± 3.80 | −0.12 | 0.95 |
| NonHDLc (mg/dL) | 160.50 ± 8.98 | 158.80 ± 8.51 | −1.70 | 0.514 | 164.23 ± 8.45 | 148.18 ± 8.83 | −16.05 | 0.919 |
| LDLc (mg/dL) | 134.55 ± 7.20 | 138.54 ± 6.96 | 3.98 | 0.260 | 140.45 ± 7.11 | 124.04 ± 6.90 | −16.41 | <0.01 |
| VLDLc (mg/dL) | 26.21 ± 4.36 | 20.45 ± 2.50 | −5.76 | 0.017 | 23.99 ± 3.08 | 24.34 ± 4.68 | 0.35 | <0.01 |
| TAG/HDLc ratio | 2.82 ± 0.61 | 2.14 ± 0.35 | −0.68 | 0.037 | 2.71 ± 0.48 | 2.76 ± 0.67 | 0.67 | 0.894 |
| TC/HDLc ratio | 4.16 ± 0.30 | 4.16 ± 0.08 | −0.01 | 0.935 | 4.40 ± 0.32 | 4.08 ± 0.32 | 0.32 | 0.020 |
| NonHDLc/HDLc ratio | 3.16 ± 0.30 | 3.16 ± 0.28 | −0.01 | 0.935 | 3.40 ± 0.32 | 3.08 ± 0.32 | 0.32 | 0.020 |
| Lipids | ω3 Milk | PhyS Milk | ||||
|---|---|---|---|---|---|---|
| Before | After | p | Before | After | p | |
| Total lipids | 400.39 ± 21.51 | 409.34 ± 19.14 | 0.630 | 404.74 ± 17.52 | 385.92 ± 18.60 | 0.180 |
| GPL | 275.37 ± 17.36 | 272.68 ± 14.84 | 0.839 | 277.76 ± 14.46 | 264.35 ± 13.73 | 0.416 |
| PC | 208.37 ± 11.69 | 207.91 ± 10.49 | 0.961 | 212.11 ± 10.48 | 204.98 ± 11.29 | 0.327 |
| DAPC | 116.16 ± 5.86 | 118.69 ± 5.67 | 0.616 | 117.95 ± 6.14 | 114.11 ± 5.75 | 0.468 |
| MEMAPC | 92.21 ± 6.93 | 89.22 ± 6.32 | 0.581 | 94.16 ± 5.56 | 90.87 ± 6.10 | 0.343 |
| PE | 47.04 ± 5.36 | 46.81 ± 4.24 | 0.947 | 46.12 ± 4.15 | 41.62 ± 2.72 | 0.127 |
| MEMAPE | 35.60 ± 4.83 | 34.65 ± 3.68 | 0.764 | 35.39 ± 3.96 | 31.39 ± 2.60 | 0.155 |
| DAPE | 11.44 ± 0.92 | 12.16 ± 1.11 | 0.382 | 10.73 ± 0.86 | 10.23 ± 0.88 | 0.306 |
| PI | ||||||
| DAPI | 19.96 ± 1.77 | 17.96 ± 1.73 | 0.310 | 19.53 ± 1.79 | 17.75 ± 1.30 | 0.182 |
| GLP | 50.61 ± 4.22 | 59.03 ± 4.92 | 0.161 | 51.88 ± 4.16 | 45.33 ± 3.75 | 0.118 |
| TAG | 45.34 ± 3.93 | 53.88 ± 4.67 | 0.140 | 46.73 ± 3.93 | 40.41 ± 3.58 | 0.189 |
| DAG | 4.71 ± 0.38 | 4.60 ± 0.38 | 0.737 | 4.58 ± 0.47 | 4.34 ± 0.34 | 0.491 |
| MAG | 0.56 ± 0.03 | 0.55 ± 0.03 | 0.892 | 0.57 ± 0.01 | 0.59 ± 0.01 | 0.145 |
| SPL | 47.73 ± 3.52 | 46.88 ± 3.32 | 0.725 | 47.71 ± 3.37 | 48.17 ± 3.99 | 0.912 |
| SM | 34.33 ± 2.68 | 33.57 ± 2.45 | 0.654 | 33.90 ± 2.45 | 34.93 ± 2.92 | 0.472 |
| Cer | 8.83 ± 0.66 | 8.51 ± 0.59 | 0.590 | 9.02 ± 0.72 | 8.51 ± 0.74 | 0.325 |
| MHC | 4.57 ± 0.41 | 4.79 ± 0.42 | 0.413 | 4.79 ± 0.37 | 4.74 ± 0.51 | 0.844 |
| Sterols | ||||||
| CE | 27.24 ± 2.43 | 31.31 ± 1.70 | 0.011 | 27.95 ± 1.82 | 28.65 ± 1.93 | 0.538 |
Disclaimer/Publisher’s Note: The statements, opinions and data contained in all publications are solely those of the individual author(s) and contributor(s) and not of MDPI and/or the editor(s). MDPI and/or the editor(s) disclaim responsibility for any injury to people or property resulting from any ideas, methods, instructions or products referred to in the content. |
© 2023 by the authors. Licensee MDPI, Basel, Switzerland. This article is an open access article distributed under the terms and conditions of the Creative Commons Attribution (CC BY) license (https://creativecommons.org/licenses/by/4.0/).
Share and Cite
Padro, T.; López-Yerena, A.; Pérez, A.; Vilahur, G.; Badimon, L. Dietary ω3 Fatty Acids and Phytosterols in the Modulation of the HDL Lipidome: A Longitudinal Crossover Clinical Study. Nutrients 2023, 15, 3637. https://doi.org/10.3390/nu15163637
Padro T, López-Yerena A, Pérez A, Vilahur G, Badimon L. Dietary ω3 Fatty Acids and Phytosterols in the Modulation of the HDL Lipidome: A Longitudinal Crossover Clinical Study. Nutrients. 2023; 15(16):3637. https://doi.org/10.3390/nu15163637
Chicago/Turabian StylePadro, Teresa, Anallely López-Yerena, Antonio Pérez, Gemma Vilahur, and Lina Badimon. 2023. "Dietary ω3 Fatty Acids and Phytosterols in the Modulation of the HDL Lipidome: A Longitudinal Crossover Clinical Study" Nutrients 15, no. 16: 3637. https://doi.org/10.3390/nu15163637
APA StylePadro, T., López-Yerena, A., Pérez, A., Vilahur, G., & Badimon, L. (2023). Dietary ω3 Fatty Acids and Phytosterols in the Modulation of the HDL Lipidome: A Longitudinal Crossover Clinical Study. Nutrients, 15(16), 3637. https://doi.org/10.3390/nu15163637