


Males Have a Higher Energy Expenditure than Females during Squat Training
 ,
,  ,
,  , ,
, ,  , and
, and 
Abstract
1. Introduction
2. Materials and Methods
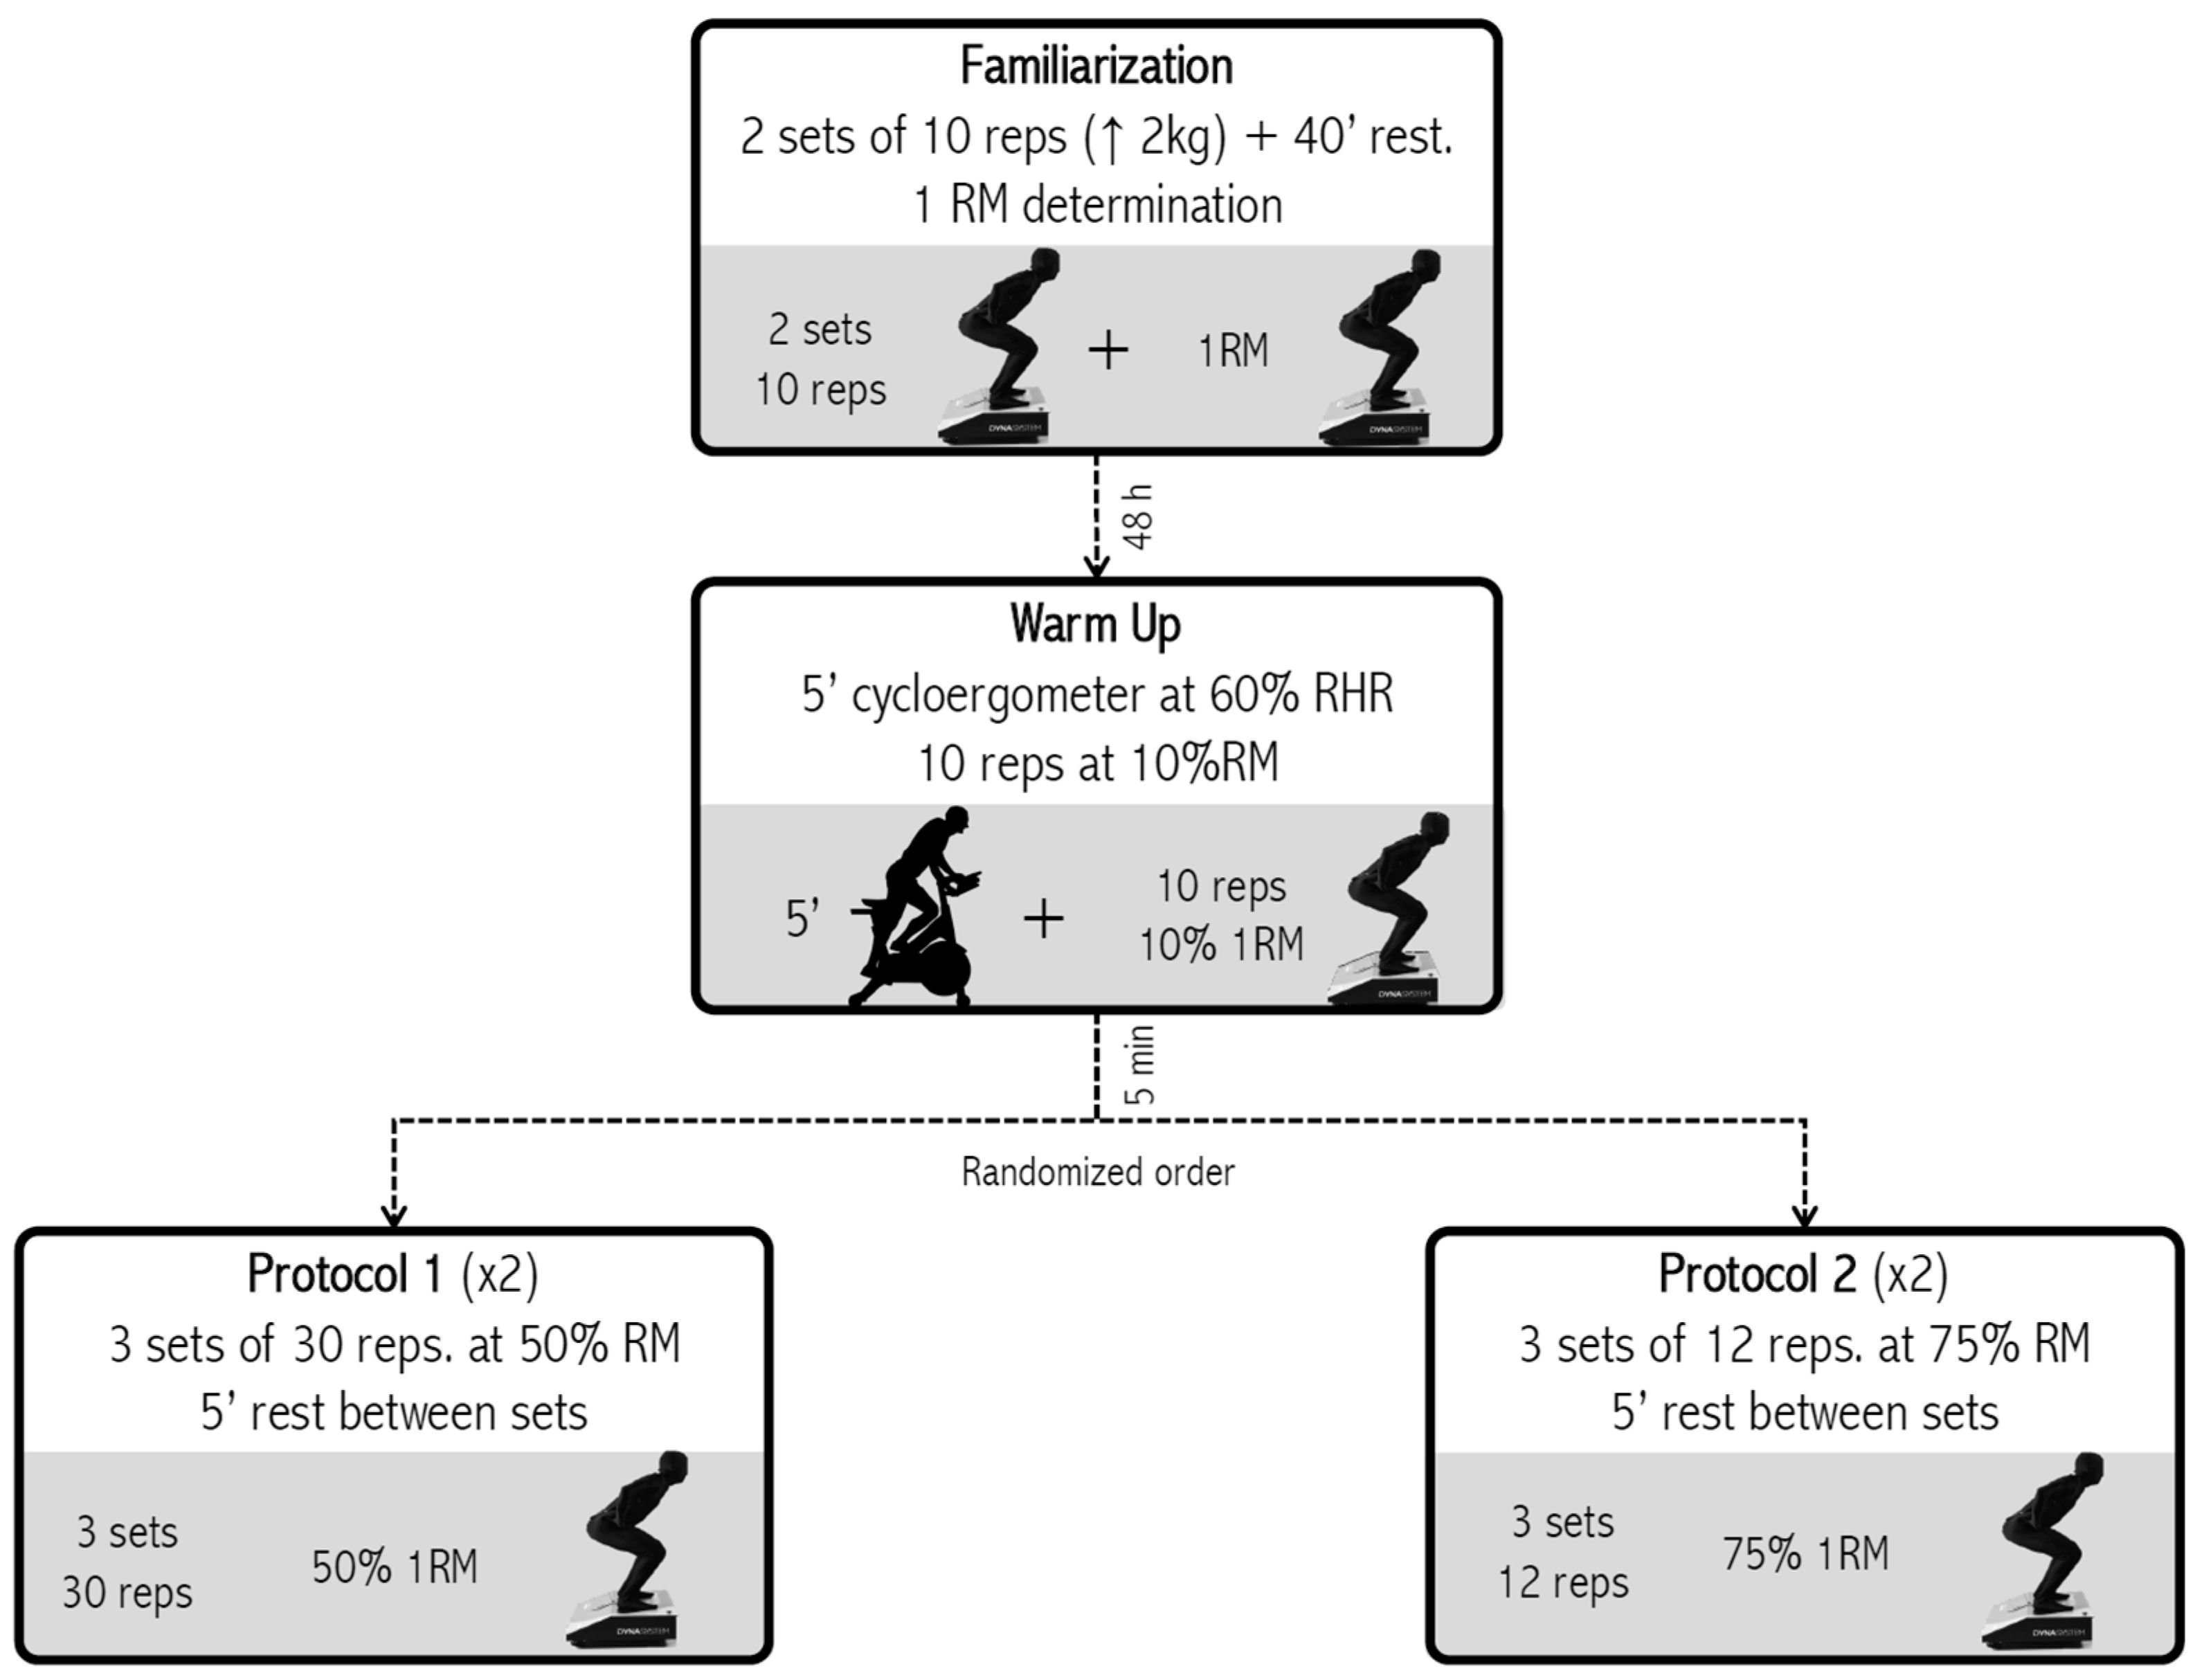
2.1. Experimental Approach to the Problem
2.2. Subjects
2.3. Procedures
2.4. Statistical Analyses
3. Results
4. Discussion
5. Conclusions
Author Contributions
Funding
Institutional Review Board Statement
Informed Consent Statement
Data Availability Statement
Acknowledgments
Conflicts of Interest
References
- Brazeau, A.S.; Beaudoin, N.; Bélisle, V.; Messier, V.; Karelis, A.D.; Rabasa-Lhoret, R. Validation and Reliability of Two Activity Monitors for Energy Expenditure Assessment. J. Sci. Med. Sport 2016, 19, 46–50. [Google Scholar] [CrossRef]
- Booth, F.W.; Roberts, C.K.; Laye, M.J. Lack of Exercise Is a Major Cause of Chronic Diseases. Compr. Physiol. 2012, 2, 1143. [Google Scholar] [CrossRef]
- Joao, G.A.; Rodriguez, D.; Tavares, L.D.; Carvas, N., Jr.; Miranda, M.L.; Reis, V.M.; Bocalini, D.S.; Baker, J.S.; Figueira, A.J., Jr. Can Intensity in Strength Training Change Caloric Expenditure? Systematic Review and Meta-analysis. Clin. Physiol. Funct. Imaging 2020, 40, 55–66. [Google Scholar] [CrossRef]
- Da Silva, R.L.; Brentano, M.A.; Kruel, L.F.M. Effects of Different Strength Training Methods on Postexercise Energetic Expenditure. J. Strength Cond. Res. 2010, 24, 2255–2260. [Google Scholar] [CrossRef]
- Paoli, A.; Moro, T.; Marcolin, G.; Neri, M.; Bianco, A.; Palma, A.; Grimaldi, K. High-Intensity Interval Resistance Training (HIRT) Influences Resting Energy Expenditure and Respiratory Ratio in Non-Dieting Individuals. J. Transl. Med. 2012, 10, 237. [Google Scholar] [CrossRef]
- Westcott, W.L. Resistance Training Is Medicine: Effects of Strength Training on Health. Curr. Sports Med. Rep. 2012, 11, 209–216. [Google Scholar] [CrossRef] [PubMed]
- Maestroni, L.; Read, P.; Bishop, C.; Papadopoulos, K.; Suchomel, T.J.; Comfort, P.; Turner, A. The Benefits of Strength Training on Musculoskeletal System Health: Practical Applications for Interdisciplinary Care. Sports Med. 2020, 50, 1431–1450. [Google Scholar] [CrossRef] [PubMed]
- Ainslie, P.N.; Reilly, T.; Westerterp, K.R. Estimating Human Energy Expenditure. Sports Med. 2003, 33, 683–698. [Google Scholar] [CrossRef]
- Martínez-Aldao, D.; Diz, J.C.; Varela, S.; Ayán, C. Analysis of the Convergent Validity of the Spanish Short Version of the Minnesota Leisure Time Physical Activity Questionnaire (VREM) and the Spanish Version of the International Physical Activity Questionnaire in Elderly People (IPAQ-E). Sist. Sanit. Navar. 2019, 42, 147–157. [Google Scholar] [CrossRef]
- Craig, C.L.; Marshall, A.L.; Sjöström, M.; Bauman, A.E.; Booth, M.L.; Ainsworth, B.E.; Pratt, M.; Ekelund, U.; Yngve, A.; Sallis, J.F.; et al. International Physical Activity Questionnaire: 12-Country Reliability and Validity. Med. Sci. Sports Exerc. 2003, 35, 1381–1395. [Google Scholar] [CrossRef] [PubMed]
- Westerterp, K.R. Doubly Labelled Water Assessment of Energy Expenditure: Principle, Practice, and Promise. Eur. J. Appl. Physiol. 2017, 117, 1277–1285. [Google Scholar] [CrossRef]
- Sharifzadeh, M.; Bagheri, M.; Speakman, J.R.; Djafarian, K. Comparison of Total and Activity Energy Expenditure Estimates from Physical Activity Questionnaires and Doubly Labelled Water: A Systematic Review and Meta-Analysis. Br. J. Nutr. 2021, 125, 983–997. [Google Scholar] [CrossRef]
- Carr, L.J.; Mahar, M.T. Accuracy of Intensity and Inclinometer Output of Three Activity Monitors for Identification of Sedentary Behavior and Light-Intensity Activity. J. Obes. 2012, 2012, 460271. [Google Scholar] [CrossRef]
- Crouter, S.E.; Antczak, A.; Hudak, J.R.; DellaValle, D.M.; Haas, J.D. Accuracy and Reliability of the ParvoMedics TrueOne 2400 and MedGraphics VO2000 Metabolic Systems. Eur. J. Appl. Physiol. 2006, 98, 139–151. [Google Scholar] [CrossRef] [PubMed]
- Igawa, S.; Sakamaki, M.; Miyazaki, M. Examination of the Reliability of the Portable Calorimeter. Clin. Exp. Pharmacol. Physiol. 2002, 29, 13–16. [Google Scholar] [CrossRef] [PubMed]
- Schoffelen, P.F.M.; den Hoed, M.; van Breda, E.; Plasqui, G. Test-Retest Variability of VO 2max Using Total-Capture Indirect Calorimetry Reveals Linear Relationship of VO 2 and Power. Scand. J. Med. Sci. Sports 2019, 29, 213–222. [Google Scholar] [CrossRef] [PubMed]
- Purcell, S.A.; Johnson-Stoklossa, C.; Tibaes, J.R.B.; Frankish, A.; Elliott, S.A.; Padwal, R.; Prado, C.M. Accuracy and Reliability of a Portable Indirect Calorimeter Compared to Whole-Body Indirect Calorimetry for Measuring Resting Energy Expenditure. Clin. Nutr. ESPEN 2020, 39, 67–73. [Google Scholar] [CrossRef]
- Woodman, J.A.; Crouter, S.E.; Bassett, D.R.; Fitzhugh, E.C.; Boyer, W.R. Accuracy of Consumer Monitors for Estimating Energy Expenditure and Activity Type. Med. Sci. Sports Exerc. 2017, 49, 371–377. [Google Scholar] [CrossRef]
- Corder, K.; Brage, S.; Ekelund, U. Accelerometers and Pedometers: Methodology and Clinical Application. Curr. Opin. Clin. Nutr. Metab. Care 2007, 10, 597–603. [Google Scholar] [CrossRef] [PubMed]
- Li, S.S.W.; Chan, O.H.T.; Ng, T.Y.; Kam, L.H.; Ng, C.Y.; Chung, W.C.; Chow, D.H.K. Gender Differences in Energy Expenditure During Walking with Backpack and Double-Pack Loads. Hum. Factors 2019, 61, 203–213. [Google Scholar] [CrossRef] [PubMed]
- Zunzer, S.C.; von Duvillard, S.P.; Tschakert, G.; Mangus, B.; Hofmann, P. Energy Expenditure and Sex Differences of Golf Playing. J. Sports Sci. 2013, 31, 1045–1053. [Google Scholar] [CrossRef]
- Bishop, P.; Cureton, K.; Collins, M. Sex Difference in Muscular Strength in Equally-Trained Men and Women. Ergonomics 1987, 30, 675–687. [Google Scholar] [CrossRef]
- Robergs, R.A.; Gordon, T.; Reynolds, J.; Walker, T.B. Energy Expenditure during Bench Press and Squat Exercises. J. Strength Cond. Res. 2007, 21, 123–130. [Google Scholar] [CrossRef]
- Roberts, B.M.; Nuckols, G.; Krieger, J.W. Sex Differences in Resistance Training: A Systematic Review and Meta-Analysis. J. Strength Cond. Res. 2020, 34, 1448–1460. [Google Scholar] [CrossRef]
- Sahlin, K.; Tonkonogi, M.; Söderlund, K. Energy Supply and Muscle Fatigue in Humans. Acta Physiol. Scand. 1998, 162, 261–266. [Google Scholar] [CrossRef]
- Hargreaves, M.; Spriet, L.L. Skeletal Muscle Energy Metabolism during Exercise. Nat. Metab. 2020, 2, 817–828. [Google Scholar] [CrossRef]
- Comfort, P.; Kasim, P. Optimizing Squat Technique. Strength Cond. J. 2007, 29, 10. [Google Scholar] [CrossRef]
- Schlegel, P.; Fialová, D. Deep Squat–Should We Be Afraid? Stud. Sport. 2021, 15, 26–33. [Google Scholar] [CrossRef]
- Zazulak, B.T.; Ponce, P.L.; Straub, S.J.; Medvecky, M.J.; Avedisian, L.; Hewett, T.E. Gender Comparison of Hip Muscle Activity during Single-Leg Landing. J. Orthop. Sports Phys. Ther. 2005, 35, 292–299. [Google Scholar] [CrossRef]
- Mehls, K.; Grubbs, B.; Jin, Y.; Coons, J. Electromyography Comparison of Sex Differences during the Back Squat. J. Strength Cond. Res. 2022, 36, 310–313. [Google Scholar] [CrossRef]
- Brentano, M.A.; Umpierre, D.; Santos, L.P.; Lopes, A.L.; Kruel, L.F.M. Supersets Do Not Change Energy Expenditure during Strength Training Sessions in Physically Active Individuals. J. Exerc. Sci. Fit. 2016, 14, 41–46. [Google Scholar] [CrossRef] [PubMed][Green Version]
- del-Cuerpo, I.; Jerez-Mayorga, D.; Delgado-Floody, P.; Morenas-Aguilar, M.D.; Chirosa-Ríos, L.J. Test–Retest Reliability of the Functional Electromechanical Dynamometer for Squat Exercise. Int. J. Environ. Res. Public Health 2023, 20, 1289. [Google Scholar] [CrossRef]
- Rodriguez-Perea, A.; Jerez-Mayorga, D.; García-Ramos, A.; Martínez-García, D.; Chirosa-Ríos, L.J. Reliability and Concurrent Validity of a Functional Electromechanical Dynamometer Device for the Assessment of Movement Velocity. Proc. Inst. Mech. Eng. 2021, 235, 176–181. [Google Scholar] [CrossRef]
- Bisdee, J.T.; James, W.P.T.; Shaw, M.A. Changes in Energy Expenditure during the Menstrual Cycle. Br. J. Nutr. 1989, 61, 187–199. [Google Scholar] [CrossRef]
- Chmielewska, A.; Kujawa, K.; Regulska-Ilow, B. Accuracy of Resting Metabolic Rate Prediction Equations in Sport Climbers. Int. J. Environ. Res. Public Health 2023, 20, 4216. [Google Scholar] [CrossRef]
- Vaquero-Cristóbal, R.; Albaladejo-Saura, M.; Luna-Badachi, A.E.; Esparza-Ros, F. Differences in Fat Mass Estimation Formulas in Physically Active Adult Population and Relationship with Sums of Skinfolds. Int. J. Environ. Res. Public Health 2020, 17, 7777. [Google Scholar] [CrossRef]
- Lombardi, V.P. Beginning Weight Training: The Safe and Effective Way; WCB McGraw-Hill: New York, NY, USA, 1989; ISBN 0697054969. [Google Scholar]
- Roman-Viñas, B.; Serra-Majem, L.; Hagströmer, M.; Ribas-Barba, L.; Sjöström, M.; Segura-Cardona, R. International Physical Activity Questionnaire: Reliability and Validity in a Spanish Population. Eur. J. Sport. Sci. 2010, 10, 297–304. [Google Scholar] [CrossRef]
- Jones, L.M.; Stoner, L.; Baldi, J.C.; McLaren, B. Circuit Resistance Training and Cardiovascular Health in Breast Cancer Survivors. Eur. J. Cancer Care 2020, 29, e13231. [Google Scholar] [CrossRef]
- Benito, P.J.; Cupeiro, R.; Ramos-Campo, D.J.; Alcaraz, P.E.; Rubio-Arias, J.Á. A Systematic Review with Meta-Analysis of the Effect of Resistance Training on Whole-Body Muscle Growth in Healthy Adult Males. Int. J. Environ. Res. Public Health 2020, 17, 1285. [Google Scholar] [CrossRef]
- Bea, J.W.; Blew, R.M.; Howe, C.; Hetherington-Rauth, M.; Going, S.B. Resistance Training Effects on Metabolic Function among Youth: A Systematic Review. Pediatr. Exerc. Sci. 2017, 29, 297–315. [Google Scholar] [CrossRef]
- Zurlo, F.; Larson, K.; Bogardus, C.; Ravussin, E. Skeletal Muscle Metabolism Is a Major Determinant of Resting Energy Expenditure. J. Clin. Investig. 1990, 86, 1423–1427. [Google Scholar] [CrossRef]
- Hackney, K.J.; Engels, H.-J.; Gretebeck, R.J. Resting Energy Expenditure and Delayed-Onset Muscle Soreness after Full-Body Resistance Training with an Eccentric Concentration. J. Strength Cond. Res. 2008, 22, 1602–1609. [Google Scholar] [CrossRef]
- Abboud, G.J.; Greer, B.K.; Campbell, S.C.; Panton, L.B. Effects of Load-Volume on EPOC after Acute Bouts of Resistance Training in Resistance-Trained Men. J. Strength Cond. Res. 2013, 27, 1936–1941. [Google Scholar] [CrossRef]
- Ciccolo, J.T.; Carr, L.J.; Krupel, K.L.; Longval, J.L. The Role of Resistance Training in the Prevention and Treatment of Chronic Disease. Am. J. Lifestyle Med. 2010, 4, 293–308. [Google Scholar] [CrossRef]
- Lemmer, J.T.; Ivey, F.M.; Ryan, A.S.; Martel, G.F.; Hurlbut, D.E.; Metter, J.E.; Fozard, J.L.; Fleg, J.L.; Hurley, B.E.N.F. Effect of Strength Training on Resting Metabolic Rate and Physical Activity: Age and Gender Comparisons. Med. Sci. Sports Exerc. 2001, 33, 532–541. [Google Scholar] [CrossRef] [PubMed]
- Pratley, R.; Nicklas, B.; Rubin, M.; Miller, J.; Smith, A.; Smith, M.; Hurley, B.; Goldberg, A. Strength Training Increases Resting Metabolic Rate and Norepinephrine Levels in Healthy 50-to 65-Yr-Old Men. J. Appl. Physiol. 1994, 76, 133–137. [Google Scholar] [CrossRef] [PubMed]
- Bi, X.; Forde, C.G.; Goh, A.T.; Henry, C.J. Basal Metabolic Rate and Body Composition Predict Habitual Food and Macronutrient Intakes: Gender Differences. Nutrients 2019, 11, 2653. [Google Scholar] [CrossRef]
- Trumble, B.C.; Pontzer, H.; Stieglitz, J.; Cummings, D.K.; Wood, B.; Thompson, M.E.; Raichlen, D.; Beheim, B.; Yetish, G.; Kaplan, H. Energetic Costs of Testosterone in Two Subsistence Populations. Am. J. Hum. Biol. 2023, e23949. [Google Scholar] [CrossRef]
- Brodsky, I.G.; Balagopal, P.; Nair, K.S. Effects of Testosterone Replacement on Muscle Mass and Muscle Protein Synthesis in Hypogonadal Men--a Clinical Research Center Study. J. Clin. Endocrinol. Metab. 1996, 81, 3469–3475. [Google Scholar] [CrossRef] [PubMed]
- Sinha-Hikim, I.; Cornford, M.; Gaytan, H.; Lee, M.L.; Bhasin, S. Effects of Testosterone Supplementation on Skeletal Muscle Fiber Hypertrophy and Satellite Cells in Community-Dwelling Older Men. J. Clin. Endocrinol. Metab. 2006, 91, 3024–3033. [Google Scholar] [CrossRef]
- Tsai, L.W.; Sapolsky, R.M. Rapid Stimulatory Effects of Testosterone upon Myotubule Metabolism and Sugar Transport, as Assessed by Silicon Microphysiometry. Aggress. Behav. Off. J. Int. Soc. Res. Aggress. 1996, 22, 357–364. [Google Scholar] [CrossRef]
- Emmelot-Vonk, M.H.; Verhaar, H.J.J.; Pour, H.R.N.; Aleman, A.; Lock, T.M.T. Effect of Testosterone Supplementation on Functional Mobility, Cognition, and Other Parameters in Older Men. J. Am. Med. Assoc. 2008, 299, 39–52. [Google Scholar] [CrossRef]
- Gurven, M.; Costa, M.; Trumble, B.; Stieglitz, J.; Beheim, B.; Rodriguez, D.E.; Hooper, P.L.; Kaplan, H. Health Costs of Reproduction Are Minimal despite High Fertility, Mortality and Subsistence Lifestyle. Sci. Rep. 2016, 6, 30056. [Google Scholar] [CrossRef]
- Holesh, J.E.; Bass, A.N.; Lord, M. Physiology, Ovulation; StatPearls: Tampa, FL, USA, 2017. [Google Scholar]
- Patricio, B.-P.; Sergio, B.-G. Normal Menstrual Cycle. Menstrual Cycle; IntechOpen: London, UK, 2019; Volume 15. [Google Scholar] [CrossRef]
- Reed, B.G.; Carr, B.R. The Normal Menstrual Cycle and the Control of Ovulation; MDText.com, Inc.: South Dartmouth, MA, USA, 2015. [Google Scholar]
- Pardo, M.; Crujeiras, A.B.; Amil, M.; Aguera, Z.; Jiménez-Murcia, S.; Baños, R.; Botella, C.; De La Torre, R.; Estivill, X.; Fagundo, A.B.; et al. Association of Irisin with Fat Mass, Resting Energy Expenditure, and Daily Activity in Conditions of Extreme Body Mass Index. Int. J. Endocrinol. 2014, 2014, 857270. [Google Scholar] [CrossRef] [PubMed]
- Bandini, L.G.; Must, A.; Phillips, S.M.; Naumova, E.N.; Dietz, W.H. Relation of Body Mass Index and Body Fatness to Energy Expenditure: Longitudinal Changes from Preadolescence through Adolescence. Am. J. Clin. Nutr. 2004, 80, 1262–1269. [Google Scholar] [CrossRef] [PubMed]
- Bassett, D.R., Jr. Scientific Contributions of AV Hill: Exercise Physiology Pioneer. J. Appl. Physiol. 2002, 93, 1567–1582. [Google Scholar] [CrossRef]
- Joyner, M.J.; Dominelli, P.B. Central Cardiovascular System Limits to Aerobic Capacity. Exp. Physiol. 2021, 106, 2299–2303. [Google Scholar] [CrossRef] [PubMed]


| Monday | Tuesday | Wednesday | Thursday | Friday | Saturday | Sunday | |
|---|---|---|---|---|---|---|---|
| Breakfast | 1 glass of water; 1 tangerine; Glass of milk with pure cocoa (1 teaspoon of sugar) + 2 slices of toast with olive oil and crushed tomatoes | 1 glass of water; 1 banana; Decaffeinated coffee with milk (1 teaspoon of sugar) + 2 slices of toast with olive oil and serrano ham (2 slices) | 1 glass of water; 1 tangerine; Glass of milk with pure cocoa (1 teaspoon of sugar) + 2 slices of toast with avocado | 1 glass of water; 1 pear; Decaffeinated coffee with milk (1 teaspoon of sugar) + 2 slices of toast with olive oil and crushed tomatoes | 1 glass of water; 1 banana; Glass of milk with pure cocoa (1 teaspoon of sugar) + 2 slices of toast with olive oil and fresh cheese (2 slices) | 1 glass of water; 1 pear; Decaffeinated coffee with milk (1 teaspoon of sugar) + 2 slices of toast with olive oil and serrano ham (2 slices) | 1 glass of water; 1 banana; Glass of milk with pure cocoa (1 teaspoon of sugar) + 2 slices of toast with avocado |
| Snack | Avocado sandwich + 1 pear | Plain yogurt + 1 handful of walnuts | Rooibos tea (1 teaspoon of sugar) + olive oil and cooked ham sandwich (2 slices) | 2 natural L-casei yogurts + 1 apple | Plain yogurt + 1 handful of almonds | Olive oil and sliced tomato sandwich + 1 tangerine | 1 bowl of fruit salad with fresh orange juice |
| Lunch | 1 glass of water; Medium-sized plate: lettuce and tomato salad; Large plate: roasted chicken thigh and potato; Bread (2 slices); Dessert: pomegranate | 1 glass of water; Large plate: lentil stew with carrot and potatoes; Bread (2–3 slices); Dessert: 2 kiwis | 1 glass of water; Large plate: peas with onion and ham + grilled hake with garlic; Bread (2–3 slices); Dessert: ½ cherimoya | 1 glass of water; Large plate: stir-fried rice with beef and mushrooms; Bread (2 slices); Dessert: 1 pommegranate | 1 glass of water; Large plate: lentil stew with carrot and potatoes; Bread (2–3 slices); Dessert: ½ cherimoya | 1 glass of water; Medium-sized plate: lettuce and tomato salad; Medium-sized plate: pasta with tomato sauce and minced chicken meat; Dessert: 1 pommegranate | 1 glass of water; Large plate: sautéed wild asparagus and shrimp scrambled with 2 eggs; Bread (2–3 slices); Dessert: plain yogurt |
| Snack | Plain yogurt + 1 handful of walnuts | Rooibos tea (1 teaspoon of sugar) + 1 pear | 1 banana + handful of natural almonds | 2 tangerines + handful of walnuts | Rooibos tea (1 teaspoon of sugar) + 1 pear | 1 apple + 1 handful of natural almonds | Rooibos tea (1 teaspoon of sugar) + 1 toast with olive oil and turkey (1 slice) |
| Dinner | 1 glass of water; Large plate: sautéed green beans with garlic + tuna omelette (2 eggs); Bread (2 slices); Dessert: ½ cherimoya | 1 glass of water; Large plate: lettuce, pasta, fresh cheese, white asparagus, and tuna salad; Dessert: 1 pomegranate | 1 glass of water; Large plate: zucchini and potato cream soup + skewer of chicken breast, cherry tomatoes, and peppers; Bread (2 slices); Dessert: plain yogurt | 1 glass of water; Large plate: cauliflower scrambled with garlic and egg; Bread (2 slices); Dessert: 2 kiwis | 1 glass of water; Large plate: zucchini and potato cream soup + skewer of salmon breast, cherry tomatoes, and peppers; Bread (2–3 slices); Dessert: 1 pomegranate | 1 glass of water; Large plate: sautéed green beans with garlic + mushroom omelette (2 eggs); Bread (2 slices); Dessert: plain yogurt | 1 glass of water; Large plate: lettuce, pasta, fresh cheese, white asparagus, and tuna salad; Dessert: 2 kiwis |
| Total (n = 29) | Male (n = 13) | Female (n = 16) | p-Value | (F-Value) | |
|---|---|---|---|---|---|
| Mean ± SD | Mean ± SD | Mean ± SD | |||
| Age (years) | 24.9 ± 4.6 | 25.7 ± 3.9 | 24.3 ± 5.1 | 0.428 | (0.649) |
| Anthropometric parameters | |||||
| BMI (kg/m2) | 23.5 ± 3.0 | 24.6 ± 3.4 | 22.6 ± 2.4 | 0.076 | (3.412) |
| Body composition | |||||
| Body fat mass (kg) | 15.8 ± 5.3 | 14.7 ± 5.6 | 16.7 ± 5.2 | 0.345 | (0.923) |
| Fat-free mass (kg) | 52.4 ± 11.4 | 63.0 ± 7.2 | 43.9 ± 5.1 | <0.001 | (1.160) |
| Physical activity (IPAQ) | |||||
| LPA (days) | 4.7 ± 2.9 | 4.9 ± 2.9 | 4.6 ± 2.9 | 0.840 | (0.042) |
| LPA (min/day) | 37.9 ± 36.5 | 36.2 ± 32.5 | 39.4 ± 40.4 | 0.818 | (0.054) |
| MPA (days) | 2.5 ± 2.3 | 3.2 ± 2.6 | 2.0 ± 2.0 | 0.189 | (1.820) |
| MPA (min/day) | 66.0 ± 78.5 | 77.7 ± 96.0 | 56.6 ± 62.7 | 0.481 | (0.510) |
| VPA (days) | 3.7 ± 1.6 | 3.8 ± 1.4 | 3.6 ± 1.7 | 0.810 | (0.059) |
| VPA (min/day) | 90.5 ± 37.6 | 92.3 ± 31.7 | 89.1 ± 42.8 | 0.822 | (0.052) |
| Total (n = 29) | Male (n = 13) | Female (n = 16) | p-Value (F Value) | |
|---|---|---|---|---|
| Mean ± SD | Mean ± SD | Mean | ||
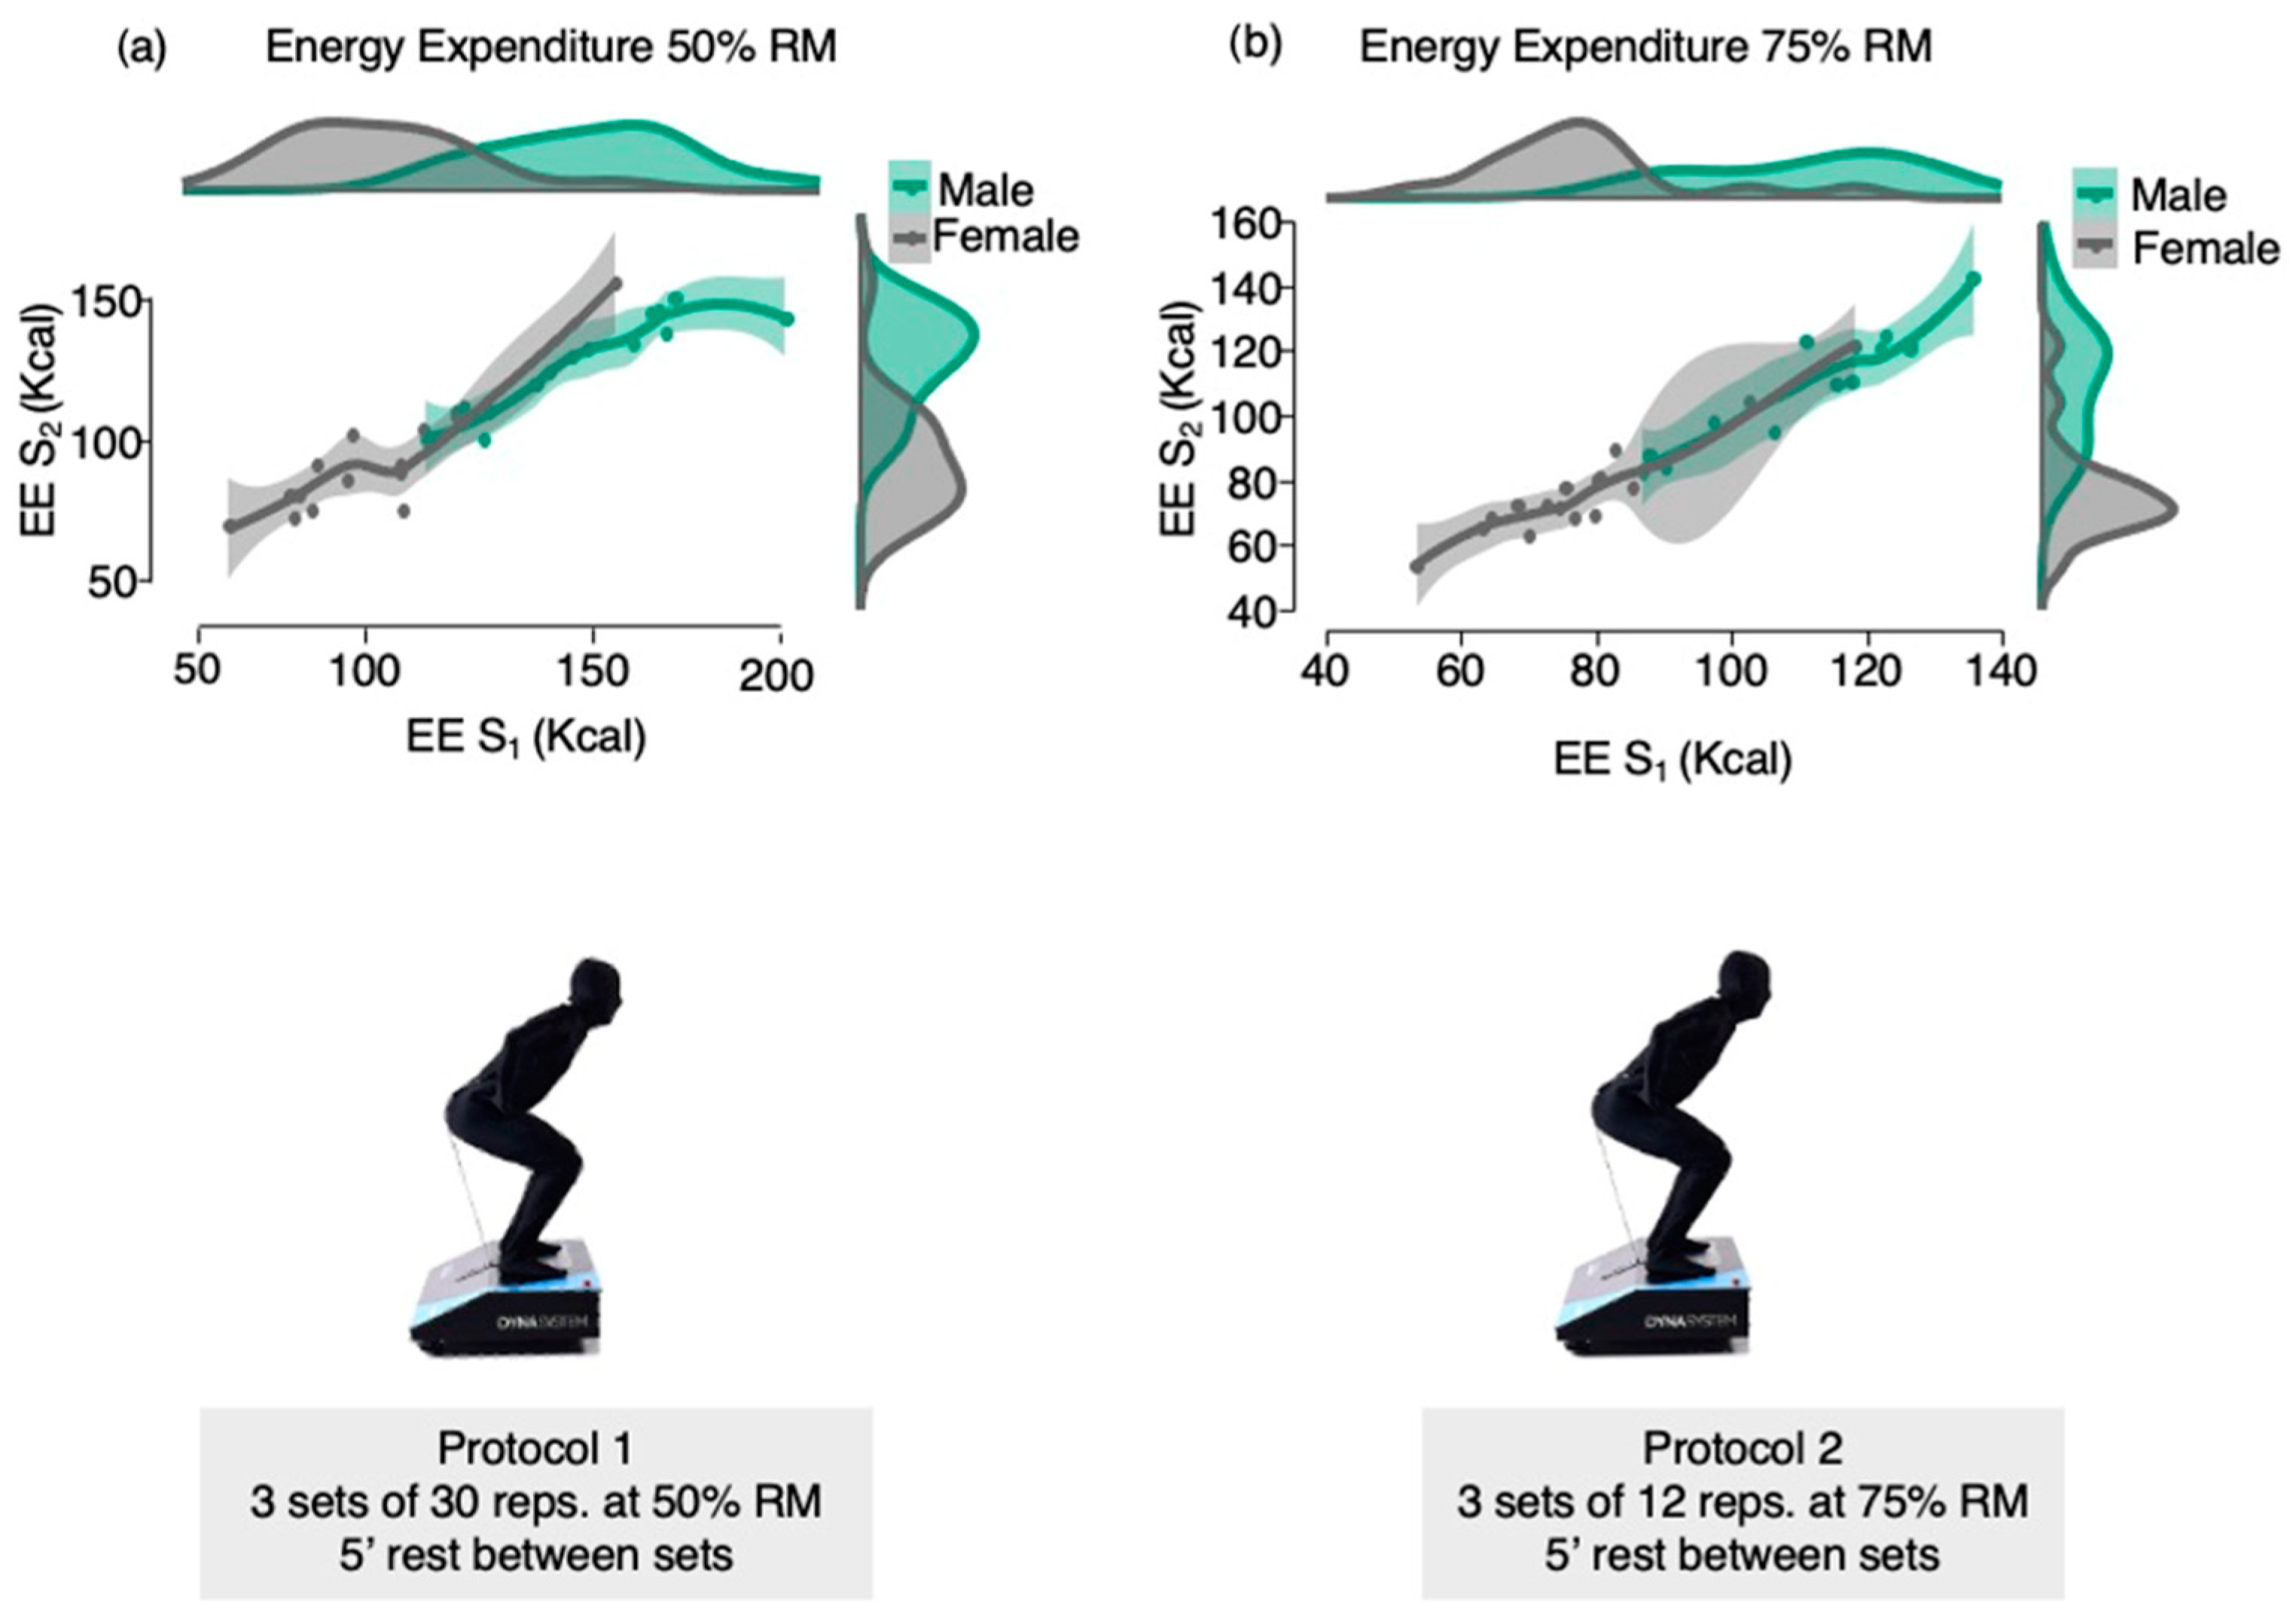
| Total EE for 50% RM S1 (kcal) | 124.1 ± 31.4 | 149.7 ± 21.9 | 103.4 ± 21.0 | p < 0.001 (33.510) |
| Total EE for 50% RM S2 (kcal) | 109.4 ± 26.1 | 128.7 ± 16.8 | 93.7 ± 21.5 | p < 0.001 (22.964) |
| Total EE for 75% RM S1 (kcal) | 92.9 ± 22.9 | 111.3 ± 16.3 | 78.0 ± 15.4 | p < 0.001 (31.964) |
| Total EE for 75% RM S2 (kcal) | 91.6 ± 23.5 | 109.2 ± 18.4 | 77.2 ± 16.4 | p < 0.001 (24.614) |
| EE for 50% RM 10 min rest S1 (kcal) | 26.1 ± 6.5 | 31.1 ± 4.2 | 22.0 ± 4.9 | p < 0.001 (28.009) |
| EE for 50% RM 10 min rest S2 (kcal) | 13.7 ± 3.4 | 16.4 ± 2.6 | 11.6 ± 2.3 | p < 0.001 (27.610) |
| EE for 75% RM 10 min rest S1 (kcal) | 15.0 ± 3.5 | 17.3 ± 2.5 | 13.2 ± 3.3 | p = 0.001 (13.667) |
| EE for 75% RM 10 min rest S2 (kcal) | 13.7 ± 3.6 | 16.5 ± 3.0 | 11.4 ± 2.1 | p < 0.001 (28.724) |
| 50% RM kcal Total S1 | 50% RM kcal Total S2 | |||||||
|---|---|---|---|---|---|---|---|---|
| β (95%CI) | Beta | SE | p-Value | β (95%CI) | Beta | SE | p-Value | |
| Sex | −37.28 (−52.26; −22.31) | −0.60 | 7.27 | p < 0.001 | −26.63 (−39.95; −13.32) | −0.52 | 6.46 | p < 0.001 |
| BMI (kg/m2) | 4.19 (1.67; 6.72) | 0.40 | 1.23 | 0.002 | 4.13 (1.88; 6.38) | 0.47 | 1.09 | p = 0.001 |
| 75%RM kcal Total S1 | 75% RM kcal Total S2 | |||||||
|---|---|---|---|---|---|---|---|---|
| β (95% CI) | Beta | SE | p-Value | β (95% CI) | Beta | SE | p-Value | |
| Sex | −27.79 (−39.49; −16.10) | −0.61 | 5.68 | p < 0.001 | −24.52 (−36.07; −12.96) | −0.53 | 5.61 | p < 0.001 |
| BMI (kg/m2) | 2.75 (0.77; 4.72) | 0.36 | 0.96 | p = 0.008 | 3.78 (1.83; 5.73) | 0.48 | 0.95 | p = 0.001 |
Disclaimer/Publisher’s Note: The statements, opinions and data contained in all publications are solely those of the individual author(s) and contributor(s) and not of MDPI and/or the editor(s). MDPI and/or the editor(s) disclaim responsibility for any injury to people or property resulting from any ideas, methods, instructions or products referred to in the content. |
© 2023 by the authors. Licensee MDPI, Basel, Switzerland. This article is an open access article distributed under the terms and conditions of the Creative Commons Attribution (CC BY) license (https://creativecommons.org/licenses/by/4.0/).
Share and Cite
del-Cuerpo, I.; Jerez-Mayorga, D.; Chirosa-Ríos, L.J.; Morenas-Aguilar, M.D.; Mariscal-Arcas, M.; López-Moro, A.; Delgado-Floody, P. Males Have a Higher Energy Expenditure than Females during Squat Training. Nutrients 2023, 15, 3455. https://doi.org/10.3390/nu15153455
del-Cuerpo I, Jerez-Mayorga D, Chirosa-Ríos LJ, Morenas-Aguilar MD, Mariscal-Arcas M, López-Moro A, Delgado-Floody P. Males Have a Higher Energy Expenditure than Females during Squat Training. Nutrients. 2023; 15(15):3455. https://doi.org/10.3390/nu15153455
Chicago/Turabian Styledel-Cuerpo, Indya, Daniel Jerez-Mayorga, Luis Javier Chirosa-Ríos, María Dolores Morenas-Aguilar, Miguel Mariscal-Arcas, Alejandro López-Moro, and Pedro Delgado-Floody. 2023. "Males Have a Higher Energy Expenditure than Females during Squat Training" Nutrients 15, no. 15: 3455. https://doi.org/10.3390/nu15153455
APA Styledel-Cuerpo, I., Jerez-Mayorga, D., Chirosa-Ríos, L. J., Morenas-Aguilar, M. D., Mariscal-Arcas, M., López-Moro, A., & Delgado-Floody, P. (2023). Males Have a Higher Energy Expenditure than Females during Squat Training. Nutrients, 15(15), 3455. https://doi.org/10.3390/nu15153455