

Effect of Dietary Patterns on Inflammatory Bowel Disease: A Machine Learning Bibliometric and Visualization Analysis

Abstract
:1. Introduction
2. Materials and Methods
2.1. Data Source
2.2. Data Processing
2.3. Data Analysis
3. Result
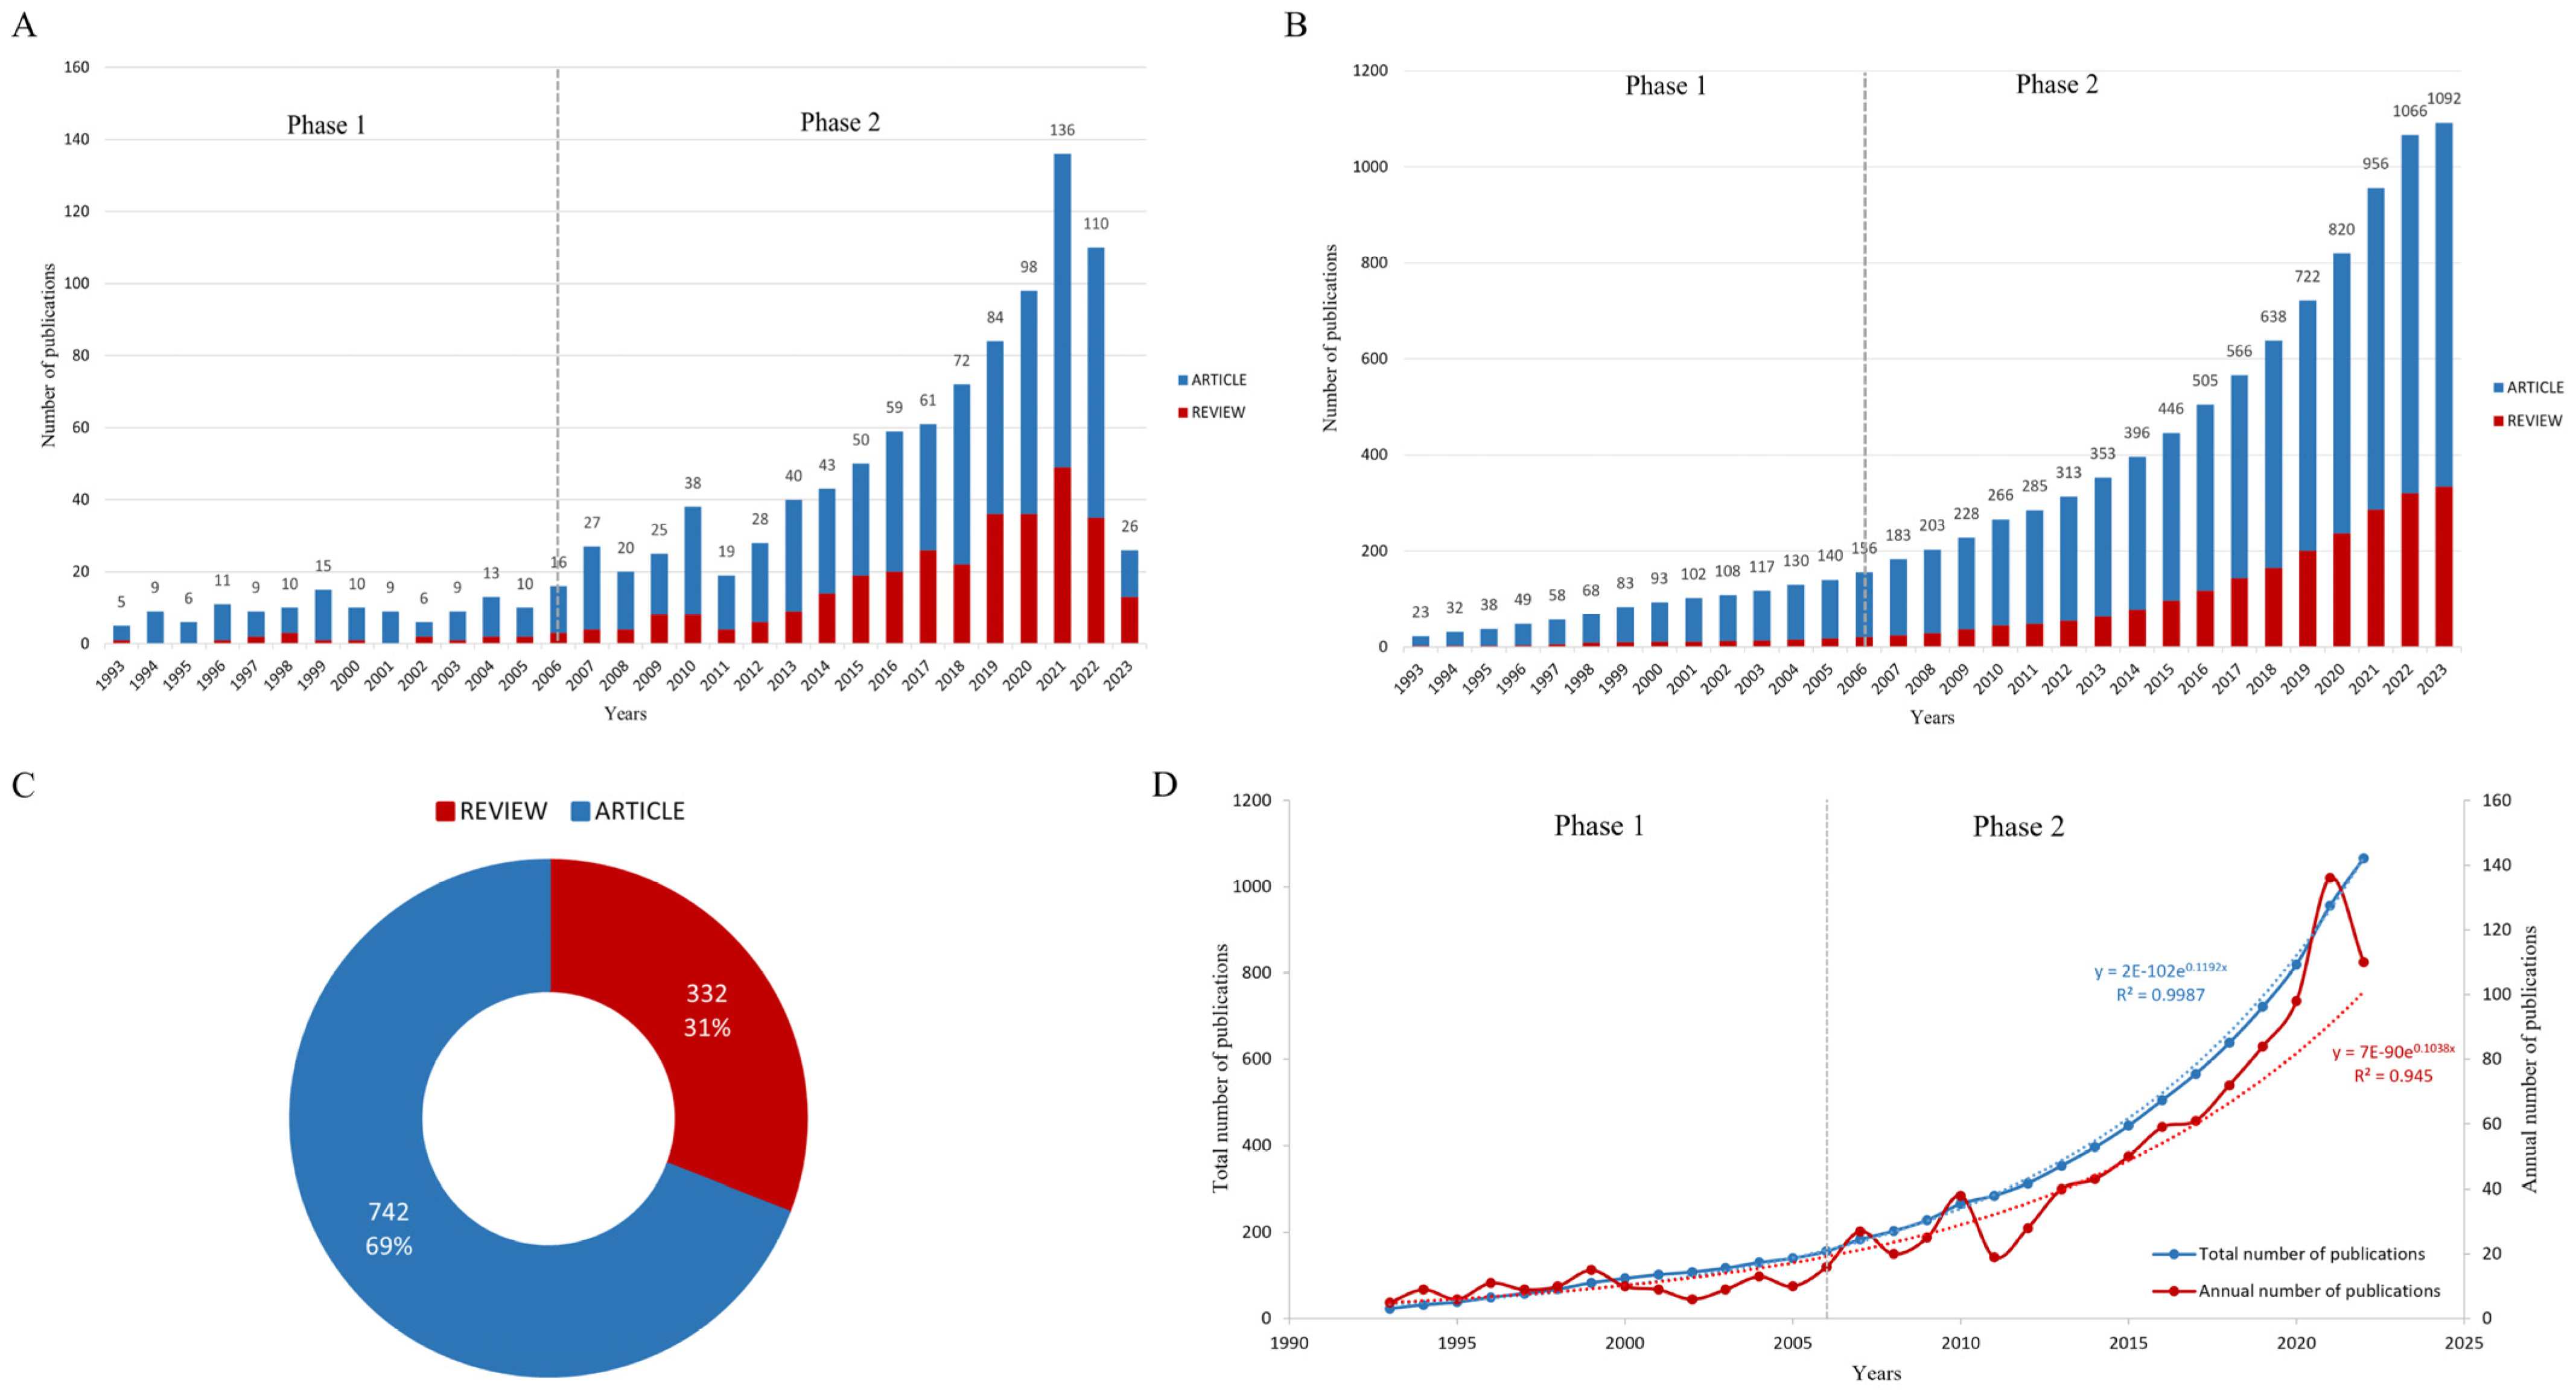
3.1. The Number of Publications and General Characteristics
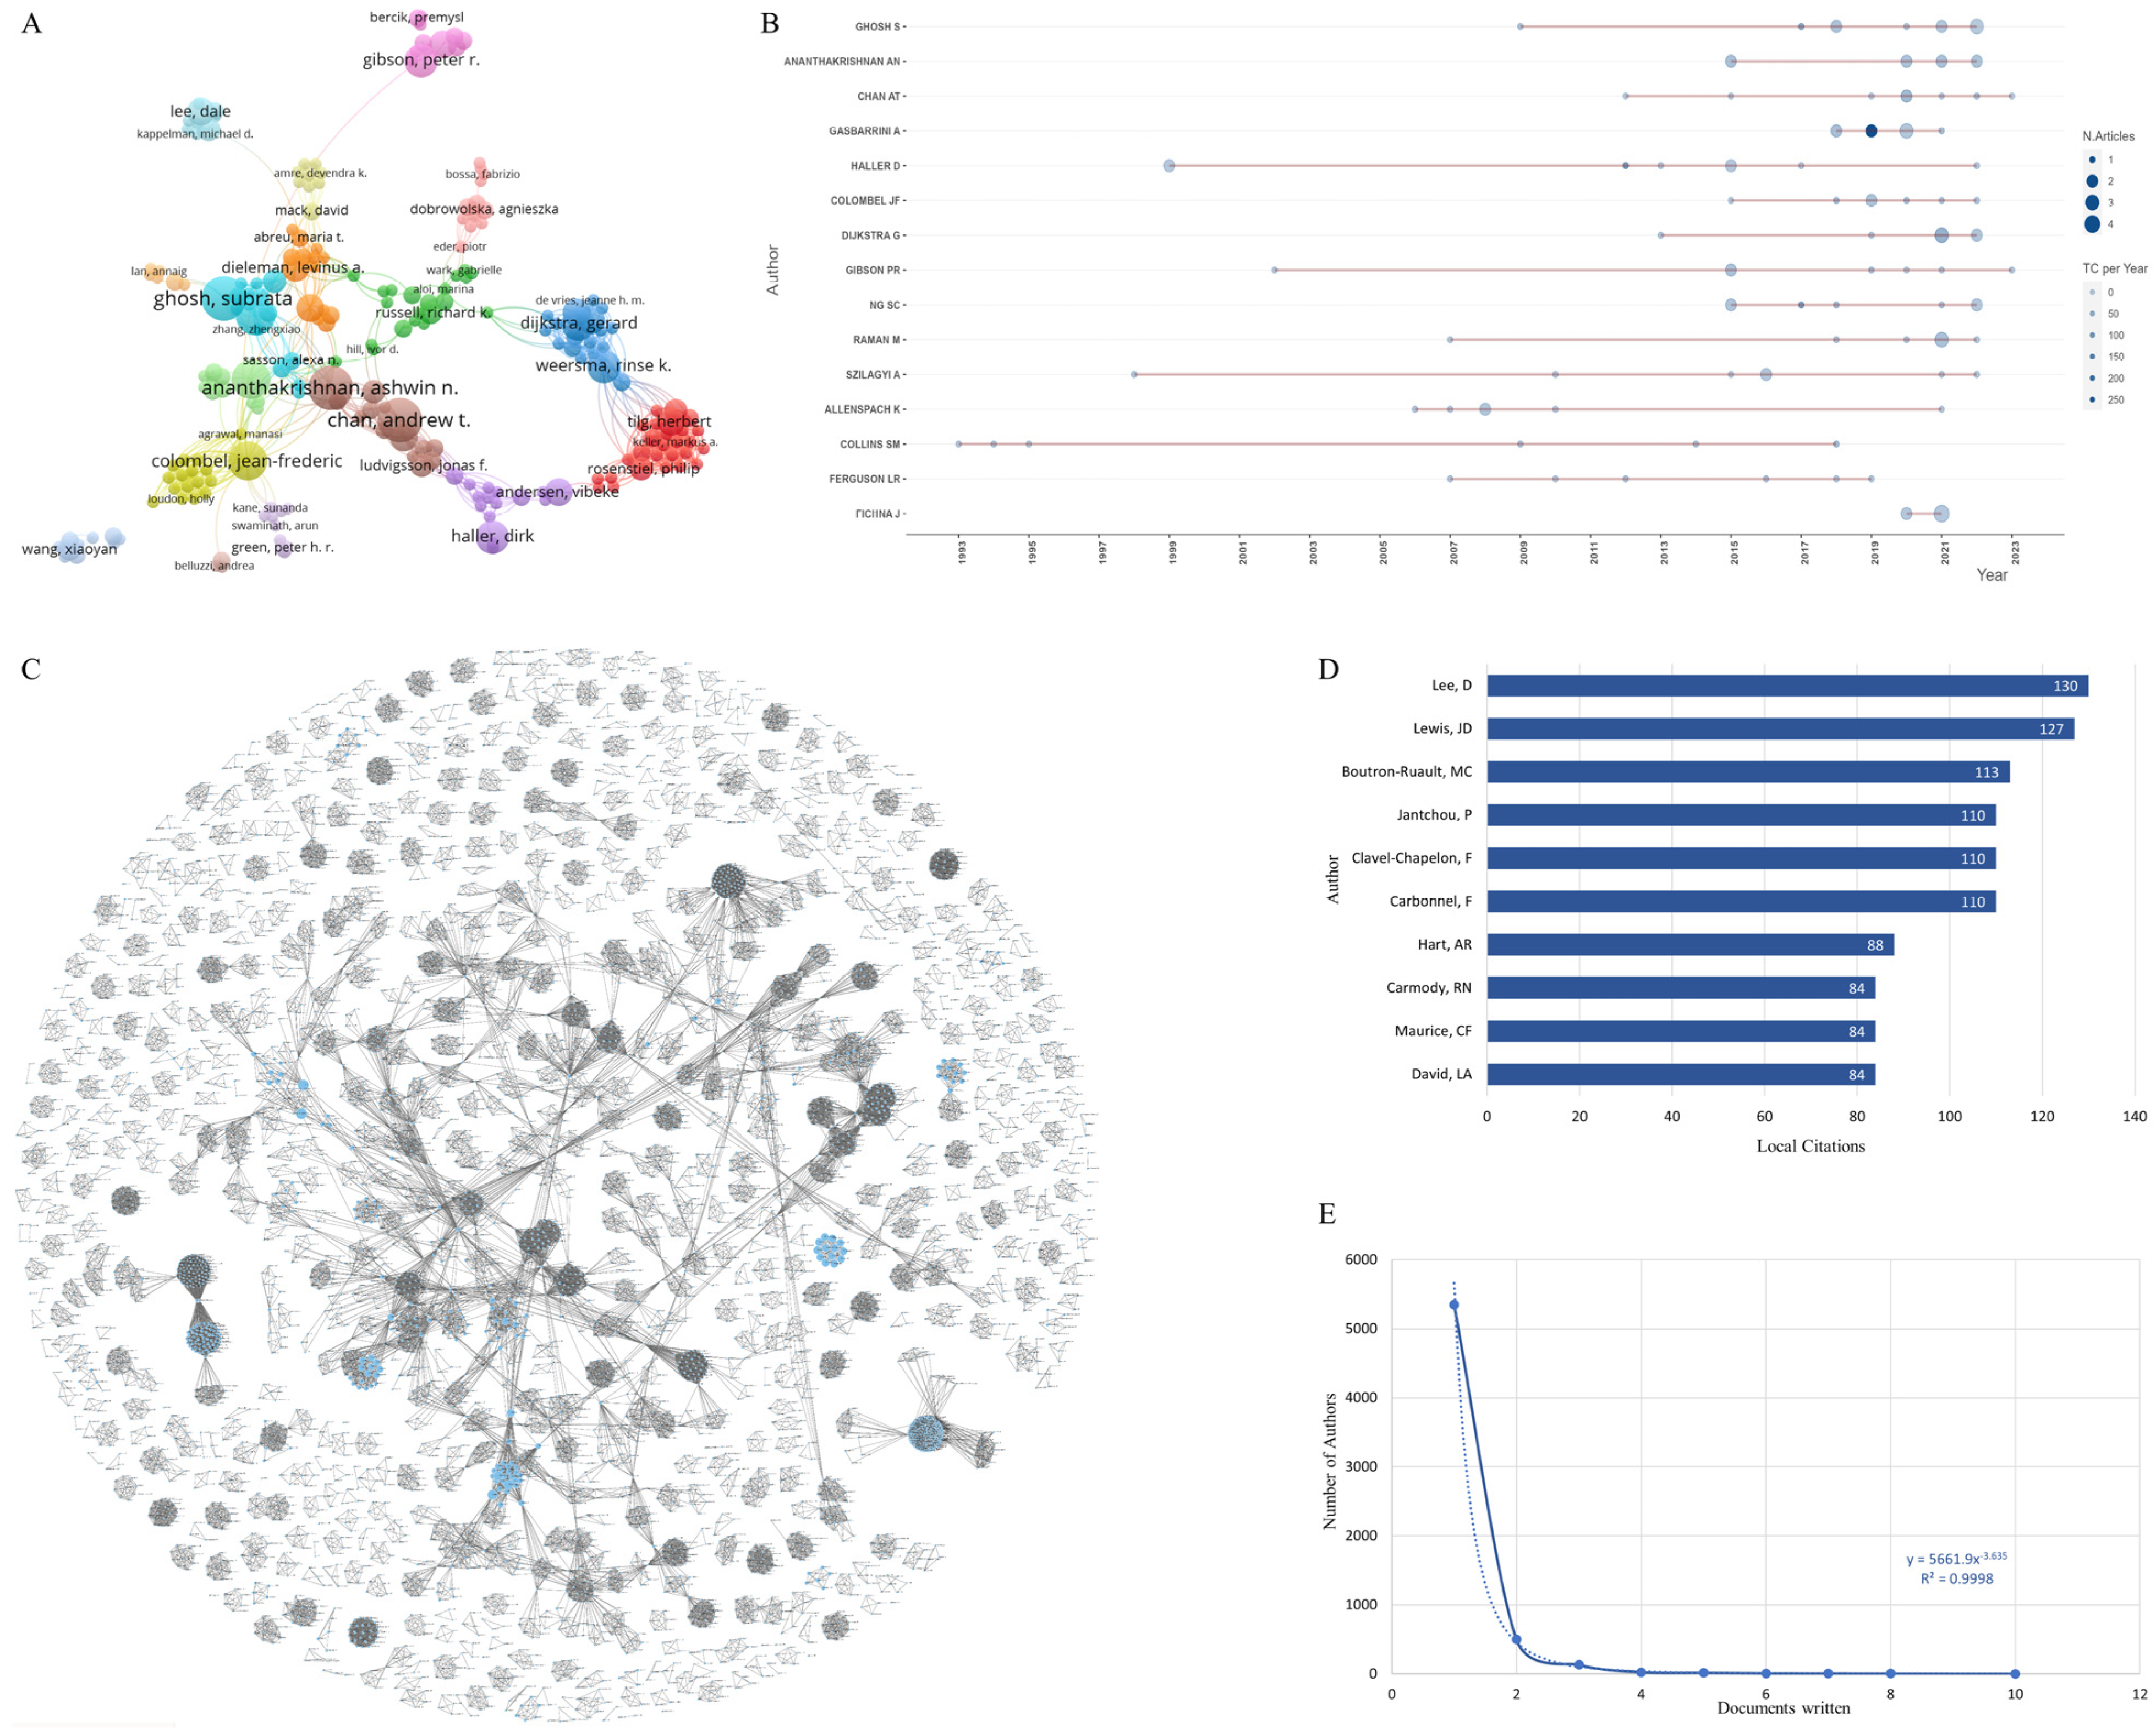
3.2. Author Analysis
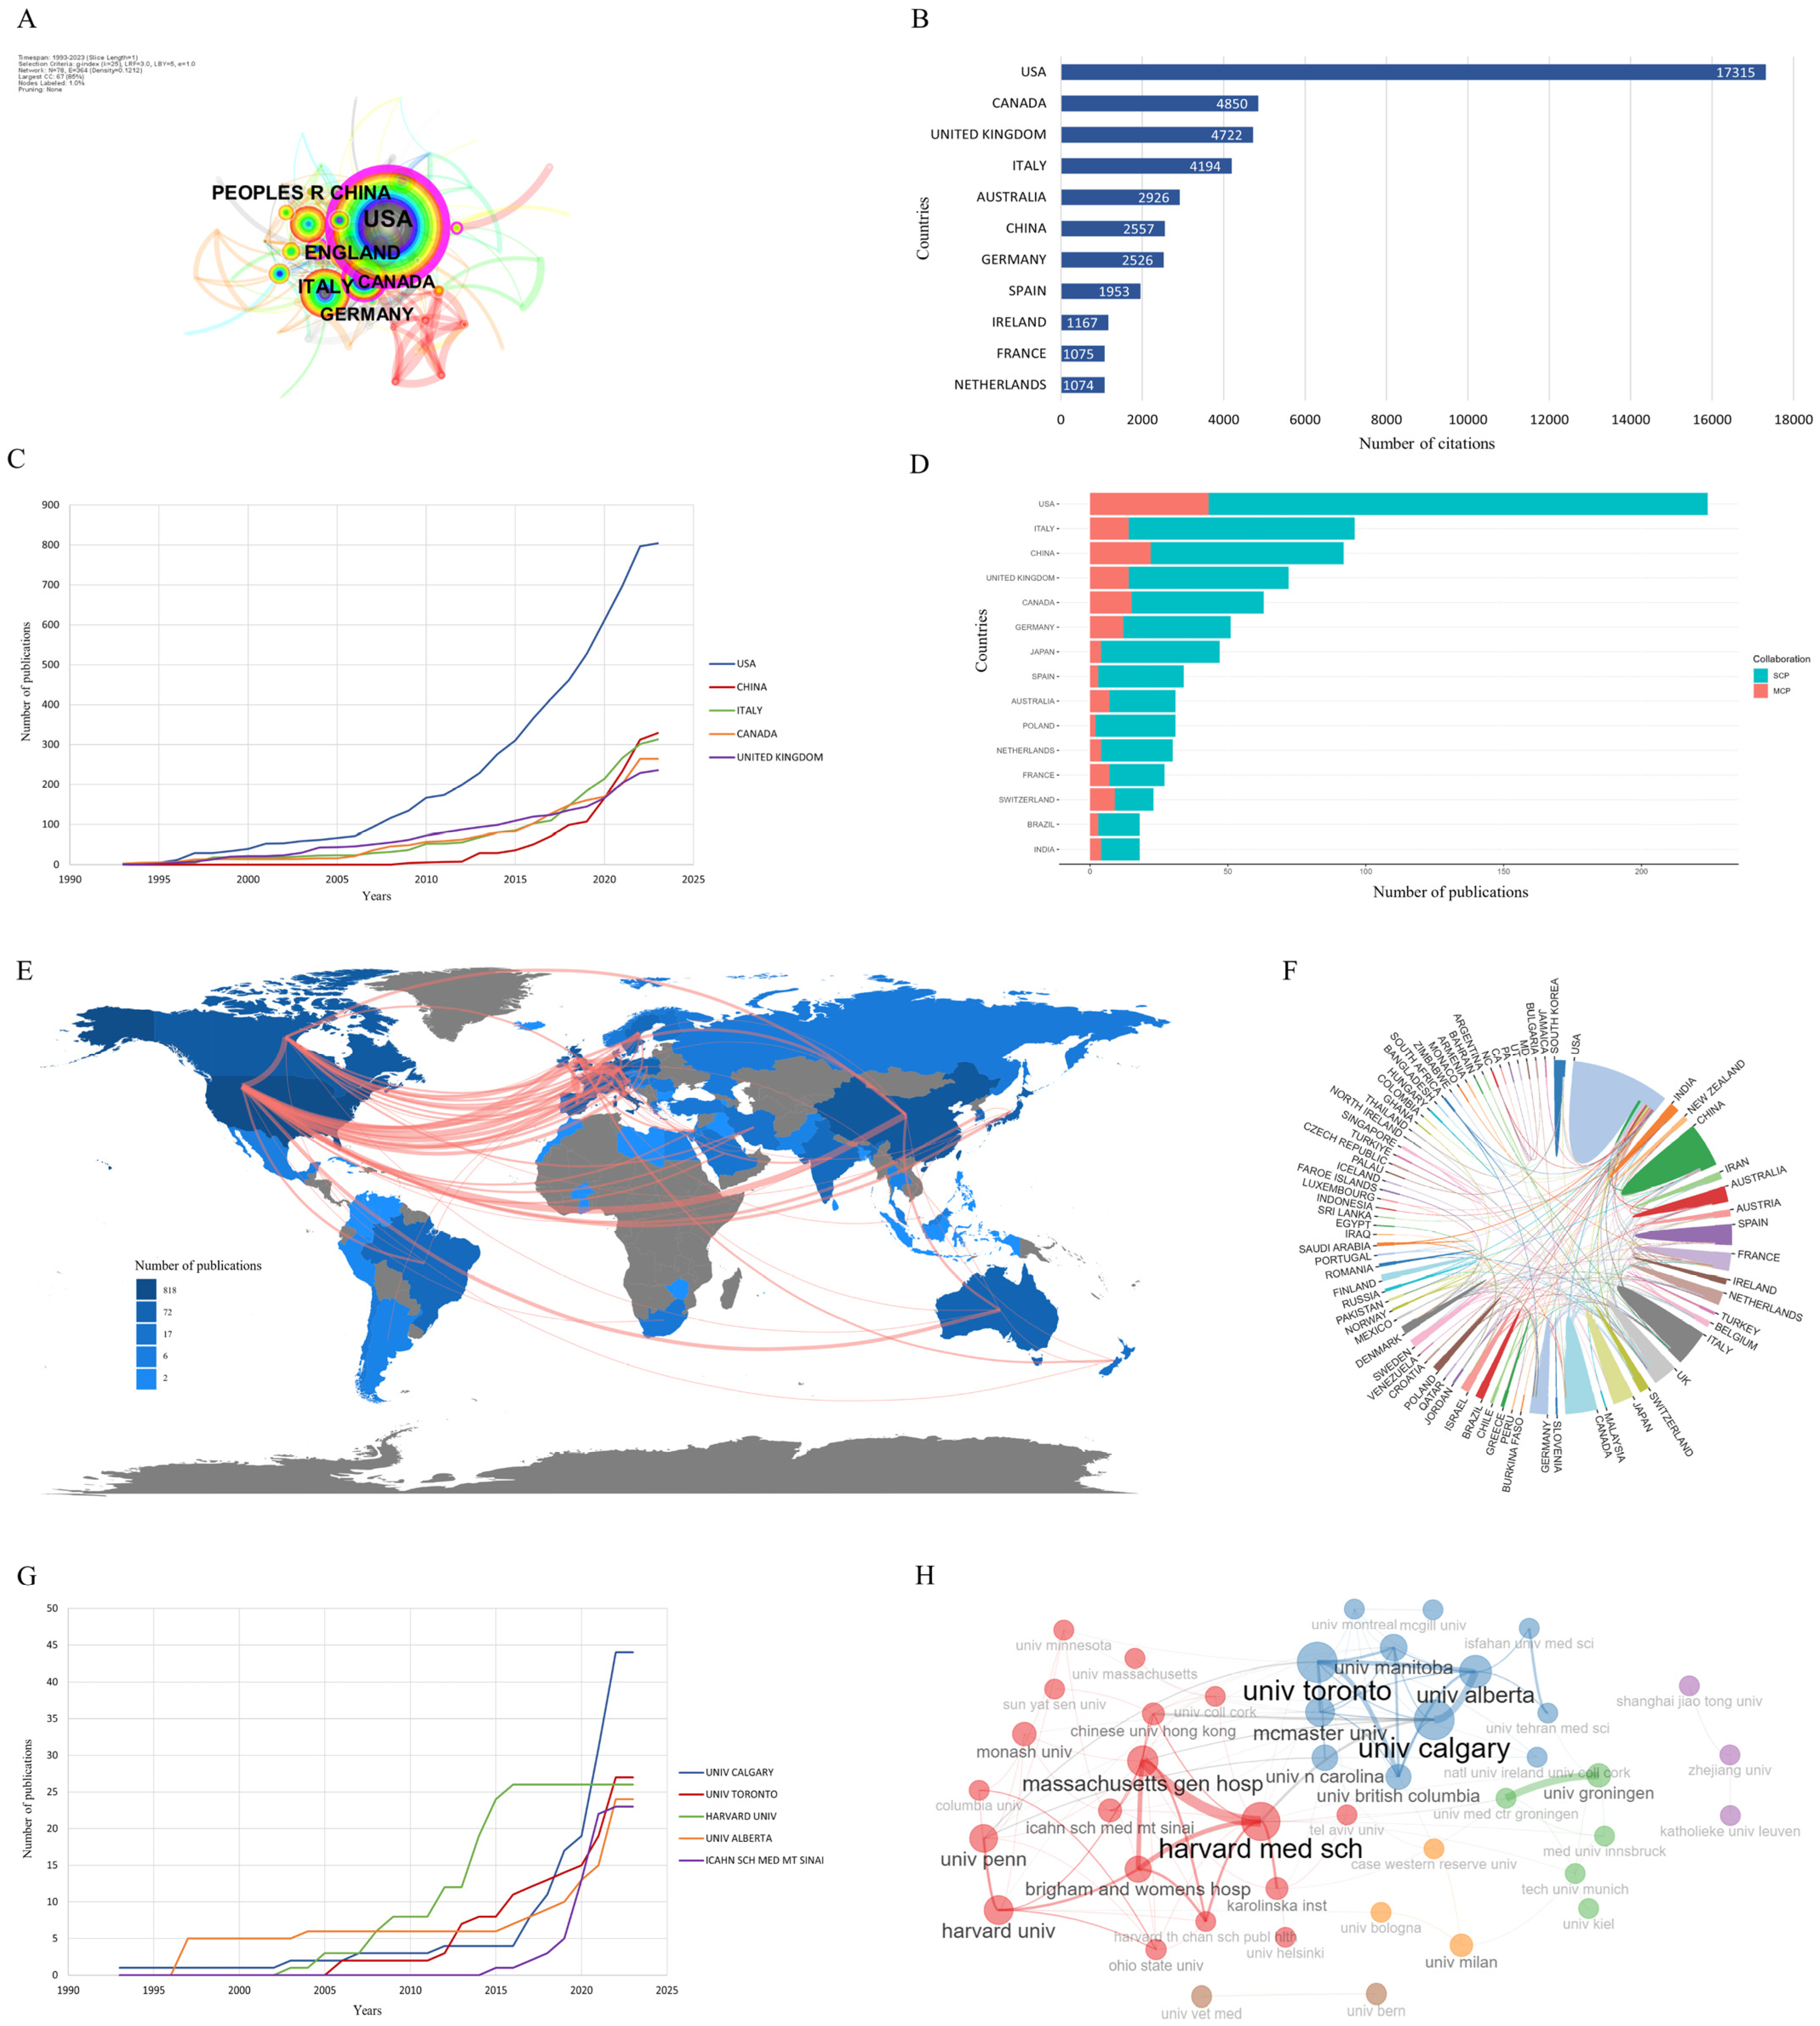
3.3. Analysis of Cooperation between Countries and Institutions
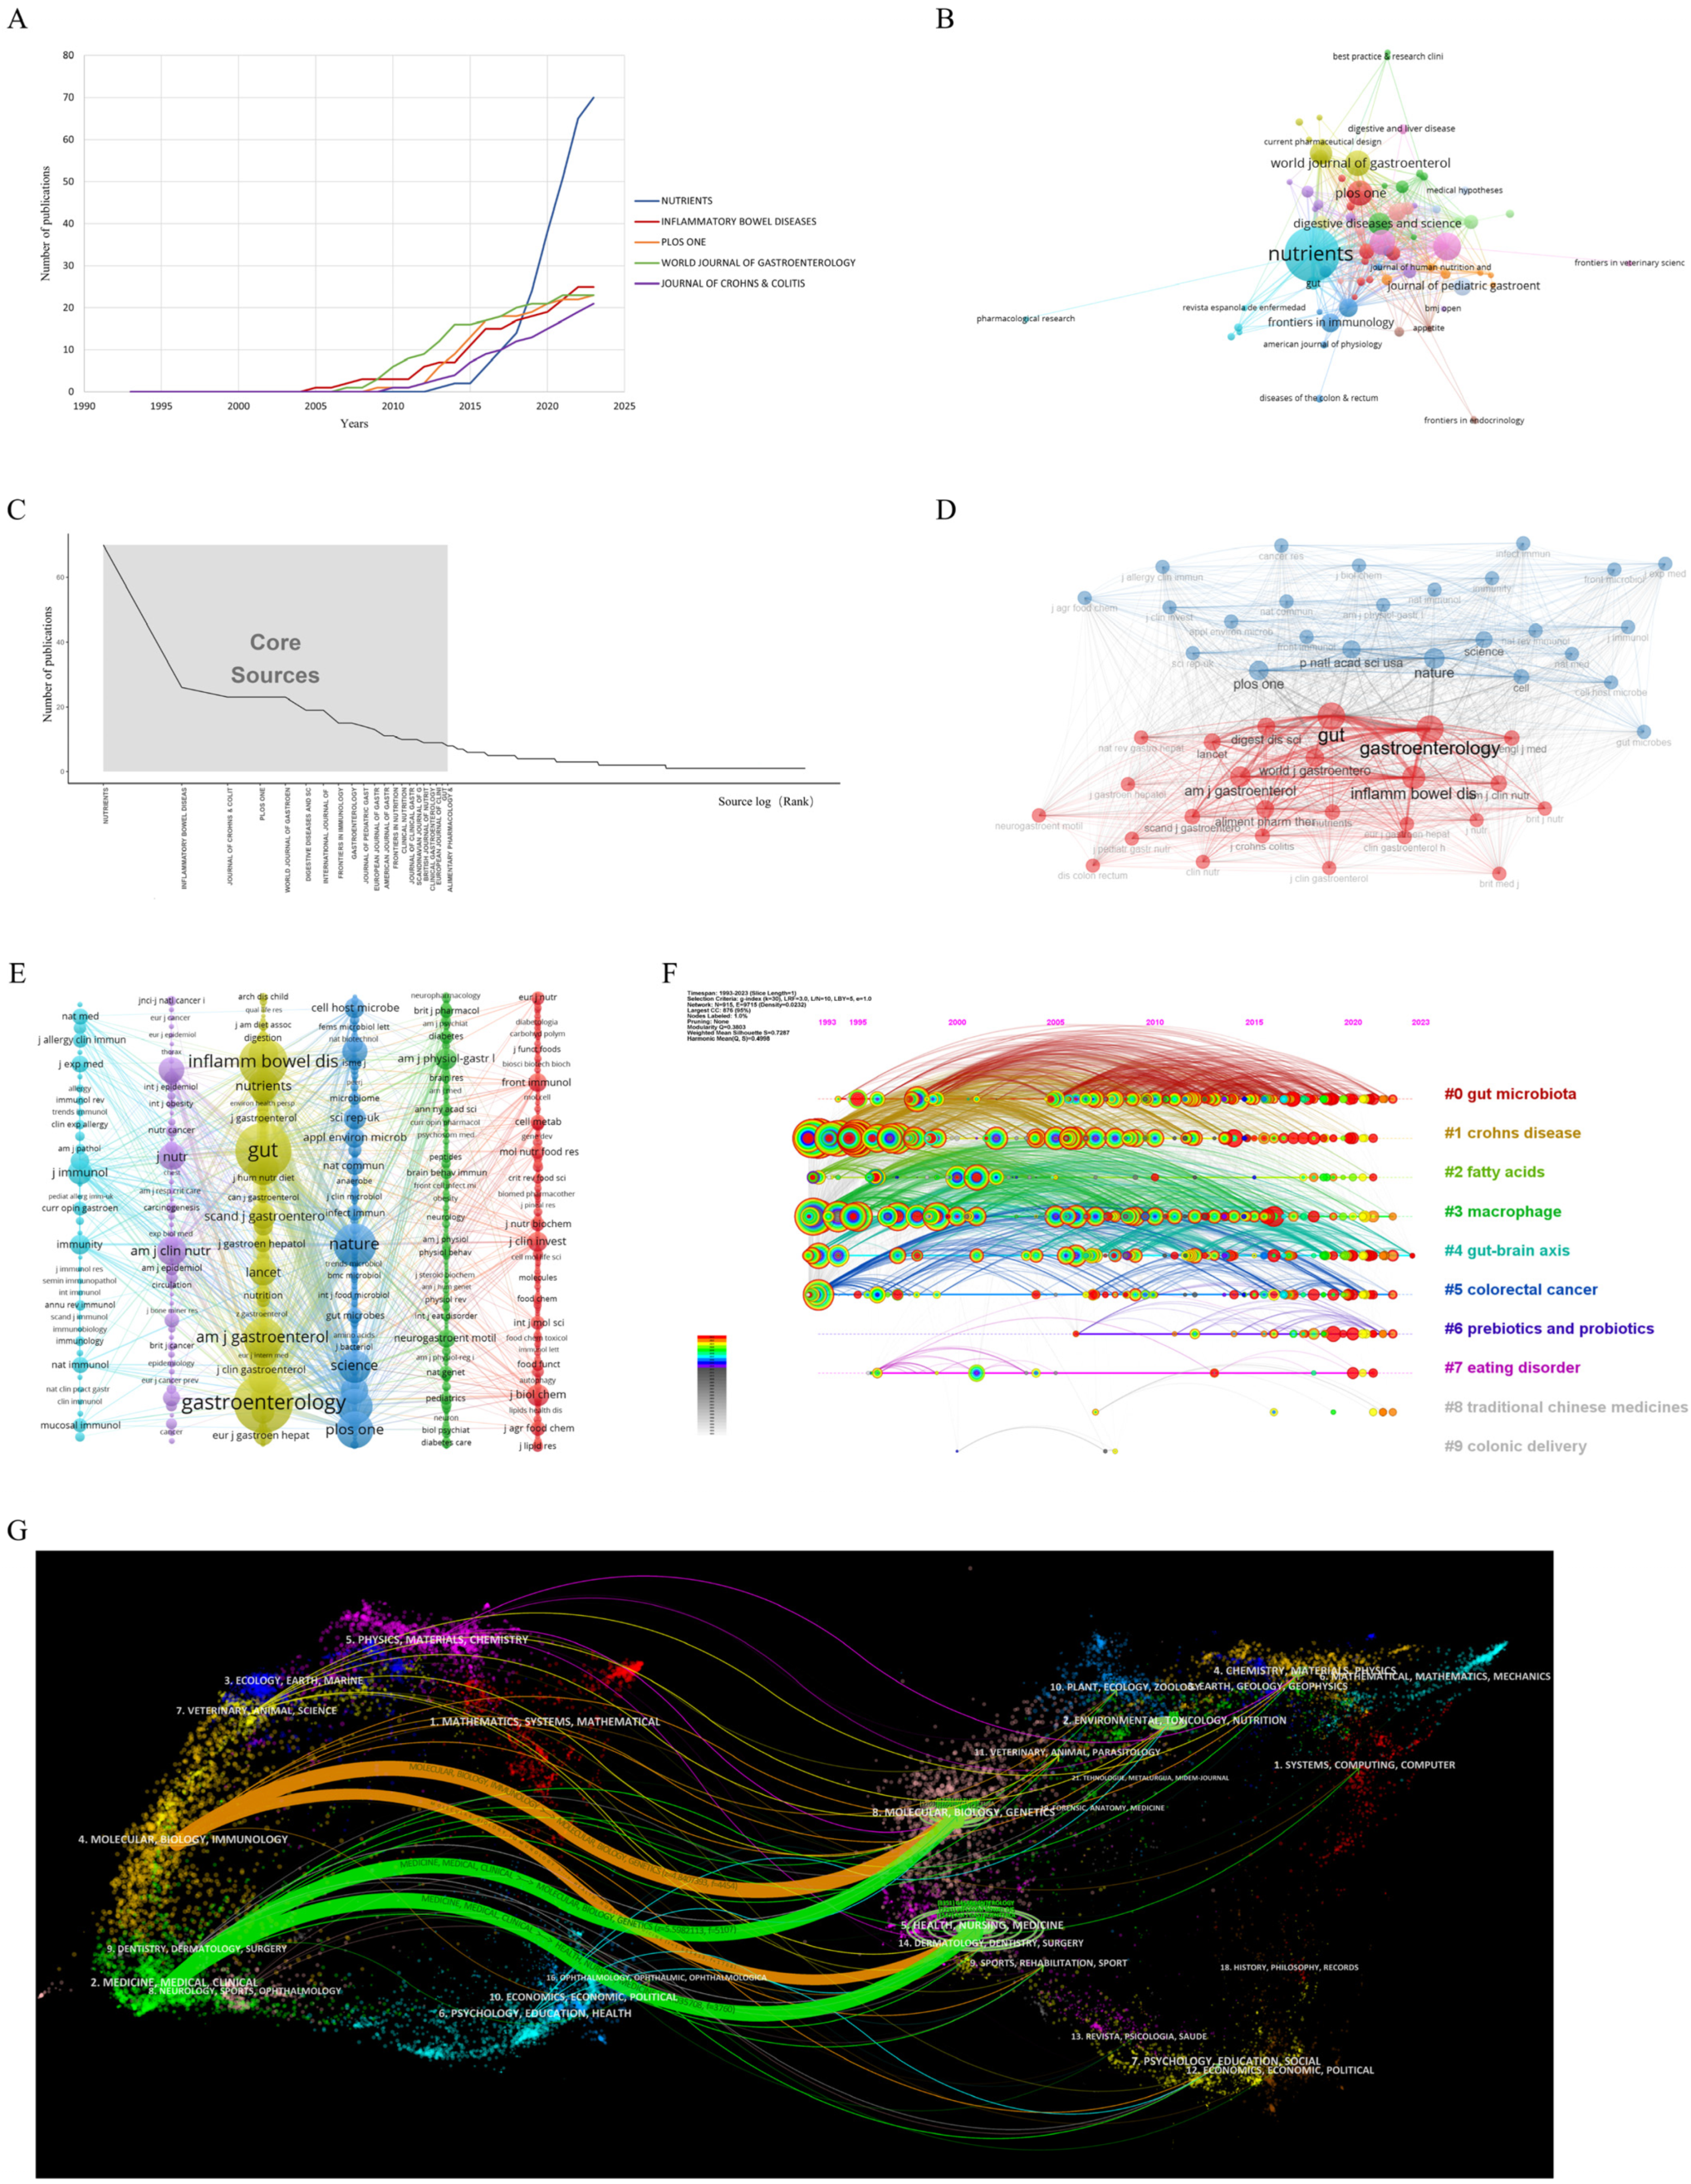
3.4. Journals Analysis
3.5. Literature and Citation Analysis
3.6. Keyword Analysis
3.6.1. Keyword Frequency Analysis
3.6.2. Keyword Cluster Analysis
3.6.3. Keyword Evolution and Emergent Analysis
4. Discussion
5. Conclusions
Supplementary Materials
Author Contributions
Funding
Institutional Review Board Statement
Informed Consent Statement
Data Availability Statement
Acknowledgments
Conflicts of Interest
Abbreviations
References
- Ng, S.C.; Shi, H.Y.; Hamidi, N.; Underwood, F.E.; Tang, W.; Benchimol, E.I.; Panaccione, R.; Ghosh, S.; Wu, J.C.Y.; Chan, F.K.L.; et al. Worldwide Incidence and Prevalence of Inflammatory Bowel Disease in the 21st Century: A Systematic Review of Population-Based Studies. Lancet 2017, 390, 2769–2778. [Google Scholar] [CrossRef] [PubMed]
- Wark, G.; Samocha-Bonet, D.; Ghaly, S.; Danta, M. The Role of Diet in the Pathogenesis and Management of Inflammatory Bowel Disease: A Review. Nutrients 2020, 13, 135. [Google Scholar] [CrossRef] [PubMed]
- Khalili, H.; Chan, S.S.M.; Lochhead, P.; Ananthakrishnan, A.N.; Hart, A.R.; Chan, A.T. The Role of Diet in the Aetiopathogenesis of Inflammatory Bowel Disease. Nat. Rev. Gastroenterol. Hepatol. 2018, 15, 525–535. [Google Scholar] [CrossRef] [PubMed] [Green Version]
- Tracy, M.; Khalili, H. You Are What You Eat? Growing Evidence That Diet Influences the Risk of Inflammatory Bowel Disease. J. Crohns Colitis 2022, 16, 1185–1186. [Google Scholar] [CrossRef]
- Liu, C.; Yu, R.; Zhang, J.; Wei, S.; Xue, F.; Guo, Y.; He, P.; Shang, L.; Dong, W. Research Hotspot and Trend Analysis in the Diagnosis of Inflammatory Bowel Disease: A Machine Learning Bibliometric Analysis from 2012 to 2021. Front. Immunol. 2022, 13, 972079. [Google Scholar] [CrossRef]
- Liu, C.; Su, W.; Tan, Z.; Zhang, J.; Dong, W. The Interaction between Microbiota and Immune in Intestinal Inflammatory Diseases: Global Research Status and Trends. Front. Cell Infect. Microbiol. 2023, 13, 1128249. [Google Scholar] [CrossRef] [PubMed]
- Healthy Diet. Available online: https://www.who.int/news-room/fact-sheets/detail/healthy-diet (accessed on 20 May 2023).
- National Academies of Sciences, Engineering, and Medicine; Health and Medicine Division; Food and Nutrition Board; Committee to Review the Process to Update the Dietary Guidelines for Americans. Redesigning the Process for Establishing the Dietary Guidelines for Americans; National Academies Press: Washington, DC, USA, 2017. [Google Scholar]
- Nicholls, P.T. Bibliometric Modeling Processes and the Empirical Validity of Lotka’s Law. J. Am. Soc. Inf. Sci. 1989, 40, 379–385. [Google Scholar] [CrossRef]
- David, L.A.; Maurice, C.F.; Carmody, R.N.; Gootenberg, D.B.; Button, J.E.; Wolfe, B.E.; Ling, A.V.; Devlin, A.S.; Varma, Y.; Fischbach, M.A.; et al. Diet Rapidly and Reproducibly Alters the Human Gut Microbiome. Nature 2014, 505, 559–563. [Google Scholar] [CrossRef] [Green Version]
- Wu, G.D.; Chen, J.; Hoffmann, C.; Bittinger, K.; Chen, Y.-Y.; Keilbaugh, S.A.; Bewtra, M.; Knights, D.; Walters, W.A.; Knight, R.; et al. Linking Long-Term Dietary Patterns with Gut Microbial Enterotypes. Science 2011, 334, 105–108. [Google Scholar] [CrossRef] [Green Version]
- De Filippo, C.; Cavalieri, D.; Di Paola, M.; Ramazzotti, M.; Poullet, J.B.; Massart, S.; Collini, S.; Pieraccini, G.; Lionetti, P. Impact of Diet in Shaping Gut Microbiota Revealed by a Comparative Study in Children from Europe and Rural Africa. Proc. Natl. Acad. Sci. USA 2010, 107, 14691–14696. [Google Scholar] [CrossRef]
- Chassaing, B.; Koren, O.; Goodrich, J.K.; Poole, A.C.; Srinivasan, S.; Ley, R.E.; Gewirtz, A.T. Dietary Emulsifiers Impact the Mouse Gut Microbiota Promoting Colitis and Metabolic Syndrome. Nature 2015, 519, 92–96. [Google Scholar] [CrossRef] [Green Version]
- Devkota, S.; Wang, Y.; Musch, M.W.; Leone, V.; Fehlner-Peach, H.; Nadimpalli, A.; Antonopoulos, D.A.; Jabri, B.; Chang, E.B. Dietary-Fat-Induced Taurocholic Acid Promotes Pathobiont Expansion and Colitis in Il10-/- Mice. Nature 2012, 487, 104–108. [Google Scholar] [CrossRef] [Green Version]
- Jantchou, P.; Morois, S.; Clavel-Chapelon, F.; Boutron-Ruault, M.-C.; Carbonnel, F. Animal Protein Intake and Risk of Inflammatory Bowel Disease: The E3N Prospective Study. Am. J. Gastroenterol. 2010, 105, 2195–2201. [Google Scholar] [CrossRef]
- Hou, J.K.; Abraham, B.; El-Serag, H. Dietary Intake and Risk of Developing Inflammatory Bowel Disease: A Systematic Review of the Literature. Am. J. Gastroenterol. 2011, 106, 563–573. [Google Scholar] [CrossRef]
- Jowett, S.L.; Seal, C.J.; Pearce, M.S.; Phillips, E.; Gregory, W.; Barton, J.R.; Welfare, M.R. Influence of Dietary Factors on the Clinical Course of Ulcerative Colitis: A Prospective Cohort Study. Gut 2004, 53, 1479–1484. [Google Scholar] [CrossRef] [PubMed] [Green Version]
- Ananthakrishnan, A.N.; Khalili, H.; Konijeti, G.G.; Higuchi, L.M.; de Silva, P.; Fuchs, C.S.; Willett, W.C.; Richter, J.M.; Chan, A.T. Long-Term Intake of Dietary Fat and Risk of Ulcerative Colitis and Crohn’s Disease. Gut 2014, 63, 776–784. [Google Scholar] [CrossRef] [PubMed] [Green Version]
- Racine, A.; Carbonnel, F.; Chan, S.S.M.; Hart, A.R.; Bueno-de-Mesquita, H.B.; Oldenburg, B.; van Schaik, F.D.M.; Tjønneland, A.; Olsen, A.; Dahm, C.C.; et al. Dietary Patterns and Risk of Inflammatory Bowel Disease in Europe: Results from the EPIC Study. Inflamm. Bowel Dis. 2016, 22, 345–354. [Google Scholar] [CrossRef] [PubMed] [Green Version]
- Molodecky, N.A.; Soon, I.S.; Rabi, D.M.; Ghali, W.A.; Ferris, M.; Chernoff, G.; Benchimol, E.I.; Panaccione, R.; Ghosh, S.; Barkema, H.W.; et al. Increasing Incidence and Prevalence of the Inflammatory Bowel Diseases with Time, Based on Systematic Review. Gastroenterology 2012, 142, 46–54.e42. [Google Scholar] [CrossRef] [PubMed] [Green Version]
- Frank, D.N.; St Amand, A.L.; Feldman, R.A.; Boedeker, E.C.; Harpaz, N.; Pace, N.R. Molecular-Phylogenetic Characterization of Microbial Community Imbalances in Human Inflammatory Bowel Diseases. Proc. Natl. Acad. Sci. USA 2007, 104, 13780–13785. [Google Scholar] [CrossRef]
- Levine, A.; Wine, E.; Assa, A.; Sigall Boneh, R.; Shaoul, R.; Kori, M.; Cohen, S.; Peleg, S.; Shamaly, H.; On, A.; et al. Crohn’s Disease Exclusion Diet Plus Partial Enteral Nutrition Induces Sustained Remission in a Randomized Controlled Trial. Gastroenterology 2019, 157, 440–450. [Google Scholar] [CrossRef] [Green Version]
- Levine, A.; Sigall Boneh, R.; Wine, E. Evolving Role of Diet in the Pathogenesis and Treatment of Inflammatory Bowel Diseases. Gut 2018, 67, 1726–1738. [Google Scholar] [CrossRef] [PubMed]
- Kaplan, G.G.; Windsor, J.W. The Four Epidemiological Stages in the Global Evolution of Inflammatory Bowel Disease. Nat. Rev. Gastroenterol. Hepatol. 2021, 18, 56–66. [Google Scholar] [CrossRef] [PubMed]
- Ma, C.; Battat, R.; Dulai, P.S.; Parker, C.E.; Sandborn, W.J.; Feagan, B.G.; Jairath, V. Innovations in Oral Therapies for Inflammatory Bowel Disease. Drugs 2019, 79, 1321–1335. [Google Scholar] [CrossRef] [PubMed]
- Bourgonje, A.R.; Vogl, T.; Segal, E.; Weersma, R.K. Antibody Signatures in Inflammatory Bowel Disease: Current Developments and Future Applications. Trends Mol. Med. 2022, 28, 693–705. [Google Scholar] [CrossRef]
- Postler, T.S.; Ghosh, S. Understanding the Holobiont: How Microbial Metabolites Affect Human Health and Shape the Immune System. Cell Metab. 2017, 26, 110–130. [Google Scholar] [CrossRef] [Green Version]
- Rinninella, E.; Raoul, P.; Cintoni, M.; Franceschi, F.; Miggiano, G.A.D.; Gasbarrini, A.; Mele, M.C. What Is the Healthy Gut Microbiota Composition? A Changing Ecosystem across Age, Environment, Diet, and Diseases. Microorganisms 2019, 7, 14. [Google Scholar] [CrossRef] [Green Version]
- Rinninella, E.; Cintoni, M.; Raoul, P.; Lopetuso, L.R.; Scaldaferri, F.; Pulcini, G.; Miggiano, G.A.D.; Gasbarrini, A.; Mele, M.C. Food Components and Dietary Habits: Keys for a Healthy Gut Microbiota Composition. Nutrients 2019, 11, 2393. [Google Scholar] [CrossRef] [Green Version]
- Wei, Z. Research on the Philosophical Relationship between Science Technology and Social Development. In Proceedings of the 2018 International Workshop on Advances in Social Sciences (IWASS 2018); Zhu, Z., Ed.; Francis Acad. Press: London, UK, 2019; pp. 56–59. [Google Scholar]
- Torres, J.; Petralia, F.; Sato, T.; Wang, P.; Telesco, S.E.; Choung, R.S.; Strauss, R.; Li, X.-J.; Laird, R.M.; Gutierrez, R.L.; et al. Serum Biomarkers Identify Patients Who Will Develop Inflammatory Bowel Diseases Up to 5 Years Before Diagnosis. Gastroenterology 2020, 159, 96–104. [Google Scholar] [CrossRef]
- Maslowski, K.M.; Vieira, A.T.; Ng, A.; Kranich, J.; Sierro, F.; Yu, D.; Schilter, H.C.; Rolph, M.S.; Mackay, F.; Artis, D.; et al. Regulation of Inflammatory Responses by Gut Microbiota and Chemoattractant Receptor GPR43. Nature 2009, 461, 1282–1286. [Google Scholar] [CrossRef] [Green Version]
- Zhang, P. Influence of Foods and Nutrition on the Gut Microbiome and Implications for Intestinal Health. Int. J. Mol. Sci. 2022, 23, 9588. [Google Scholar] [CrossRef]
- Turpin, W.; Dong, M.; Sasson, G.; Raygoza Garay, J.A.; Espin-Garcia, O.; Lee, S.-H.; Neustaeter, A.; Smith, M.I.; Leibovitzh, H.; Guttman, D.S.; et al. Mediterranean-Like Dietary Pattern Associations with Gut Microbiome Composition and Subclinical Gastrointestinal Inflammation. Gastroenterology 2022, 163, 685–698. [Google Scholar] [CrossRef]
- Peters, V.; Bolte, L.; Schuttert, E.M.; Andreu-Sánchez, S.; Dijkstra, G.; Weersma, R.K.; Campmans-Kuijpers, M.J.E. Western and Carnivorous Dietary Patterns Are Associated with Greater Likelihood of IBD Development in a Large Prospective Population-Based Cohort. J. Crohn’s Colitis 2022, 16, 931. [Google Scholar] [CrossRef] [PubMed]
- Adolph, T.E.; Zhang, J. Diet Fuelling Inflammatory Bowel Diseases: Preclinical and Clinical Concepts. Gut 2022, 71, 2574–2586. [Google Scholar] [CrossRef] [PubMed]
- Grover, Z.; Muir, R.; Lewindon, P. Exclusive Enteral Nutrition Induces Early Clinical, Mucosal and Transmural Remission in Paediatric Crohn’s Disease. J. Gastroenterol. 2014, 49, 638–645. [Google Scholar] [CrossRef] [PubMed]
- Han, Y.M.; Koh, J.; Kim, J.W.; Lee, C.; Koh, S.-J.; Kim, B.; Lee, K.L.; Im, J.P.; Kim, J.S. NF-Kappa B Activation Correlates with Disease Phenotype in Crohn’s Disease. PLoS ONE 2017, 12, e0182071. [Google Scholar] [CrossRef] [Green Version]
- Chen, Y.; Chen, Y.; Cao, P.; Su, W.; Zhan, N.; Dong, W. Fusobacterium Nucleatum Facilitates Ulcerative Colitis through Activating IL-17F Signaling to NF-ΚB via the Upregulation of CARD3 Expression. J. Pathol. 2020, 250, 170–182. [Google Scholar] [CrossRef]
- Li, C.; Liu, M.; Deng, L.; Luo, D.; Ma, R.; Lu, Q. Oxyberberine Ameliorates TNBS-Induced Colitis in Rats through Suppressing Inflammation and Oxidative Stress via Keap1/Nrf2/NF-ΚB Signaling Pathways. Phytomedicine 2023, 116, 154899. [Google Scholar] [CrossRef]
- Willett, W.C.; Sacks, F.; Trichopoulou, A.; Drescher, G.; Ferro-Luzzi, A.; Helsing, E.; Trichopoulos, D. Mediterranean Diet Pyramid: A Cultural Model for Healthy Eating. Am. J. Clin. Nutr. 1995, 61, 1402S–1406S. [Google Scholar] [CrossRef]
- Chicco, F.; Magrì, S.; Cingolani, A.; Paduano, D.; Pesenti, M.; Zara, F.; Tumbarello, F.; Urru, E.; Melis, A.; Casula, L.; et al. Multidimensional Impact of Mediterranean Diet on IBD Patients. Inflamm. Bowel Dis. 2021, 27, 1–9. [Google Scholar] [CrossRef]


| Rank | Author | h_Index | Author | g_Index | Author | m_Index | Author | Total Citation |
|---|---|---|---|---|---|---|---|---|
| 1 | ANANTHAKRISHNAN AN | 7 | GHOSH S | 10 | GASBARRINI A | 1.167 | GASBARRINI A | 1546 |
| 2 | COLOMBEL JF | 7 | ANANTHAKRISHNAN AN | 8 | DAY AS | 1 | HALLER D | 1182 |
| 3 | GASBARRINI A | 7 | GASBARRINI A | 8 | PETERS V | 1 | NG SC | 793 |
| 4 | GHOSH S | 7 | HALLER D | 8 | ADOLPH TE | 1 | LEWIS JD | 684 |
| 5 | HALLER D | 7 | CHAN AT | 8 | ANANTHAKRISHNAN AN | 0.778 | GHOSH S | 675 |
| 6 | CHAN AT | 6 | COLOMBEL JF | 7 | COLOMBEL JF | 0.778 | LEE D | 575 |
| 7 | DIJKSTRA G | 6 | DIJKSTRA G | 7 | KIM J | 0.75 | COLLINS SM | 374 |
| 8 | FERGUSON LR | 6 | NG SC | 7 | NG SC | 0.667 | COLOMBEL JF | 334 |
| 9 | KIM J | 6 | RAMAN M | 7 | DIJKSTRA G | 0.545 | ANANTHAKRISHNAN AN | 313 |
| 10 | NG SC | 6 | SZILAGYI A | 7 | CHAN AT | 0.5 | TILG H | 286 |
| Journals | Rank | Number of Publications | Percentage of All Publications | IF | JCR Partition |
|---|---|---|---|---|---|
| Nutrients | 1 | 70 | 6.52% | 6.706 | 1 |
| Inflammatory Bowel Diseases | 2 | 26 | 2.42% | 7.290 | 1 |
| Journal of Crohns & Colitis | 3 | 23 | 2.14% | 10.02 | 1 |
| PLoS ONE | 4 | 23 | 2.14% | 3.752 | 2 |
| World Journal of Gastroenterology | 5 | 23 | 2.14% | 5.374 | 2 |
| Digestive Diseases and Sciences | 6 | 19 | 1.77% | 3.487 | 3 |
| International Journal of Molecular Sciences | 7 | 19 | 1.77% | 6.208 | 1 |
| Frontiers in Immunology | 8 | 15 | 1.40% | 8.786 | 1 |
| Gastroenterology | 9 | 15 | 1.40% | 33.883 | 1 |
| Journal of Pediatric Gastroenterology and Nutrition | 10 | 14 | 1.30% | 3.288 | 2 |
| European Journal of Gastroenterology & Hepatology | 11 | 13 | 1.21% | 2.586 | 4 |
| American Journal of Gastroenterology | 12 | 11 | 1.02% | 12.045 | 1 |
| Frontiers in Nutrition | 13 | 11 | 1.02% | 6.59 | 1 |
| Clinical Nutrition | 14 | 10 | 0.93% | 7.643 | 1 |
| Journal of Clinical Gastroenterology | 15 | 10 | 0.93% | 3.147 | 4 |
| Scandinavian Journal of Gastroenterology | 16 | 10 | 0.93% | 3.027 | 4 |
| British Journal of Nutrition | 17 | 9 | 0.84% | 4.125 | 3 |
| Clinical Gastroenterology and Hepatology | 18 | 9 | 0.84% | 13.576 | 1 |
| European Journal of Clinical Nutrition | 19 | 9 | 0.84% | 4.884 | 2 |
| Gut | 20 | 9 | 0.84% | 31.793 | 1 |
| Alimentary Pharmacology & Therapeutics | 21 | 8 | 0.74% | 9.524 | 1 |
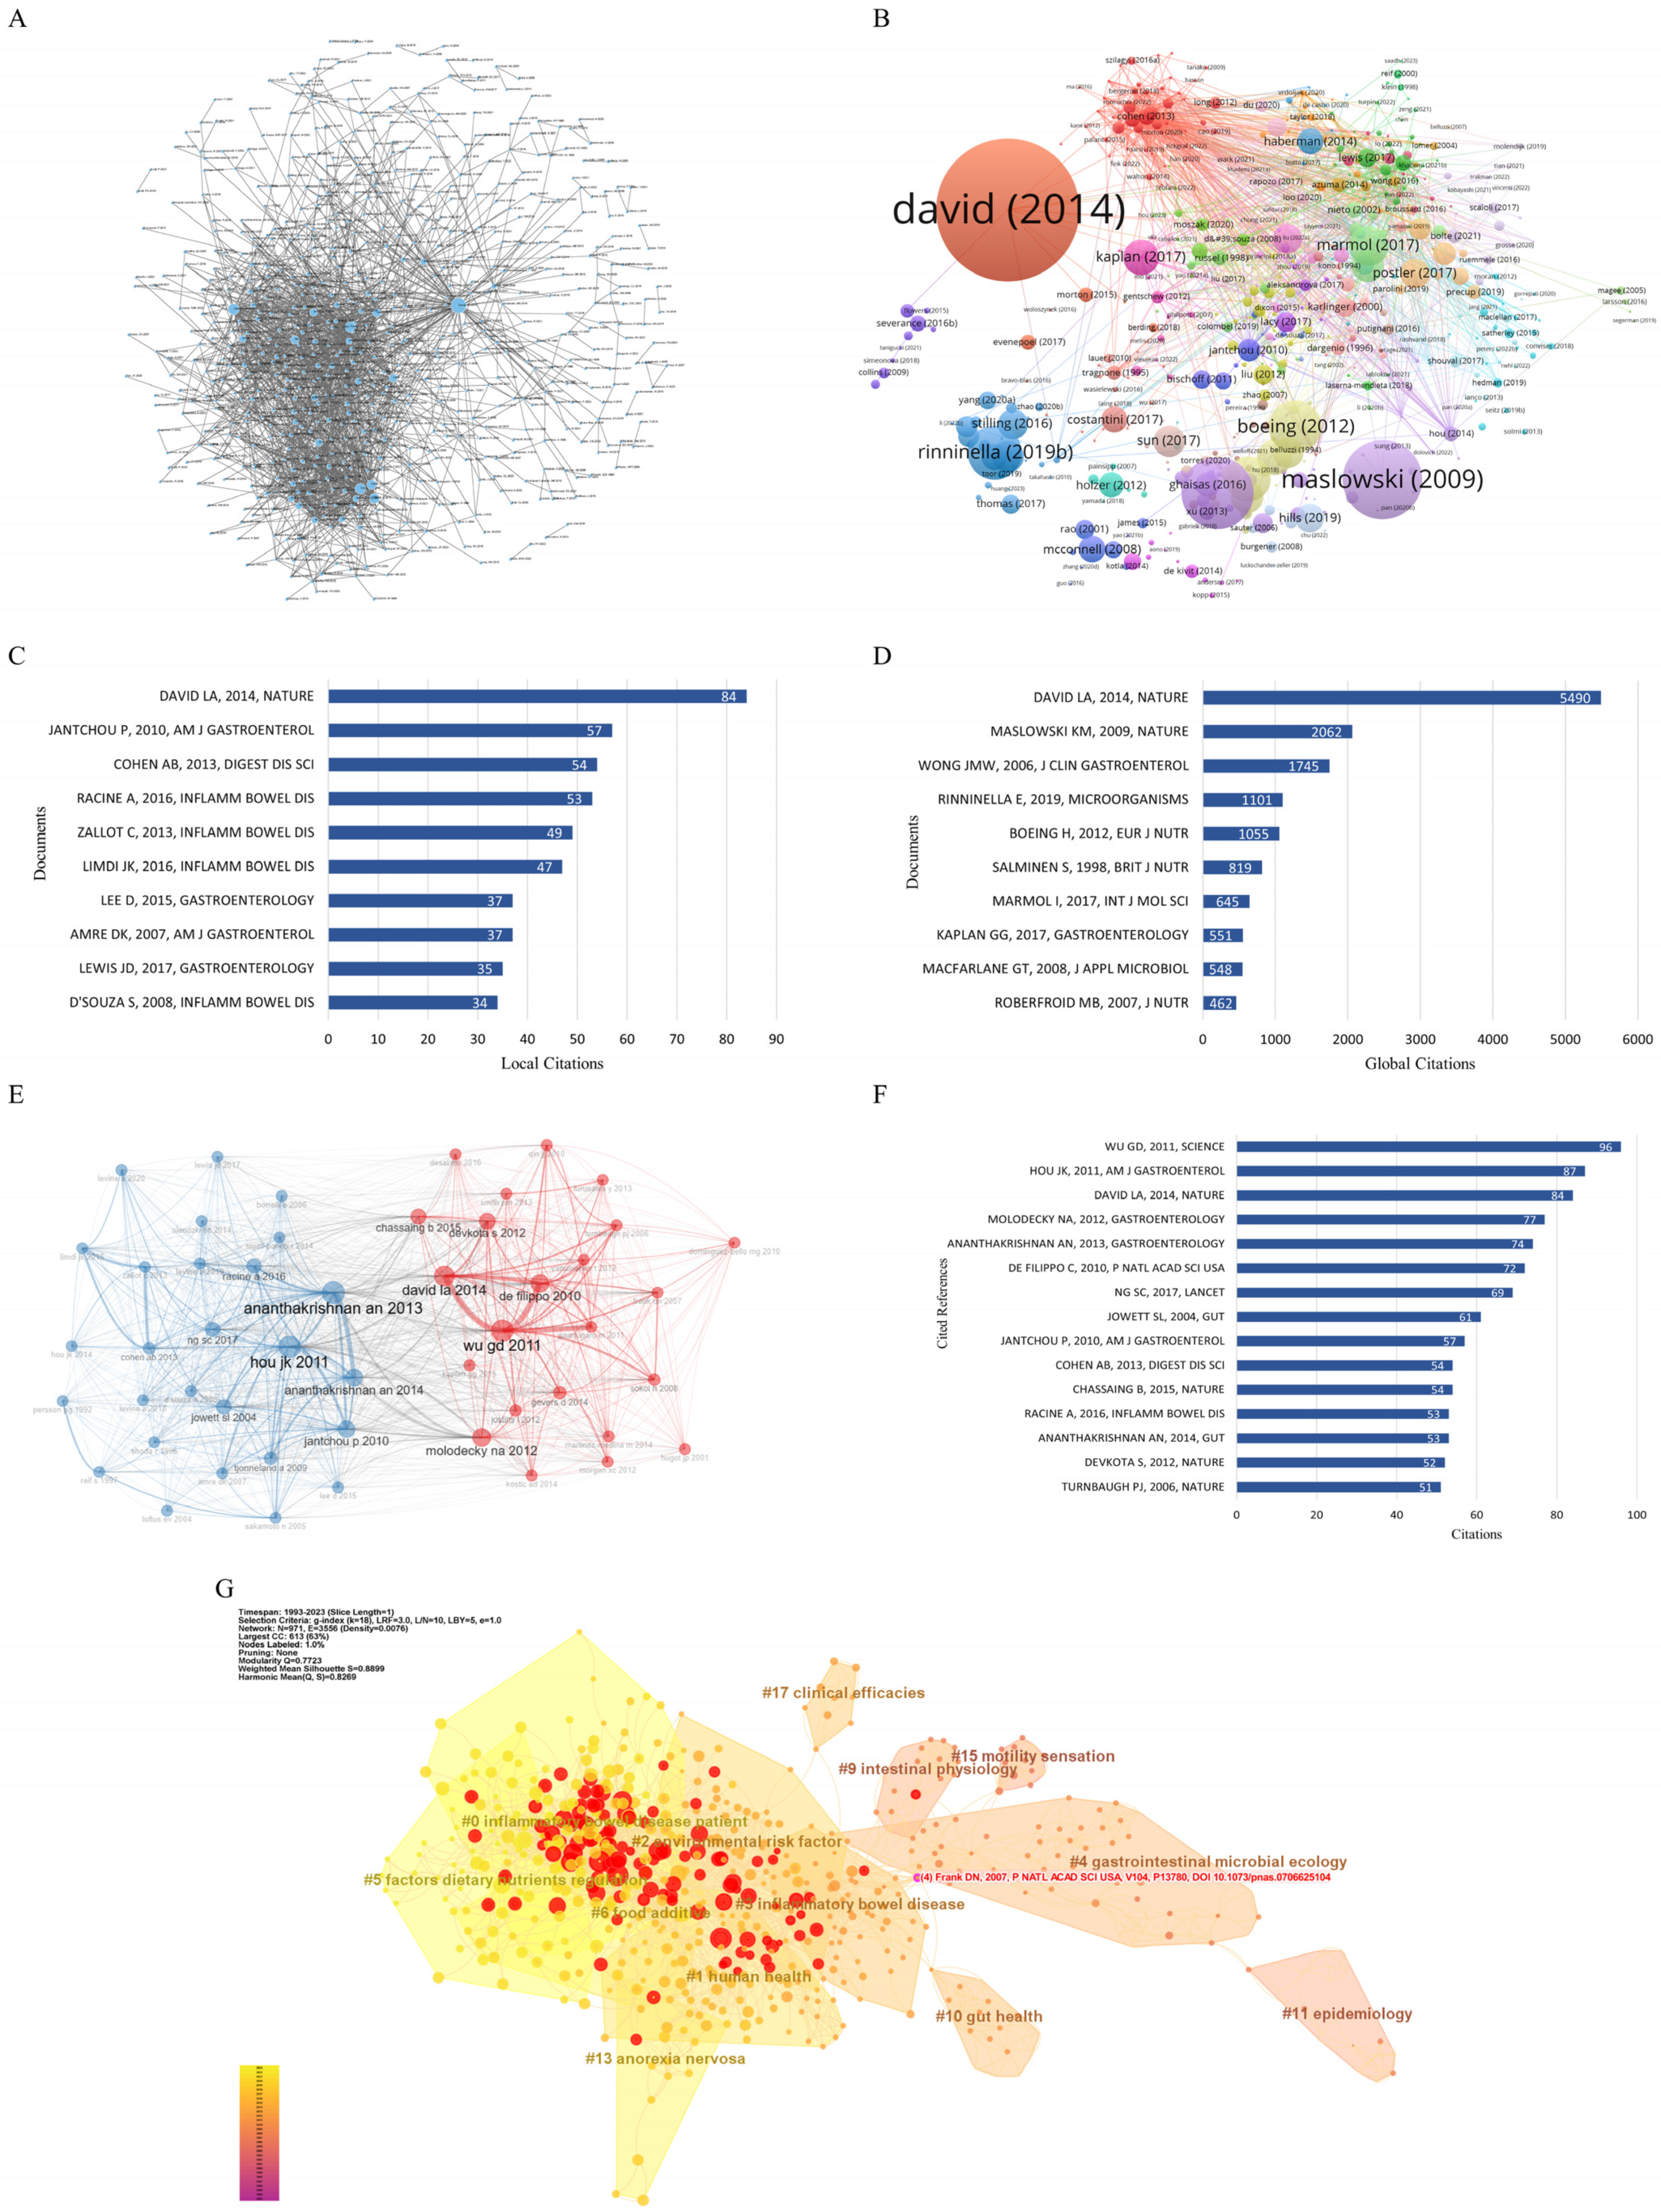
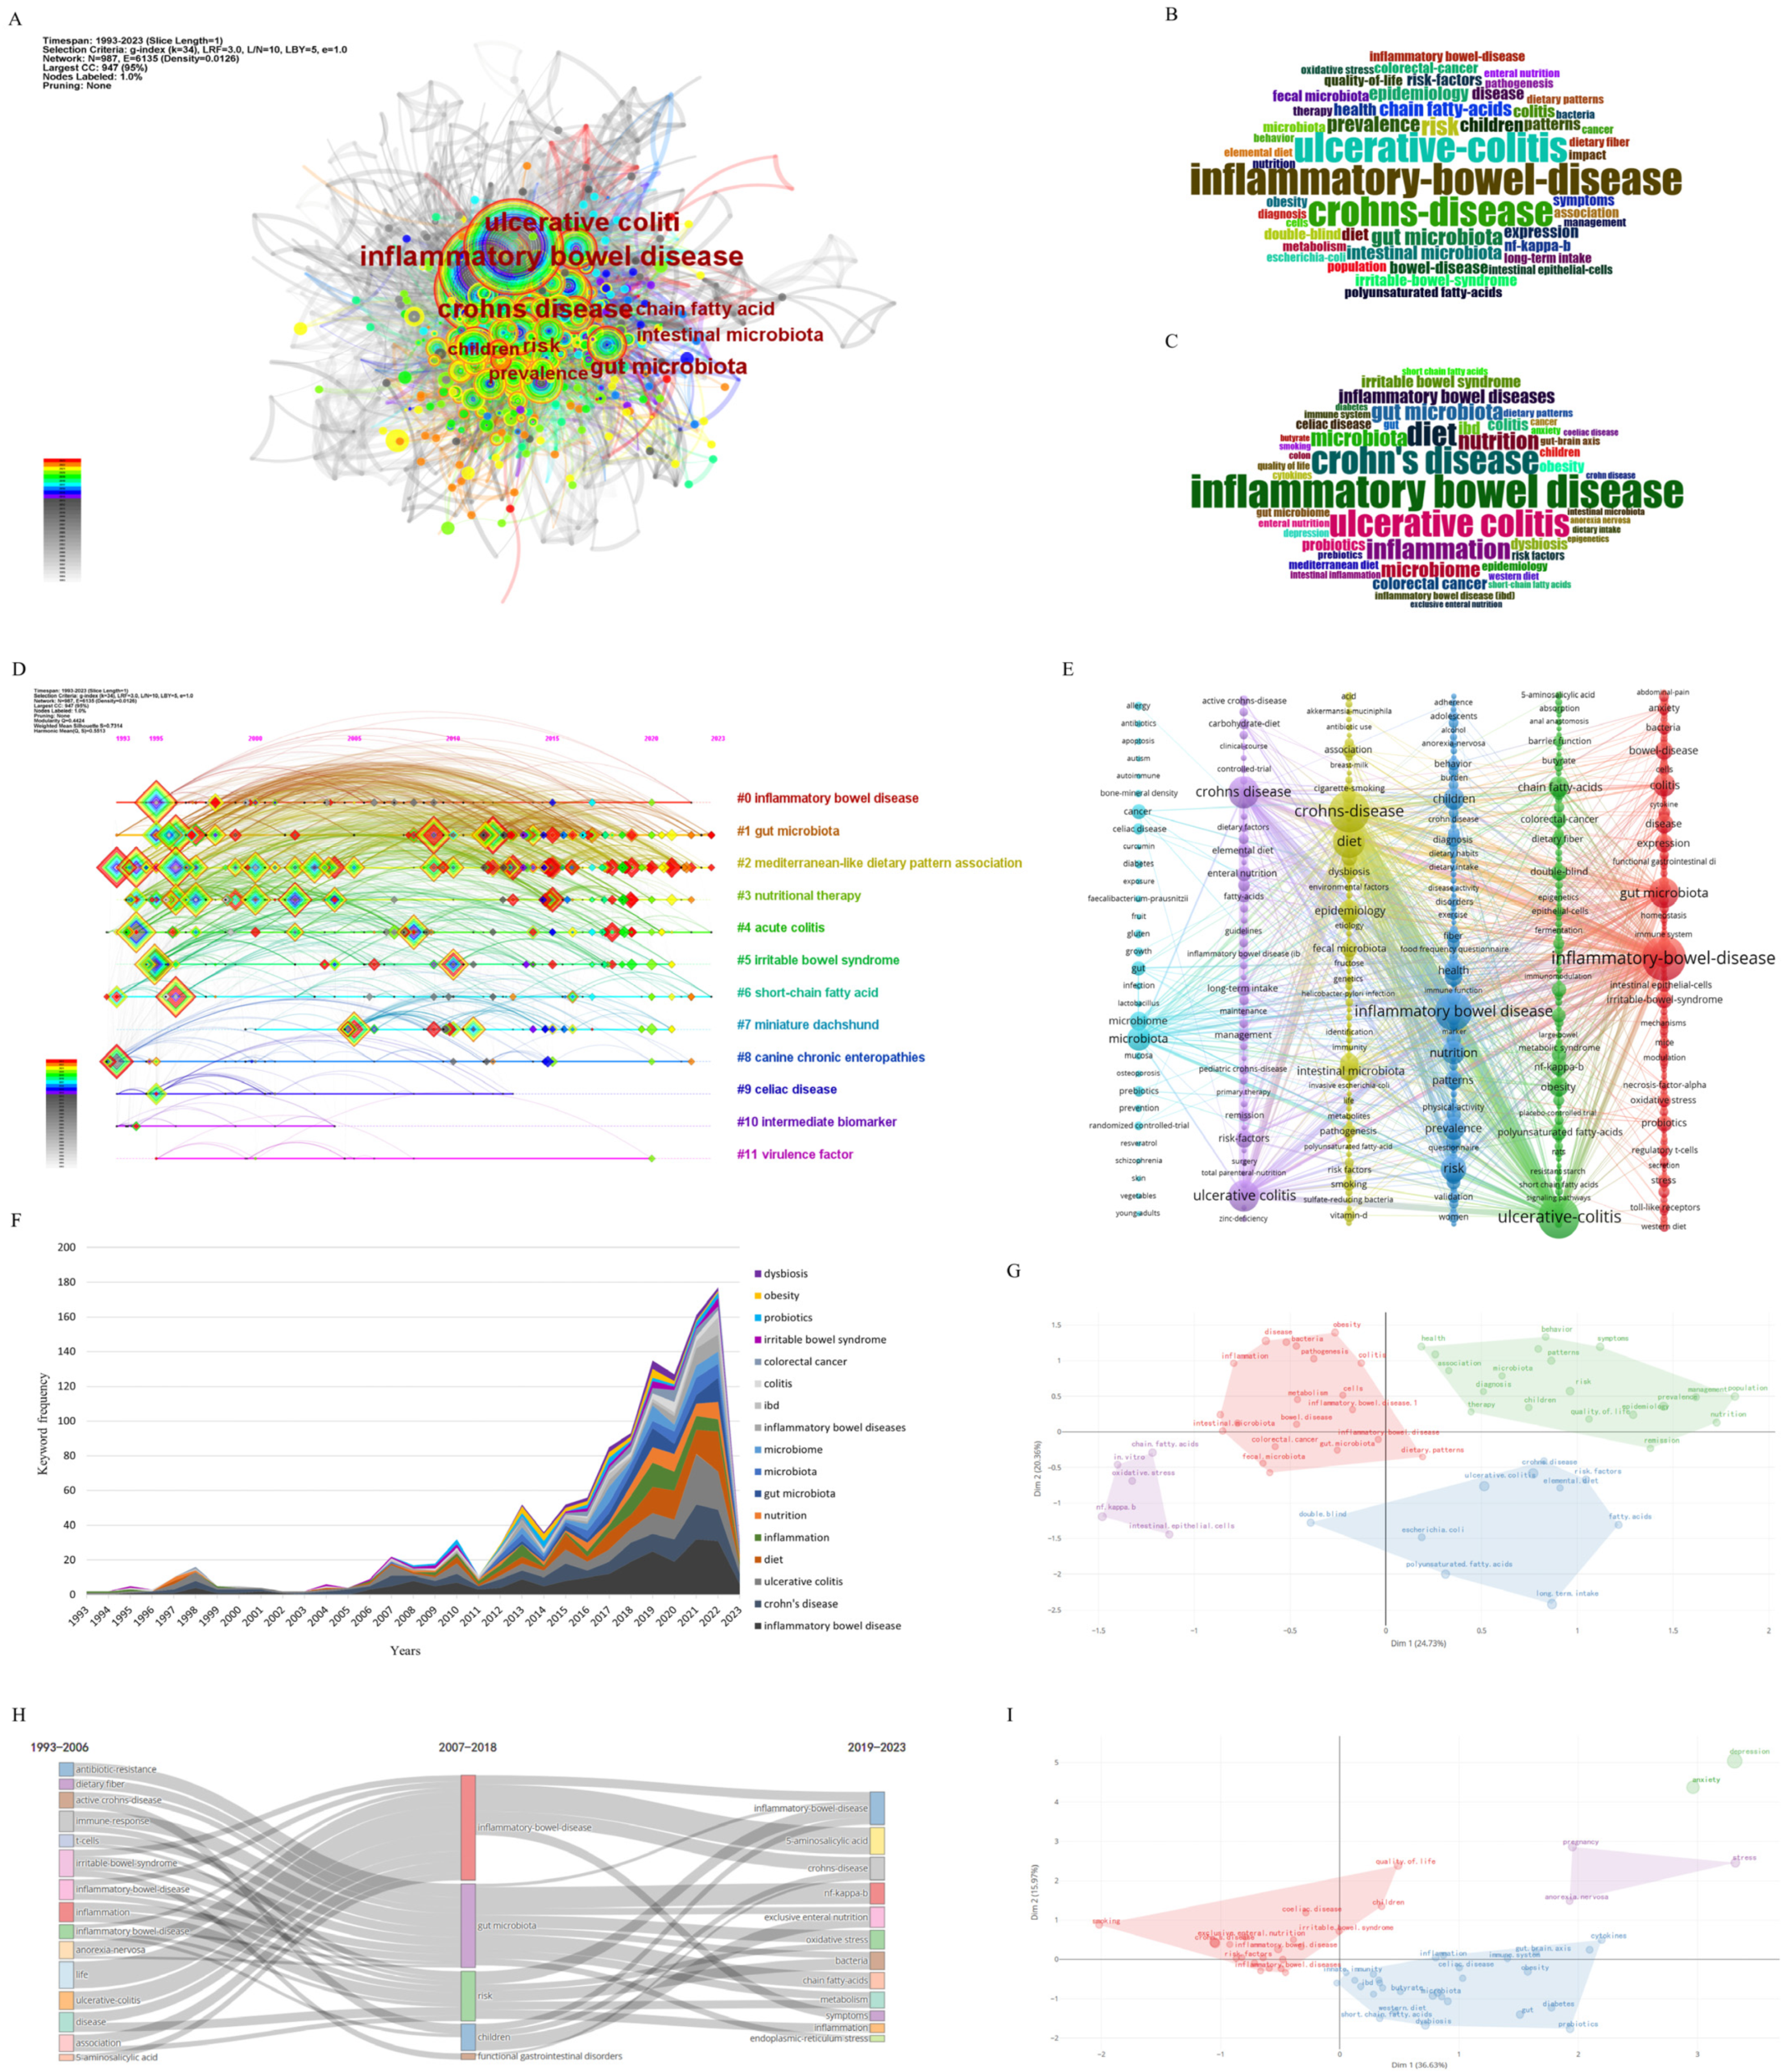
| ClusterID | Size | Silhouette | Label (LLR) | Average Year | Top Keywords (Frequency) |
|---|---|---|---|---|---|
| 0 | 151 | 0.639 | inflammatory bowel disease (633.98, 1.0 × 10⁻⁴) | 2005 | inflammatory bowel disease (576) Crohn’s disease (371) ulcerative colitis (368) |
| 1 | 143 | 0.658 | gut microbiota (1443.69, 1.0 × 10⁻⁴) | 2012 | gut microbiota (139) chain fatty acid (67) intestinal microbiota (66) |
| 2 | 134 | 0.64 | Mediterranean-like dietary pattern association (360.41, 1.0 × 10⁻⁴) | 2013 | risk (98) children (60) epidemiology (54) |
| 3 | 104 | 0.755 | nutritional therapy (462.4, 1.0 × 10⁻⁴) | 2005 | pattern (54) diet (50) colitis (45) |
| 4 | 104 | 0.739 | inflammatory bowel disease (671.64, 1.0 × 10⁻⁴) | 2007 | expression (43) Nf κ b (38) oxidative stress (20) |
| 5 | 72 | 0.737 | irritable bowel syndrome (1404.33, 1.0 × 10⁻⁴) | 2008 | prevalence (66) irritable bowel syndrome (58) quality of life (38) |
| 6 | 70 | 0.818 | short-chain fatty acid (374.44, 1.0 × 10⁻⁴) | 2008 | colorectal cancer (58) colon cancer (23) aberrant crypt foci (9) |
| 7 | 64 | 0.849 | miniature dachshund (461.16, 1.0 × 10⁻⁴) | 2010 | intestinal epithelial cell (26) intestinal inflammation (21) dendritic cell (15) |
| 8 | 50 | 0.881 | canine chronic enteropathies (221.53, 1.0 × 10⁻⁴) | 2002 | disease (45) diagnosis (18) acid (13) |
| 9 | 27 | 0.942 | celiac disease (162.71, 1.0 × 10⁻⁴) | 2001 | celiac disease (31) autoantibody (3) antigen (3) |
| 10 | 17 | 0.945 | intermediate biomarker (64.9, 1.0 × 10⁻⁴) | 1995 | supplementation (7) cell proliferation (4) cytokine production (3) |
| 11 | 11 | 0.969 | virulence factor (52.83, 1.0 × 10⁻⁴) | 2004 | anal anastomosis (6) bowel (5) ileal pouch (2) |
| Keywords | Year | Strength | Begin | End | 1993–2023 |
|---|---|---|---|---|---|
| colon cancer | 1993 | 3.19 | 1993 | 2012 | ▃▃▃▃▃▃▃▃▃▃▃▃▃▃▃▃▃▃▃▃▂▂▂▂▂▂▂▂▂▂▂ |
| epithelial cell proliferation | 1993 | 3.17 | 1993 | 1998 | ▃▃▃▃▃▃▂▂▂▂▂▂▂▂▂▂▂▂▂▂▂▂▂▂▂▂▂▂▂▂▂ |
| fish oil | 1994 | 5.18 | 1994 | 2001 | ▂▃▃▃▃▃▃▃▃▂▂▂▂▂▂▂▂▂▂▂▂▂▂▂▂▂▂▂▂▂▂ |
| absorption | 1994 | 3.56 | 1994 | 2008 | ▂▃▃▃▃▃▃▃▃▃▃▃▃▃▃▃▂▂▂▂▂▂▂▂▂▂▂▂▂▂▂ |
| cell proliferation | 1994 | 2.16 | 1994 | 2007 | ▂▃▃▃▃▃▃▃▃▃▃▃▃▃▃▂▂▂▂▂▂▂▂▂▂▂▂▂▂▂▂ |
| dietary fiber | 1995 | 4.53 | 1995 | 2010 | ▂▂▃▃▃▃▃▃▃▃▃▃▃▃▃▃▃▃▂▂▂▂▂▂▂▂▂▂▂▂▂ |
| colonic mucosa | 1995 | 3.68 | 1995 | 2013 | ▂▂▃▃▃▃▃▃▃▃▃▃▃▃▃▃▃▃▃▃▃▂▂▂▂▂▂▂▂▂▂ |
| elemental diet | 1995 | 2.43 | 1995 | 2003 | ▂▂▃▃▃▃▃▃▃▃▃▂▂▂▂▂▂▂▂▂▂▂▂▂▂▂▂▂▂▂▂ |
| controlled trial | 1996 | 3.63 | 1996 | 2007 | ▂▂▂▃▃▃▃▃▃▃▃▃▃▃▃▂▂▂▂▂▂▂▂▂▂▂▂▂▂▂▂ |
| epithelial cell | 1996 | 3.07 | 1996 | 2013 | ▂▂▂▃▃▃▃▃▃▃▃▃▃▃▃▃▃▃▃▃▃▂▂▂▂▂▂▂▂▂▂ |
| active Crohn’s disease | 1996 | 2.61 | 1996 | 2005 | ▂▂▂▃▃▃▃▃▃▃▃▃▃▂▂▂▂▂▂▂▂▂▂▂▂▂▂▂▂▂▂ |
| distal ulcerative coliti | 1996 | 2.44 | 1996 | 2003 | ▂▂▂▃▃▃▃▃▃▃▃▂▂▂▂▂▂▂▂▂▂▂▂▂▂▂▂▂▂▂▂ |
| carcinogenesis | 1996 | 2.17 | 1996 | 2008 | ▂▂▂▃▃▃▃▃▃▃▃▃▃▃▃▃▂▂▂▂▂▂▂▂▂▂▂▂▂▂▂ |
| cigarette smoking | 1998 | 3.81 | 1998 | 2010 | ▂▂▂▂▂▃▃▃▃▃▃▃▃▃▃▃▃▃▂▂▂▂▂▂▂▂▂▂▂▂▂ |
| smoking | 1998 | 3.02 | 1998 | 2007 | ▂▂▂▂▂▃▃▃▃▃▃▃▃▃▃▂▂▂▂▂▂▂▂▂▂▂▂▂▂▂▂ |
| expression | 1994 | 2.75 | 1999 | 2008 | ▂▂▂▂▂▂▃▃▃▃▃▃▃▃▃▃▂▂▂▂▂▂▂▂▂▂▂▂▂▂▂ |
| dietary factor | 2000 | 2.73 | 2000 | 2010 | ▂▂▂▂▂▂▂▃▃▃▃▃▃▃▃▃▃▃▂▂▂▂▂▂▂▂▂▂▂▂▂ |
| bone mineral density | 2001 | 2.15 | 2001 | 2016 | ▂▂▂▂▂▂▂▂▃▃▃▃▃▃▃▃▃▃▃▃▃▃▃▃▂▂▂▂▂▂▂ |
| aberrant crypt foci | 2002 | 2.79 | 2002 | 2014 | ▂▂▂▂▂▂▂▂▂▃▃▃▃▃▃▃▃▃▃▃▃▃▂▂▂▂▂▂▂▂▂ |
| restorative proctocolectomy | 2004 | 2.44 | 2004 | 2009 | ▂▂▂▂▂▂▂▂▂▂▂▃▃▃▃▃▃▂▂▂▂▂▂▂▂▂▂▂▂▂▂ |
| supplementation | 1994 | 2.41 | 2004 | 2007 | ▂▂▂▂▂▂▂▂▂▂▂▃▃▃▃▂▂▂▂▂▂▂▂▂▂▂▂▂▂▂▂ |
| remission | 2004 | 2.26 | 2004 | 2010 | ▂▂▂▂▂▂▂▂▂▂▂▃▃▃▃▃▃▃▂▂▂▂▂▂▂▂▂▂▂▂▂ |
| activity index | 2004 | 2.18 | 2004 | 2014 | ▂▂▂▂▂▂▂▂▂▂▂▃▃▃▃▃▃▃▃▃▃▃▂▂▂▂▂▂▂▂▂ |
| irritable bowel syndrome | 1995 | 3 | 2006 | 2007 | ▂▂▂▂▂▂▂▂▂▂▂▂▂▃▃▂▂▂▂▂▂▂▂▂▂▂▂▂▂▂▂ |
| mast cell | 2006 | 2.61 | 2006 | 2014 | ▂▂▂▂▂▂▂▂▂▂▂▂▂▃▃▃▃▃▃▃▃▃▂▂▂▂▂▂▂▂▂ |
| Nf κ b | 2008 | 5.4 | 2008 | 2010 | ▂▂▂▂▂▂▂▂▂▂▂▂▂▂▂▃▃▃▂▂▂▂▂▂▂▂▂▂▂▂▂ |
| active ulcerative colitis | 2008 | 2.48 | 2008 | 2018 | ▂▂▂▂▂▂▂▂▂▂▂▂▂▂▂▃▃▃▃▃▃▃▃▃▃▃▂▂▂▂▂ |
| intestinal permeability | 2008 | 2.09 | 2008 | 2016 | ▂▂▂▂▂▂▂▂▂▂▂▂▂▂▂▃▃▃▃▃▃▃▃▃▂▂▂▂▂▂▂ |
| innate immunity | 2009 | 4.95 | 2009 | 2016 | ▂▂▂▂▂▂▂▂▂▂▂▂▂▂▂▂▃▃▃▃▃▃▃▃▂▂▂▂▂▂▂ |
| intestinal epithelial cell | 2005 | 3.36 | 2009 | 2016 | ▂▂▂▂▂▂▂▂▂▂▂▂▂▂▂▂▃▃▃▃▃▃▃▃▂▂▂▂▂▂▂ |
| gene expression | 2010 | 4.2 | 2010 | 2016 | ▂▂▂▂▂▂▂▂▂▂▂▂▂▂▂▂▂▃▃▃▃▃▃▃▂▂▂▂▂▂▂ |
| dendritic cell | 2005 | 3.62 | 2010 | 2015 | ▂▂▂▂▂▂▂▂▂▂▂▂▂▂▂▂▂▃▃▃▃▃▃▂▂▂▂▂▂▂▂ |
| celiac disease | 1995 | 3.1 | 2011 | 2014 | ▂▂▂▂▂▂▂▂▂▂▂▂▂▂▂▂▂▂▃▃▃▃▂▂▂▂▂▂▂▂▂ |
| immune response | 1997 | 2.95 | 2011 | 2014 | ▂▂▂▂▂▂▂▂▂▂▂▂▂▂▂▂▂▂▃▃▃▃▂▂▂▂▂▂▂▂▂ |
| diet-induced obesity | 2012 | 3.61 | 2012 | 2017 | ▂▂▂▂▂▂▂▂▂▂▂▂▂▂▂▂▂▂▂▃▃▃▃▃▃▂▂▂▂▂▂ |
| escherichia coli | 1997 | 3.52 | 2013 | 2018 | ▂▂▂▂▂▂▂▂▂▂▂▂▂▂▂▂▂▂▂▂▃▃▃▃▃▃▂▂▂▂▂ |
| adipose tissue | 2013 | 3.36 | 2013 | 2017 | ▂▂▂▂▂▂▂▂▂▂▂▂▂▂▂▂▂▂▂▂▃▃▃▃▃▂▂▂▂▂▂ |
| rheumatoid arthritis | 2013 | 3.21 | 2013 | 2016 | ▂▂▂▂▂▂▂▂▂▂▂▂▂▂▂▂▂▂▂▂▃▃▃▃▂▂▂▂▂▂▂ |
| anxiety-like behavior | 2013 | 2.85 | 2013 | 2017 | ▂▂▂▂▂▂▂▂▂▂▂▂▂▂▂▂▂▂▂▂▃▃▃▃▃▂▂▂▂▂▂ |
| necrosis factor-alpha | 2013 | 2.49 | 2013 | 2019 | ▂▂▂▂▂▂▂▂▂▂▂▂▂▂▂▂▂▂▂▂▃▃▃▃▃▃▃▂▂▂▂ |
| t-cell | 2013 | 2.41 | 2013 | 2017 | ▂▂▂▂▂▂▂▂▂▂▂▂▂▂▂▂▂▂▂▂▃▃▃▃▃▂▂▂▂▂▂ |
| food allergy | 2014 | 3.17 | 2014 | 2014 | ▂▂▂▂▂▂▂▂▂▂▂▂▂▂▂▂▂▂▂▂▂▃▂▂▂▂▂▂▂▂▂ |
| aryl hydrocarbon receptor | 2014 | 3.15 | 2014 | 2017 | ▂▂▂▂▂▂▂▂▂▂▂▂▂▂▂▂▂▂▂▂▂▃▃▃▃▂▂▂▂▂▂ |
| regulatory t-cell | 2014 | 2.38 | 2014 | 2014 | ▂▂▂▂▂▂▂▂▂▂▂▂▂▂▂▂▂▂▂▂▂▃▂▂▂▂▂▂▂▂▂ |
| visceral hypersensitivity | 2014 | 2.25 | 2014 | 2016 | ▂▂▂▂▂▂▂▂▂▂▂▂▂▂▂▂▂▂▂▂▂▃▃▃▂▂▂▂▂▂▂ |
| diversity | 2015 | 4.94 | 2015 | 2019 | ▂▂▂▂▂▂▂▂▂▂▂▂▂▂▂▂▂▂▂▂▂▂▃▃▃▃▃▂▂▂▂ |
| exclusive enteral nutrition | 2015 | 3.81 | 2015 | 2019 | ▂▂▂▂▂▂▂▂▂▂▂▂▂▂▂▂▂▂▂▂▂▂▃▃▃▃▃▂▂▂▂ |
| gastrointestinal symptom | 2015 | 3.41 | 2015 | 2019 | ▂▂▂▂▂▂▂▂▂▂▂▂▂▂▂▂▂▂▂▂▂▂▃▃▃▃▃▂▂▂▂ |
| maintenance therapy | 2015 | 3.03 | 2015 | 2019 | ▂▂▂▂▂▂▂▂▂▂▂▂▂▂▂▂▂▂▂▂▂▂▃▃▃▃▃▂▂▂▂ |
| prospective cohort | 2015 | 2.39 | 2015 | 2016 | ▂▂▂▂▂▂▂▂▂▂▂▂▂▂▂▂▂▂▂▂▂▂▃▃▂▂▂▂▂▂▂ |
| intestinal microbiota | 2009 | 6.52 | 2016 | 2019 | ▂▂▂▂▂▂▂▂▂▂▂▂▂▂▂▂▂▂▂▂▂▂▂▃▃▃▃▂▂▂▂ |
| fecal microbiota | 2012 | 5.45 | 2016 | 2018 | ▂▂▂▂▂▂▂▂▂▂▂▂▂▂▂▂▂▂▂▂▂▂▂▃▃▃▂▂▂▂▂ |
| colorectal cancer | 1996 | 5.02 | 2016 | 2018 | ▂▂▂▂▂▂▂▂▂▂▂▂▂▂▂▂▂▂▂▂▂▂▂▃▃▃▂▂▂▂▂ |
| metabolic syndrome | 2016 | 3.7 | 2016 | 2019 | ▂▂▂▂▂▂▂▂▂▂▂▂▂▂▂▂▂▂▂▂▂▂▂▃▃▃▃▂▂▂▂ |
| dysbiosis | 2017 | 3.49 | 2017 | 2018 | ▂▂▂▂▂▂▂▂▂▂▂▂▂▂▂▂▂▂▂▂▂▂▂▂▃▃▂▂▂▂▂ |
| faecalibacterium prausnitzii | 2017 | 3.33 | 2017 | 2019 | ▂▂▂▂▂▂▂▂▂▂▂▂▂▂▂▂▂▂▂▂▂▂▂▂▃▃▃▂▂▂▂ |
| gut microbiome | 2014 | 2.81 | 2017 | 2018 | ▂▂▂▂▂▂▂▂▂▂▂▂▂▂▂▂▂▂▂▂▂▂▂▂▃▃▂▂▂▂▂ |
| barrier function | 2008 | 2.74 | 2017 | 2018 | ▂▂▂▂▂▂▂▂▂▂▂▂▂▂▂▂▂▂▂▂▂▂▂▂▃▃▂▂▂▂▂ |
| environmental risk factor | 2018 | 2.62 | 2018 | 2020 | ▂▂▂▂▂▂▂▂▂▂▂▂▂▂▂▂▂▂▂▂▂▂▂▂▂▃▃▃▂▂▂ |
| gastrointestinal disorder | 2018 | 2.62 | 2018 | 2020 | ▂▂▂▂▂▂▂▂▂▂▂▂▂▂▂▂▂▂▂▂▂▂▂▂▂▃▃▃▂▂▂ |
| environmental factor | 2012 | 2.38 | 2018 | 2020 | ▂▂▂▂▂▂▂▂▂▂▂▂▂▂▂▂▂▂▂▂▂▂▂▂▂▃▃▃▂▂▂ |
| autism spectrum disorder | 2018 | 2.12 | 2018 | 2019 | ▂▂▂▂▂▂▂▂▂▂▂▂▂▂▂▂▂▂▂▂▂▂▂▂▂▃▃▂▂▂▂ |
| carbohydrate diet | 2019 | 4.04 | 2019 | 2023 | ▂▂▂▂▂▂▂▂▂▂▂▂▂▂▂▂▂▂▂▂▂▂▂▂▂▂▃▃▃▃▃ |
| low-FODMAP diet | 2019 | 3.93 | 2019 | 2023 | ▂▂▂▂▂▂▂▂▂▂▂▂▂▂▂▂▂▂▂▂▂▂▂▂▂▂▃▃▃▃▃ |
| diagnosis | 1993 | 3.59 | 2019 | 2020 | ▂▂▂▂▂▂▂▂▂▂▂▂▂▂▂▂▂▂▂▂▂▂▂▂▂▂▃▃▂▂▂ |
| physical activity | 2019 | 3.4 | 2019 | 2023 | ▂▂▂▂▂▂▂▂▂▂▂▂▂▂▂▂▂▂▂▂▂▂▂▂▂▂▃▃▃▃▃ |
| quality of life | 2010 | 3.33 | 2019 | 2020 | ▂▂▂▂▂▂▂▂▂▂▂▂▂▂▂▂▂▂▂▂▂▂▂▂▂▂▃▃▂▂▂ |
| fecal microbiota transplantation | 2019 | 2.99 | 2019 | 2020 | ▂▂▂▂▂▂▂▂▂▂▂▂▂▂▂▂▂▂▂▂▂▂▂▂▂▂▃▃▂▂▂ |
| Stress | 2010 | 2.71 | 2019 | 2021 | ▂▂▂▂▂▂▂▂▂▂▂▂▂▂▂▂▂▂▂▂▂▂▂▂▂▂▃▃▃▂▂ |
| enteral nutrition | 1996 | 2.55 | 2019 | 2019 | ▂▂▂▂▂▂▂▂▂▂▂▂▂▂▂▂▂▂▂▂▂▂▂▂▂▂▃▂▂▂▂ |
| pathogenesis | 2015 | 2.45 | 2019 | 2023 | ▂▂▂▂▂▂▂▂▂▂▂▂▂▂▂▂▂▂▂▂▂▂▂▂▂▂▃▃▃▃▃ |
| metaanalysis | 2014 | 2.36 | 2019 | 2019 | ▂▂▂▂▂▂▂▂▂▂▂▂▂▂▂▂▂▂▂▂▂▂▂▂▂▂▃▂▂▂▂ |
| gut–brain axis | 2019 | 2.23 | 2019 | 2021 | ▂▂▂▂▂▂▂▂▂▂▂▂▂▂▂▂▂▂▂▂▂▂▂▂▂▂▃▃▃▂▂ |
| validity | 2019 | 2.22 | 2019 | 2019 | ▂▂▂▂▂▂▂▂▂▂▂▂▂▂▂▂▂▂▂▂▂▂▂▂▂▂▃▂▂▂▂ |
| management | 2013 | 2.14 | 2019 | 2020 | ▂▂▂▂▂▂▂▂▂▂▂▂▂▂▂▂▂▂▂▂▂▂▂▂▂▂▃▃▂▂▂ |
| nutritional status | 1995 | 2.11 | 2019 | 2020 | ▂▂▂▂▂▂▂▂▂▂▂▂▂▂▂▂▂▂▂▂▂▂▂▂▂▂▃▃▂▂▂ |
| dietary pattern | 2004 | 4.85 | 2020 | 2023 | ▂▂▂▂▂▂▂▂▂▂▂▂▂▂▂▂▂▂▂▂▂▂▂▂▂▂▂▃▃▃▃ |
| fiber | 2018 | 4.64 | 2020 | 2023 | ▂▂▂▂▂▂▂▂▂▂▂▂▂▂▂▂▂▂▂▂▂▂▂▂▂▂▂▃▃▃▃ |
| protein | 2020 | 3.19 | 2020 | 2023 | ▂▂▂▂▂▂▂▂▂▂▂▂▂▂▂▂▂▂▂▂▂▂▂▂▂▂▂▃▃▃▃ |
| microbiota | 2013 | 3.01 | 2020 | 2023 | ▂▂▂▂▂▂▂▂▂▂▂▂▂▂▂▂▂▂▂▂▂▂▂▂▂▂▂▃▃▃▃ |
| cohort | 2000 | 2.8 | 2020 | 2021 | ▂▂▂▂▂▂▂▂▂▂▂▂▂▂▂▂▂▂▂▂▂▂▂▂▂▂▂▃▃▂▂ |
| cytokine | 2000 | 2.56 | 2020 | 2021 | ▂▂▂▂▂▂▂▂▂▂▂▂▂▂▂▂▂▂▂▂▂▂▂▂▂▂▂▃▃▂▂ |
| burden | 2020 | 2.48 | 2020 | 2023 | ▂▂▂▂▂▂▂▂▂▂▂▂▂▂▂▂▂▂▂▂▂▂▂▂▂▂▂▃▃▃▃ |
| gluten-free diet | 1999 | 2.2 | 2020 | 2023 | ▂▂▂▂▂▂▂▂▂▂▂▂▂▂▂▂▂▂▂▂▂▂▂▂▂▂▂▃▃▃▃ |
| questionnaire | 2018 | 2.15 | 2020 | 2023 | ▂▂▂▂▂▂▂▂▂▂▂▂▂▂▂▂▂▂▂▂▂▂▂▂▂▂▂▃▃▃▃ |
| Mediterranean diet | 2019 | 7.91 | 2021 | 2023 | ▂▂▂▂▂▂▂▂▂▂▂▂▂▂▂▂▂▂▂▂▂▂▂▂▂▂▂▂▃▃▃ |
| oxidative stress | 2018 | 5.03 | 2021 | 2023 | ▂▂▂▂▂▂▂▂▂▂▂▂▂▂▂▂▂▂▂▂▂▂▂▂▂▂▂▂▃▃▃ |
| risk | 1993 | 4.85 | 2021 | 2023 | ▂▂▂▂▂▂▂▂▂▂▂▂▂▂▂▂▂▂▂▂▂▂▂▂▂▂▂▂▃▃▃ |
| prevalence | 1995 | 4.65 | 2021 | 2023 | ▂▂▂▂▂▂▂▂▂▂▂▂▂▂▂▂▂▂▂▂▂▂▂▂▂▂▂▂▃▃▃ |
| marker | 2021 | 3.92 | 2021 | 2021 | ▂▂▂▂▂▂▂▂▂▂▂▂▂▂▂▂▂▂▂▂▂▂▂▂▂▂▂▂▃▂▂ |
| vitamin d | 2015 | 3.17 | 2021 | 2023 | ▂▂▂▂▂▂▂▂▂▂▂▂▂▂▂▂▂▂▂▂▂▂▂▂▂▂▂▂▃▃▃ |
| fecal calprotectin | 2021 | 2.69 | 2021 | 2023 | ▂▂▂▂▂▂▂▂▂▂▂▂▂▂▂▂▂▂▂▂▂▂▂▂▂▂▂▂▃▃▃ |
| depression | 2004 | 2.39 | 2021 | 2021 | ▂▂▂▂▂▂▂▂▂▂▂▂▂▂▂▂▂▂▂▂▂▂▂▂▂▂▂▂▃▂▂ |
| cardiovascular disease | 2013 | 2.16 | 2021 | 2023 | ▂▂▂▂▂▂▂▂▂▂▂▂▂▂▂▂▂▂▂▂▂▂▂▂▂▂▂▂▃▃▃ |
| gut microbiota | 2012 | 6.39 | 2022 | 2023 | ▂▂▂▂▂▂▂▂▂▂▂▂▂▂▂▂▂▂▂▂▂▂▂▂▂▂▂▂▂▃▃ |
| polyphenol | 2022 | 2.79 | 2022 | 2023 | ▂▂▂▂▂▂▂▂▂▂▂▂▂▂▂▂▂▂▂▂▂▂▂▂▂▂▂▂▂▃▃ |
| polyunsaturated fatty acid | 2002 | 2.63 | 2022 | 2023 | ▂▂▂▂▂▂▂▂▂▂▂▂▂▂▂▂▂▂▂▂▂▂▂▂▂▂▂▂▂▃▃ |
| fatty acid | 1996 | 2.61 | 2022 | 2023 | ▂▂▂▂▂▂▂▂▂▂▂▂▂▂▂▂▂▂▂▂▂▂▂▂▂▂▂▂▂▃▃ |
| long-term intake | 2015 | 2.48 | 2022 | 2023 | ▂▂▂▂▂▂▂▂▂▂▂▂▂▂▂▂▂▂▂▂▂▂▂▂▂▂▂▂▂▃▃ |
| endoplasmic reticulum stress | 2019 | 2.11 | 2022 | 2023 | ▂▂▂▂▂▂▂▂▂▂▂▂▂▂▂▂▂▂▂▂▂▂▂▂▂▂▂▂▂▃▃ |
Disclaimer/Publisher’s Note: The statements, opinions and data contained in all publications are solely those of the individual author(s) and contributor(s) and not of MDPI and/or the editor(s). MDPI and/or the editor(s) disclaim responsibility for any injury to people or property resulting from any ideas, methods, instructions or products referred to in the content. |
© 2023 by the authors. Licensee MDPI, Basel, Switzerland. This article is an open access article distributed under the terms and conditions of the Creative Commons Attribution (CC BY) license (https://creativecommons.org/licenses/by/4.0/).
Share and Cite
He, H.; Liu, C.; Chen, M.; Guo, X.; Li, X.; Xiang, Z.; Liao, F.; Dong, W. Effect of Dietary Patterns on Inflammatory Bowel Disease: A Machine Learning Bibliometric and Visualization Analysis. Nutrients 2023, 15, 3442. https://doi.org/10.3390/nu15153442
He H, Liu C, Chen M, Guo X, Li X, Xiang Z, Liao F, Dong W. Effect of Dietary Patterns on Inflammatory Bowel Disease: A Machine Learning Bibliometric and Visualization Analysis. Nutrients. 2023; 15(15):3442. https://doi.org/10.3390/nu15153442
Chicago/Turabian StyleHe, Haodong, Chuan Liu, Meilin Chen, Xingzhou Guo, Xiangyun Li, Zixuan Xiang, Fei Liao, and Weiguo Dong. 2023. "Effect of Dietary Patterns on Inflammatory Bowel Disease: A Machine Learning Bibliometric and Visualization Analysis" Nutrients 15, no. 15: 3442. https://doi.org/10.3390/nu15153442
APA StyleHe, H., Liu, C., Chen, M., Guo, X., Li, X., Xiang, Z., Liao, F., & Dong, W. (2023). Effect of Dietary Patterns on Inflammatory Bowel Disease: A Machine Learning Bibliometric and Visualization Analysis. Nutrients, 15(15), 3442. https://doi.org/10.3390/nu15153442