

Social Network, Food Patterns, Physical Activity and Associations with Overweight and Obesity in Adolescents from a School in Rural Brazil

 ,
,  ,
,  and
and
Abstract
1. Introduction
2. Materials and Methods
2.1. Study Variables
2.2. Anthropometric Measurements
2.3. Social Networks
2.4. Food Patterns and Breakfast Consumption
2.5. Physical Activity and Screen Time
2.6. Confounding Variables
2.7. Data Analysis
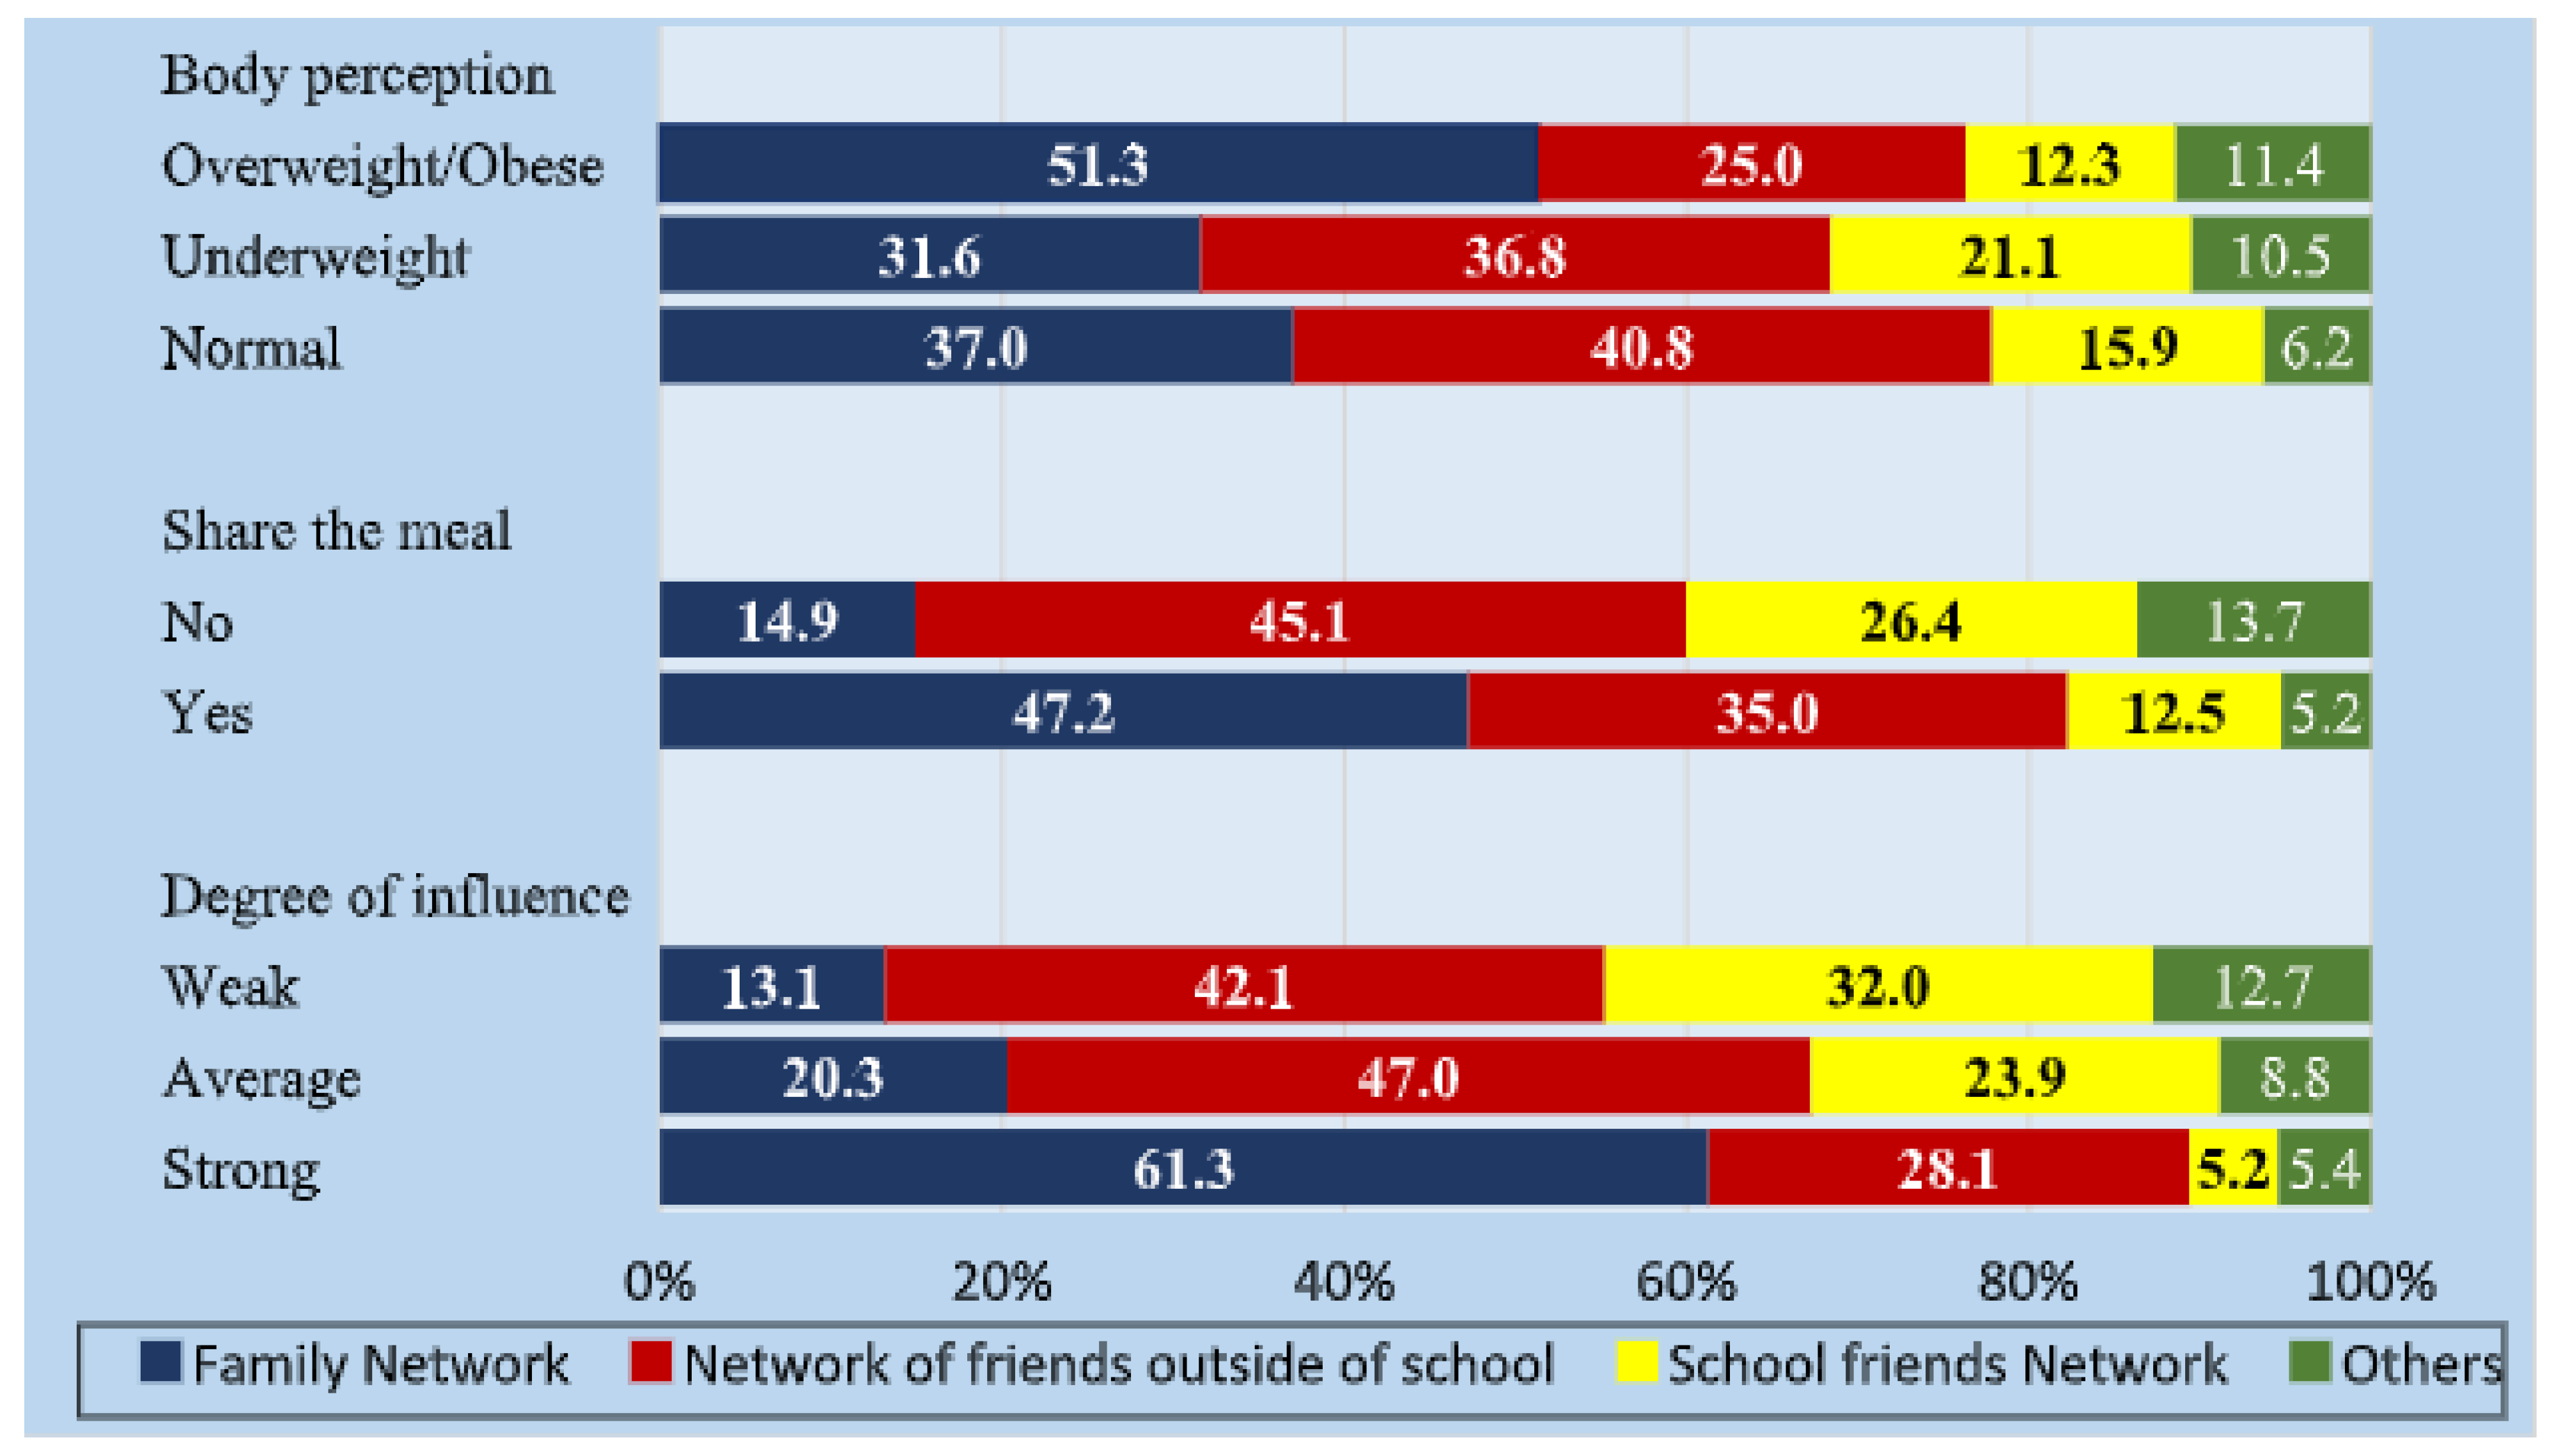
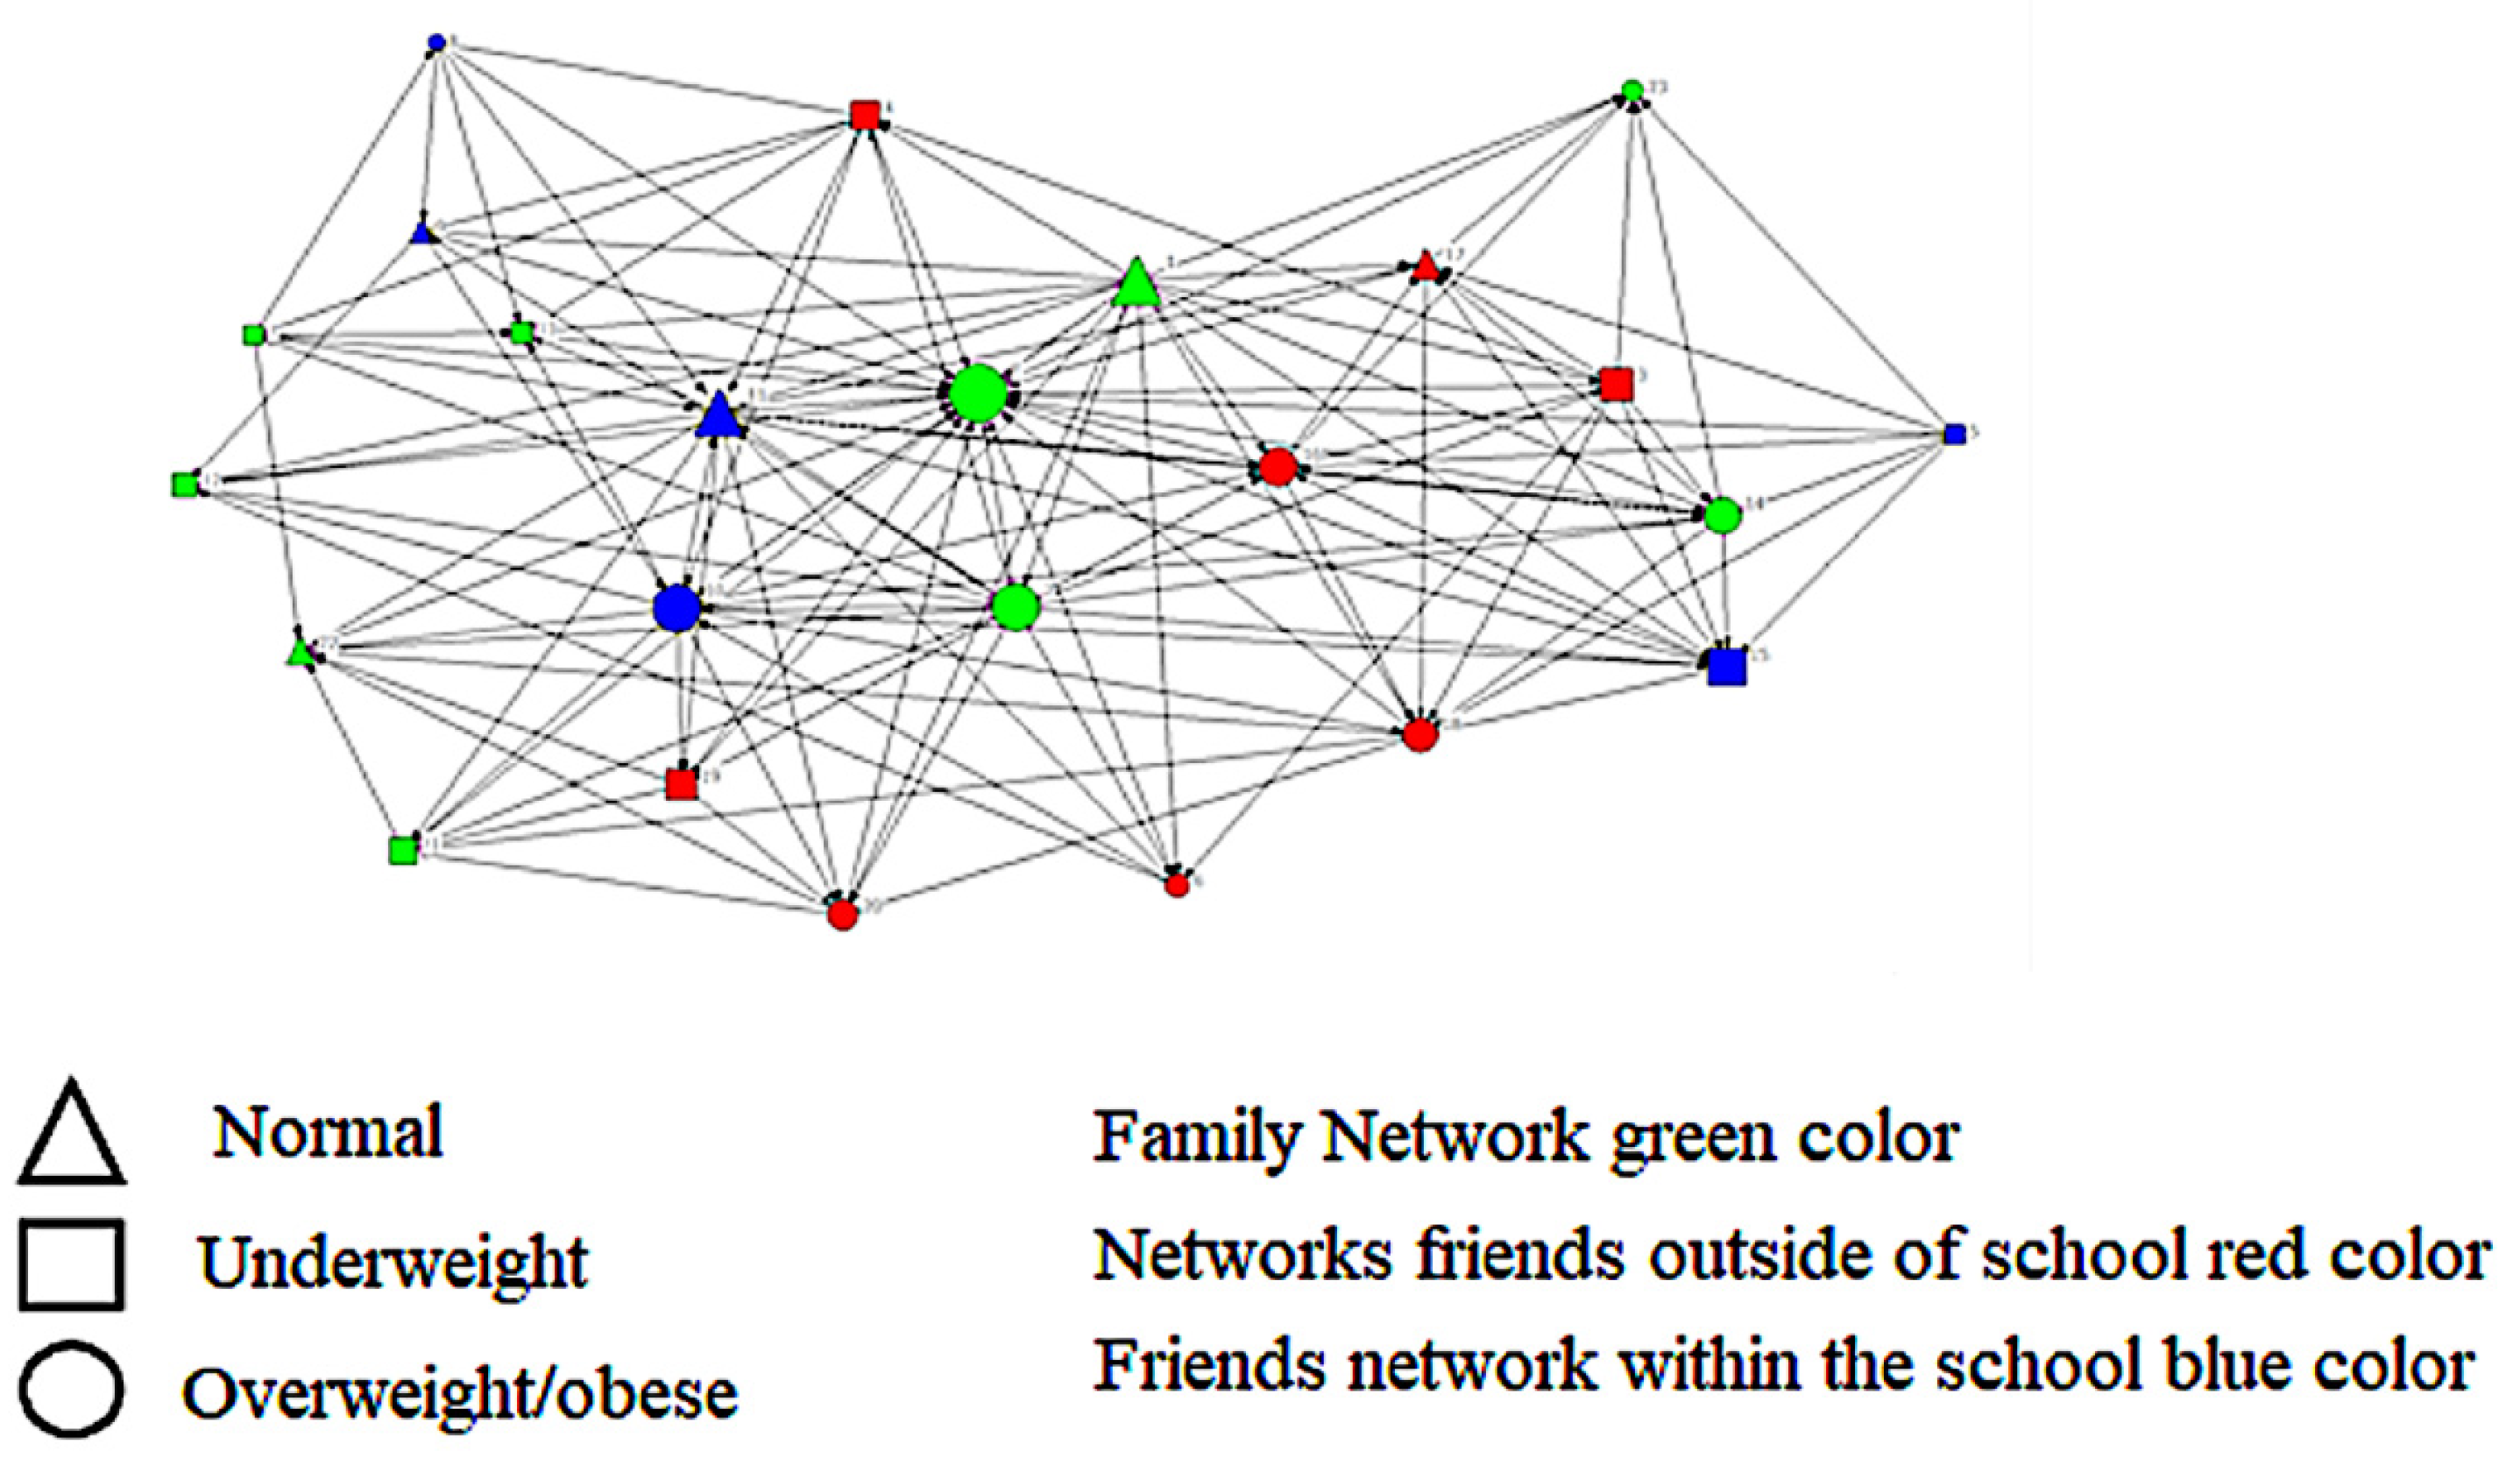
3. Results
4. Discussion
5. Conclusions
Supplementary Materials
Author Contributions
Funding
Institutional Review Board Statement
Informed Consent Statement
Data Availability Statement
Acknowledgments
Conflicts of Interest
References
- Collaboration NCDRF. Worldwide trends in body-mass index, underweight, overweight, and obesity from 1975 to 2016: A pooled analysis of 2416 population based measurement studies in 128.9 million children, adolescents, and adults. Lancet 2017, 16, 2627–2642. [Google Scholar]
- Swinburn, B.A.; Sacks, G.; Hall, K.D.; McPherson, K.; Finegood, D.T.; Moodie, M.L.; Gortmaker, S.L. The global obesity pandemic: Shaped by global drivers and local environments. Lancet 2011, 378, 804–814. [Google Scholar] [CrossRef] [PubMed]
- IBGE. Pesquisa Nacional de Saúde: 2019: Atenção Primária à Saúde e Informações Antropométricas; Instituto Brasileiro de Geografia e Estatística: Rio Janeiro, Brazil, 2020; pp. 1–66. ISBN 978-65-87201-25.
- Ferreira, A.P.S.; Szwarcwald, C.L.; Damacena, G.N.; Souza Júnior, P.R.B. Increasing trends in obesity prevalence from 2013 to 2019 and associated factors in Brazil. Rev. Bras. Epidemiol. 2021, 24, e210009. [Google Scholar] [CrossRef]
- Cattafesta, M.; Petarli, G.B.; da Luz, T.C.; Zandonade, E.; de Paula, A.B.O.M.; Salaroli, L.B. Dietary patterns of Brazilian farmers and their relation with sociodemographic, labor, and lifestyle conditions. Nutr. J. 2020, 19, 23. [Google Scholar] [CrossRef]
- Ragelienė, T.; Grønhøj, A. The influence of peers’ and siblings’ on children’s and adolescents’ healthy eating behavior: A systematic literature review. Appetite 2020, 148, 104592. [Google Scholar] [CrossRef]
- Piombo, S.E.; Huh, J.; Valente, T.W. Adolescent Body Mass Index and Exposure to Peers with Overweight and Obesity: A Structural Equation Model Approach to Longitudinal Network Data. Child Obes. 2022, 18, 445–453. [Google Scholar] [CrossRef] [PubMed]
- Christakis, N.A.; Fowler, J.H. The Spread of Obesity in a Large Social Network over 32 Years. N. Engl. J. Med. 2007, 357, 370–379. [Google Scholar] [CrossRef]
- Wasserman, S.; Faust, K. Social Network Analysis; Cambridge University Press: Cambridge, UK, 1994; 825p. [Google Scholar]
- Brass, D.J.; Galaskiewicz, J.; Greve, H.R.; Tsai, W. Taking Stock of Networks and Organizations: A Multilevel Perspective. Acad. Manag. J. 2004, 47, 795–817. [Google Scholar] [CrossRef]
- Powell-Wiley, T.M.; Poirier, P.; Burke, L.E.; Després, J.P.; Gordon-Larsen, P.; Lavie, C.J.; Lear, S.A.; Ndumele, C.E.; Neeland, I.J.; Sanders, P.; et al. Obesity and Cardio-vascular Disease: A Scientific Statement from the American Heart Association. Circulation 2021, 143, 984–1010. [Google Scholar] [CrossRef]
- Chaput, J.P.; McHill, A.W.; Cox, R.C.; Broussard, J.L.; Dutil, C.; da Costa, B.G.G.; Sampasa-Kanyinga, H.; Wright, K.P., Jr. The role of insufficient sleep and circadian misalignment in obesity. Nat. Rev. Endocrinol. 2023, 19, 82–97. [Google Scholar] [CrossRef]
- Nonguierma, E.; Lesco, E.; Olak, R.; Welch, H.; Zar Alam, N.; Bonyadi, J.; Hopkins, L. Improving Obesogenic Dietary Behaviors among Adolescents: A Systematic Review of Randomized Controlled Trials. Nutrients 2022, 14, 4592. [Google Scholar] [CrossRef]
- Weihrauch-Blüher, S.; Schwarz, P.; Klusmann, J.-H. Childhood Obesity: Increased Risk for Cardiometabolic Disease and Cancer in Adulthood. Metabolism 2019, 92, 147–152. [Google Scholar] [CrossRef] [PubMed]
- Popkin, B.M. Is the obesity epidemic a national security issue around the globe? Curr. Opin. Endocrinol. Diabetes Obes. 2011, 18, 328–331. [Google Scholar] [CrossRef]
- Valente, T.W.; Coronges, K.; Lakon, C.; Costenbader, E. How Correlated Are Network Centrality Measures? Connections 2008, 28, 16–26. [Google Scholar]
- Hammond, R.A.; Ornstein, J.T. A model of social influence on body mass index: A model of social influence on BMI. Ann. N. Y. Acad. Sci. 2014, 1331, 34–42. [Google Scholar] [CrossRef] [PubMed]
- Marqués-Sánchez, P.; Benítez-Andrades, J.A.; Calvo Sánchez, M.D.; Arias, N. The socialisation of the adolescent who carries out team sports: A transversal study of centrality with a social network analysis. BMJ Open 2021, 11, e042773. [Google Scholar] [CrossRef]
- Cohen-Cole, E.; Fletcher, J.M. Is obesity contagious? Social networks vs. environmental factors in the obesity epidemic. J. Health Econ. 2008, 27, 1382–1387. [Google Scholar] [CrossRef]
- Valente, T.W.; Fujimoto, K.; Chou, C.-P.; Spruijt-Metz, D. Adolescent Affiliations and Adiposity: A Social Network Analysis of Friendships and Obesity. J. Adolesc. Health 2009, 45, 202–204. [Google Scholar] [CrossRef]
- Chung, S.J.; Ersig, A.L.; McCarthy, A.M. Diet and Physical Activity of Korean Female Adolescents in Their Peer Networks. J. Nurs. Sch. 2019, 51, 147–156. [Google Scholar] [CrossRef]
- Grund, T.; Tatum, T. Some friends matter more than others: BMI clustering among adolescents in four European countries. Netw. Sci. 2019, 7, 123–139. [Google Scholar] [CrossRef]
- Instituto Brasileiro de Geografia e Estatística (IBGE). Cidades e Estados. Censo Sinopse. Available online: https://cidades.ibge.gov.br/brasil/rn/ielmo-marinho/panorama (accessed on 20 January 2023).
- IBGE. Pesquisa Nacional de Saúde do Escolar; Instituto Brasileiro de Geografia e Estatística: Rio Janeiro, Brazil, 2015. Available online: https://www.ibge.gov.br/estatisticas/sociais/educacao/9134-pesquisa (accessed on 30 March 2023).
- De Onis, M.; Onyango, A.W.; Borghi, E.; Siyam, A.; Nishida, C.; Siekmann, J. Development of a WHO growth reference for school-aged children and adolescents. Bull. World Health Organ. 2007, 85, 660–667. [Google Scholar] [CrossRef] [PubMed]
- Maya Jariego, I. Why name generators with a fixed number of alters may be a pragmatic option for personal network analysis. Am. J. Community Psychol. 2018, 62, 233–238. [Google Scholar] [CrossRef] [PubMed]
- Rivera, E.M. Redes Sociales y Obesidad en Jóvenes Universitários; Universidade Iberoamericana León: León, México, 2014; 60p. [Google Scholar]
- Hanneman, R.; Riddle, M. Introduction to Social Network Methods. University of California, Riverside. 2005. Available online: http://faculty.ucr.edu/~hanneman/ (accessed on 10 March 2023).
- Greenacre, M.; Groenen, P.J.F.; Hastie, T.; D’Enza, A.I.; Markos, A.; Tuzhilina, E. Principal component analysis. Nat. Rev. Methods Primers 2022, 2, 100. [Google Scholar] [CrossRef]
- Jolliffe, I.T.; Cadima, J. Principal component analysis: A review and recent developments. Philos. Trans. A Math. Phys. Eng. Sci. 2016, 374, 20150202. [Google Scholar] [CrossRef] [PubMed]
- Santos, R.O.; Gorgulho, B.M.; Castro, M.A.; Fisberg, R.M.; Marchioni, D.M.; Baltar, V.T. Principal Component Analysis and Factor Analysis: Differences and similarities in Nutritional Epidemiology application. Rev. Bras. Epidemiol. 2019, 22, 1–29. [Google Scholar] [CrossRef]
- Hawe, P.; Webster, C.; Shiell, A. A glossary of terms for navigating the field of social network analysis. J. Epidemiol. Community Health 2004, 58, 971–975. [Google Scholar] [CrossRef]
- Jay, M. Generalhoslem: Goodness of Fit Tests for Logistic Regression Models. 2019. Available online: https://cran.r-project.org/web/packages/generalhoslem/index.html (accessed on 3 February 2023).
- Hosmer Junior, D.W.; Lemeshow, S.; Sturdivant, R.X. Applied Logistic Regression; John Wiley & Sons: New York, NY, USA, 2013. [Google Scholar] [CrossRef]
- Bloch, K.V.; Klein, C.H.; Szklo, M.; Kuschnir, M.C.C.; Abreu, G.D.A.; Barufaldi, L.A.; Goldberg, T.B.L. ERICA: Prevalências de hipertensão arterial e obesidade em adolescentes brasileiros. Rev. Saúde Pública 2016, 50, 1–13. [Google Scholar]
- Bozdogan, H. Model selection and Akaike’s Information Criterion (AIC): The general theory and its analytical extensions. Psychometrika 1987, 52, 345–370. [Google Scholar] [CrossRef]
- Scaglioni, S.; De Cosmi, V.; Ciappolino, V.; Parazzini, F.; Brambilla, P.; Agostoni, C. Factors Influencing Children’s Eating Behaviours. Nutrients 2018, 31, 706. [Google Scholar] [CrossRef]
- McGlashan, J.; de la Haye, K.; Wang, P.; Allender, S. Collaboration in Complex Systems: Multilevel Network Analysis for Community-Based Obesity Prevention Interventions. Sci. Rep. 2019, 9, 12599. [Google Scholar] [CrossRef]
- Blackford, K.; Leavy, J.E.; Vidler, A.C.; Chamberlain, D.; Pollard, C.; Riley, T.; Milligan, M.; Jancey, J. Initiatives and partnerships in an Australian metropolitan obesity prevention system: A social network analysis. BMC Public Health 2021, 21, 1542. [Google Scholar] [CrossRef] [PubMed]
- Fleary, S.A.; Ettienne, R. The relationship between food parenting practices, parental diet and their adolescents’ diet. Appetite 2019, 135, 79–85. [Google Scholar] [CrossRef]
- Deslippe, A.L.; O’Connor, T.M.; Brussoni, M.; Mâsse, L.C. The association of food parenting practices with adolescents’ dietary behaviors differ by youth gender, but not by parent gender. Appetite 2022, 169, 105846. [Google Scholar] [CrossRef] [PubMed]
- Serrano, F.N.; Rogers, A.; Portillo, M.C. Social network influences and the adoption of obesity-related behaviours in adults: A critical interpretative synthesis review. BMC Public Health 2019, 19, 1178. [Google Scholar] [CrossRef] [PubMed]
- Ybarra, M.; Barnett, T.A.; Yu, J.; Van Hulst, A.; Drouin, O.; Kakinami, L.; Saint-Charles, J.; Henderson, M. Personal social networks and adiposity in adolescents: A feasibility study. Child. Obes. 2021, 17, 542–550. [Google Scholar] [CrossRef]
- de la Haye, K.; Robins, G.; Mohr, P.; Wilson, C. Obesity-related behaviors in adolescent friendship networks. Soc. Netw. 2010, 32, 161–167. [Google Scholar] [CrossRef]
- Arias Ramos, N.; Calvo Sánchez, M.D.; Fernández-Villa, T.; Ovalle Perandones, M.A.; Fernández García, D.; Marqués-Sánchez, P. Social exclusion of the adolescent with overweight: Study of sociocentric social networks in the classroom. Pediatr. Obes. 2018, 13, 614–620. [Google Scholar] [CrossRef]
- Zhang, S.; de la Haye, K.; Ji, M.; An, R. Applications of social network analysis to obesity: A systematic review. Obes. Rev. 2018, 19, 976–988. [Google Scholar] [CrossRef]
- Drozdz, D.; Alvarez-Pitti, J.; Wójcik, M.; Borghi, C.; Gabbianelli, R.; Mazur, A.; Herceg-Čavrak, V.; Lopez-Valcarcel, B.G.; Brzeziński, M.; Lurbe, E.; et al. Obesity and Cardiometabolic Risk Factors: From Childhood to Adulthood. Nutrients 2021, 13, 4176. [Google Scholar] [CrossRef]
- Kovalskys, I.; Fisberg, M.; Previdelli, A.N.; Pereira, J.L.; Zimberg, I.Z.; Guajardo, V.; Fisberg, R.; Ferrari, G.; Gómez, G.; Rigotti, A.; et al. ELANS Study Group. Breakfast in Latin America: Evaluation of Nutrient and Food Group Intake toward a Nutrient-Based Recommendation. J. Acad. Nutr. Diet. 2022, 122, 1099–1113. [Google Scholar] [CrossRef]
- Delley, M.; Brunner, T.A. Breakfast eating patterns and drivers of a healthy breakfast composition. Appetite 2019, 137, 90–98. [Google Scholar] [CrossRef]
- Jia, P.; Luo, M.; Li, Y.; Zheng, J.S.; Xiao, Q.; Luo, J. Fast-food restaurant, unhealthy eating, and childhood obesity: A systematic review and meta-analysis. Obes. Rev. 2021, 22, e12944. [Google Scholar] [CrossRef] [PubMed]
- Almoraie, N.M.; Saqaan, R.; Alharthi, R.; Alamoudi, A.; Badh, L.; Shatwan, I.M. Snacking patterns throughout the life span: Potential implications on health. Nutr. Res. 2021, 91, 81–94. [Google Scholar] [CrossRef]
- Sanyaolu, A.; Okorie, C.; Qi, X.; Locke, J.; Rehman, S. Childhood and Adolescent Obesity in the United States: A Public Health Concern. Glob. Pediatr. Health 2019, 6, 2333794X19891305. [Google Scholar] [CrossRef] [PubMed]
- Neri, D.; Steele, E.M.; Khandpur, N.; Cediel, G.; Zapata, M.E.; Rauber, F.; Marrón-Ponce, J.A.; Machado, P.; Louzada, C.; Andrade, G.C.; et al. Ultraprocessed food consumption and dietary nutrient profiles associated with obesity: A multicountry study of children and adolescents. Obes. Rev. 2022, 23, e13387. [Google Scholar] [CrossRef] [PubMed]
- Oviedo-Solís, C.I.; Monterrubio-Flores, E.A.; Cediel, G.; Denova-Gutiérrez, E.; Barquera, S. Trend of Ultraprocessed Product Intake Is Associated with the Double Burden of Malnutrition in Mexican Children and Adolescents. Nutrients 2022, 20, 4347. [Google Scholar] [CrossRef] [PubMed]


| Variable | n | % |
|---|---|---|
| Age (in years) | ||
| 14–15 | 25 | 27.8 |
| 16–17 | 46 | 51.1 |
| 18–19 | 19 | 21.1 |
| Total | 90 | 100.0 |
| Sex | ||
| Female | 58 | 64.4 |
| Male | 32 | 35.6 |
| Total | 90 | 100.0 |
| Race | ||
| White | 23 | 25.5 |
| Black | 15 | 16.7 |
| Pardo/Brown | 52 | 57.8 |
| Total | 90 | 100.0 |
| Income | ||
| ≤1 minimum wage | 71 | 78.9 |
| ≥2 minimum wages | 19 | 21.1 |
| Total | 90 | 100.0 |
| Food Patterns | ||
| Healthy | 54 | 60.0 |
| Unhealthy | 36 | 40.0 |
| Total | 90 | 100.0 |
| BMI | ||
| Normal | 63 | 70.0 |
| Overweight/Obesity | 27 | 30.0 |
| Total | 90 | 100.0 |
| Maternal schooling (in years) | ||
| <9 | 10 | 11.1 |
| 9–11 | 55 | 61.1 |
| ≥12 | 25 | 27.8 |
| Total | 90 | 100.0 |
| Model 1 (Unadjusted) | Model 2 (Adjusted) * | ||||
|---|---|---|---|---|---|
| Variable | n | p-Value | OR (95%CI) | p-Value | AOR (95%CI) |
| Food Patterns | |||||
| Healthy | 54 | - | - | - | - |
| Unhealthy | 36 | 0.029 | 2.99 (1.11–8.03) | 0.022 | 3.12 (1.17–8.29) |
| Consumption of breakfast | |||||
| Regular | 49 | - | - | - | - |
| Irregular | 41 | 0.039 | 2.89 (1.05–7.96) | 0.039 | 2.89 (1.05–7.96) |
| Hours of tv | |||||
| >2 h | 54 | - | - | - | - |
| ≤2 h | 36 | 0.529 | 0.71 (0.24–2.08) | 0.474 | 0.67 (0.23–1.96) |
| Screen time/day | |||||
| >2 h | 53 | - | - | - | - |
| ≤2 h | 37 | 0.996 | 0.99 (0.35–2.84) | 0.847 | 0.91 (0.33–2.46) |
| Physical activity at school | |||||
| No | 44 | - | - | - | - |
| Yes | 46 | 0.414 | 0.65 (0.23–1.83) | 0.504 | 0.70 (0.25–1.95) |
| Model 1 (Unadjusted) | Model 2 (Adjusted) | ||||
|---|---|---|---|---|---|
| Variable | n | p-Value | OR (95%CI) | p-Value | AOR (95%CI) |
| Sex | |||||
| Female | 58 | - | - | - | - |
| Male | 32 | 0.007 | 4.44 (1.50–13.17) | 0.008 | 4.18 (1.44–12.17) |
| Food patterns | |||||
| Healthy | 54 | - | - | - | - |
| Unhealthy | 36 | 0.009 | 4.08 (1.41–11.76) | 0.011 | 3.74 (1.35–10.38) |
| Eingenvector centrality | |||||
| 0.00–0.10 | 16 | - | - | - | - |
| 0.11–0.68 | 74 | 0.047 | 5.72 (1.02–32.17) | 0.040 | 5.88 (1.08–32.03) |
Disclaimer/Publisher’s Note: The statements, opinions and data contained in all publications are solely those of the individual author(s) and contributor(s) and not of MDPI and/or the editor(s). MDPI and/or the editor(s) disclaim responsibility for any injury to people or property resulting from any ideas, methods, instructions or products referred to in the content. |
© 2023 by the authors. Licensee MDPI, Basel, Switzerland. This article is an open access article distributed under the terms and conditions of the Creative Commons Attribution (CC BY) license (https://creativecommons.org/licenses/by/4.0/).
Share and Cite
Aguirre, M.d.J.X.; Drumond Andrade, F.C.; Aguirre, M.A.C.; Justino, J.R.; Maciel, B.L.L. Social Network, Food Patterns, Physical Activity and Associations with Overweight and Obesity in Adolescents from a School in Rural Brazil. Nutrients 2023, 15, 3305. https://doi.org/10.3390/nu15153305
Aguirre MdJX, Drumond Andrade FC, Aguirre MAC, Justino JR, Maciel BLL. Social Network, Food Patterns, Physical Activity and Associations with Overweight and Obesity in Adolescents from a School in Rural Brazil. Nutrients. 2023; 15(15):3305. https://doi.org/10.3390/nu15153305
Chicago/Turabian StyleAguirre, Maria de Jesus Xavier, Flavia Cristina Drumond Andrade, Moisés Alberto Calle Aguirre, Josivan Ribeiro Justino, and Bruna Leal Lima Maciel. 2023. "Social Network, Food Patterns, Physical Activity and Associations with Overweight and Obesity in Adolescents from a School in Rural Brazil" Nutrients 15, no. 15: 3305. https://doi.org/10.3390/nu15153305
APA StyleAguirre, M. d. J. X., Drumond Andrade, F. C., Aguirre, M. A. C., Justino, J. R., & Maciel, B. L. L. (2023). Social Network, Food Patterns, Physical Activity and Associations with Overweight and Obesity in Adolescents from a School in Rural Brazil. Nutrients, 15(15), 3305. https://doi.org/10.3390/nu15153305