
An Okinawan-Based Nordic Diet Leads to Profound Effects on Gut Microbiota and Plasma Metabolites Linked to Glucose and Lipid Metabolism


Abstract
1. Introduction
2. Materials and Methods
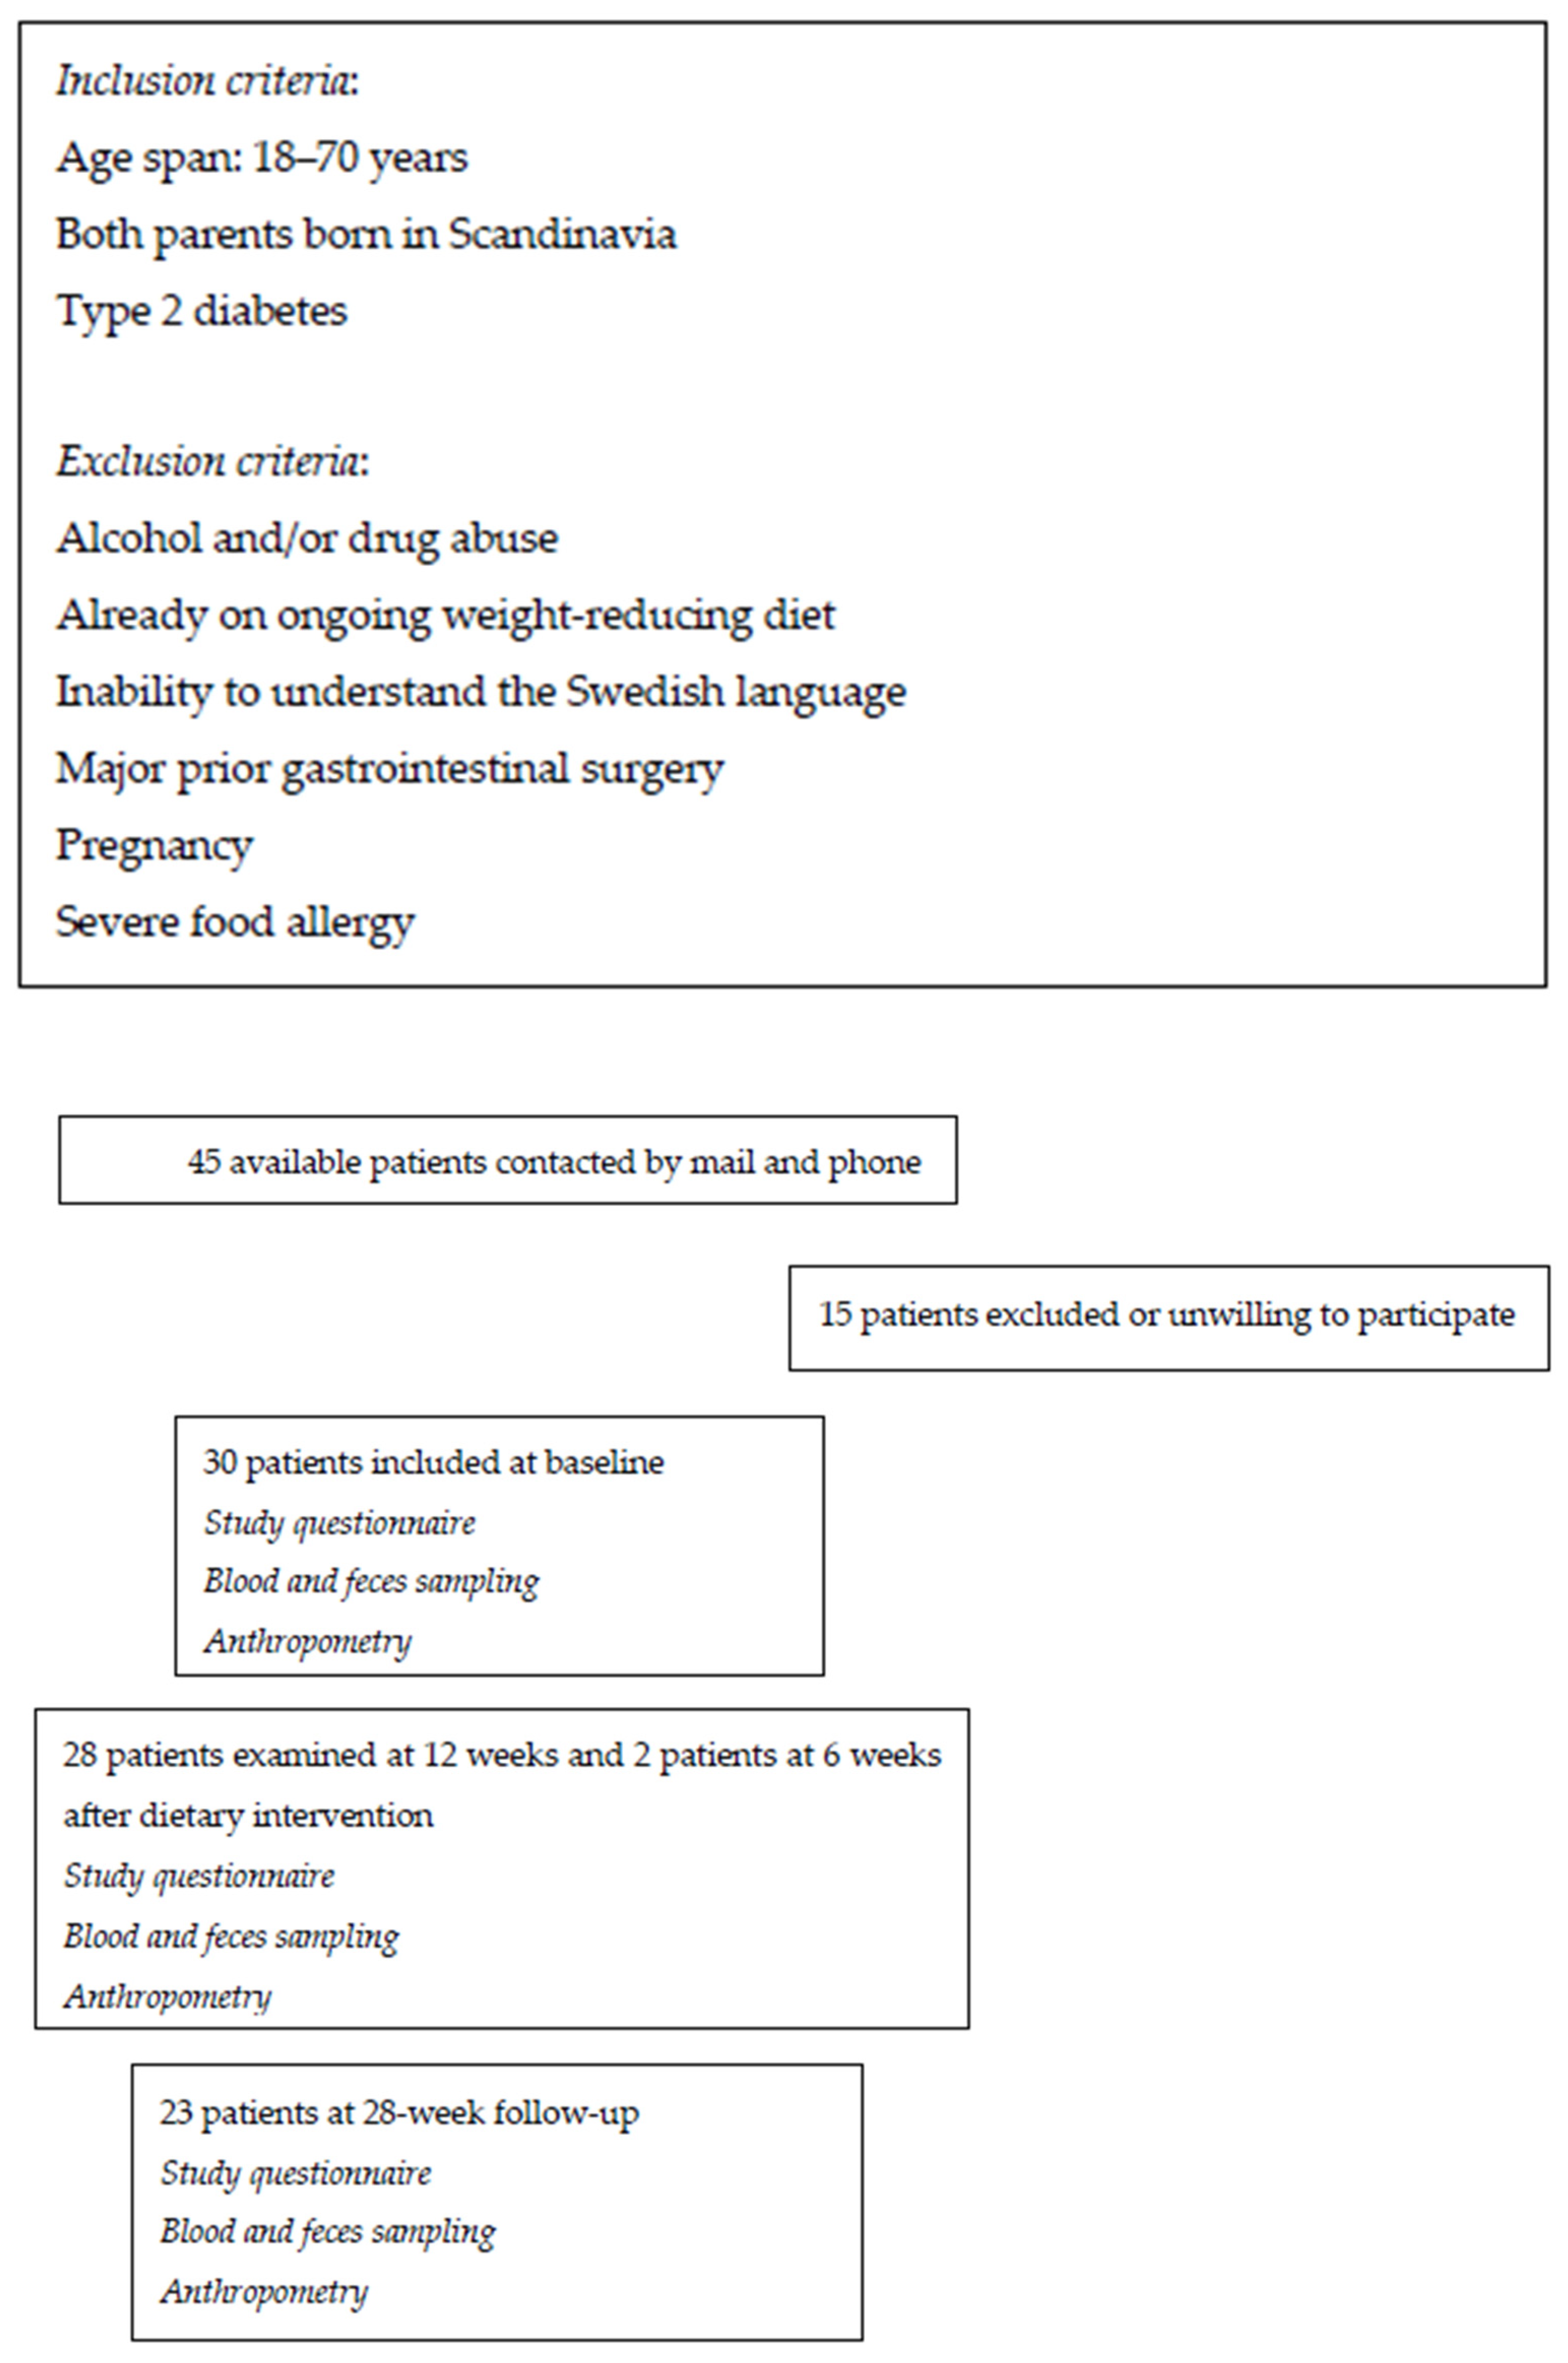
2.1. Study Population and Design
2.2. Dietary Advice
2.3. Questionnaires
2.3.1. Study Questionnaire
2.3.2. Nutrition Questionnaire
2.3.3. Visual Analog Scale for Irritable Bowel Syndrome
2.4. Assessment of Clinical Variables and Anthropometry
2.5. Sampling and Chemistry Analyses
2.6. Metabolomics
2.7. Gut Microbiota Analysis
2.8. Statistical Analyses
3. Results
3.1. Clinical Characteristics
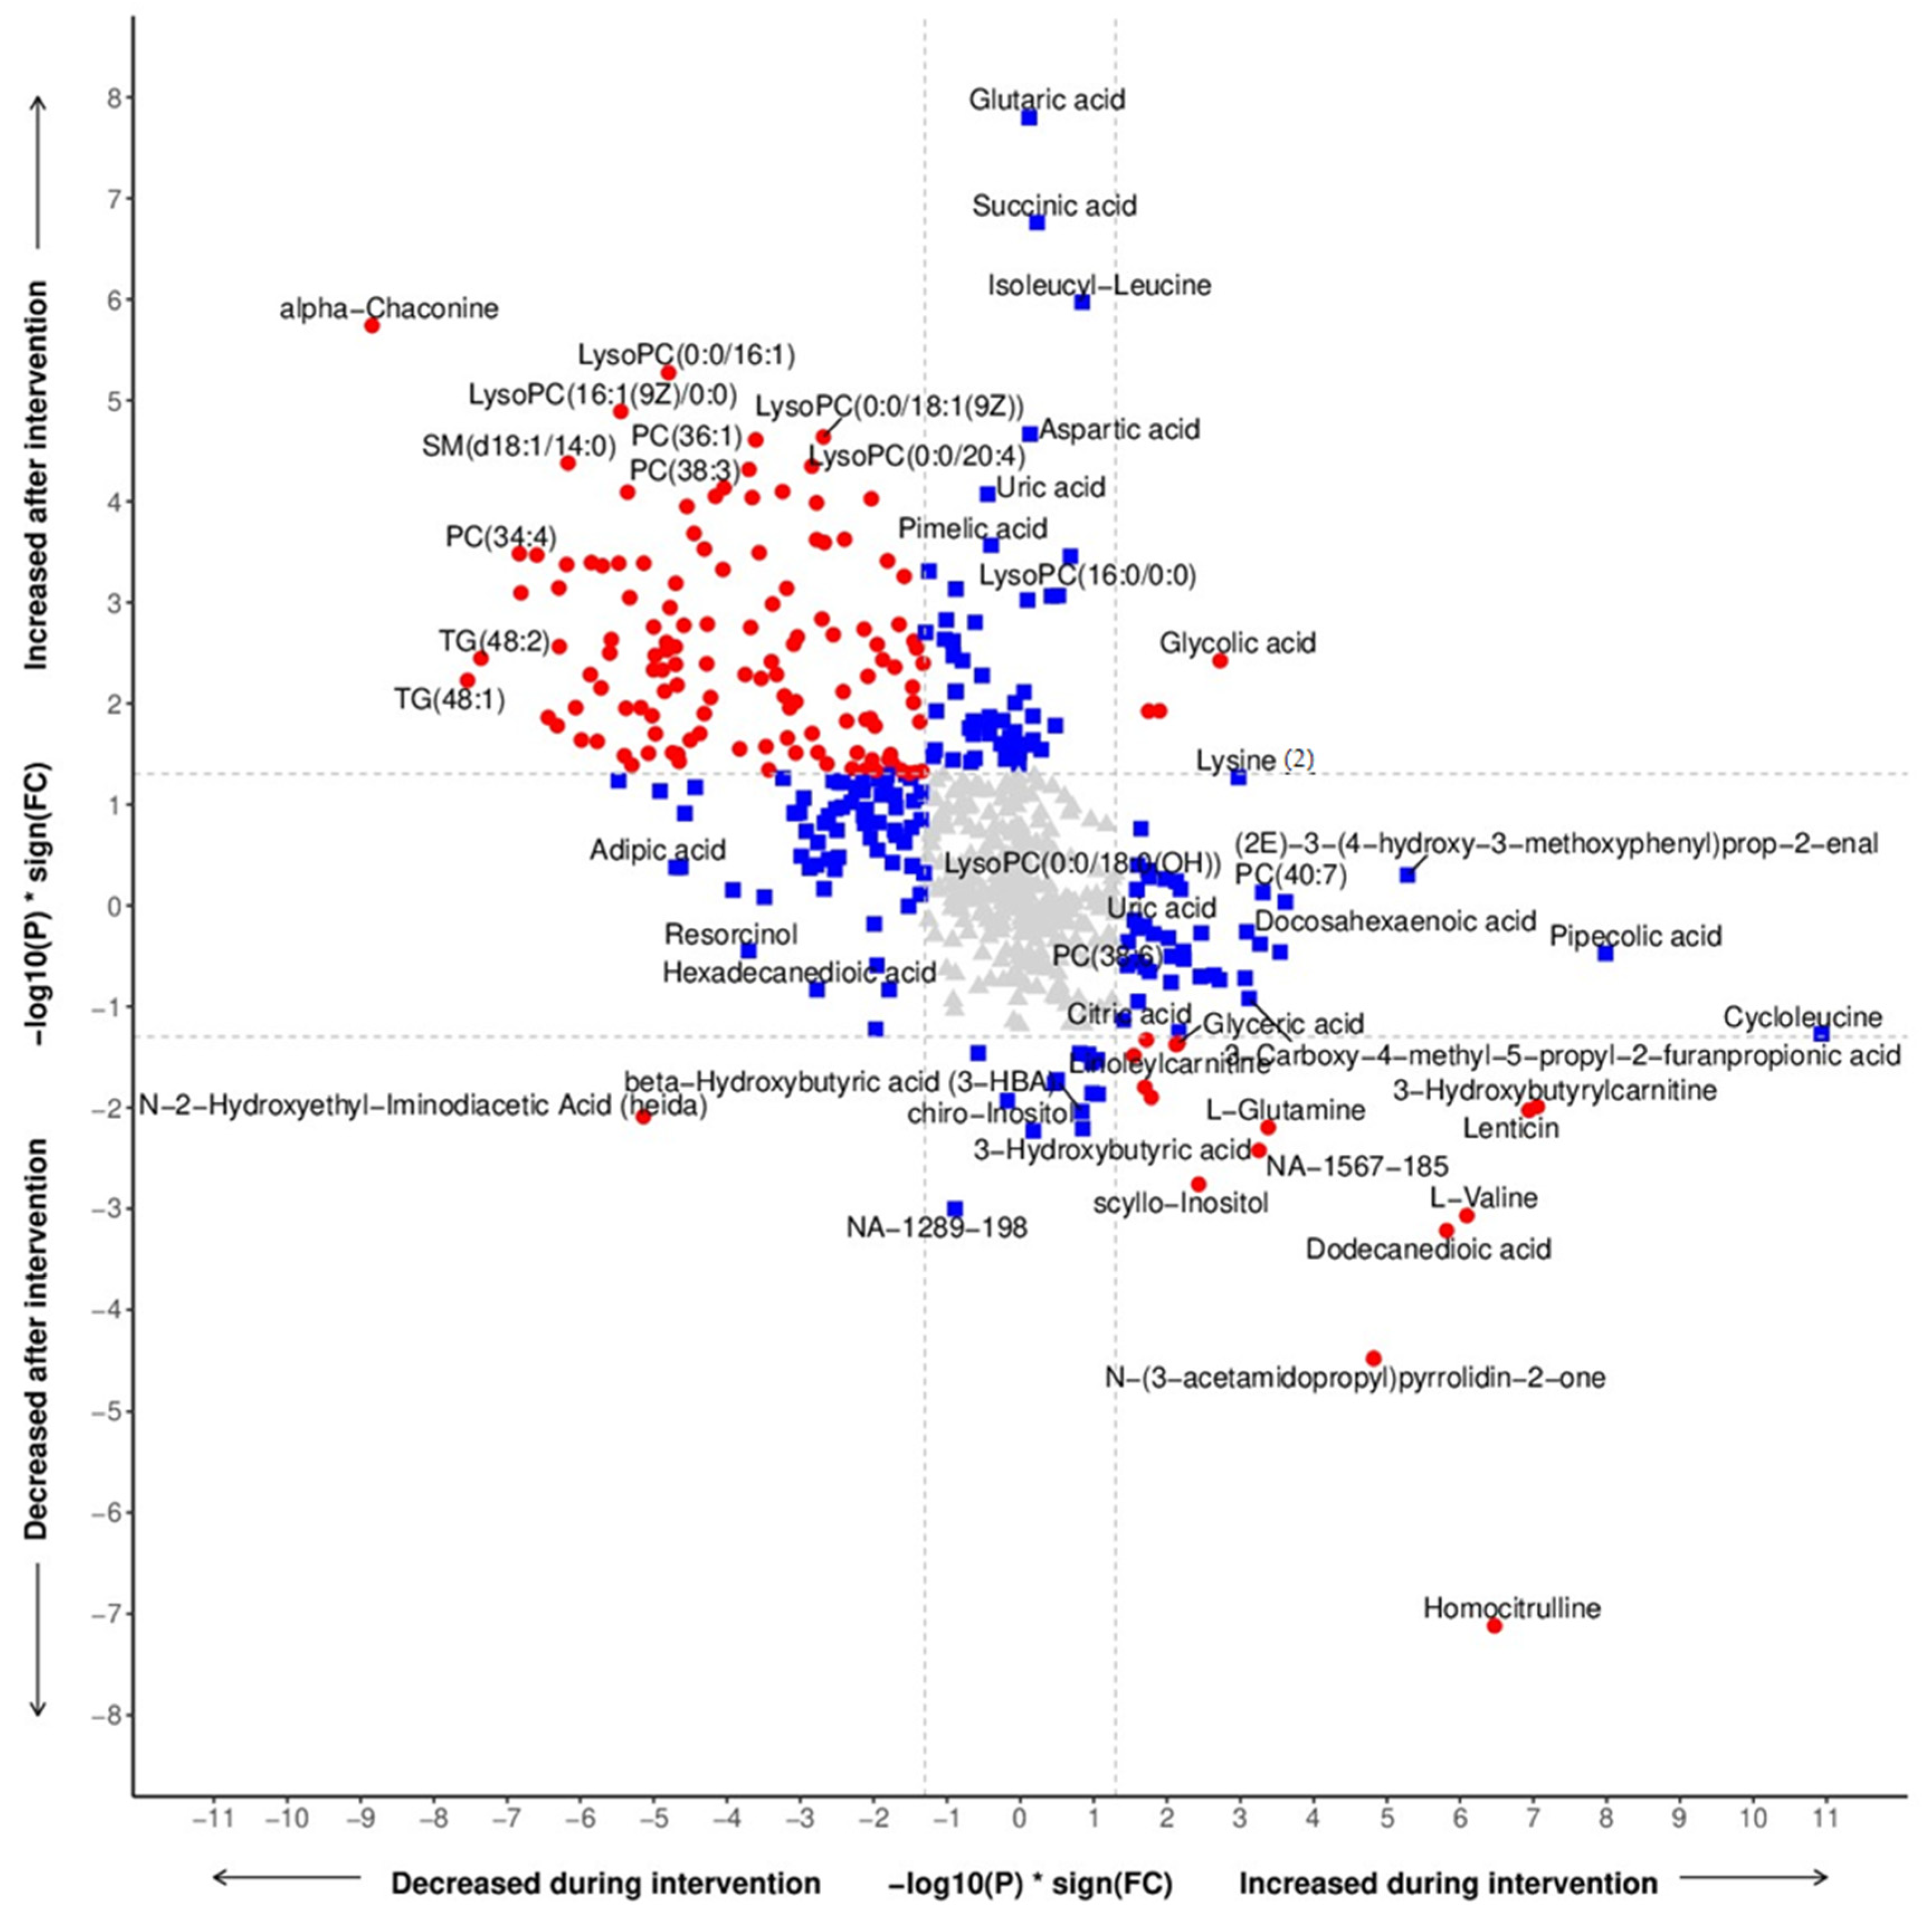
3.2. Metabolomic Profiling
3.3. Metabolomics Related to Food Components
3.4. Clinical Correlations
3.5. Hormones and Neurotransmitters
3.6. Microbiota Assessment
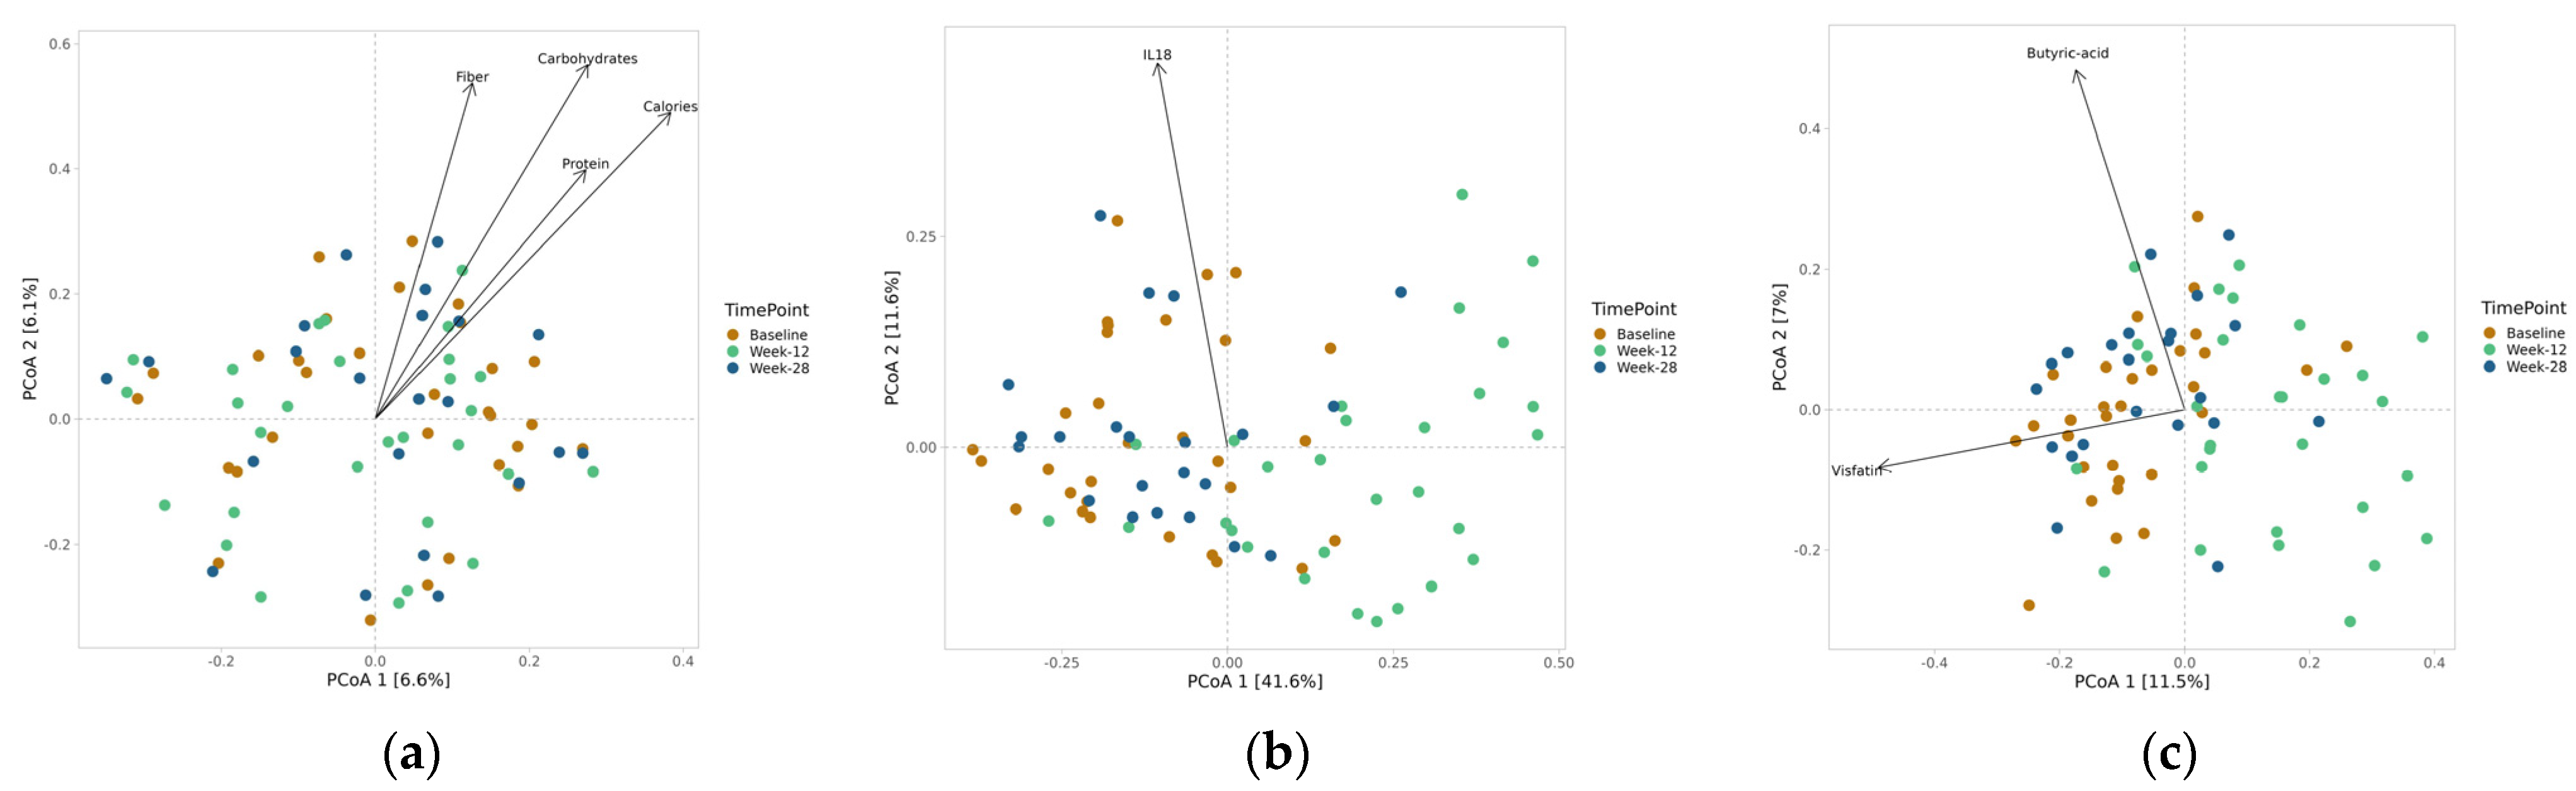
3.7. Alpha and Beta Diversity
3.8. Taxonomy Measures
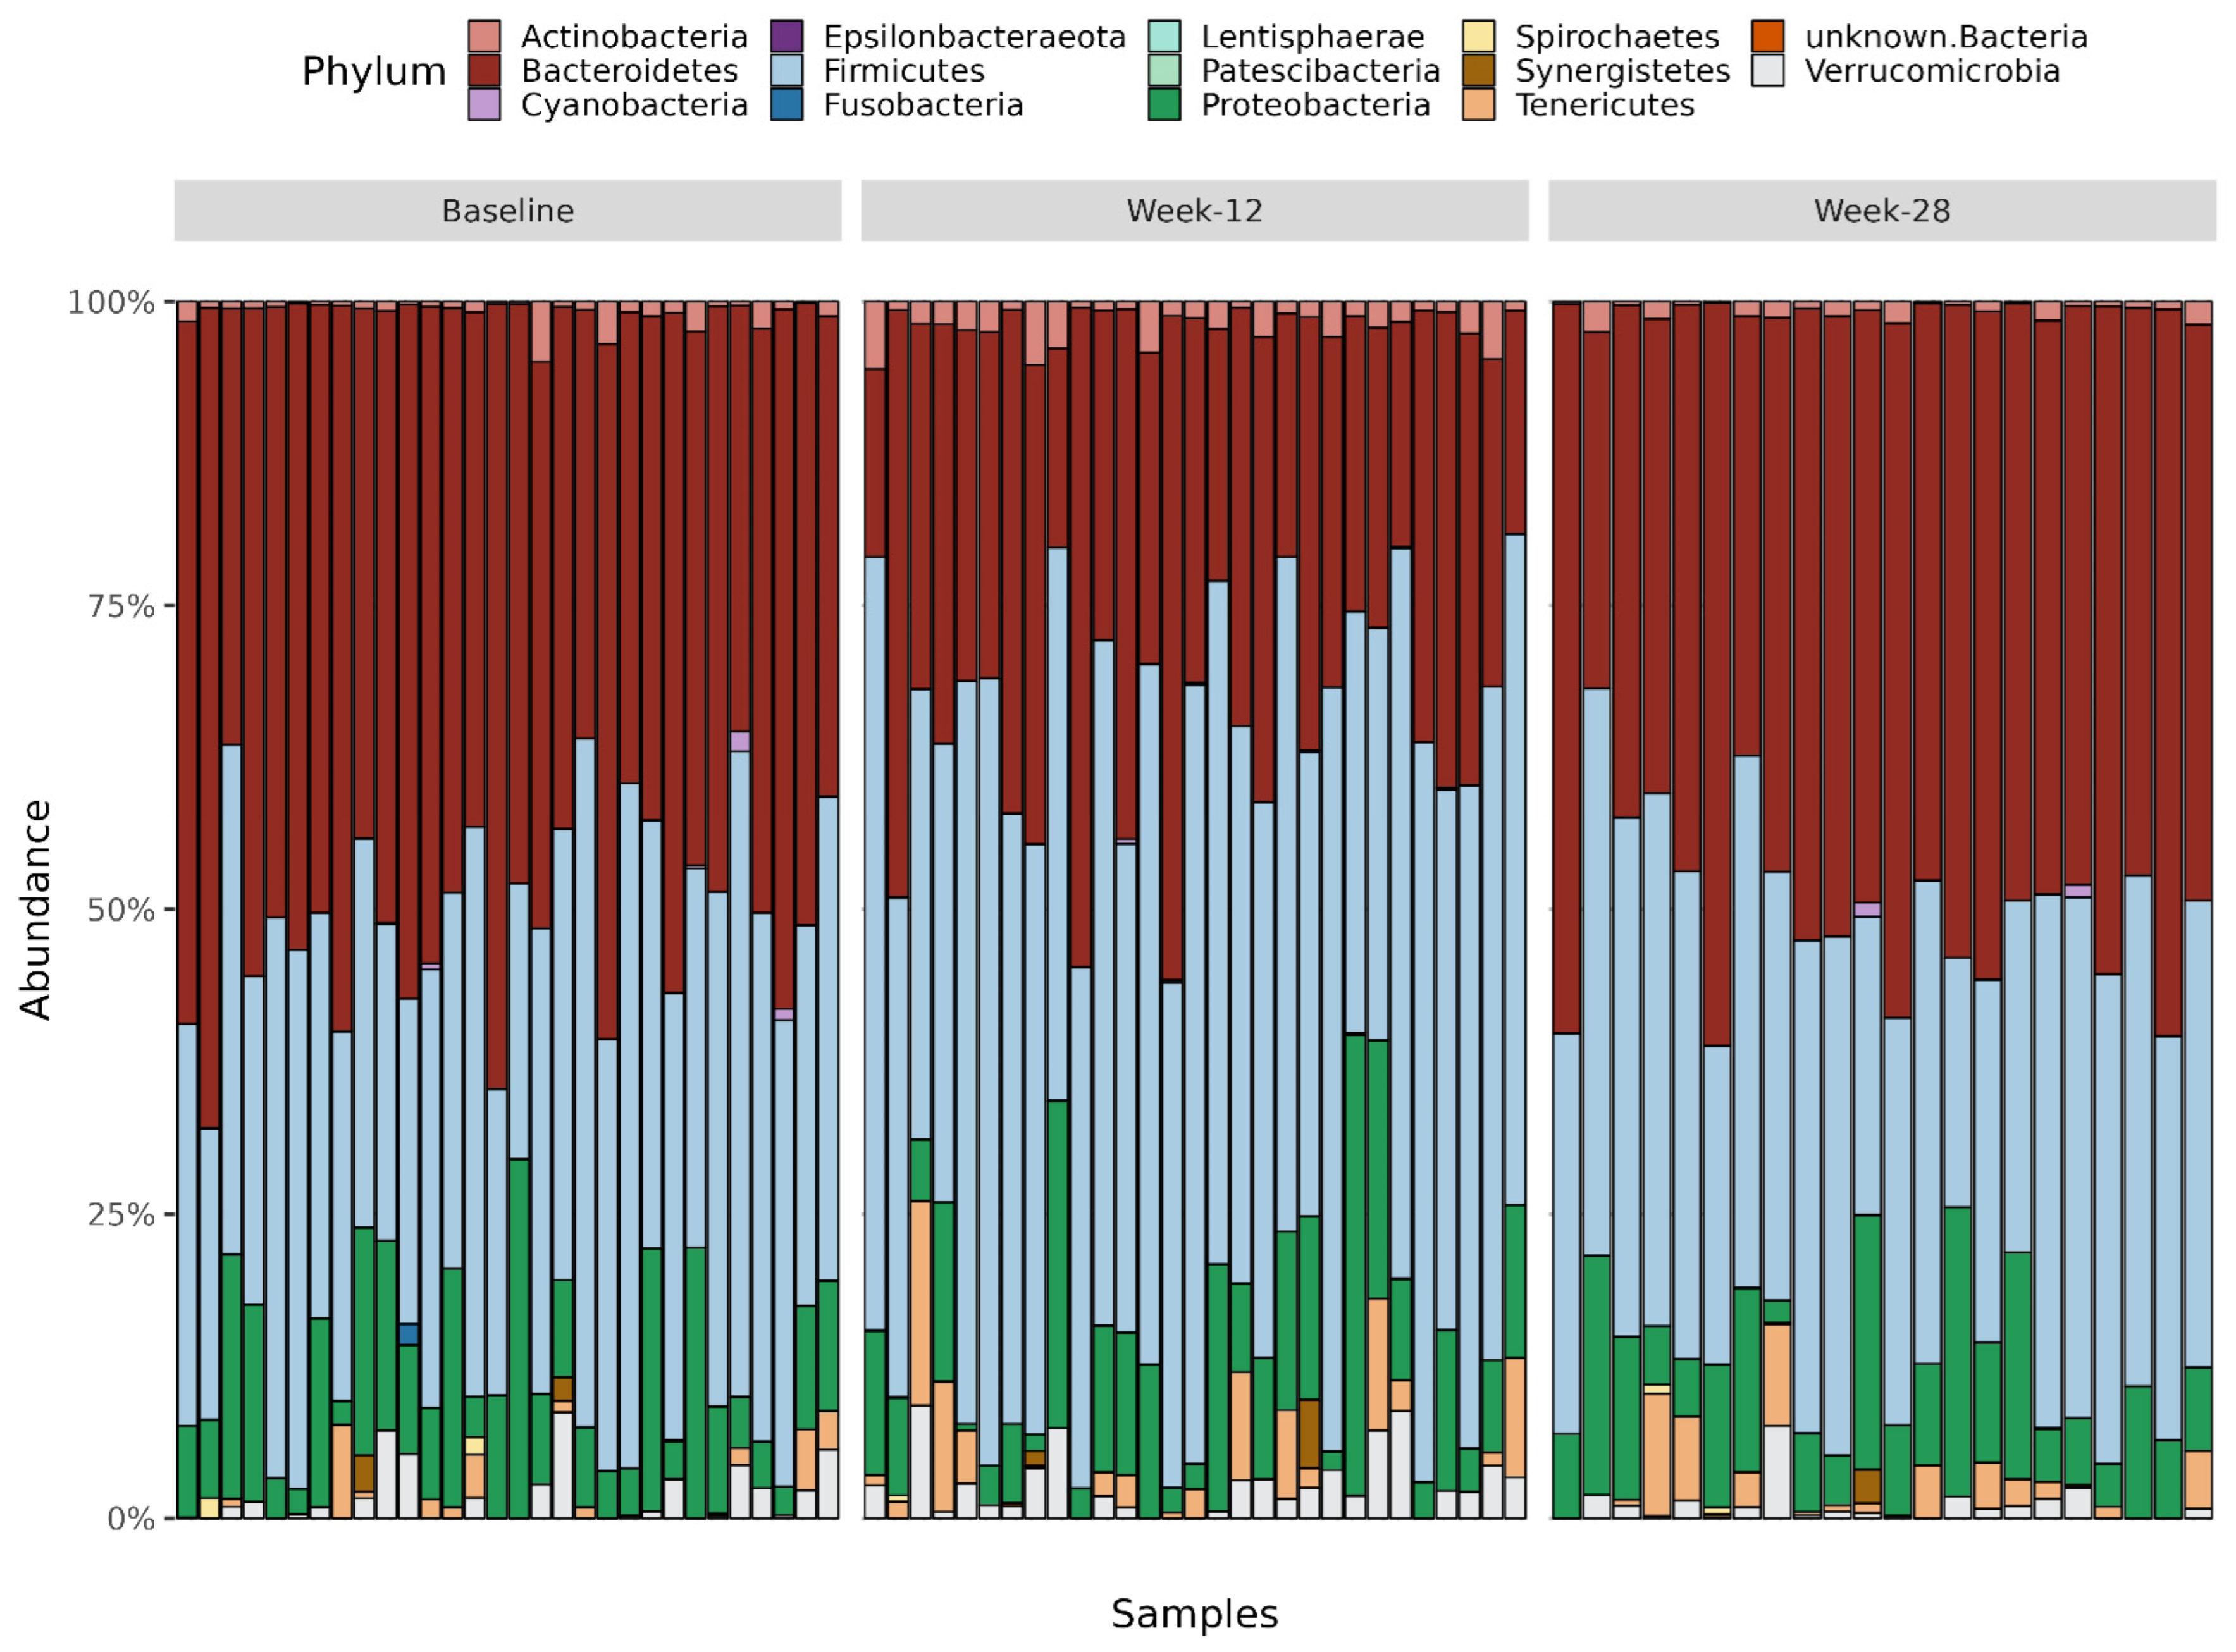
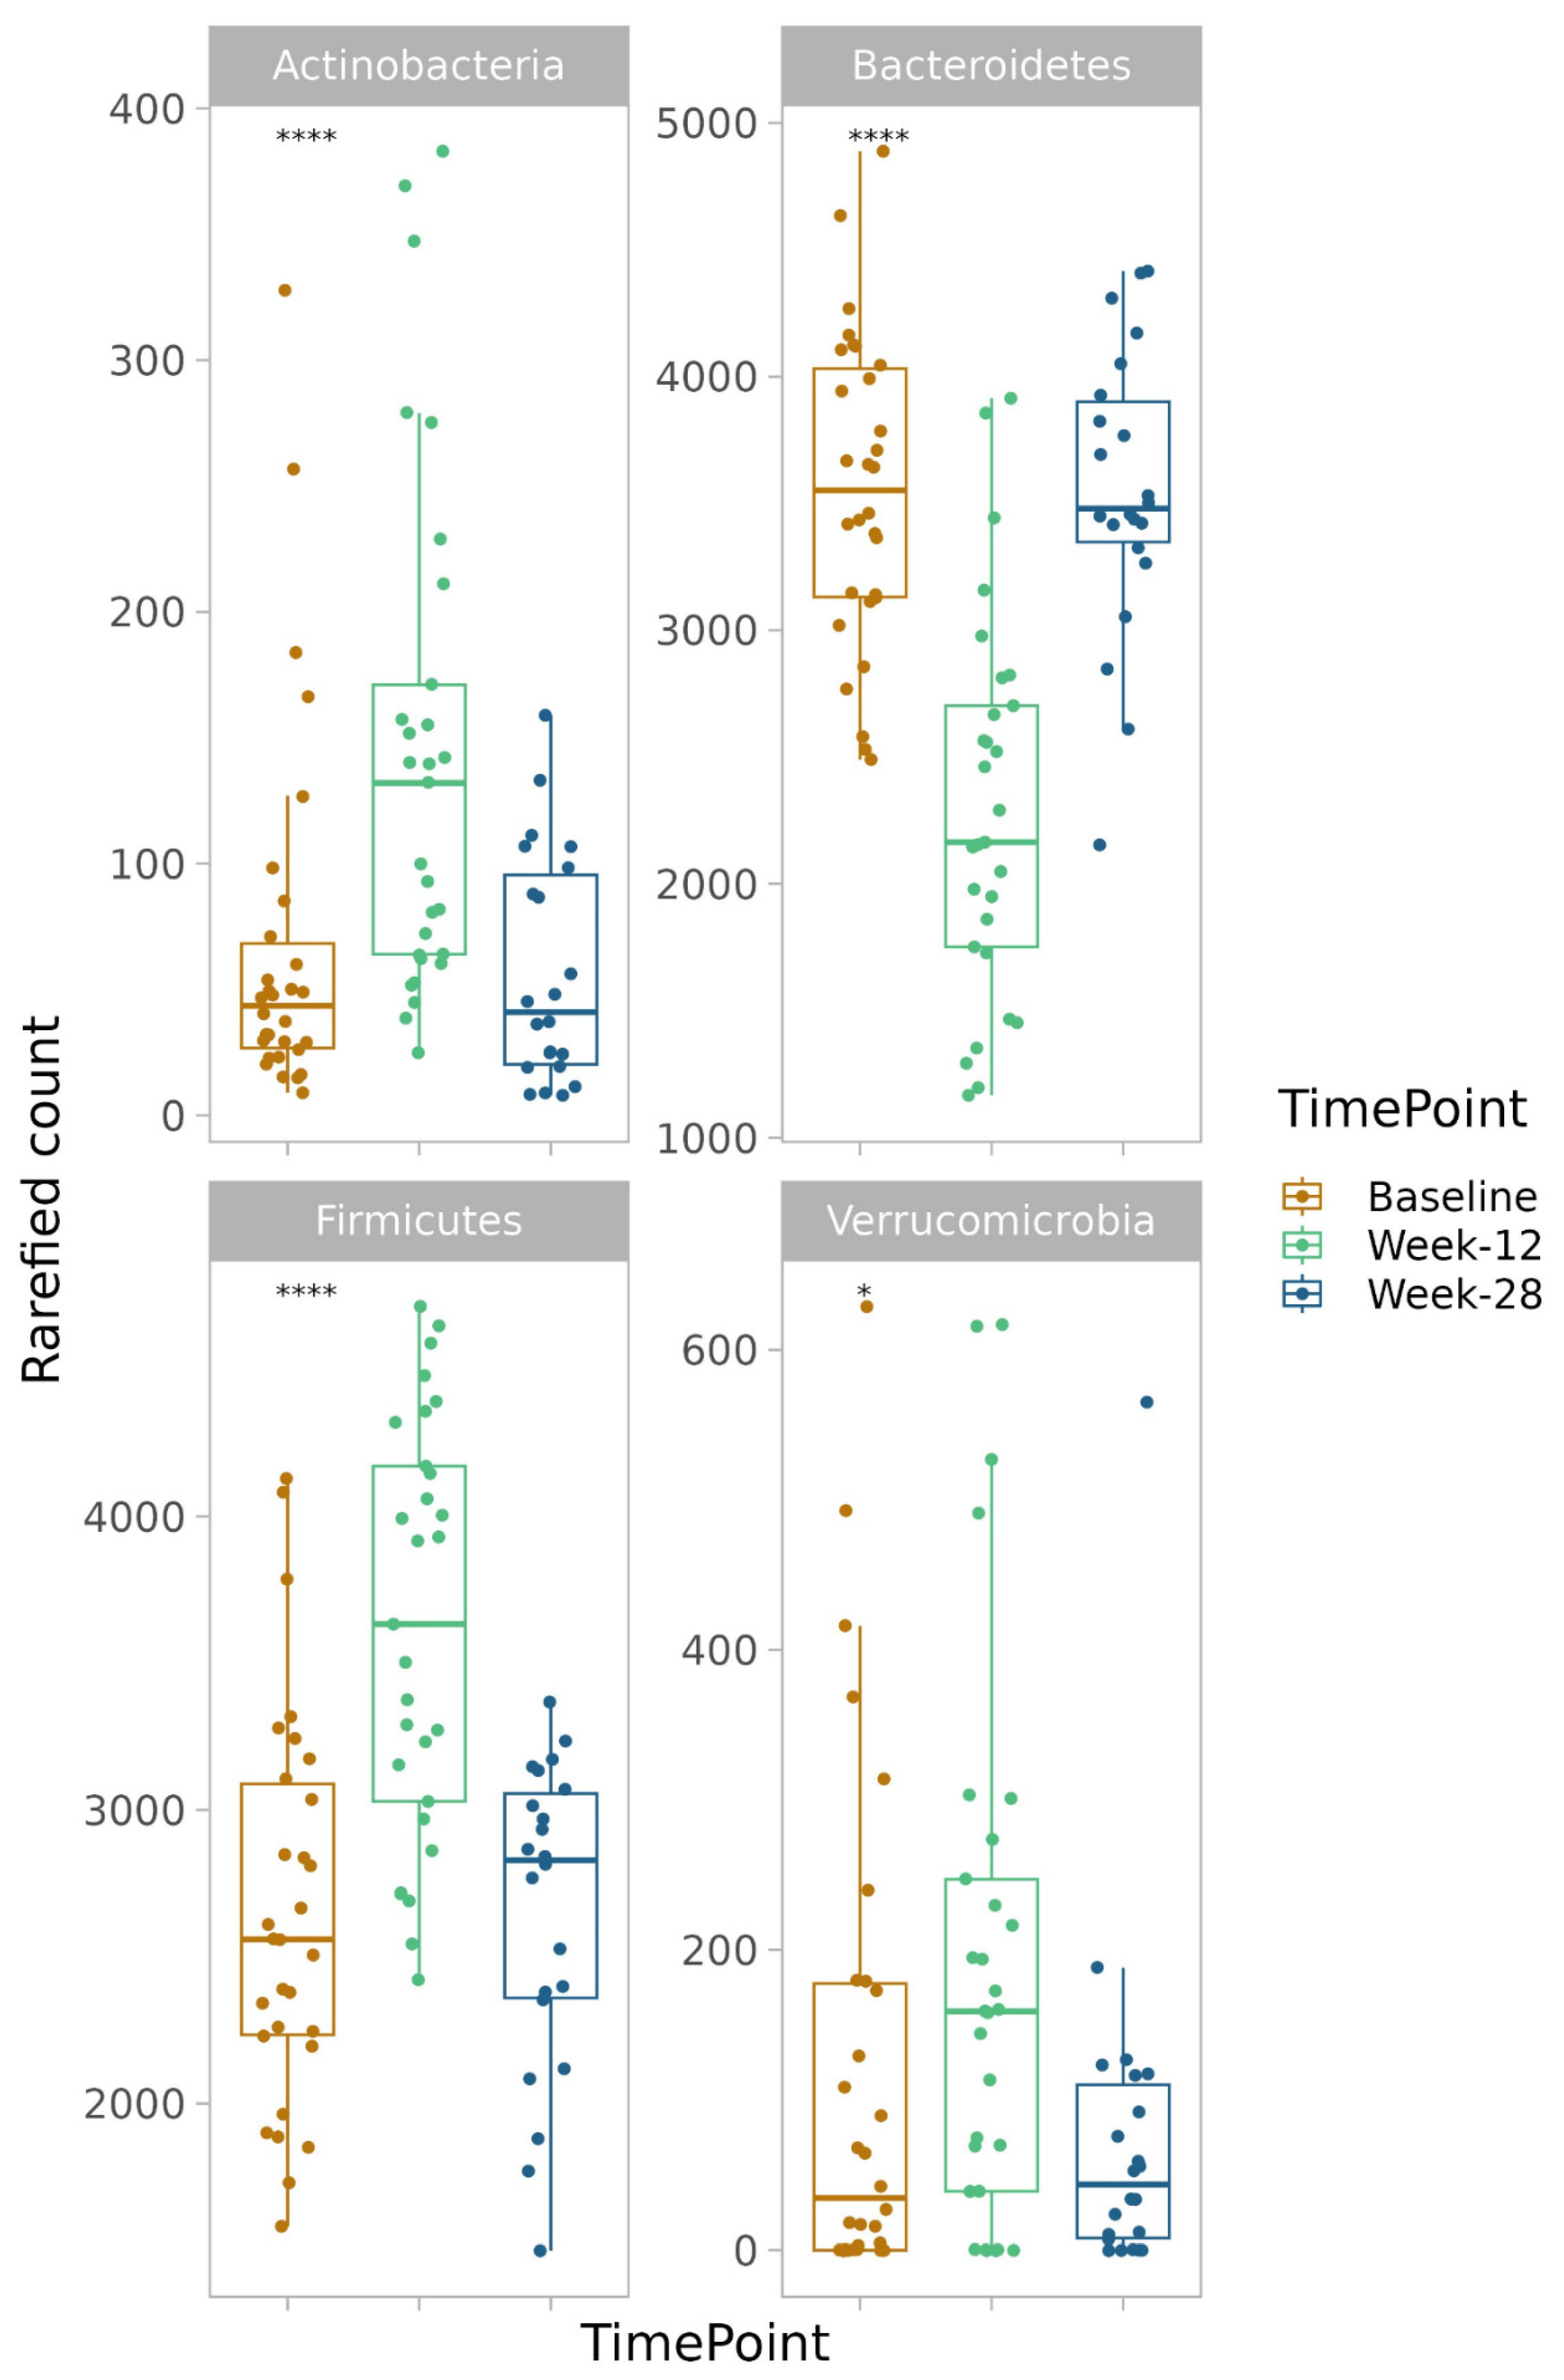
3.8.1. Phylum
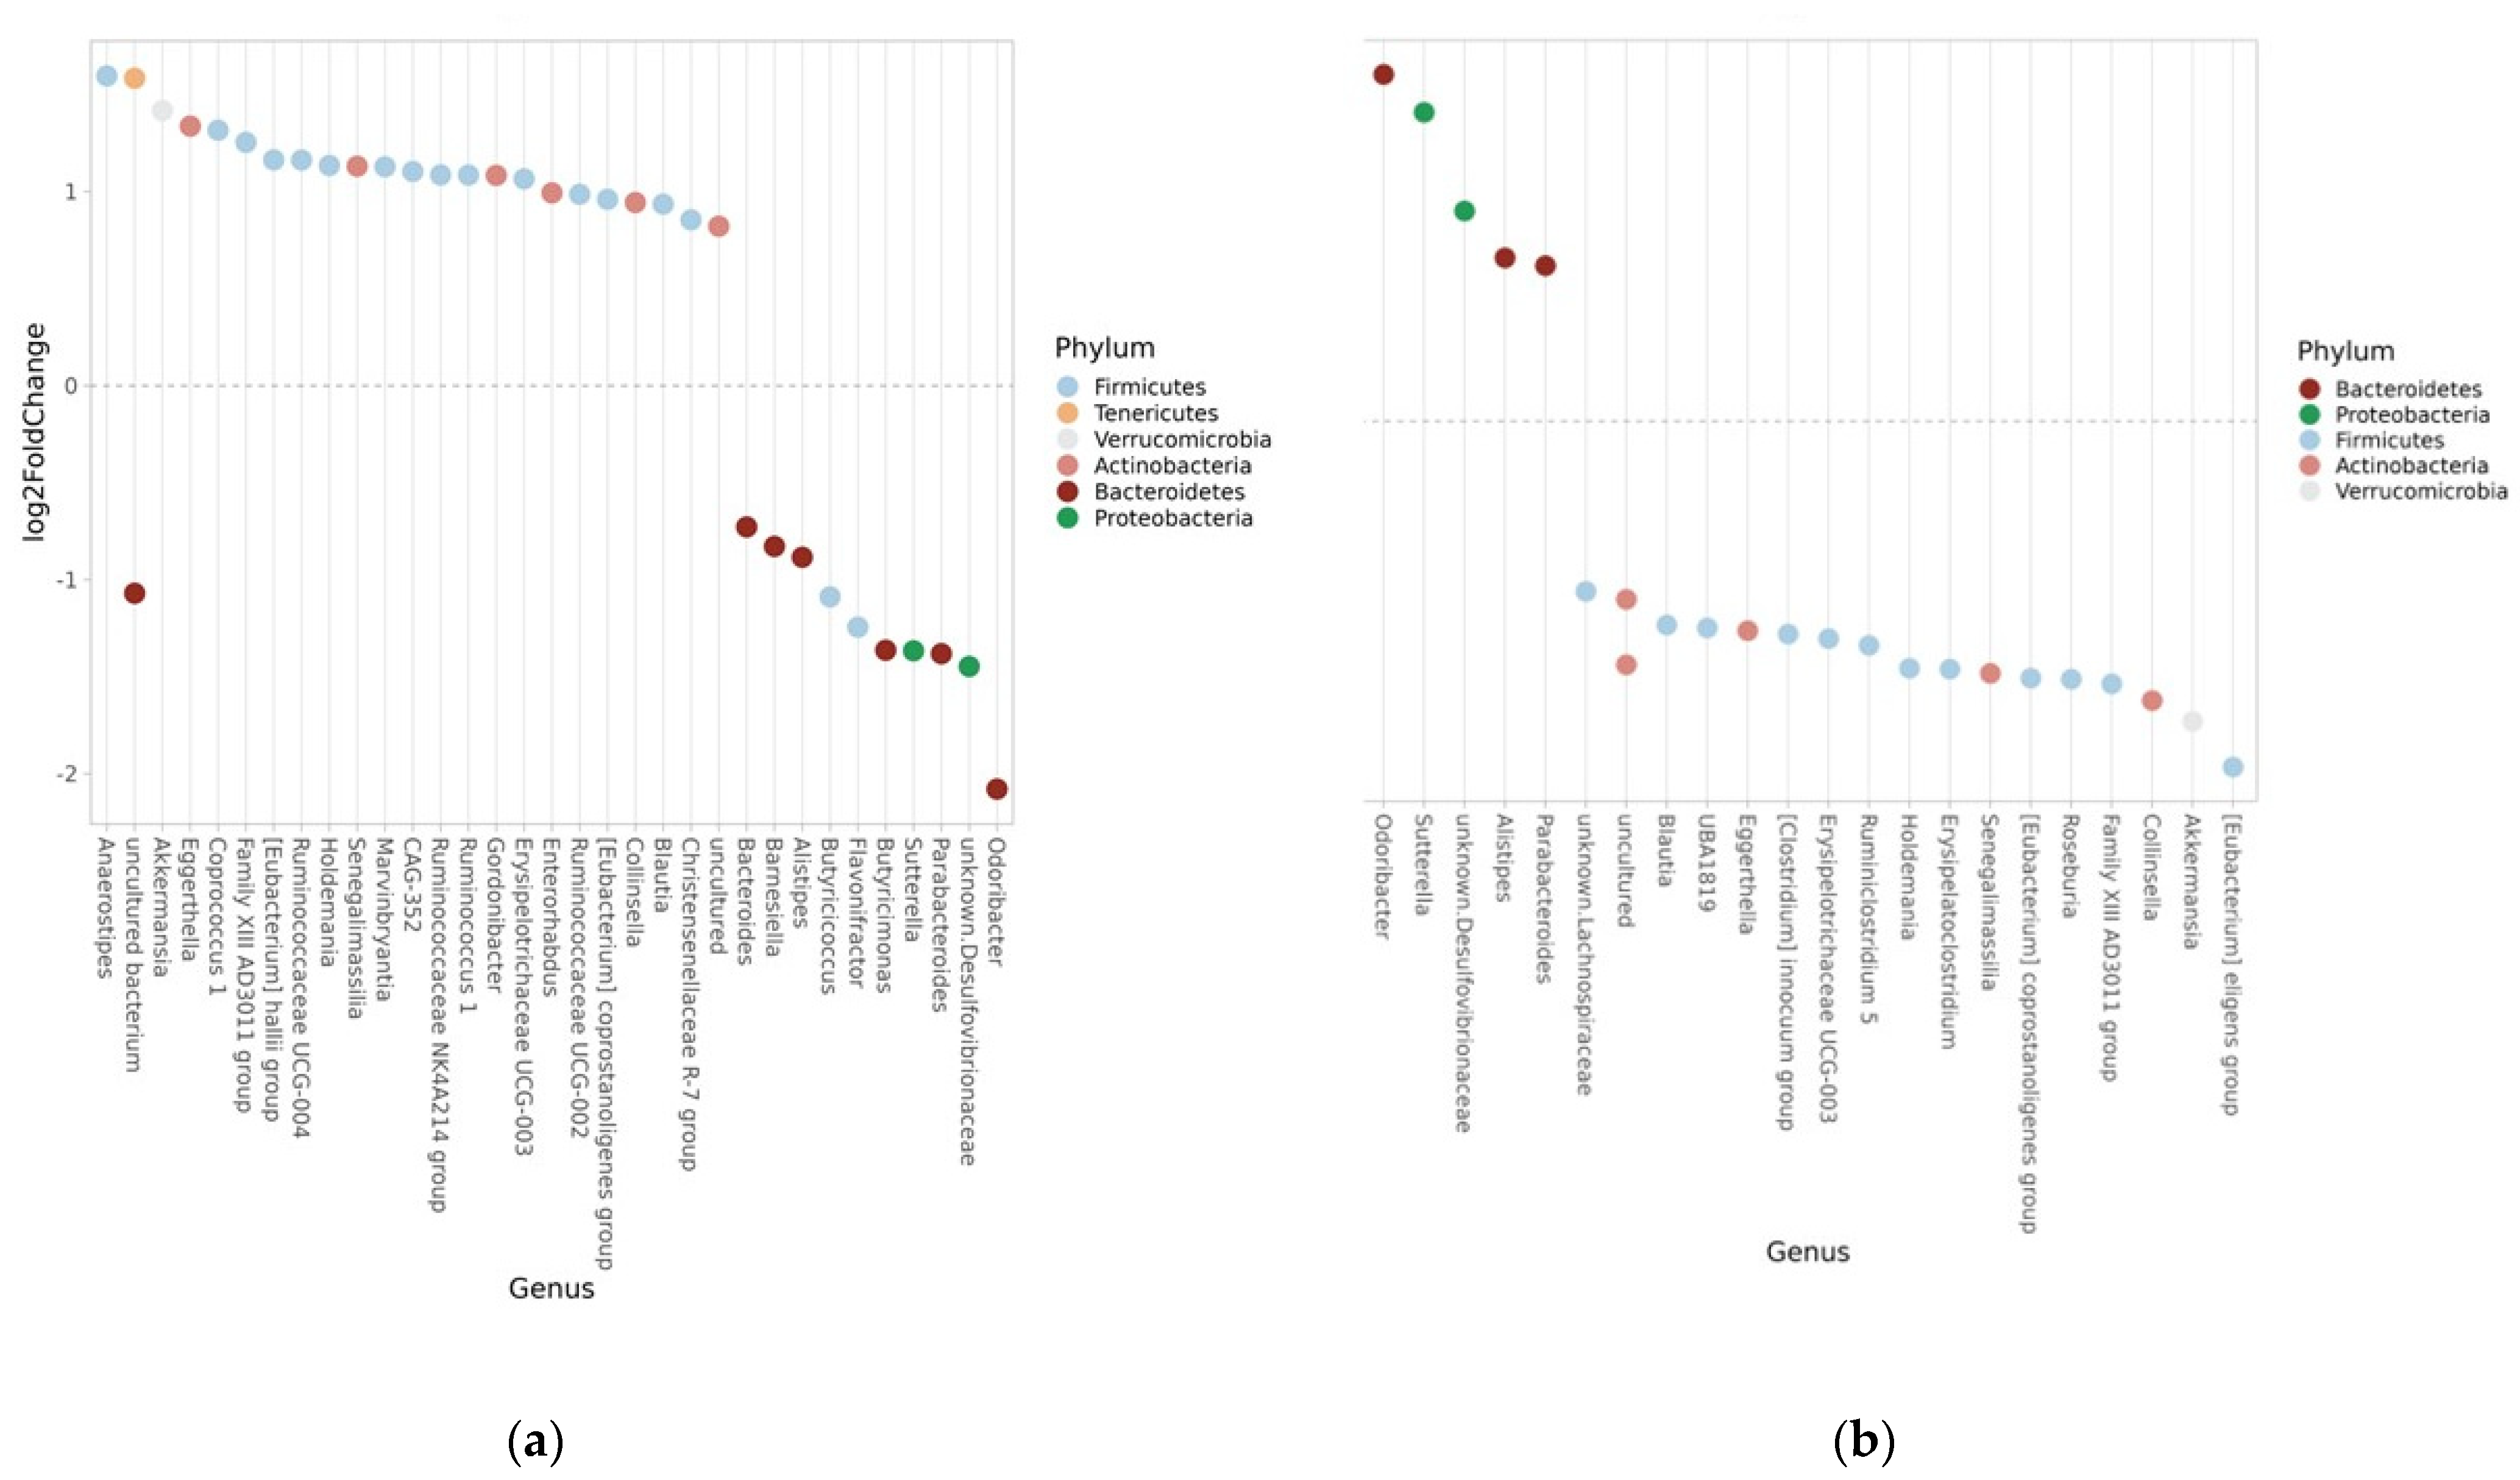
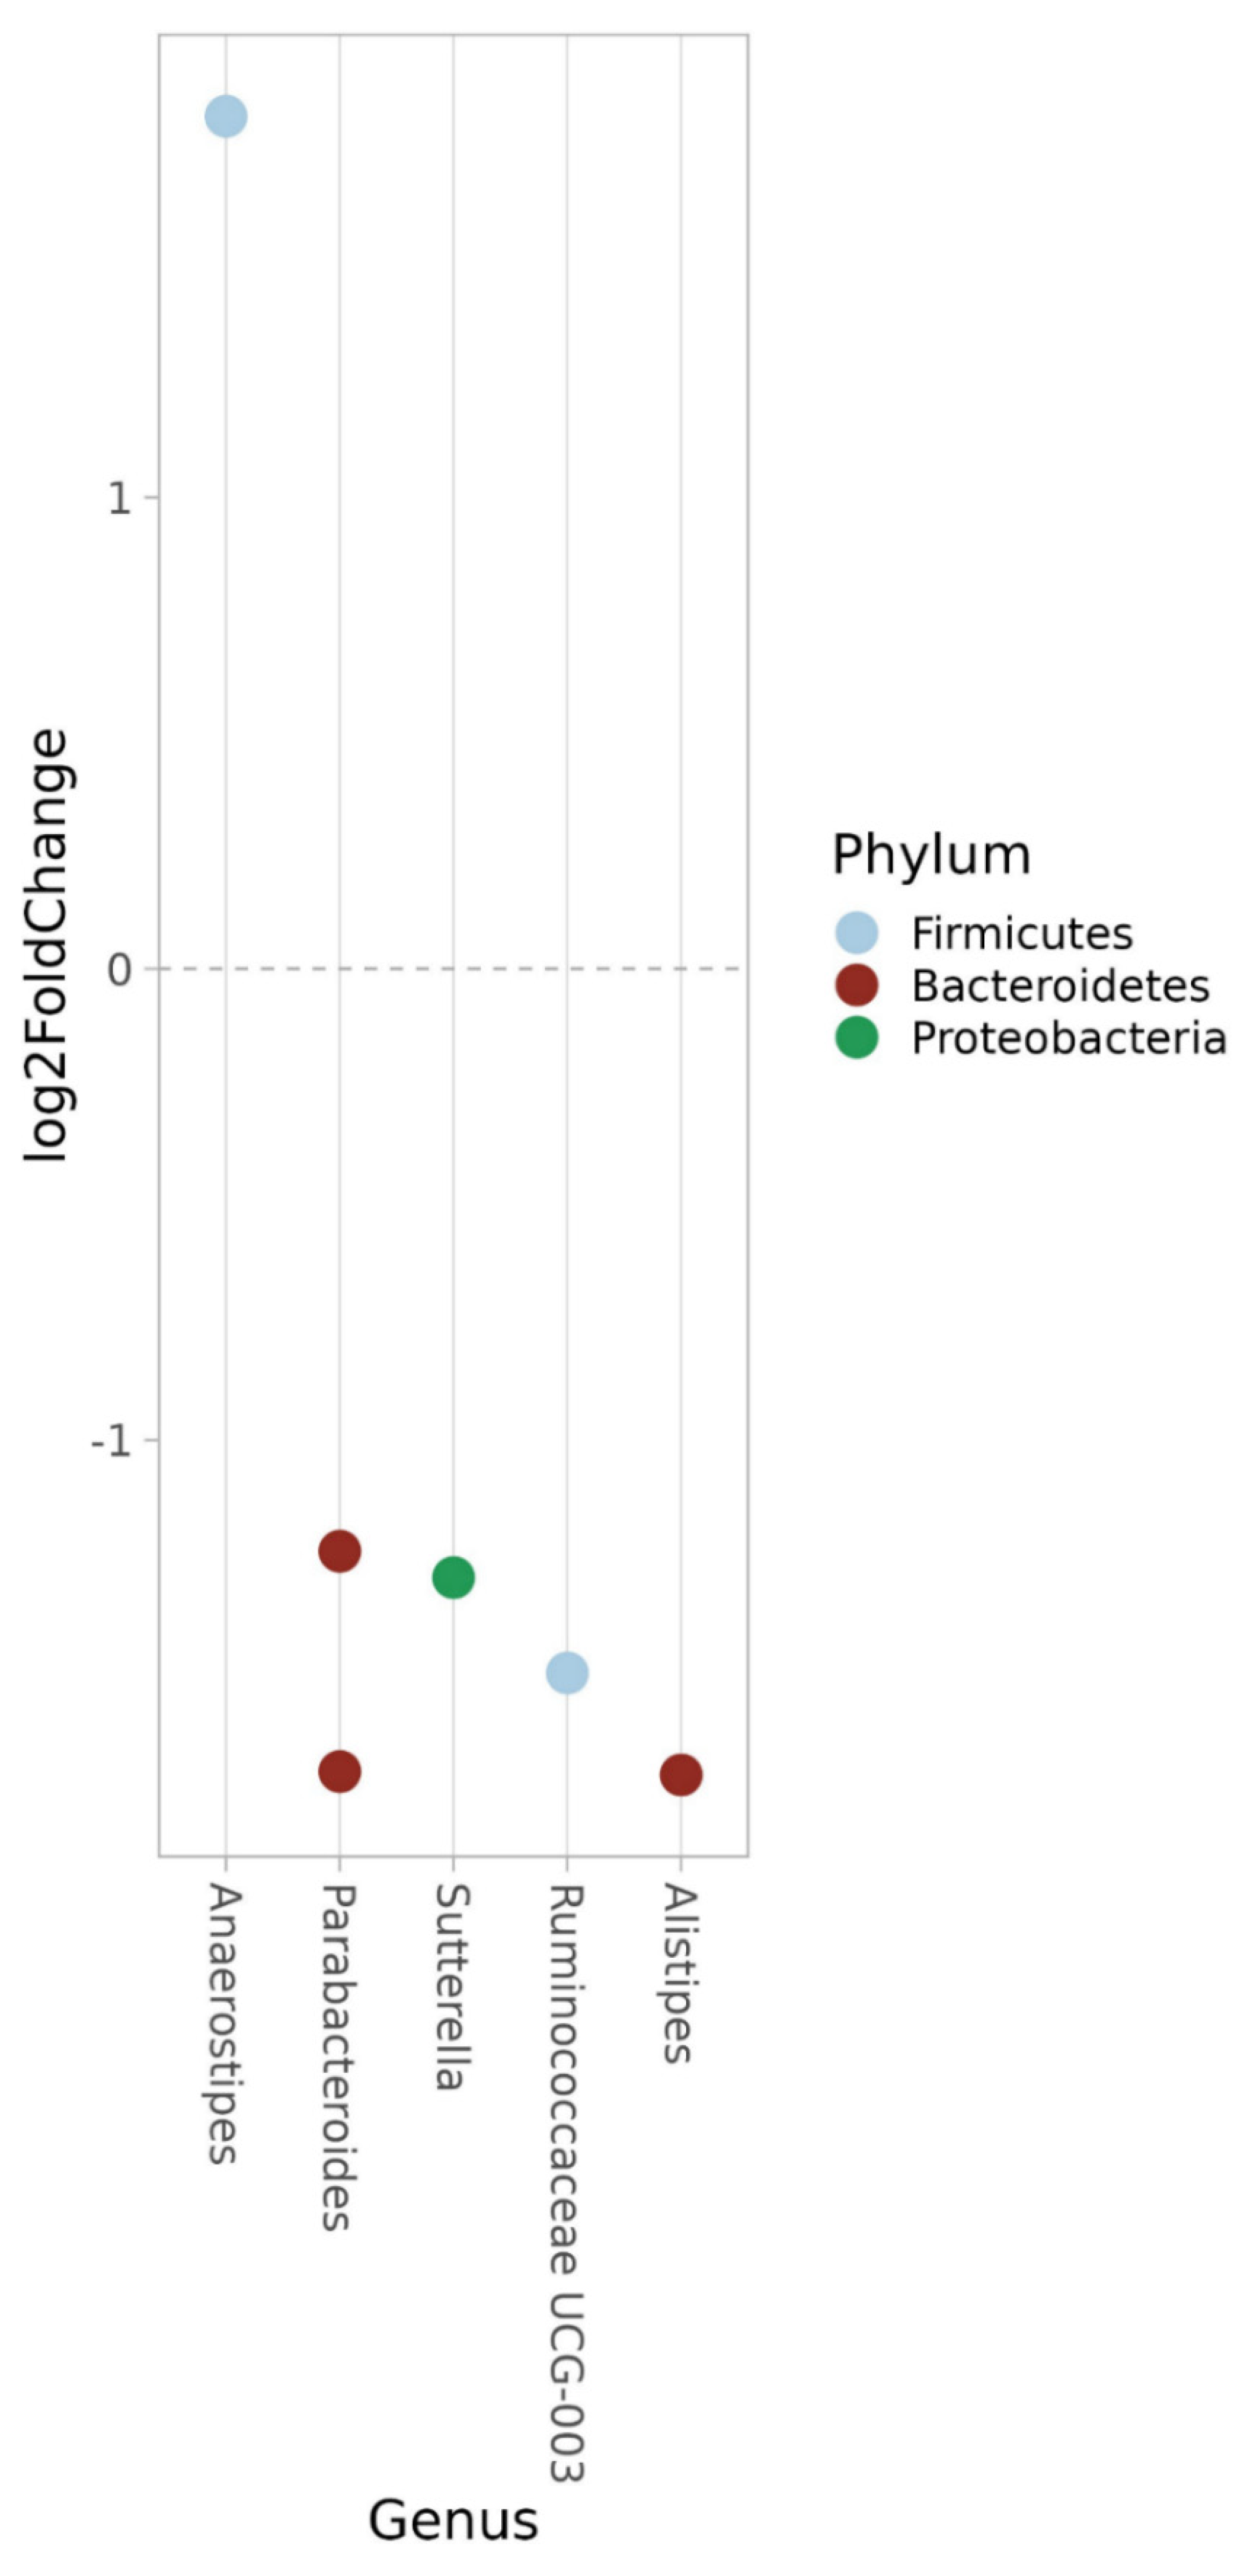
3.8.2. Genus
3.8.3. ASV
4. Discussion
5. Conclusions
Supplementary Materials
Author Contributions
Funding
Institutional Review Board Statement
Informed Consent Statement
Data Availability Statement
Acknowledgments
Conflicts of Interest
References
- Seuring, T.; Archangelidi, O.; Suhrcke, M. The Economic Costs of Type 2 Diabetes: A Global Systematic Review. Pharmacoeconomics 2015, 33, 811–831. [Google Scholar] [CrossRef] [PubMed]
- Wagenaar, C.A.; van de Put, M.; Bisschops, M.; Walrabenstein, W.; de Jonge, C.S.; Herrema, H.; van Schaardenburg, D. The effect of dietary interventions on chronic inflammatory diseases in relation to the microbiome: A systematic review. Nutrients 2021, 13, 3208. [Google Scholar] [CrossRef]
- Ojo, O.; Feng, Q.Q.; Ojo, O.O.; Wang, X.H. The role of dietary fibre in modulating gut microbiota dysbiosis in patients with type 2 diabetes: A systematic review and meta-analysis of randomized controlled trials. Nutrients 2020, 12, 3239. [Google Scholar] [CrossRef] [PubMed]
- Ojo, O.; Ojo, O.O.; Zand, N.; Wang, X. The effect of dietary fibre on gut microbiota, lipid profile, and inflammatory markers in patients with type 2 diabetes: A systematic review and meta-analysis of randomized controlled trials. Nutrients 2021, 13, 1805. [Google Scholar] [CrossRef] [PubMed]
- Jeffersson, A.; Adolphus, K. The effect of intact cereal grain fibers, including wheat bran on the gut microbiota composition of healthy adults: A systematic review. Front. Nutr. 2019, 6, 33. [Google Scholar] [CrossRef] [PubMed]
- Houghton, D.; Hardy, T.; Stewart, C.; Errington, L.; Day, C.P.; Trenell, M.I.; Avery, L. Systematic review assessing the effectiveness of dietary intervention on gut microbiota in adults with type 2 diabetes. Diabetologia 2018, 61, 1700–1711. [Google Scholar] [CrossRef]
- Akbari, V.; Hendijani, F. Effects of probiotic supplementation in patients with type 2 diabetes: Systematic review and meta-analysis. Nutr. Clin. Care 2016, 74, 774–784. [Google Scholar] [CrossRef]
- Vogt, M.; Puntschart, A.; Howald, H.; Mueller, B.; Mannhart, C.; Gfeller-Tuescher, L.; Mullis, P.; Hoppeler, H. Effects of dietary fat on muscle substrates, metabolism, and performance in athletes. Med. Sci. Sports Exerc. 2003, 35, 952–960. [Google Scholar] [CrossRef]
- Miles-Chan, J.L.; Dulloo, A.G.; Schutz, Y. Fasting substrate oxidation at rest assessed by indirect calorimetry: Is prior dietary macronutrient level and composition a confounder? Int. J. Obes. 2015, 39, 1114–1117. [Google Scholar] [CrossRef]
- Ochiai, M.; Matsuo, T. Effects of Short-Term Dietary Change from High-Carbohydrate Diet to High-Fat Diet on Storage, Utilization, and Fatty Acid Composition of Rat Muscle Triglyceride during Swimming Exercise. J. Clin. Biochem. Nutr. 2009, 44, 168–177. [Google Scholar] [CrossRef]
- Attaye, I.; Warbrunn, M.W.; Boot, A.N.A.F.; van der Volk, S.C.; Hutten, B.A.; Daams, J.G.; Herrema, H.; Nieuwdorp, M. A systematic review and meta-analysis of dietary interventions modulating gut microbiota and cardiometabolic disease—Striving for new standards in microbiome studies. Gastroenterology 2022, 162, 1911–1932. [Google Scholar] [CrossRef] [PubMed]
- Willcox, D.C.; Scapagnini, G.; Willcox, B.J. Healthy aging diets other than the Mediterranean: A focus on the Okinawan diet. Mech. Ageing Dev. 2014, 136–137, 148–162. [Google Scholar] [CrossRef] [PubMed]
- Darwiche, G.; Höglund, P.; Roth, B.; Larsson, E.; Sjöberg, T.; Wohlfart, B.; Stehen, S.; Ohlsson, B. An Okinawan-based Nordic diet improves anthropometry, metabolic control, and quality of life in Scandinavian patients with type 2 diabetes: A pilot trial. Food Nutr. Res. 2016, 60, 32594. [Google Scholar] [CrossRef]
- Nordic Nutrition Recommendations. 2012. Available online: http://www.norden.org/en/theme/nordic-nutrition-recommendation/nordic-nutrition-recommendations-2012 (accessed on 15 January 2023).
- Ohlsson, B. An Okinawan-based Nordic diet improves glucose and lipid metabolism in health and type 2 diabetes, in alignment with changes in the endocrine profile, whereas zonulin levels are elevated. Exp. Ther. Med. 2019, 17, 2883–2893. [Google Scholar] [CrossRef] [PubMed]
- Davies, M.J.; Aroda, V.R.; Collins, B.S.; Gabbay, R.A.; Green, J.; Maruthur, N.M.; Rosas, S.E.; Del Prato, S.; Mathieu, C.; Mongrone, G.; et al. Management of hyperglycaemia in type 2 diabetes, 2022. A consensus report by the American Diabetes Association (ADA) and the European Association for the Study of Diabetes (EASD). Diabetologia 2022, 65, 1925–1966. [Google Scholar] [CrossRef] [PubMed]
- Ohlsson, B.; Höglund, P.; Roth, B.; Darwiche, G. Modification of a traditional breakfast leads to increased satiety along with attenuated plasma increments of glucose, C-peptide, insulin and glucose-dependent insulinotropic polypeptide in humans. Nutr. Res. 2016, 36, 359–368. [Google Scholar] [CrossRef]
- Available online: https://www.sls.se/globalassets/sls/halsa (accessed on 9 February 2023).
- Bengtsson, M.; Ohlsson, B.; Ulander, K. Development and psychometric testing of the Visual Analogue Scale for Irritable Bowel Syndrome (VAS-IBS). BMC Gastroenterol. 2007, 7, 16. [Google Scholar] [CrossRef]
- Available online: http://www.analysportalen-labmedicin.skane.se/ (accessed on 25 April 2023).
- Lindahl, A.; Forshed, J.; Nordstrom, A. Overlap in serum metabolic profiles between non-related diseases: Implications for LC-MS metabolomics biomarker discovery. Biochem. Biophys. Res. Commun. 2016, 478, 1472–1477. [Google Scholar] [CrossRef]
- Diab, J.; Hansen, T.; Goll, R.; Stenlund, H.; Jensen, E.; Moritz, T.; Florholmen, J.; Forsdahl, G. Mucosal Metabolomic Profiling and Pathway Analysis Reveal the Metabolic Signature of Ulcerative Colitis. Metabolites 2019, 9, 291. [Google Scholar] [CrossRef]
- Stenlund, H.; Nilholm, C.; Chorell, E.; Roth, B.; D´Amato, M.; Ohlsson, B. Metabolic Profiling of Plasma in Patients with Irritable Bowel Syndrome after a 4-Week Starch- and Sucrose-Reduced Diet. Metabolites 2021, 11, 440. [Google Scholar] [CrossRef]
- Diab, J.; Hansen, T.; Goll, R.; Stenlund, H.; Ahnlund, M.; Jensen, E.; Moritz, T.; Florholmen, J.; Forsdahl, G. Lipidomics in Ulcerative Colitis Reveal Alteration in Mucosal Lipid Composition Associated with the Disease State. Inflamm. Bowel Dis. 2019, 25, 1780–1787. [Google Scholar] [CrossRef] [PubMed]
- Caporaso, J.G.; Lauber, C.L.; Walters, W.A.; Berg-Lyons, D.; Huntley, J.; Fierer, N.; Owens, S.M.; Betley, J.; Fraser, L.; Bauer, M.; et al. Ultra-high-throughput microbial community analysis on the Illumina HiSeq and MiSeq platforms. ISME J. 2012, 6, 1621–1624. [Google Scholar] [CrossRef] [PubMed]
- Martin, M. Cutadapt removes adapter sequences from high-throughput sequencing reads. EMBnet. J. 2011, 17, 10. [Google Scholar] [CrossRef]
- Wing, R.R.; Lang, W.; Wadden, T.A.; Safford, M.; Knowler, W.C.; Bertoni, A.G.; Hill, J.O.; Brancati, F.L.; Peters, A.; Wagenknecht, L. Look AHEAD Research Group. Benefits of modest weight loss in improving cardiovascular risk factors in overweight and obese individuals with type 2 diabetes. Diabetes Care 2011, 34, 1481–1486. [Google Scholar] [CrossRef] [PubMed]
- Ritchie, M.E.; Phipson, B.; Wu, D.; Hu, Y.; Lae, C.W.; Shi, W.; Smyth, G.K. limma powers differential expression analyses for RNA-sequencing and microarray studies. Nucleic Acids Res. 2015, 43, e47. [Google Scholar] [CrossRef] [PubMed]
- Bolyen, E.; Rideout, J.R.; Dillon, M.R.; Bokulich, N.A.; Abnet, C.C.; Al-Ghalith, G.A.; Alexander, H.; Alm, E.J.; Arumugam, M.; Asnicar, F.; et al. Reproducible, interactive, scalable and extensible microbiome data science using QIIME 2. Nat. Biotechnol. 2019, 37, 852–857. [Google Scholar] [CrossRef]
- Callahan, B.J.; Sankaran, K.; Fukuyama, J.A.; McMurdie, P.J.; Holmes, S.P. Bioconductor Workflow for Microbiome Data Analysis: From raw reads to community analyses. F1000Research 2016, 5, 1492. [Google Scholar] [CrossRef]
- Rognes, T.; Flouri, T.; Nichols, B.; Quince, C.; Mahé, F. VSEARCH: A versatile open source tool for metagenomics. PeerJ 2016, 4, e2584. [Google Scholar] [CrossRef]
- Quast, C.; Pruesse, E.; Yilmaz, P.; Gerken, J.; Schweer, T.; Yrsa, P.; Peplies, J.; Glöckner, F.O. The SILVA ribosomal RNA gene database project: Improved data processing and web-based tools. Nucleic Acids Res. 2013, 41, D590–D596. [Google Scholar] [CrossRef]
- McMurdie, P.J.; Holmes, S. phyloseq: An R package for reproducible interactive analysis and graphics of microbiome census data. PLoS ONE 2013, 8, e61217. [Google Scholar] [CrossRef]
- Oksanen, F.J.; Guillaume Blanchet, F.; Friendly, M.; Kindt, R.; Legendre, P.; McGlin, D.; Minchin, P.R.; O´Hara, R.B.; Simpson, G.L.; Solymos, P.; et al. Vegan: Community Ecology Package. R Package Version 2.4-3. 2017. Available online: https://CRAN.R-project.org/package=vegan (accessed on 31 May 2023).
- Love, M.I.; Huber, W.; Anders, S. Moderated estimation of fold change and dispersion for RNA-seq data with DESeq2. Genome Biol. 2014, 15, 550. [Google Scholar] [CrossRef] [PubMed]
- Lozupone, C.; Lladser, M.E.; Knights, D.; Stombaugh, J.; Knight, R. UniFrac: An effective distance metric for microbial community comparison. ISME J. 2011, 5, 169–172. [Google Scholar] [CrossRef] [PubMed]
- World Health Organization. Global Database on Body Mass Index. 2015. Available online: http://apps.who.int/bmi/index.jsp?introPage=intro_3.html (accessed on 26 April 2023).
- Marques, A.M.; Linhares, B.S.; Novaes, R.D.; Freitas, M.B.; Sarandy, M.M.; Gonçalves, R.V. Effects of the amount and type of carbohydrates used in type 2 diabetes diets in animal models: A systemic review. PLoS ONE 2020, 15, e0233364. [Google Scholar] [CrossRef]
- Qiao, B.; Liu, J.; Xiao, N.; Tan, Z.; Peng, M. Effects of sweeteners on host physiology by intestinal mucosal microbiota: Example-addition sweeteners in Qiweibaizhu Powder on intestinal mucosal microbiota of mice with antibiotic-associated diarrhea. Front. Nutr. 2022, 9, 1038364. [Google Scholar] [CrossRef] [PubMed]
- Huang, Y.; Chen, Z.; Chen, B.; Li, J.; Yuan, X.; Li, J.; Wang, W.; Dai, T.; Chen, H.; Wang, Y.; et al. Dietary sugar consumption and health: Umbrella review. Br. Med. J. 2023, 381, e071609. [Google Scholar] [CrossRef] [PubMed]
- Ohlsson, B.; Darwiche, G.; Roth, B.; Höglund, P. Alignment of endocrine, anthropometric and metabolic parameters in type 2 diabetes after intervention with an Okinawan-based Nordic diet. Food Nutr. Res. 2018, 62. [Google Scholar] [CrossRef]
- Dungan, K.M. 1,5-anhydroglucitol (GlycoMark) as a marker of short-term glycemic control and glycemic excursions. Expert Rev. Mol. Diagn. 2008, 8, 9–19. [Google Scholar] [CrossRef]
- Mullur, R.; Liu, Y.Y.; Brent, G.A. Thyroid hormone regulation of metabolism. Physiol. Rev. 2014, 94, 355–382. [Google Scholar] [CrossRef]
- Larner, J.; Brautigan, D.L.; Thorner, M.O. D-chiro-inositol glycans in insulin signaling and insulin resistance. Mol. Med. 2010, 16, 543–552. [Google Scholar] [CrossRef]
- Tabrizi, R.; Ostadmohammadi, V.; Lankarani, K.B.; Peymani, P.; Akbari, M.; Kolahdooz, F.; Asemi, Z. The effects of inositol supplementation on lipid profiles among patients with metabolic diseases: A systematic review and meta-analysis of randomized controlled trials. Lipids Health Dis. 2018, 17, 123. [Google Scholar] [CrossRef]
- Tan, S.T.; Ramesh, T.; Toh, X.R.; Nguyen, L.N. Emerging roles of lysophospholipids in health and disease. Prog. Lipid Res. 2020, 80, 101068. [Google Scholar] [CrossRef] [PubMed]
- Nallathambi, S.A.; Goorin, A.M.; Adibi, S.A. Hepatic and skeletal muscle transport of cycloleucine during starvation. Am. J. Physiol. 1972, 223, 13–19. [Google Scholar] [CrossRef] [PubMed]
- Dziurkowska, E.; Wesolowski, M. Cortisol as a Biomarker of Mental Disorder Severity. J. Clin. Med. 2021, 10, 5204. [Google Scholar] [CrossRef]
- Kamba, A.; Daimon, M.; Murakami, H.; Otaka, H.; Matsuki, K.; Sato, E.; Tanabe, J.; Takayasu, S.; Matsuhashi, Y.; Yanagimachi, M.; et al. Association between Higher Serum Cortisol Levels and Decreased Insulin Secretion in a General Population. PLoS ONE 2016, 11, e0166077. [Google Scholar] [CrossRef]
- Javelle, F.; Lampit, A.; Bloch, W.; Häussermann, P.; Johnson, S.L.; Zimmer, P. Effects of 5-hydroxytryptophan on distinct types of depression: A systematic review and meta-analysis. Nutr. Rev. 2020, 78, 77–88. [Google Scholar] [CrossRef]
- Koch, V.; Gruenewald, L.D.; Gruber-Rouh, T.; Eichler, K.; Leistner, D.M.; Mahmoudi, S.; Booz, C.; Bernatz, S.; D’Angelo, T.; Albrecht, M.H.; et al. Homoarginine in the cardiovascular system: Pathophysiology and recent developments. Fundam. Clin. Pharmacol. 2023, 37, 519–529. [Google Scholar] [CrossRef] [PubMed]
- Menegaz, D.; Walker Hagan, D.; Almaca, J.; Cianciaruso, C.; Rodriguez-Diaz, R.; Molina, J.; Dolan, R.M.; Becker, M.W.; Schwalie, P.C.; Molina, J.; et al. Mechanism and effects of pulsatile GABA secretion from cytosolic pools in the human beta cell. Nat. Metab. 2019, 1, 1110–1126. [Google Scholar] [CrossRef]
- Li, C.; Hsieh, M.C.; Chang, S.J. Metabolic syndrome, diabetes, and hyperuricemia. Curr. Opin. Rheumatol. 2013, 25, 210–216. [Google Scholar] [CrossRef]
- Lebwohl, B.; Sanders, D.S.; Green, P.H.R. Coeliac disease. Lancet 2018, 391, 70–81. [Google Scholar] [CrossRef]
- Letchumanan, G.; Abdullah, N.; Marlini, M.; Baharom, N.; Lawley, B.; Omar, M.R.; Mohideen, F.B.S.; Addnan, F.H.; Fariha, M.M.N.; Ismail, Z.; et al. Gut Microbiota Composition in Prediabetes and Newly Diagnosed Type 2 Diabetes: A Systematic Review of Observational Studies. Front. Cell Infect. Microbiol. 2022, 12, 943427. [Google Scholar] [CrossRef]
- Verhoog, S.; Taneri, P.E.; Roa Diaz, Z.; Marques-Vidal, P.; Troup, J.P.; Bally, L.; Franco, O.H.; Glisic, M.; Muka, T. Dietary factors and modulaiton of bacteria strains of Akkermansia muciniphila and Faecalibacterium prausnitzi: A systematic review. Nutrients 2019, 11, 1565. [Google Scholar] [CrossRef]
- Parker, B.J.; Wearsch, P.A.; Veloo, A.C.; Rodriguez-Palacios, A. The genus Alistipes: Gut bacteria with emerging implications to inflammation, cancer, and mental health. Front. Immunol. 2020, 11, 906. [Google Scholar] [CrossRef] [PubMed]
- Sánchez-Rosales, A.I.; Guadarrama-López, A.L.; Gaona-Valle, L.S.; Martínez-Carrillo, B.E.; Valdés-Ramos, R. The Effect of Dietary Patterns on Inflammatory Biomarkers in Adults with Type 2 Diabetes Mellitus: A Systematic Review and Meta-Analysis of Randomized Controlled Trials. Nutrients 2022, 14, 4577. [Google Scholar] [CrossRef]
- Huang, F.; Nilholm, C.; Roth, B.; Linninge, C.; Höglund, P.; Nyman, M.; Ohlsson, B. Anthropometric and metabolic improvements in human type 2 diabetes after introduction of an Okinawan-based Nordic diet are not associated with changes in microbial diversity or SCFA concentrations. Int. J. Food Sci. Nutr. 2018, 69, 729–740. [Google Scholar] [CrossRef]
- Jarret, A.; Jackson, R.; Duizer, C.; Zhao, J.; Rone, J.M.; Bielecki, P.; Sefik, E.; Roulis, M.; Rice, T.; Sivanathan, K.N.; et al. Enteric Nervous System-Derived IL-18 Orchestrates Mucosal Barrier Immunity. Cell 2020, 180, 813–814. [Google Scholar] [CrossRef]
- Nilholm, C.; Roth, B.; Höglund, P.; Blennow, K.; Englund, E.; Hansson, O.; Zetterberg, H.; Ohlsson, B. Dietary intervention with an Okinawan-based Nordic diet in type 2 diabetes renders decreased interleukin-18 concentrations and increased neurofilament light concentrations in plasma. Nutr. Res. 2018, 60, 13–25. [Google Scholar] [CrossRef] [PubMed]
- Nilholm, C.; Manoharan, L.; Roth, B.; D´Amato, M.; Ohlsson, B. A starch- and sucrose-reduced dietary intervention in IBS patients produced a shift in gut microbiota composition along with changes in phylum, genus, and ASV abundances, without affecting the micro-RNA levels. United Eur. Gastroenterol. J. 2022, 10, 363–375. [Google Scholar] [CrossRef] [PubMed]


| Gender (F/M) | 17/13 | Antihypertensive Medication (%) | 63 |
| Age (years) | 57.5 ± 8.2 | Lipid-lowering medication (%) | 47 |
| BMI (kg/m2) | 29.9 ± 4.1 | IBS (%) | 13 |
| Education (%) | Diabetes duration (years) | 10.4 ± 7.6 | |
| Primary school | 16 | ||
| High school | 57 | Diabetes management (%) | |
| University | 27 | Diet alone | 7 |
| Occupation (%) | Metformin | 40 | |
| Employed | 67 | Sulfonylurea | 3 |
| Retired | 17 | Sulfonylurea and metformin | 7 |
| Sick leave | 13 | DPP-4 inhibitor and metformin | 3 |
| Unemployed | 3 | Metformin and insulin | 27 |
| Smokers (%) | 23 | Insulin | 13 |
| Snuff users (%) | 23 | Diabetes complication (%) | |
| Frequency of alcohol intake (%) | Retinopathy | 27 | |
| None | 10 | Nephropathy | 17 |
| Once a month or less | 50 | Neuropathy | 30 |
| 2–4 times a month | 27 | Gastroparesis | 3 |
| 2–3 times a week | 13 | Macroangiopathy | 17 |
| Physical activity (%) | Antibiotic use last 6 months | ||
| Sedentary leisure time | 7 | During intervention | 20 |
| Moderate exercise during leisure | 53 | During follow-up | 35 |
| Moderate regular exercise during leisure | 27 | Probiotic use (Lactobacuillus plantarum DSM 9843) | 17 |
| Regular exercise and training | 13 |
| Variables | Actinobacteria | Bacteroidetes | Firmicutes | Verrucomicrobia |
|---|---|---|---|---|
| Anthropometry | ||||
| Waist circumference | R2 = 0.05, p = 0.038 | R2 = 0.08, p = 0.013 | ||
| Weight | R2 = 0.07, p = 0.016 | |||
| Systolic blood pressure | R2 = 0.08, p = 0.01 | R2=−0.13, p = 0.001 | ||
| Diastolic blood pressure | R2 = 0.14, p = 8 × 10⁻⁴ | R2=−0.08, p = 0.014 | ||
| Inflammatory markers | ||||
| CRP | R2 = 0.08, p = 0.011 | |||
| IL-18 | R2=−0.14, p = 0.009 | |||
| HbA1c | R2 = 0.08, p = 0.013 | R2=−0.12, p = 0.002 | R2 = 0.06, p = 0.034 | |
| Lipids | ||||
| Cholesterol | R2 = 0.09, p = 0.005 | |||
| Triglycerides | R2=−0.05, p = 0.039 | R2 = 0.05, p = 0.037 | ||
| Short-chain fatty acids | ||||
| Butyric acid | R2 = 0.07, p = 0.02 | R2=−0.10, p = 0.004 | R2 = 0.06, p = 0.022 | |
| Isobutyric acid | R2=−0.05, p = 0.037 | |||
| Zonulin feces | R2 = 0.13, p = 0.001 | R2 = 0.07, p = 0.013 | ||
| Breakfast intake | ||||
| Carbohydrate E% | R2 = 0.18, p = 0.028 | |||
| Protein E% | R2=−0.20, p = 5 × 10⁴ | R2 = 0.10, p = 0.019 | R2 = 0.08, p = 0.035 |
| Phylum | Genus | Log2-Fold Change | FDR |
|---|---|---|---|
| Firmicutes | Family XIII AD3011 | 1.254 | <0.001 |
| Firmicutes | Anaerostipes | 1.596 | 0.001 |
| Firmicutes | Ruminococcaceae UCG-004 | 1.163 | 0.008 |
| Firmicutes | Erysipelotrichaceae UCG-003 | 1.065 | 0.009 |
| Firmicutes | Blautia | 0.936 | 0.010 |
| Firmicutes | Ruminococcaceae NK4A214 | 1.086 | 0.014 |
| Firmicutes | [Eubacterium] coprostanoligenes | 0.960 | 0.019 |
| Firmicutes | Ruminococcaceae UCG-002 | 0.986 | 0.019 |
| Firmicutes | Marvinbryantia | 1.128 | 0.019 |
| Firmicutes | Holdemania | 1.135 | 0.019 |
| Firmicutes | Coprococcus 1 | 1.316 | 0.019 |
| Firmicutes | Butyricicoccus | −1.088 | 0.019 |
| Firmicutes | Flavonifractor | −1.244 | 0.019 |
| Firmicutes | CAG-352 | 1.103 | 0.031 |
| Firmicutes | Ruminococcus 1 | 1.085 | 0.032 |
| Firmicutes | Christensenellaceae R-7 | 0.854 | 0.034 |
| Firmicutes | [Eubacterium] halli | 1.163 | 0.036 |
| Verrucomicrobia | Akkermansia | 1.417 | 0.005 |
| Actinobacteria | Eggerthella | 1.337 | 0.004 |
| Actinobacteria | Collinsella | 0.944 | 0.009 |
| Actinobacteria | Senegalimassilla | 1.131 | 0.014 |
| Actinobacteria | Gordonibacter | 1.084 | 0.019 |
| Actinobacteria | Enterorhabdus | 0.993 | 0.032 |
| Bacteroidetes | Barnesiella | −0.828 | 0.031 |
| Bacteroidetes | Bacteroides | −0.728 | <0.001 |
| Bacteroidetes | Alistipes | −0.884 | <0.001 |
| Bacteroidetes | Butyricimonas | −1.363 | <0.001 |
| Bacteroidetes | Parabacteroides | −1.381 | <0.001 |
| Bacteroidetes | Odoribacter | −2.0.79 | <0.001 |
| Proteobacteria | Sutturella | −1.366 | <0.001 |
| Phylum | Genus | Log2-Fold Change | FDR |
|---|---|---|---|
| Bacteroidetes | Odoribacter | 1.861 | <0.001 |
| Bacteroidetes | Alistipes | 0.876 | 0.003 |
| Bacteroidetes | Parabacteroides | 0.833 | 0.005 |
| Proteobacteria | Sutterella | 1.657 | <0.001 |
| Proteobacteria | Unknown Desulfovibrionaceae | 1.127 | 0.020 |
| Firmicutes | Blautia | −1.096 | 0.007 |
| Firmicutes | UBA1819 | −1.111 | 0.044 |
| Firmicutes | Family XIII AD3011 | −1.412 | 0.002 |
| Firmicutes | Erysipelatoclostridium | −1.333 | 0.030 |
| Firmicutes | [Eubacterium] coprostanoligenes | −1.381 | 0.003 |
| Firmicutes | Holdemania | −1.328 | 0.018 |
| Firmicutes | [Clostridium] | −1.144 | 0.045 |
| Firmicutes | Erysipelotrichaceae | −1.169 | 0.012 |
| Firmicutes | [Eubacterium] eligens | −1.858 | 0.002 |
| Firmicutes | Roseburia | −1.387 | 0.003 |
| Firmicutes | Ruminiclostridium | −1.205 | 0.044 |
| Firmicutes | Unknown Lachnospiraceae | −0.915 | 0.020 |
| Actinobacteria | Eggerthella | −1.127 | 0.043 |
| Actinobacteria | Collinsella | −1.501 | <0.001 |
| Actinobacteria | Senegalimassilia | −1.356 | 0.009 |
| Actinobacteria | Akkermansia | −1.614 | 0.004 |
Disclaimer/Publisher’s Note: The statements, opinions and data contained in all publications are solely those of the individual author(s) and contributor(s) and not of MDPI and/or the editor(s). MDPI and/or the editor(s) disclaim responsibility for any injury to people or property resulting from any ideas, methods, instructions or products referred to in the content. |
© 2023 by the authors. Licensee MDPI, Basel, Switzerland. This article is an open access article distributed under the terms and conditions of the Creative Commons Attribution (CC BY) license (https://creativecommons.org/licenses/by/4.0/).
Share and Cite
Manoharan, L.; Roth, B.; Bang, C.; Stenlund, H.; Ohlsson, B. An Okinawan-Based Nordic Diet Leads to Profound Effects on Gut Microbiota and Plasma Metabolites Linked to Glucose and Lipid Metabolism. Nutrients 2023, 15, 3273. https://doi.org/10.3390/nu15143273
Manoharan L, Roth B, Bang C, Stenlund H, Ohlsson B. An Okinawan-Based Nordic Diet Leads to Profound Effects on Gut Microbiota and Plasma Metabolites Linked to Glucose and Lipid Metabolism. Nutrients. 2023; 15(14):3273. https://doi.org/10.3390/nu15143273
Chicago/Turabian StyleManoharan, Lokeshwaran, Bodil Roth, Corinna Bang, Hans Stenlund, and Bodil Ohlsson. 2023. "An Okinawan-Based Nordic Diet Leads to Profound Effects on Gut Microbiota and Plasma Metabolites Linked to Glucose and Lipid Metabolism" Nutrients 15, no. 14: 3273. https://doi.org/10.3390/nu15143273
APA StyleManoharan, L., Roth, B., Bang, C., Stenlund, H., & Ohlsson, B. (2023). An Okinawan-Based Nordic Diet Leads to Profound Effects on Gut Microbiota and Plasma Metabolites Linked to Glucose and Lipid Metabolism. Nutrients, 15(14), 3273. https://doi.org/10.3390/nu15143273