
Identifying Novel Data-Driven Dietary Patterns via Dimensionality Reduction and Associations with Socioeconomic Profile and Health Outcomes in Ireland


Abstract
1. Introduction
2. Methodology
2.1. Survey Compilation
2.2. Questionnaire Design
2.3. Survey Completion
2.4. Statistical Analysis
3. Results
3.1. Characteristics of the Study Population
3.2. Data-Driven Dietary Pattern Identification (Principal Component Analyses)
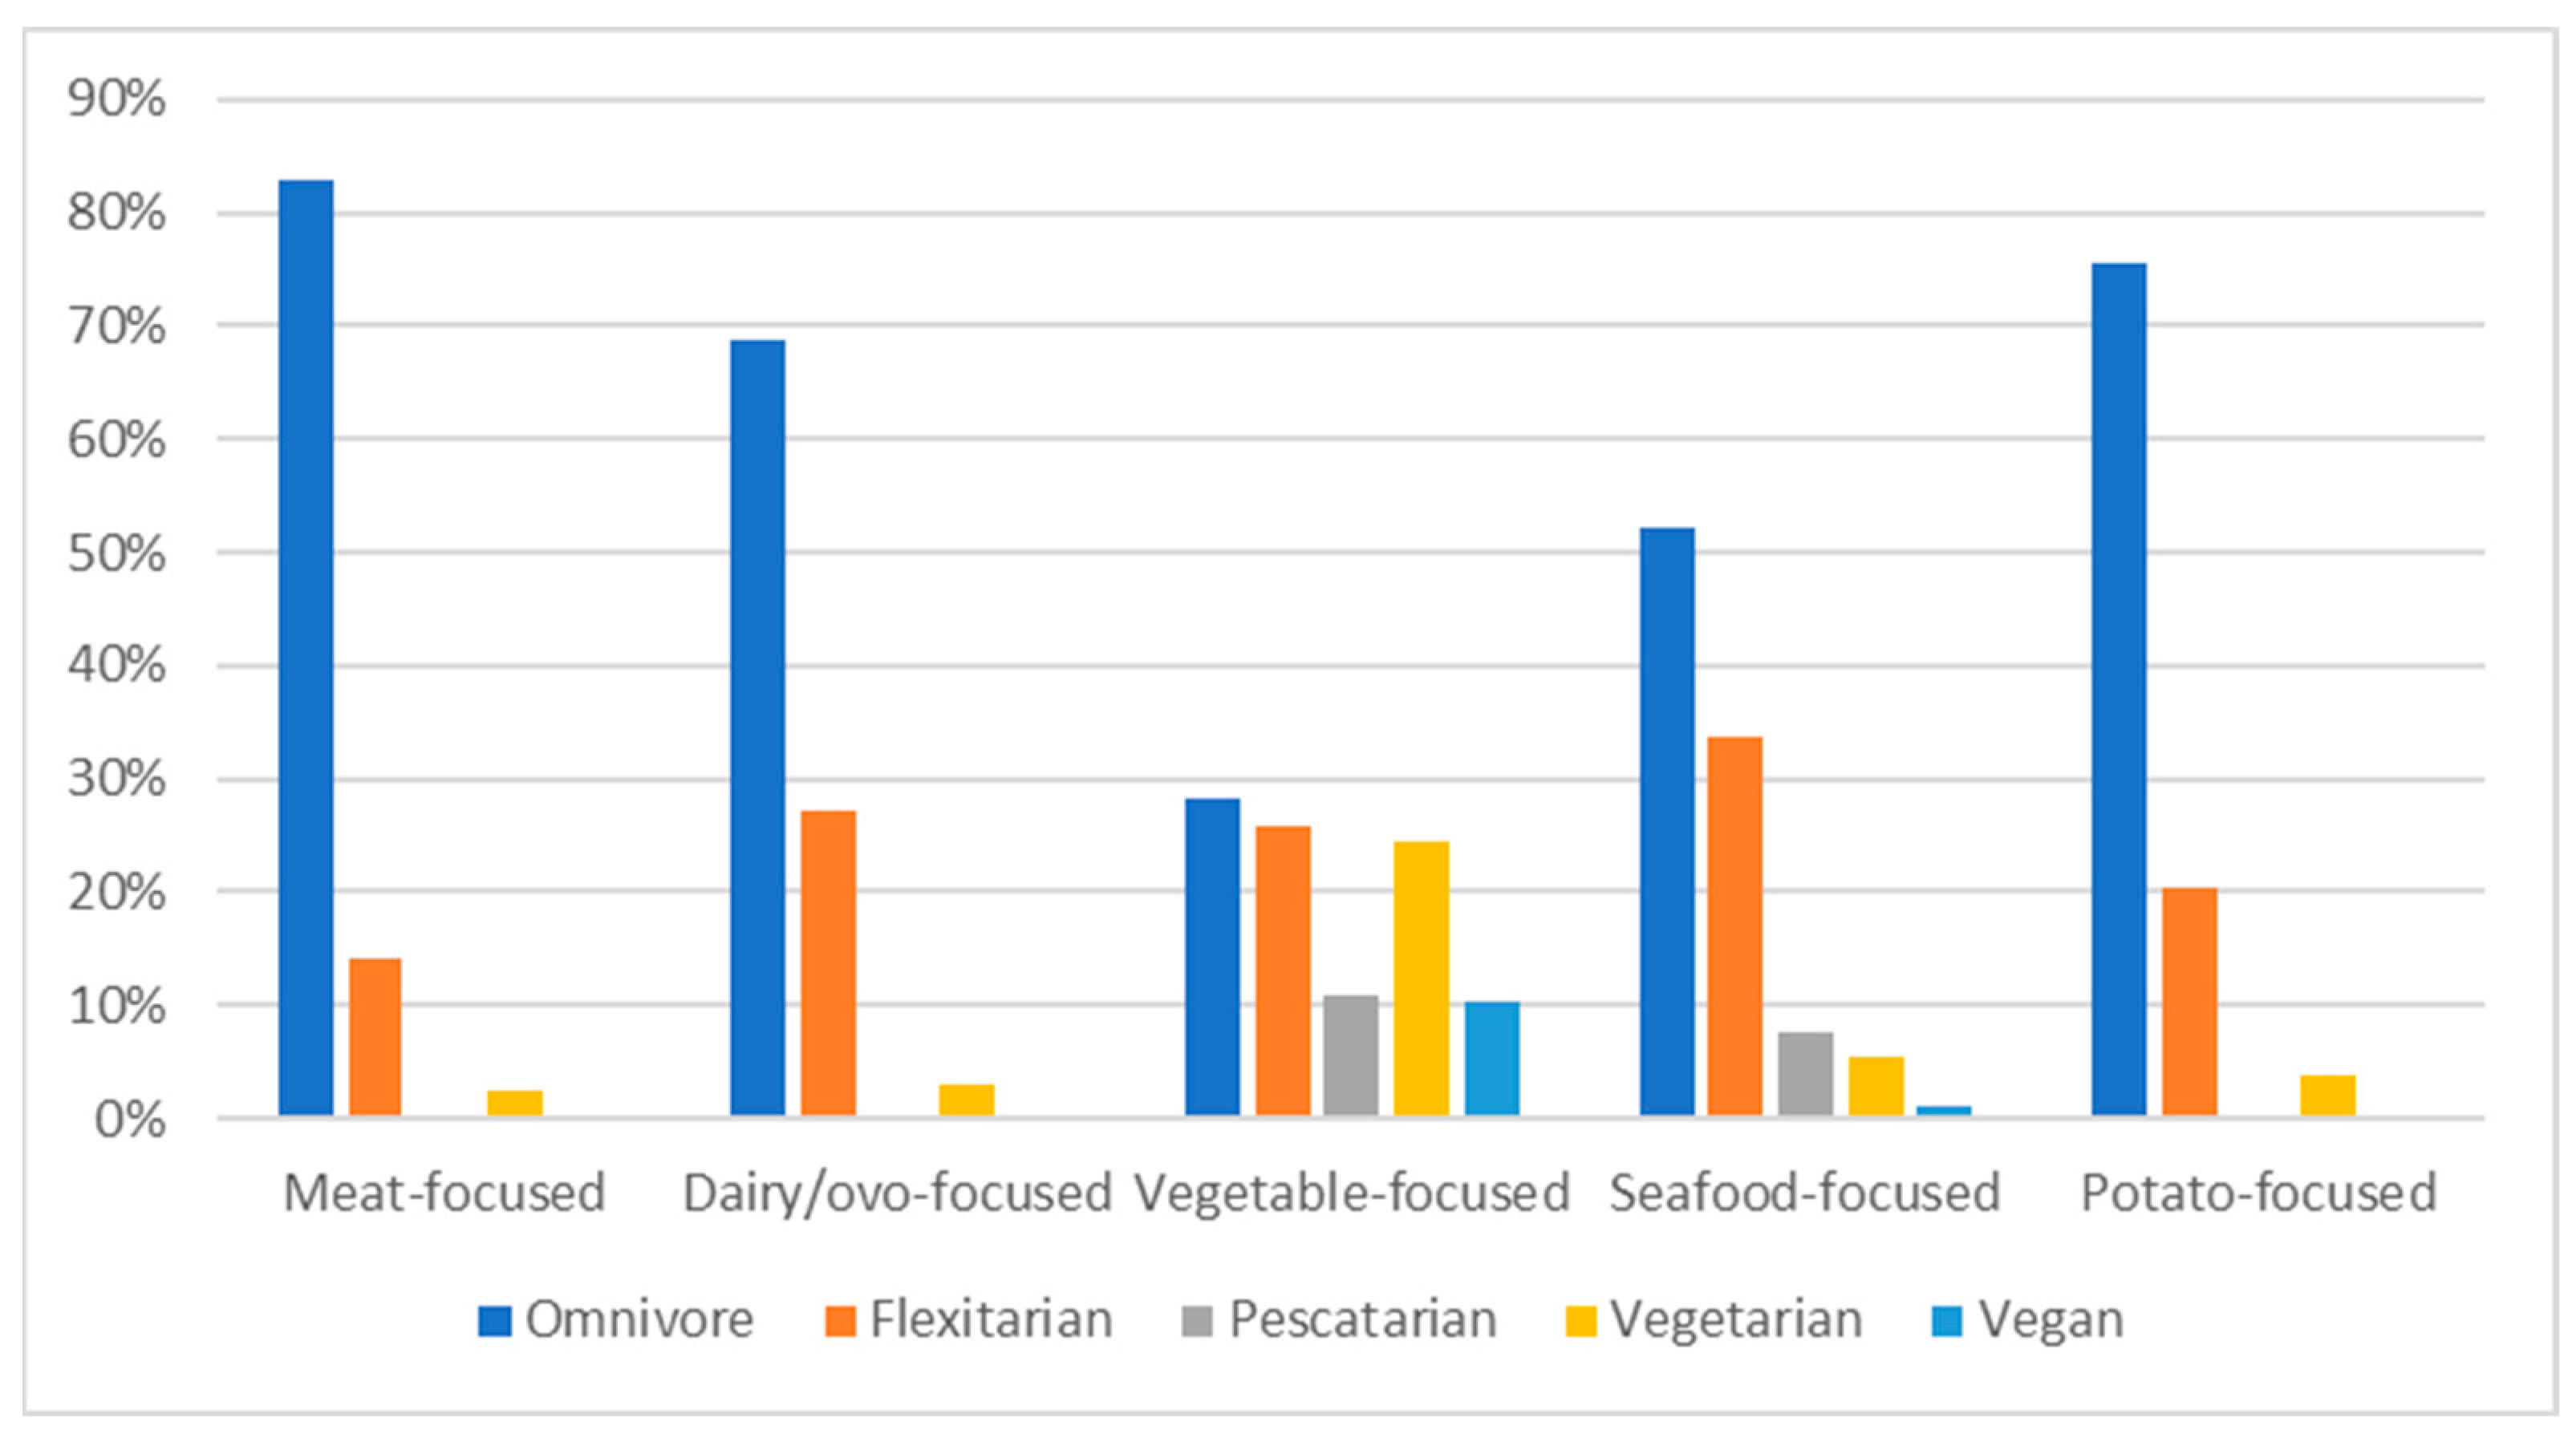
3.3. PCA-Derived Dietary Patterns and Self-Reported Diet
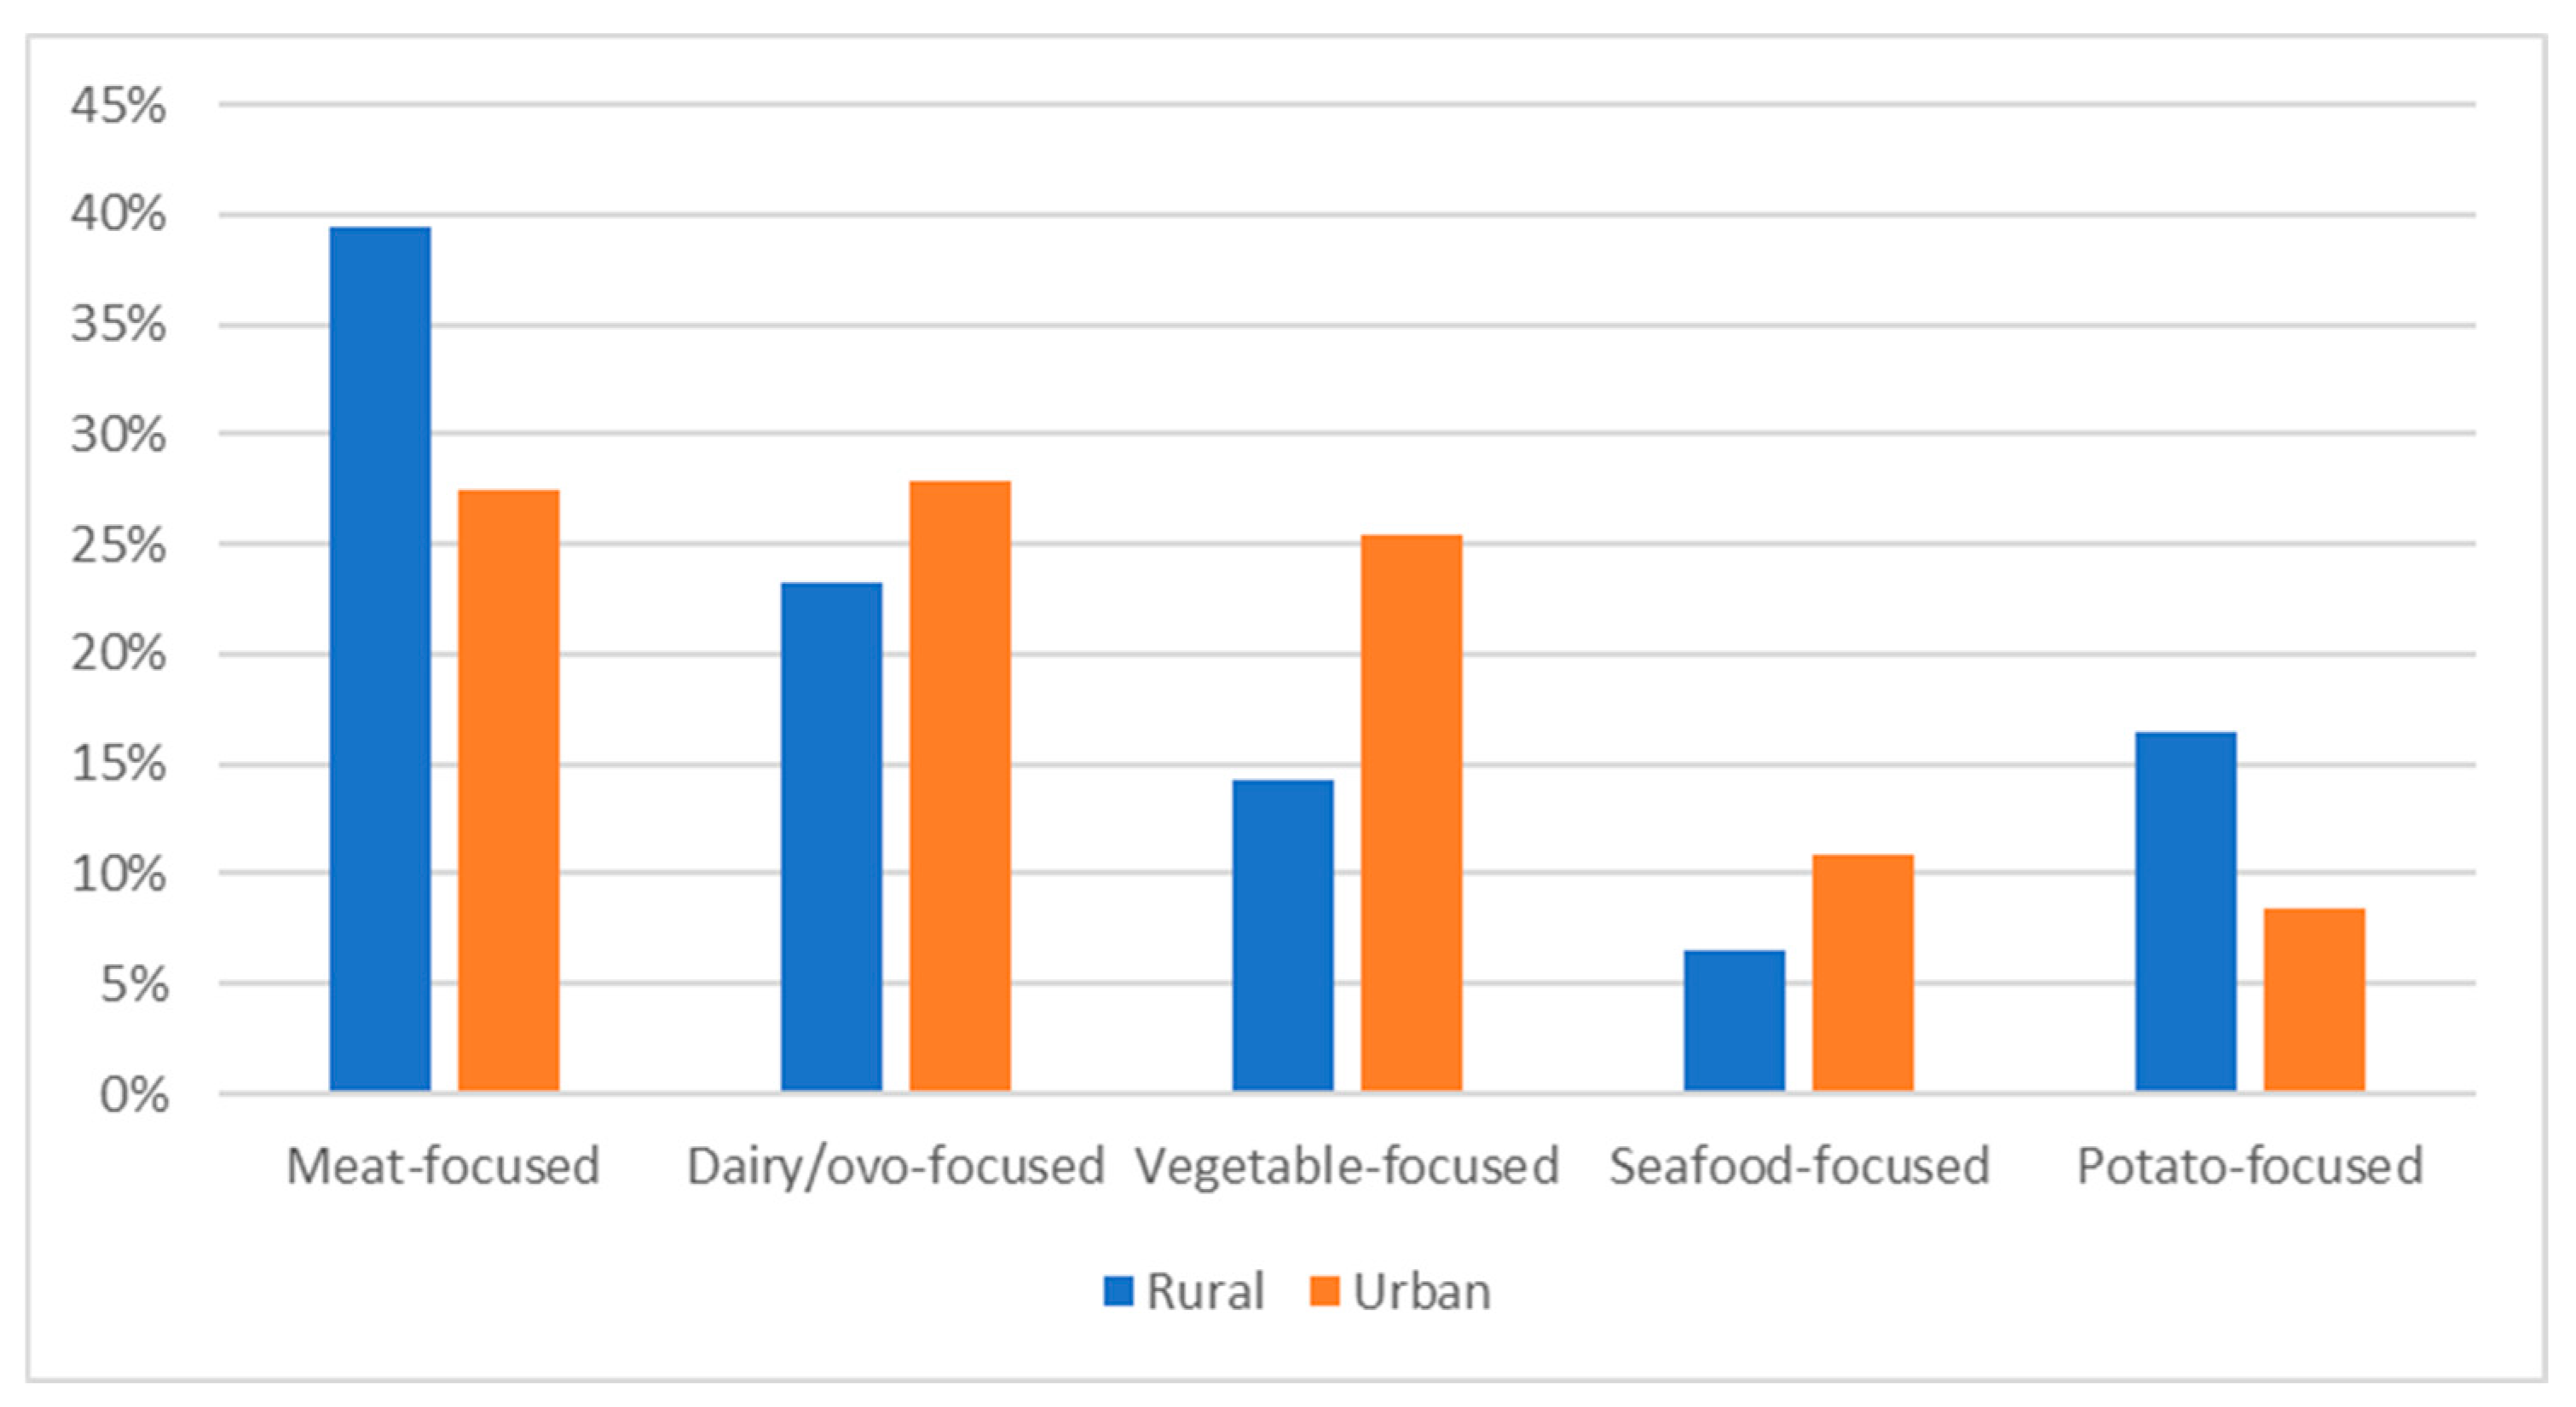
3.4. PCA-Derived Dietary Patterns and Socioeconomic Profiles
3.5. Associations between Self-Reported and PCA-Derived Dietary Patterns and Self-Reported Health
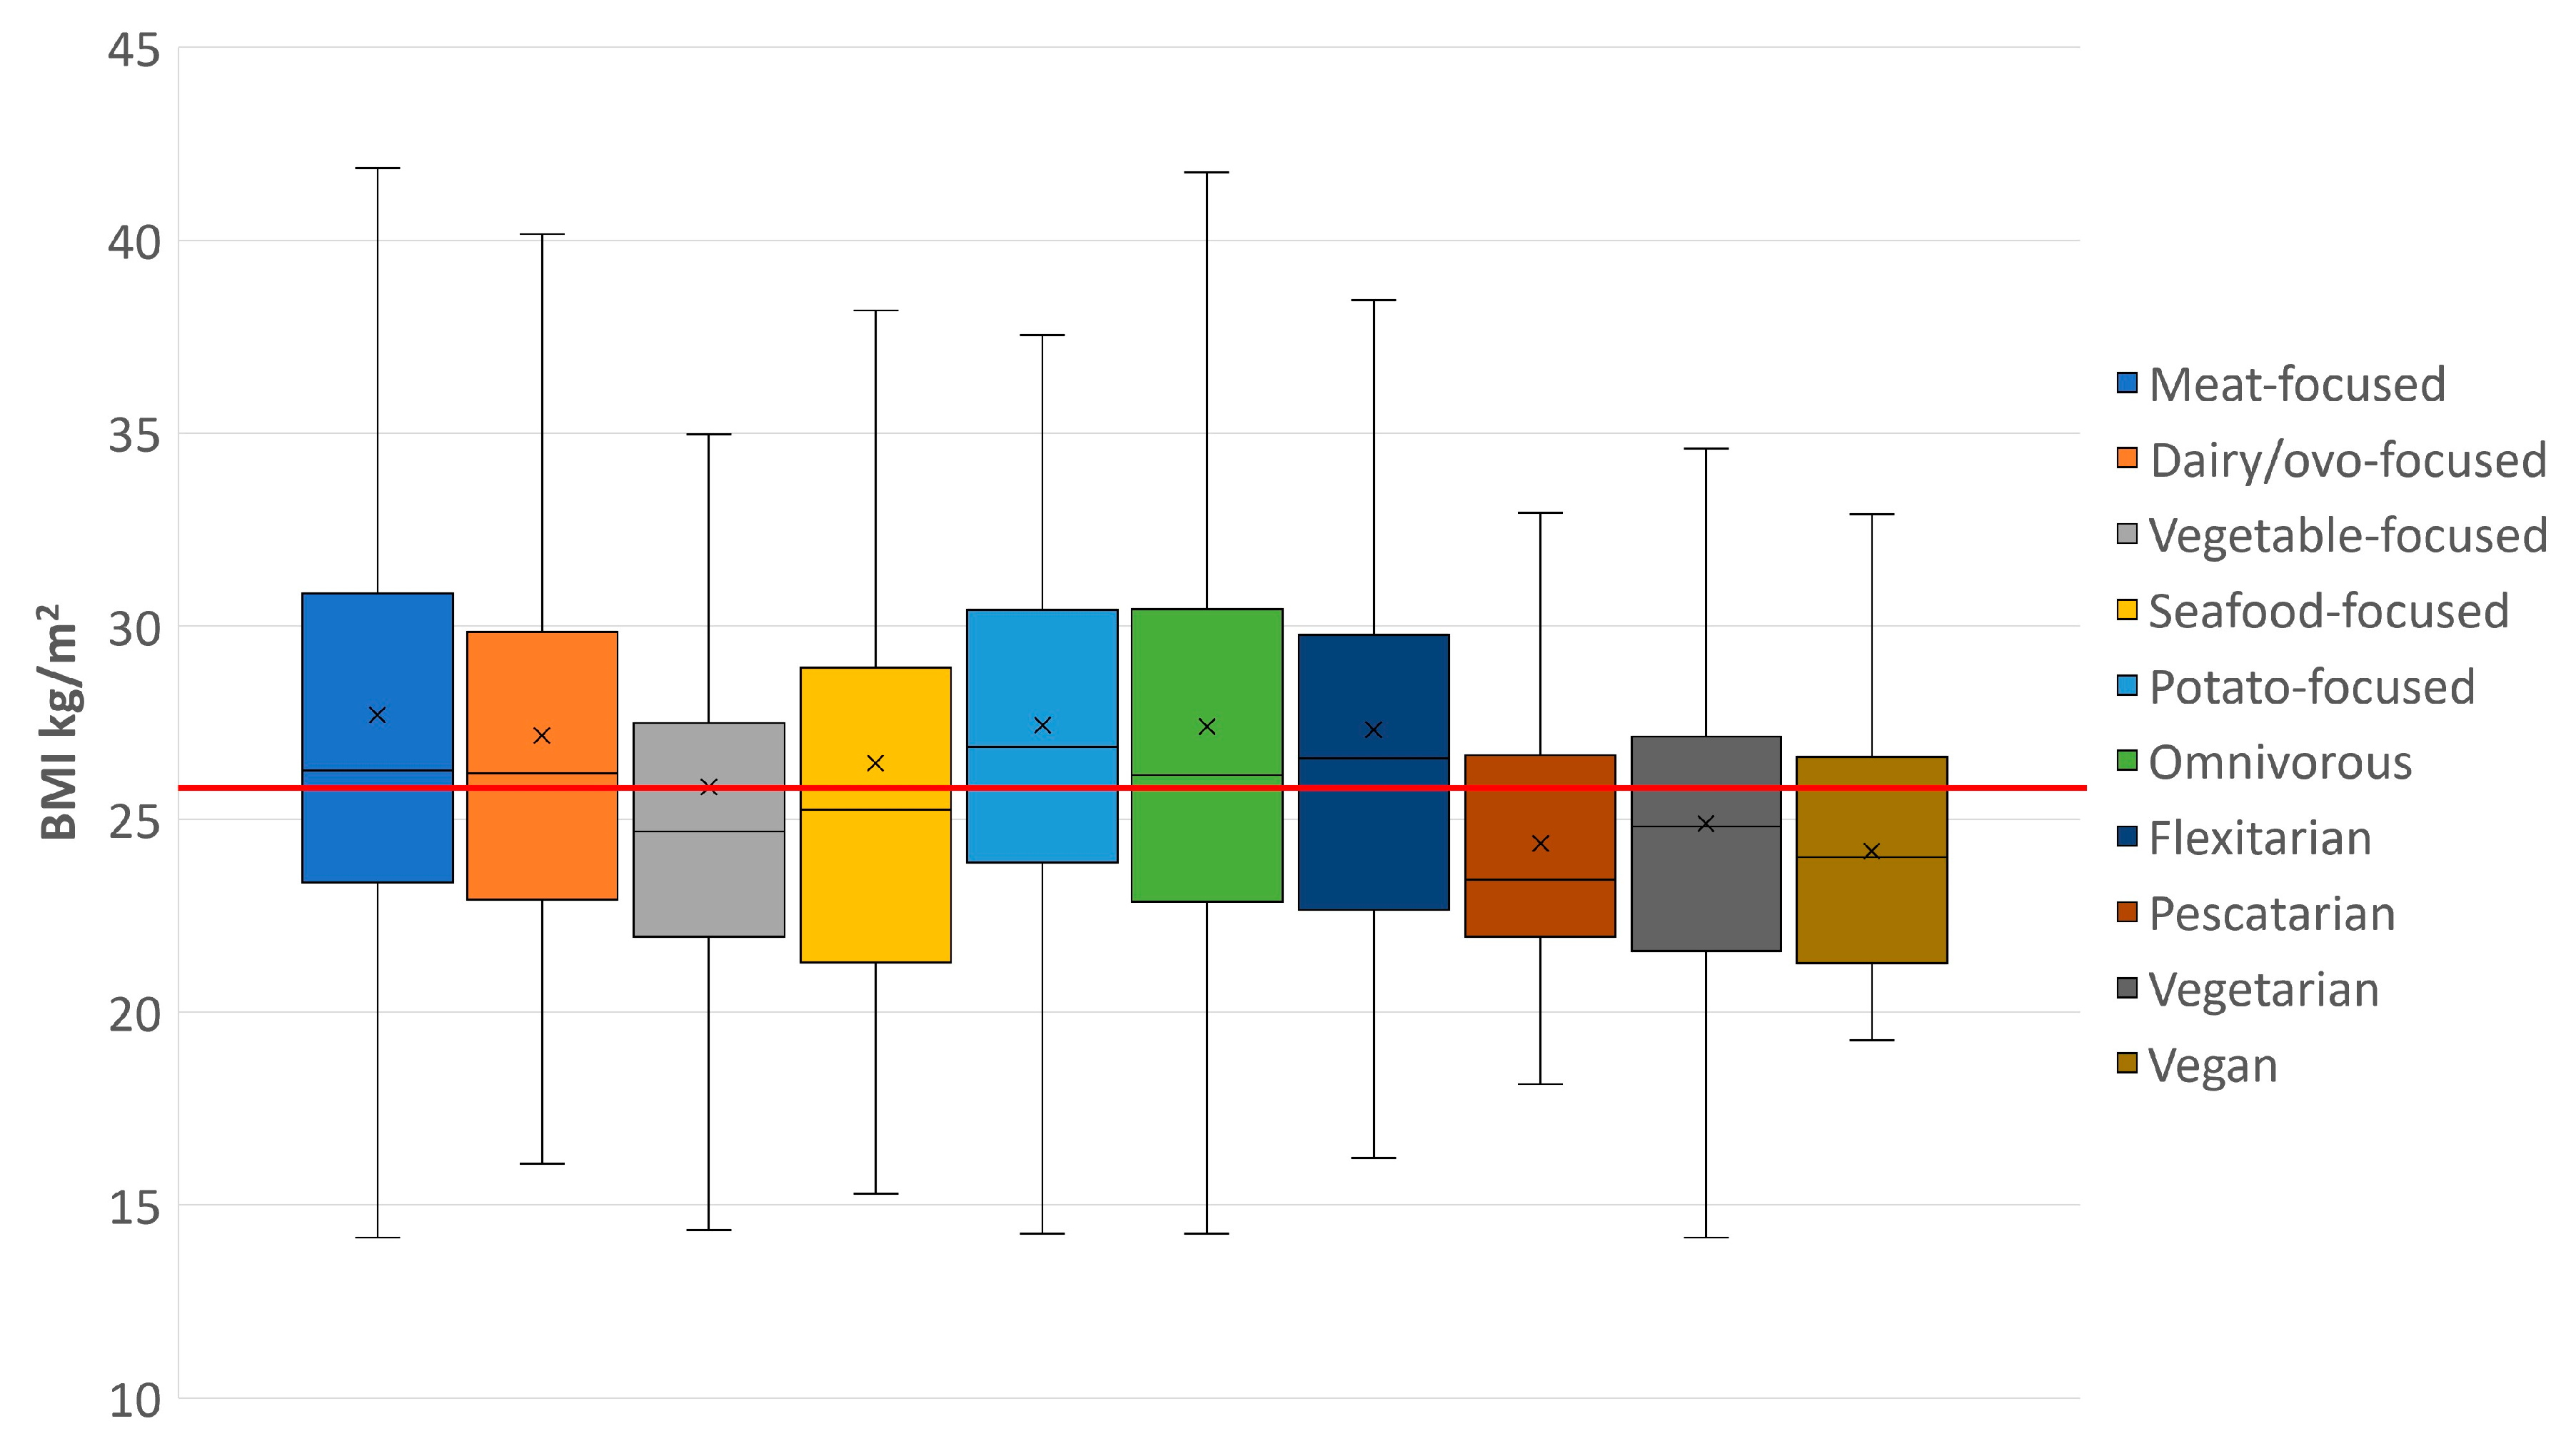
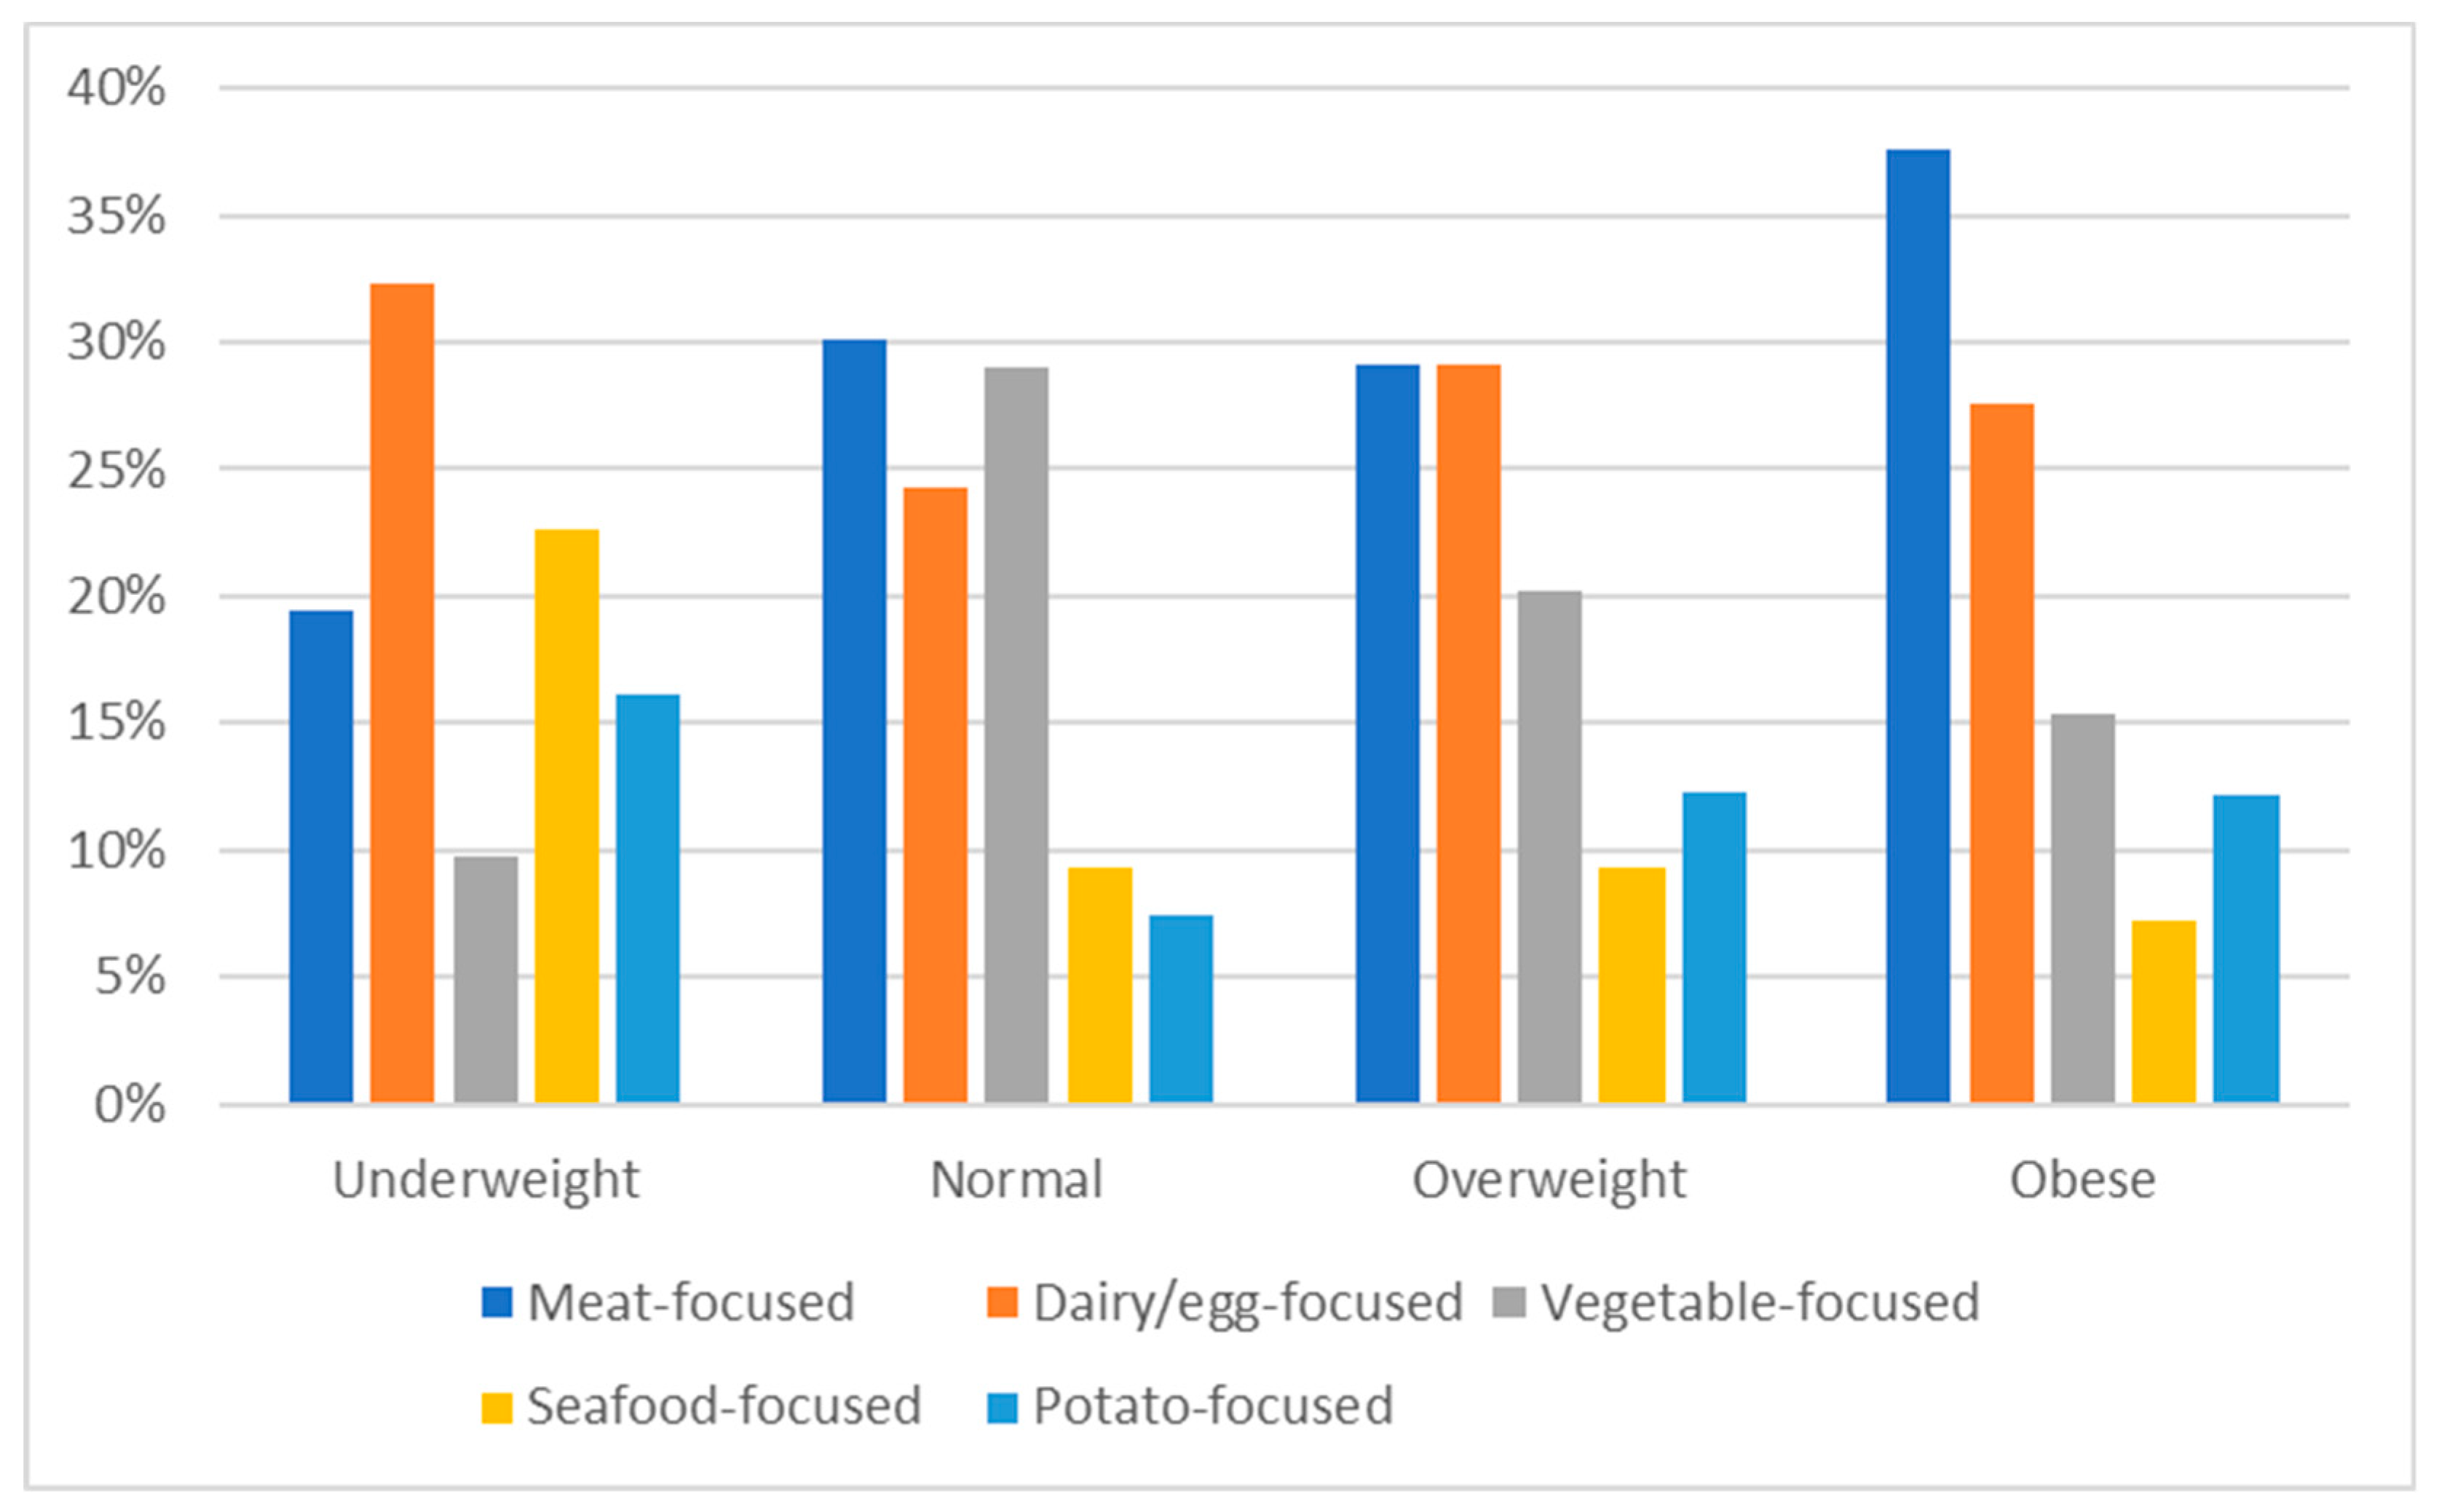
3.5.1. Body Mass Index
3.5.2. Self-Reported Health Conditions
3.5.3. Associations between Self-Reported Health and Socioeconomic Profile
4. Discussion
- I.
- Self-reported and data-derived dietary patterns associated with health and socioeconomics
- II.
- Improving dietary patterns
- III.
- Strengths and limitations
5. Conclusions
Author Contributions
Funding
Institutional Review Board Statement
Informed Consent Statement
Data Availability Statement
Acknowledgments
Conflicts of Interest
Appendix A

| Question | Possible Responses | |||
|---|---|---|---|---|
| Which sex/gender do you identify as? | • Male | • Other | ||
| • Female | • Prefer not to answer | |||
| What is your current age? | • Under 18 | • 45–54 | ||
| • 18–24 | • 55–64 | |||
| • 25–34 | • 65–74 | |||
| • 35–44 | • 75 years or older | |||
| How would you best describe yourself? | • White | • A mix of two or more | ||
| • Black or Black Irish | • Other | |||
| • Asian or Asian Irish | • Prefer not to answer | |||
| • Arab or Arab Irish | ||||
| Which of the following best describes your ethnicity? | • Irish | • Japanese | ||
| • Eastern European | • Indian, Pakistani, or Bangladeshi | |||
| • Irish Traveller | • Other Asian backgrounds | |||
| • Other White background | • Middle Eastern | |||
| • African | • A mix of two or more | |||
| • Other Black background | • Other | |||
| • Chinese | • Prefer not to answer | |||
| Including yourself, how many people currently live in your household? | • People 18 years or older: _____ | |||
| • Children and adolescents aged 17 or younger: _____ | ||||
| What would you estimate your total pretaxed household income? | • Less than EUR 24,999 | • Between EUR 125,000 and EUR 149,999 | ||
| • Between EUR 25,000 and EUR 49,999 | • More than EUR 150,000 | |||
| • Between EUR 50,000 and EUR 74,999 | • I don’t know | |||
| • Between EUR 75,000 and EUR 99,999 | • Prefer not to answer | |||
| • Between EUR 100,000 and EUR 124,999 | ||||
| What is your highest level of education to date? | • Secondary school | |||
| • Technical, vocational, advance certificate, or completed apprenticeship | ||||
| • Undergraduate degree | ||||
| • Postgraduate diploma or degree (postgraduate diploma, masters) | ||||
| • Doctorate (PhD or higher) | ||||
| • Prefer not to answer | ||||
| How would you best describe your present employment status? | • Working for payment or profit | • Retired from employment | ||
| • Looking for first regular job | • Unable to work due to permanent sickness or disability | |||
| • Unemployed | • Other | |||
| • Student or pupil with a part-time job | • I don’t know | |||
| • Student or pupil without a part-time job | • Prefer not to answer | |||
| • Looking after home/family | ||||
| Which of the following best describes your current occupation? | • Education | |||
| • Sales, business, law, and commerce (including managers, executives, and clerical and office workers) | ||||
| • Computing, IT, scientific and technical | ||||
| • Engineering, architecture, manufacturing, building, construction | ||||
| • Farming, fishing, forestry, and veterinary | ||||
| • Healthcare (including nursing, dental, therapy, rehabilitation, and pharmacy) | ||||
| • Social services (including childcare and youth services, social work and counselling) | ||||
| • Services (including restaurant, retail, Garda Siochána, hotel, catering, sports, transport, security, occupational health and safety, military and defence, and central and local government) | ||||
| • Other | ||||
| • Prefer not to answer | ||||
| Which county in Ireland do you currently reside in? | • Antrim | • Galway | • Monaghan | |
| • Armagh | • Kerry | • Offaly | ||
| • Carlow | • Kildare | • Roscommon | ||
| • Cavan | • Kilkenny | • Sligo | ||
| • Clare | • Laois | • Tipperary | ||
| • Cork | • Leitrim | • Tyrone | ||
| • Derry | • Limerick | • Waterford | ||
| • Donegal | • Longford | • Westmeath | ||
| • Down | • Louth | • Wexford | ||
| • Dublin | • Mayo | • Wicklow | ||
| • Fermanagh | • Meath | • I don’t live in Ireland currently | ||
| Do you live within walking distance to the nearest public house, restaurant, or café? | • Yes | |||
| • No | ||||
| • I don’t know | ||||
| How long do you think it takes to get to the closest pub, restaurant, or café from your home by walking? | • 1 to 5 min (0 to 0.5 km) | • 31 to 45 min (2.6 to 4 km) | ||
| • 6 to 15 min (0.6 to 1.5 km) | • 46 min to an hour (4.1 to 5 km) | |||
| • 16 to 30 min (1.6 to 2.5 km) | • More than an hour | |||
| How long do you think it takes to get to the closest pub, restaurant, or café from your home by driving (including public transport)? | • 16 to 30 min (13 to 25 km) | • 46 min to an hour (39 to 50 km) | ||
| • 31 to 45 min (26 to 38 km) | • More than an hour | |||
| I usually went to the shop by ___. | • Foot | • Public transport | ||
| • Bike | • Other | |||
| • Car | ||||
| Finally, the shop was about ___ away from where I live. | • Sliding bar corresponding with distance min | |||
| About how much do you think you spent on food (groceries, eating out, and takeaway) last month for yourself? | • EUR 100 to EUR 149 | • EUR 300 to EUR 349 | ||
| • EUR 150 to EUR 199 | • EUR 350 to 399 | |||
| • EUR 200 to EUR 249 | • More than EUR 400 | |||
| • EUR 250 to EUR 299 | • I don’t know | |||
| Self-Reported Health | Possible Responses | |||
| What is your height in either centimetres or feet? (Please fill in one) | • Centimetres: ____ | |||
| • Inches and feet (for example, 5 foot 8 inches would be 5’8”): ____ | ||||
| What is your current weight in either kilograms, pounds, or stone? (Please fill in one) | • Kilogrammes: _____ | |||
| • Pounds: _______ | ||||
| • Stone: _______ | ||||
| Have you ever experienced any of the following: | • None of the above | • Diabetes | ||
| • Food poisoning | • Coronary heart disease | |||
| • Hypertension | ||||
| Dietary habits | Possible responses | |||
| During the past month, including eating at home and in restaurants or ordering delivery and takeaway, how often did you consume at least one serving size (75~100 g or roughly the size of your fist) of the following foods? | ||||
| At least once every day | Almost every day (3–6 times per week) | Rarely (1 or 2 times a month) | Never or I don’t eat | |
| Bread, rice, pasta, grains, oats | ||||
| Vegetables | ||||
| Potatoes | ||||
| Bananas, avocados, and citrus fruit (such as oranges, grapefruit) | ||||
| Other fruit (such as berries, apples, peaches) | ||||
| Nuts and seeds | ||||
| Fruit and vegetable juices | ||||
| Tea (caffeinated, decaffeinated and with or without milk and sugar) | ||||
| Coffee (caffeinated, decaffeinated and with or without milk and sugar) | ||||
| Continued | At least once every day | Almost every day (3–6 times per week) | Rarely (1 or 2 times a month) | Never or I don’t eat |
| Dairy, milk (whole, low fat, skimmed and including milk in tea and coffee), cream, cheeses, butter, yoghurt ice cream | ||||
| Eggs and food made with eggs | ||||
| Fish and seafood (including shellfish and freshwater fish) | ||||
| Red meat (such as beef and lamb) | ||||
| Non-red meat (such as ham, bacon, pork, and chicken) | ||||
| Confectionary and desserts (such as cake, chocolate, and biscuits) | ||||
| Which phrase do you think most accurately describes your current personal diet? | • I eat meat, fish, and vegetables (omnivorous) | |||
| • I eat meat, but I try to limit the amount I eat (flexitarian) | ||||
| • I do not eat meat, but I may or may not consume eggs or dairy (vegetarian) | ||||
| • I do not eat any animal-sourced foods (vegan) | ||||
| • I do not eat meat, but I eat fish and seafood (pescatarian) | ||||
| • Other (please specify) | ||||
| How long have you followed this particular diet? | • Less than 1 year | |||
| • 1 to 5 years | ||||
| • 6 to 10 years | ||||
| • 11 to 15 years | ||||
| • More than 15 years | ||||
| Total | Male | Female | Meat-Focused | Dairy/Ovo-Focused | Vegetable-Focused | Seafood-Focused | Potato-Focused | |||||||||
|---|---|---|---|---|---|---|---|---|---|---|---|---|---|---|---|---|
| (n = 957) | (n = 403) | (n = 554) | (n = 296) | (n = 254) | (n = 212) | (n = 92) | (n = 103) | |||||||||
| n | % | n | % | n | % | n | % | n | % | n | % | n | % | n | % | |
| Self-reported dietary pattern | ||||||||||||||||
| Omnivorous | 606 | 63.3 | 226 | 66 | 340 | 61.4 | 245 | 82.8 | 175 | 68.9 | 60 | 28.3 | 48 | 52.2 | 78 | 75.7 |
| Flexitarian | 218 | 22.8 | 93 | 23.1 | 125 | 22.6 | 42 | 14.2 | 69 | 27.2 | 55 | 25.9 | 31 | 33.7 | 21 | 20.4 |
| Pescatarian | 32 | 3.3 | 9 | 2.2 | 23 | 4.2 | 1 | 0.3 | 1 | 0.4 | 23 | 10.8 | 7 | 7.6 | 0 | 0 |
| Vegetarian | 76 | 7.9 | 28 | 6.9 | 48 | 8.7 | 7 | 2.4 | 8 | 3.1 | 52 | 24.5 | 5 | 5.4 | 4 | 3.9 |
| Vegan | 25 | 2.6 | 7 | 1.7 | 18 | 3.2 | 1 | 0.3 | 1 | 0.4 | 22 | 10.4 | 1 | 1.1 | 0 | 0 |
| Consumption and frequency | ||||||||||||||||
| Bread, rice, pasta, grains, oats | ||||||||||||||||
| At least once every day | 612 | 64 | 219 | 54.5 | 393 | 70.9 | 184 | 62.2 | 158 | 62.2 | 154 | 72.6 | 41 | 44.6 | 75 | 72.8 |
| Almost every day | 236 | 24.7 | 128 | 31.8 | 108 | 19.5 | 75 | 25.3 | 73 | 28.7 | 35 | 16.5 | 29 | 31.5 | 24 | 23.3 |
| Sometimes | 84 | 8.8 | 42 | 10.4 | 42 | 7.6 | 31 | 10.5 | 18 | 7.1 | 16 | 7.5 | 15 | 16.3 | 4 | 3.9 |
| Rarely | 19 | 2 | 9 | 2.2 | 10 | 1.8 | 5 | 1.7 | 4 | 1.6 | 5 | 2.4 | 5 | 5.4 | 0 | 0 |
| Never or I don’t eat | 5 | 0.5 | 4 | 1 | 1 | 0.2 | 0 | 0 | 1 | 0.4 | 2 | 0.9 | 2 | 2.2 | 0 | 0 |
| Vegetables | ||||||||||||||||
| At least once everyday | 582 | 60.9 | 206 | 51.2 | 376 | 67.9 | 147 | 49.7 | 163 | 64.2 | 163 | 76.9 | 47 | 51.1 | 62 | 60.2 |
| Almost every day | 245 | 25.6 | 117 | 29.1 | 128 | 23.1 | 86 | 29.1 | 60 | 23.6 | 40 | 18.9 | 31 | 33.7 | 28 | 27.2 |
| Sometimes | 99 | 10.4 | 61 | 15.2 | 38 | 6.9 | 46 | 15.5 | 23 | 9.1 | 7 | 3.3 | 12 | 13 | 11 | 10.7 |
| Rarely | 25 | 2.6 | 14 | 3.5 | 11 | 2 | 12 | 4.1 | 8 | 3.1 | 1 | 0.5 | 2 | 2.2 | 2 | 1.9 |
| Never or I don’t eat | 5 | 0.5 | 4 | 1 | 1 | 0.2 | 5 | 1.7 | 0 | 0 | 0 | 0 | 0 | 0 | 0 | 0 |
| Potatoes | ||||||||||||||||
| At least once every day | 159 | 16.6 | 68 | 16.9 | 91 | 16.5 | 41 | 13.9 | 35 | 13.8 | 23 | 10.8 | 15 | 16.3 | 45 | 43.7 |
| Almost every day | 300 | 31.4 | 134 | 33.3 | 166 | 30 | 86 | 29.1 | 81 | 31.9 | 54 | 25.5 | 21 | 22.8 | 58 | 56.3 |
| Sometimes | 387 | 40.5 | 151 | 37.5 | 236 | 42.7 | 144 | 48.6 | 108 | 42.5 | 96 | 45.3 | 39 | 42.4 | 0 | 0 |
| Rarely | 100 | 10.5 | 44 | 10.9 | 56 | 10.1 | 25 | 8.4 | 25 | 9.8 | 35 | 16.5 | 15 | 16.3 | 0 | 0 |
| Never or I don’t eat | 10 | 1 | 6 | 1.5 | 5 | 0.7 | 0 | 0 | 4 | 1.6 | 4 | 1.9 | 2 | 2.2 | 0 | 0 |
| Bananas, avocados, citrus fruit | ||||||||||||||||
| At least once every day | 284 | 29.7 | 113 | 28 | 171 | 30.9 | 62 | 20.9 | 90 | 35.4 | 71 | 33.5 | 31 | 33.7 | 30 | 29.1 |
| Almost every day | 240 | 25.1 | 108 | 26.8 | 132 | 23.9 | 64 | 21.6 | 71 | 28 | 53 | 25 | 25 | 27.2 | 27 | 26.2 |
| Sometimes | 296 | 31 | 117 | 29 | 179 | 32.4 | 109 | 36.8 | 63 | 24.8 | 64 | 30.2 | 29 | 31.5 | 31 | 30.1 |
| Rarely | 117 | 12.2 | 55 | 13.6 | 62 | 11.2 | 49 | 16.6 | 26 | 10.2 | 20 | 9.4 | 7 | 7.6 | 15 | 14.6 |
| Never or I don’t eat | 19 | 2 | 10 | 2.5 | 9 | 1.6 | 12 | 4.1 | 4 | 1.6 | 3 | 1.4 | 0 | 0 | 0 | 0 |
| Other fruit | ||||||||||||||||
| At least once every day | 293 | 30.7 | 107 | 26.6 | 186 | 33.6 | 53 | 17.9 | 89 | 35 | 87 | 41 | 34 | 37 | 30 | 29.1 |
| Almost every day | 298 | 31.2 | 124 | 30.8 | 174 | 31.5 | 87 | 29.4 | 95 | 37.4 | 58 | 27.4 | 32 | 34.8 | 26 | 25.2 |
| Sometimes | 243 | 25.4 | 114 | 28.4 | 129 | 23.3 | 101 | 34.1 | 46 | 18.1 | 46 | 21.7 | 16 | 17.4 | 34 | 33 |
| Rarely | 100 | 10.5 | 46 | 11.4 | 54 | 9.8 | 39 | 13.2 | 22 | 8.7 | 17 | 8 | 9 | 9.8 | 13 | 12.6 |
| Never or I don’t eat | 21 | 2.2 | 11 | 2.7 | 10 | 1.8 | 16 | 5.4 | 2 | 0.8 | 2 | 0.9 | 1 | 1.1 | 0 | 0 |
| Nuts and seeds | ||||||||||||||||
| At least once every day | 121 | 12.7 | 44 | 11 | 77 | 13.9 | 1 | 0.3 | 38 | 15 | 64 | 30.2 | 17 | 18.5 | 1 | 1 |
| Almost every day | 181 | 19 | 76 | 19 | 105 | 19 | 12 | 4.1 | 75 | 29.5 | 73 | 34.4 | 16 | 17.4 | 5 | 4.9 |
| Sometimes | 323 | 33.9 | 137 | 34.2 | 186 | 33.7 | 63 | 21.3 | 101 | 39.8 | 58 | 27.4 | 39 | 42.4 | 62 | 60.2 |
| Rarely | 262 | 27.5 | 113 | 28.2 | 149 | 27 | 170 | 57.4 | 31 | 12.2 | 15 | 7.1 | 15 | 16.3 | 31 | 30.1 |
| Never or I don’t eat | 66 | 6.9 | 31 | 7.7 | 35 | 6.3 | 50 | 16.9 | 8 | 3.1 | 1 | 0.5 | 3 | 3.3 | 4 | 3.9 |
| Fruit and vegetable juice | ||||||||||||||||
| At least once every day | 121 | 12.7 | 63 | 15.7 | 58 | 10.5 | 29 | 9.8 | 41 | 16.1 | 26 | 12.3 | 12 | 13 | 13 | 12.6 |
| Almost every day | 129 | 13.6 | 61 | 15.2 | 68 | 12.4 | 43 | 14.5 | 42 | 16.5 | 25 | 11.8 | 11 | 12 | 8 | 7.8 |
| Sometimes | 215 | 22.6 | 113 | 28.2 | 102 | 18.5 | 73 | 24.7 | 46 | 18.1 | 38 | 17.9 | 29 | 31.5 | 29 | 28.2 |
| Rarely | 338 | 35.5 | 114 | 28.4 | 224 | 40.7 | 98 | 33.1 | 89 | 35 | 88 | 41.5 | 28 | 30.4 | 35 | 34 |
| Never or I don’t eat | 148 | 15.6 | 50 | 12.5 | 98 | 17.8 | 50 | 16.9 | 36 | 14.2 | 33 | 15.6 | 11 | 12 | 18 | 17.5 |
| Tea | ||||||||||||||||
| At least once every day | 471 | 49.4 | 180 | 44.8 | 291 | 52.7 | 143 | 48.3 | 125 | 49.2 | 107 | 50.5 | 42 | 45.7 | 54 | 52.4 |
| Almost every day | 131 | 13.7 | 69 | 17.2 | 62 | 11.2 | 38 | 12.8 | 42 | 16.5 | 28 | 13.2 | 11 | 12 | 12 | 11.7 |
| Sometimes | 118 | 12.4 | 55 | 13.7 | 63 | 11.4 | 37 | 12.5 | 32 | 12.6 | 27 | 12.7 | 9 | 9.8 | 13 | 12.6 |
| Rarely | 100 | 10.5 | 48 | 11.9 | 52 | 9.4 | 31 | 10.5 | 27 | 10.6 | 20 | 9.4 | 14 | 15.2 | 8 | 7.8 |
| Never or I don’t eat | 134 | 14 | 50 | 12.4 | 84 | 15.2 | 46 | 15.5 | 28 | 11 | 30 | 14.2 | 15 | 16.3 | 15 | 14.6 |
| Coffee | ||||||||||||||||
| At least once every day | 563 | 48.4 | 184 | 45.7 | 279 | 50.5 | 137 | 46.3 | 124 | 48.8 | 110 | 51.9 | 42 | 45.7 | 50 | 48.5 |
| Almost every day | 135 | 14.1 | 66 | 16.4 | 69 | 12.5 | 41 | 13.9 | 49 | 19.3 | 18 | 8.5 | 17 | 18.5 | 10 | 9.7 |
| Sometimes | 94 | 9.8 | 44 | 10.9 | 50 | 9 | 21 | 7.1 | 23 | 9.1 | 28 | 13.2 | 11 | 12 | 11 | 10.7 |
| Rarely | 71 | 7.4 | 35 | 8.7 | 36 | 6.5 | 29 | 9.8 | 11 | 4.3 | 17 | 8 | 4 | 4.3 | 10 | 9.7 |
| Never or I don’t eat | 193 | 20.2 | 74 | 18.4 | 119 | 21.5 | 68 | 23 | 46 | 18.1 | 39 | 18.4 | 18 | 19.6 | 22 | 21.4 |
| Dairy | ||||||||||||||||
| At least once every day | 614 | 64.3 | 261 | 65.1 | 353 | 63.7 | 210 | 70.9 | 188 | 74 | 115 | 54.2 | 20 | 21.7 | 81 | 78.6 |
| Almost every day | 191 | 20 | 85 | 21.2 | 106 | 19.1 | 60 | 20.3 | 62 | 24.4 | 33 | 15.6 | 21 | 22.8 | 15 | 14.6 |
| Sometimes | 81 | 8.5 | 36 | 9 | 45 | 8.1 | 20 | 6.8 | 4 | 1.6 | 32 | 15.1 | 20 | 21.7 | 5 | 4.9 |
| Rarely | 30 | 3.1 | 13 | 3.2 | 17 | 3.1 | 6 | 2 | 0 | 0 | 9 | 4.2 | 15 | 16.3 | 0 | 0 |
| Never or I don’t eat | 39 | 4.1 | 6 | 1.5 | 33 | 6 | 0 | 0 | 0 | 0 | 23 | 10.8 | 14 | 15.2 | 2 | 1.9 |
| Eggs | ||||||||||||||||
| At least once every day | 159 | 16.6 | 72 | 17.9 | 87 | 15.7 | 45 | 15.2 | 81 | 31.9 | 8 | 3.8 | 16 | 17.4 | 9 | 8.7 |
| Almost every day | 325 | 34 | 123 | 30.5 | 202 | 36.5 | 89 | 30.1 | 144 | 56.7 | 40 | 18.9 | 25 | 27.2 | 27 | 26.2 |
| Sometimes | 351 | 36.7 | 162 | 40.2 | 189 | 34.1 | 120 | 40.5 | 28 | 11 | 97 | 45.8 | 39 | 42.4 | 67 | 65 |
| Rarely | 78 | 8.2 | 32 | 7.9 | 46 | 8.3 | 35 | 11.8 | 1 | 0.4 | 33 | 15.6 | 9 | 9.8 | 0 | 0 |
| Never or I don’t eat | 44 | 4.6 | 14 | 3.5 | 30 | 5.4 | 7 | 2.4 | 0 | 0 | 34 | 16 | 3 | 3.3 | 0 | 0 |
| Seafood | ||||||||||||||||
| At least once every day | 24 | 2.5 | 15 | 3.7 | 9 | 1.6 | 0 | 0 | 2 | 0.8 | 1 | 0.5 | 21 | 22.8 | 0 | 0 |
| Almost every day | 118 | 12.3 | 62 | 15.4 | 56 | 10.1 | 20 | 6.8 | 46 | 18.1 | 14 | 6.6 | 38 | 41.3 | 0 | 0 |
| Sometimes | 394 | 41.2 | 172 | 42.7 | 222 | 40.1 | 147 | 49.7 | 117 | 46.1 | 68 | 32.1 | 26 | 28.3 | 36 | 35 |
| Rarely | 256 | 26.8 | 98 | 24.3 | 158 | 28.5 | 95 | 32.1 | 54 | 21.3 | 55 | 25.9 | 7 | 7.6 | 45 | 43.7 |
| Never or I don’t eat | 165 | 17.2 | 56 | 13.9 | 109 | 19.7 | 34 | 11.5 | 35 | 13.8 | 74 | 34.9 | 0 | 0 | 22 | 21.4 |
| Red meat | ||||||||||||||||
| At least once every day | 50 | 5.2 | 34 | 8.5 | 16 | 2.9 | 22 | 7.4 | 14 | 5.5 | 2 | 0.9 | 7 | 7.6 | 5 | 4.9 |
| Almost every day | 228 | 23.9 | 122 | 30.3 | 106 | 19.2 | 109 | 36.8 | 59 | 23.2 | 13 | 6.1 | 11 | 12 | 36 | 35 |
| Sometimes | 410 | 43 | 163 | 40.5 | 247 | 44.8 | 139 | 47 | 132 | 52 | 41 | 19.3 | 46 | 50 | 52 | 50.5 |
| Rarely | 141 | 14.8 | 53 | 13.2 | 88 | 16 | 15 | 5.1 | 49 | 19.3 | 49 | 23.1 | 18 | 19.6 | 10 | 9.7 |
| Never or I don’t eat | 124 | 13 | 30 | 7.5 | 94 | 17.1 | 7 | 2.4 | 0 | 0 | 107 | 50.5 | 10 | 10.9 | 0 | 0 |
| White meat | ||||||||||||||||
| At least once every day | 78 | 8.2 | 42 | 10.4 | 36 | 6.5 | 32 | 10.8 | 20 | 7.9 | 10 | 4.7 | 10 | 10.9 | 6 | 5.8 |
| Almost every day | 360 | 37.8 | 151 | 37.6 | 209 | 37.9 | 161 | 54.4 | 92 | 36.2 | 36 | 17 | 25 | 27.2 | 46 | 44.7 |
| Sometimes | 355 | 37.3 | 156 | 38.8 | 199 | 36.1 | 96 | 32.4 | 126 | 49.6 | 46 | 21.7 | 41 | 44.6 | 46 | 44.7 |
| Rarely | 54 | 5.7 | 27 | 6.7 | 27 | 4.9 | 7 | 2.4 | 12 | 4.7 | 27 | 12.7 | 5 | 5.4 | 3 | 2.9 |
| Never or I don’t eat | 106 | 11.1 | 26 | 6.5 | 80 | 14.5 | 0 | 0 | 2 | 0.8 | 93 | 43.9 | 9 | 9.8 | 2 | 1.9 |
| Confectionary | ||||||||||||||||
| At least once every day | 188 | 19.7 | 62 | 15.4 | 126 | 22.8 | 66 | 22.3 | 44 | 17.3 | 42 | 19.8 | 13 | 14.1 | 23 | 22.3 |
| Almost every day | 303 | 31.7 | 114 | 28.3 | 189 | 34.2 | 95 | 32.1 | 79 | 31.1 | 68 | 32.1 | 27 | 29.3 | 34 | 33 |
| Sometimes | 320 | 33.5 | 138 | 34.2 | 182 | 33 | 102 | 34.5 | 94 | 37 | 58 | 27.4 | 35 | 38 | 31 | 30.1 |
| Rarely | 120 | 12.6 | 73 | 18.1 | 47 | 8.5 | 25 | 8.4 | 31 | 12.2 | 37 | 17.5 | 14 | 15.2 | 13 | 12.6 |
| Never or I don’t eat | 24 | 2.5 | 16 | 4 | 8 | 1.4 | 8 | 2.7 | 6 | 2.4 | 5 | 2.4 | 3 | 3.3 | 2 | 1.9 |
| Consumption and Frequency | Omnivorous (n = 606) | Flexitarian (n = 218) | Pescatarian (n = 32) | Vegetarian (n = 76) | Vegan (n = 25) | |||||
| n | % | n | % | n | % | n | % | n | % | |
| Dairy | ||||||||||
| At least once every day | 435 | 71.8 | 126 | 58.1 | 14 | 43.8 | 35 | 46.7 | 4 | 16.0 |
| Almost every day | 111 | 18.3 | 52 | 24.0 | 7 | 21.9 | 20 | 26.7 | 1 | 4.0 |
| Sometimes | 36 | 5.9 | 23 | 10.6 | 6 | 18.8 | 15 | 20.0 | 1 | 4.0 |
| Rarely | 14 | 2.3 | 9 | 4.1 | 2 | 6.3 | 2 | 2.7 | 3 | 12.0 |
| Never or I don’t eat | 10 | 1.7 | 7 | 3.2 | 3 | 9.4 | 3 | 4.0 | 16 | 64.0 |
| Eggs | ||||||||||
| At least once every day | 113 | 18.6 | 33 | 15.1 | 2 | 6.3 | 11 | 14.5 | 1 | 4.0 |
| Almost every day | 214 | 35.3 | 75 | 34.4 | 12 | 37.5 | 23 | 30.3 | 2 | 8.0 |
| Sometimes | 230 | 38.0 | 85 | 39.0 | 14 | 43.8 | 20 | 26.3 | 2 | 8.0 |
| Rarely | 38 | 6.3 | 21 | 9.6 | 3 | 9.4 | 14 | 18.4 | - | - |
| Never or I don’t eat | 11 | 1.8 | 4 | 1.8 | 1 | 3.1 | 8 | 10.5 | 20 | 80.0 |
| Seafood | ||||||||||
| At least once every day | 11 | 1.8 | 7 | 3.2 | 3 | 9.4 | 3 | 3.9 | 2 | 8.0 |
| Almost every day | 70 | 11.6 | 32 | 14.7 | 8 | 25.0 | 6 | 7.9 | - | - |
| Sometimes | 286 | 47.2 | 77 | 35.3 | 15 | 46.9 | 15 | 19.7 | 1 | 4.0 |
| Rarely | 180 | 29.7 | 56 | 25.7 | 6 | 18.8 | 13 | 17.1 | 1 | 4.0 |
| Never or I don’t eat | 59 | 9.7 | 46 | 21.1 | - | - | 39 | 51.3 | 21 | 84.0 |
| Red meat | ||||||||||
| At least once every day | 39 | 6.5 | 6 | 2.8 | 1 | 3.1 | 4 | 5.3 | 1 | 4.0 |
| Almost every day | 184 | 30.5 | 38 | 17.6 | 1 | 3.1 | 4 | 5.3 | - | - |
| Sometimes | 310 | 51.3 | 90 | 41.7 | - | - | 9 | 11.8 | 1 | 4.0 |
| Rarely | 63 | 10.4 | 65 | 30.1 | 2 | 6.3 | 10 | 13.2 | 1 | 4.0 |
| Never or I don’t eat | 8 | 1.3 | 17 | 7.9 | 28 | 87.5 | 49 | 64.5 | 22 | 88.0 |
| Non-red meat | ||||||||||
| At least once every day | 61 | 10.1 | 15 | 6.9 | 1 | 3.1 | 1 | 1.3 | - | - |
| Almost every day | 280 | 46.4 | 66 | 30.6 | 1 | 3.1 | 10 | 13.2 | 3 | 12.0 |
| Sometimes | 238 | 39.4 | 106 | 49.1 | 1 | 3.1 | 9 | 11.8 | 1 | 4.0 |
| Rarely | 21 | 3.5 | 21 | 9.7 | 2 | 6.3 | 10 | 13.2 | - | - |
| Never or I don’t eat | 4 | 0.7 | 8 | 3.7 | 27 | 84.4 | 46 | 60.5 | 21 | 84.0 |
| Meat-focused (n = 296) | Dairy/ovo-focused (n = 254) | Vegetable-focused (n = 212) | Seafood-focused (n = 92) | Potato-focused (n = 103) | ||||||
| n | % | n | % | n | % | n | % | n | % | |
| Dairy | 210 | 70.9 | 188 | 74.0 | 115 | 54.2 | 20 | 21.7 | 81 | 78.6 |
| At least once every day | 60 | 20.3 | 62 | 24.4 | 33 | 15.6 | 21 | 22.8 | 15 | 14.6 |
| Almost every day | 20 | 6.8 | 4 | 1.6 | 32 | 15.1 | 20 | 21.7 | 5 | 4.9 |
| Sometimes | 6 | 2.0 | 0 | 0.0 | 9 | 4.2 | 15 | 16.3 | 0 | 0.0 |
| Rarely | 0 | 0.0 | 0 | 0.0 | 23 | 10.8 | 14 | 15.2 | 2 | 1.9 |
| Never or I don’t eat | ||||||||||
| Eggs | 45 | 15.2 | 81 | 31.9 | 8 | 3.8 | 16 | 17.4 | 9 | 8.7 |
| At least once every day | 89 | 30.1 | 144 | 56.7 | 40 | 18.9 | 25 | 27.2 | 27 | 26.2 |
| Almost every day | 120 | 40.5 | 28 | 11.0 | 97 | 45.8 | 39 | 42.4 | 67 | 65.0 |
| Sometimes | 35 | 11.8 | 1 | 0.4 | 33 | 15.6 | 9 | 9.8 | 0 | 0.0 |
| Rarely | 7 | 2.4 | 0 | 0.0 | 34 | 16.0 | 3 | 3.3 | 0 | 0.0 |
| Never or I don’t eat | ||||||||||
| Seafood | 0 | 0.0 | 2 | 0.8 | 1 | 0.5 | 21 | 22.8 | 0 | 0.0 |
| At least once every day | 20 | 6.8 | 46 | 18.1 | 14 | 6.6 | 38 | 41.3 | 0 | 0.0 |
| Almost every day | 147 | 49.7 | 117 | 46.1 | 68 | 32.1 | 26 | 28.3 | 36 | 35.0 |
| Sometimes | 95 | 32.1 | 54 | 21.3 | 55 | 25.9 | 7 | 7.6 | 45 | 43.7 |
| Rarely | 34 | 11.5 | 35 | 13.8 | 74 | 34.9 | 0 | 0.0 | 22 | 21.4 |
| Never or I don’t eat | ||||||||||
| Red meat | 22 | 7.4 | 14 | 5.5 | 2 | 0.9 | 7 | 7.6 | 5 | 4.9 |
| At least once every day | 109 | 36.8 | 59 | 23.2 | 13 | 6.1 | 11 | 12.0 | 36 | 35.0 |
| Almost every day | 139 | 47.0 | 132 | 52.0 | 41 | 19.3 | 46 | 50.0 | 52 | 50.5 |
| Sometimes | 15 | 5.1 | 49 | 19.3 | 49 | 23.1 | 18 | 19.6 | 10 | 9.7 |
| Rarely | 7 | 2.4 | 0 | 0.0 | 107 | 50.5 | 10 | 10.9 | 0 | 0.0 |
| Never or I don’t eat | ||||||||||
| Non-red meat | 32 | 10.8 | 20 | 7.9 | 10 | 4.7 | 10 | 10.9 | 6 | 5.8 |
| At least once every day | 161 | 54.4 | 92 | 36.2 | 36 | 17.0 | 25 | 27.2 | 46 | 44.7 |
| Almost every day | 96 | 32.4 | 126 | 49.6 | 46 | 21.7 | 41 | 44.6 | 46 | 44.7 |
| Sometimes | 7 | 2.4 | 12 | 4.7 | 27 | 12.7 | 5 | 5.4 | 3 | 2.9 |
| Rarely | 0 | 0.0 | 2 | 0.8 | 93 | 43.9 | 9 | 9.8 | 2 | 1.9 |
| Never or I don’t eat | 210 | 70.9 | 188 | 74.0 | 115 | 54.2 | 20 | 21.7 | 81 | 78.6 |
References
- Abarca-Gómez, L.; Abdeen, Z.A.; Hamid, Z.A.; Abu-Rmeileh, N.M.; Acosta-Cazares, B.; Acuin, C.; Adams, R.J.; Aekplakorn, W.; Afsana, K.; Aguilar-Salinas, C.A.; et al. Worldwide trends in body-mass index, underweight, overweight, and obesity from 1975 to 2016: A pooled analysis of 2416 population-based measurement studies in 128·9 million children, adolescents, and adults. Lancet 2017, 390, 2627–2642. [Google Scholar] [CrossRef] [PubMed]
- Willett, W.; Rockström, J.; Loken, B.; Springmann, M.; Lang, T.; Vermeulen, S.; Garnett, T.; Tilman, D.; DeClerck, F.; Wood, A.; et al. Food in the Anthropocene: The EAT-Lancet Commission on healthy diets from sustainable food systems. Lancet 2019, 393, 447–492. [Google Scholar] [CrossRef]
- Conzade, R.; Koenig, W.; Heier, M.; Schneider, A.; Grill, E.; Peters, A.; Thorand, B. Prevalence and Predictors of Subclinical Micronutrient Deficiency in German Older Adults: Results from the Population-Based KORA-Age Study. Nutrients 2017, 9, 1276. [Google Scholar] [CrossRef] [PubMed]
- Żarnowski, A.; Jankowski, M.; Gujski, M. Public Awareness of Diet-Related Diseases and Dietary Risk Factors: A 2022 Nationwide Cross-Sectional Survey among Adults in Poland. Nutrients 2022, 14, 3285. [Google Scholar] [CrossRef] [PubMed]
- WHO. Global Health Estimates 2019: Deaths by Cause, Age, Sex, by Country and by Region, 2000–2019; World Health Organization: Geneva, Switzerland, 2020. [Google Scholar]
- Neuhouser, M.L. The importance of healthy dietary patterns in chronic disease prevention. Nutr. Res. 2019, 70, 3–6. [Google Scholar] [CrossRef]
- Cena, H.; Calder, P.C. Defining a Healthy Diet: Evidence for The Role of Contemporary Dietary Patterns in Health and Disease. Nutrients 2020, 12, 334. [Google Scholar] [CrossRef]
- Boudou, M.; ÓhAiseadha, C.; Garvey, P.; O’Dwyer, J.; Hynds, P. Modelling COVID-19 severity in the Republic of Ireland using patient co-morbidities, socioeconomic profile and geographic location, February to November 2020. Sci. Rep. 2021, 11, 18474. [Google Scholar] [CrossRef]
- Van Doorn, D.; Richardson, N.; Storey, A.; Osborne, A.; Cunningham, C.; Blake, C.; McNamara, J. Investigating the Dietary Habits of Male Irish Farmers to Prevent Mortality and Morbidity. Safety 2021, 7, 54. [Google Scholar] [CrossRef]
- Lange, K.W. Food science and COVID-19. Food Sci. Hum. Wellness 2021, 10, 1–5. [Google Scholar] [CrossRef]
- DoH. Healthy Ireland Summary Report 2022; Department of Health: Dublin, Ireland, 2022. [Google Scholar]
- HSE. A Healthy Weight for Ireland: Obesity Policy and Action Plan 2016–2025; Health Service Executive: Dublin, Ireland, 2016. [Google Scholar]
- WHO. Global Status Report on Noncommunicable Diseases 2014; World Health Organization: Geneva, Switzerland, 2014. [Google Scholar]
- Naja, F.; Nasreddine, L.; Itani, L.; Chamieh, M.C.; Adra, N.; Sibai, A.M.; Hwalla, N. Dietary patterns and their association with obesity and sociodemographic factors in a national sample of Lebanese adults. Public Health Nutr. 2011, 14, 1570–1578. [Google Scholar] [CrossRef]
- Ax, E.; Warensjö Lemming, E.; Becker, W.; Andersson, A.; Lindroos, A.K.; Cederholm, T.; Sjögren, P.; Fung, T.T. Dietary patterns in Swedish adults; results from a national dietary survey. Br. J. Nutr. 2016, 115, 95–104. [Google Scholar] [CrossRef] [PubMed]
- Dwyer-Lindgren, L.; Bertozzi-Villa, A.; Stubbs, R.W.; Morozoff, C.; Kutz, M.J.; Huynh, C.; Barber, R.M.; Shackelford, K.A.; Mackenbach, J.P.; van Lenthe, F.J.; et al. US County-Level Trends in Mortality Rates for Major Causes of Death, 1980–2014. Jama 2016, 316, 2385–2401. [Google Scholar] [CrossRef] [PubMed]
- Kesse-Guyot, E.; Bertrais, S.; Péneau, S.; Estaquio, C.; Dauchet, L.; Vergnaud, A.C.; Czernichow, S.; Galan, P.; Hercberg, S.; Bellisle, F. Dietary patterns and their sociodemographic and behavioural correlates in French middle-aged adults from the SU.VI.MAX cohort. Eur. J. Clin. Nutr. 2009, 63, 521–528. [Google Scholar] [CrossRef] [PubMed]
- Gorst-Rasmussen, A.; Dahm, C.C.; Dethlefsen, C.; Scheike, T.; Overvad, K. Exploring Dietary Patterns By Using the Treelet Transform. Am. J. Epidemiol. 2011, 173, 1097–1104. [Google Scholar] [CrossRef] [PubMed]
- Jessri, M.; Wolfinger, R.D.; Lou, W.Y.; L’Abbé, M.R. Identification of dietary patterns associated with obesity in a nationally representative survey of Canadian adults: Application of a priori, hybrid, and simplified dietary pattern techniques. Am. J. Clin. Nutr. 2017, 105, 669–684. [Google Scholar] [CrossRef]
- Chen, L.; Zhu, H.; Gutin, B.; Dong, Y. Race, Gender, Family Structure, Socioeconomic Status, Dietary Patterns, and Cardiovascular Health in Adolescents. Curr. Dev. Nutr. 2019, 3, nzz117. [Google Scholar] [CrossRef]
- Chen, L.; Zhu, H.; Gutin, B.; Dong, Y. The climatic impact of food consumption in a representative sample of Irish adults and implications for food and nutrition policy. Public Health Nutr. 2017, 20, 726–738. [Google Scholar]
- Gibney, M.J.; O’Sullivan, A.; Flynn, A.; Walton, J.; Daniel, H.; Manios, Y.; Martinez, A.; Saris, W.H.M.; Gibney, E.R.; Uzhova, I. Analysis of the National Adult Nutrition Survey (Ireland) and the Food4Me Nutrition Survey Databases to explore the development of food labelling portion sizes for the European Union. Nutrients 2018, 11, 6. [Google Scholar] [CrossRef]
- Lyons, O.C.; Flynn, M.A.T.; Corish, C.A.; Gibney, E.R.; Kerr, M.A.; McKenna, M.J.; McNulty, H.; McSorley, E.M.; Nugent, A.P.; O’Brien, C. Nutrition policy: Developing scientific recommendations for food-based dietary guidelines for older adults living independently in Ireland. Proc. Nutr. Soc. 2022, 81, 49–61. [Google Scholar] [CrossRef]
- Kelly, C.; Callaghan, M.; Molcho, M.; Nic Gabhainn, S.; Alforque Thomas, A. Food environments in and around post-primary schools in Ireland: Associations with youth dietary habits. Appetite 2019, 132, 182–189. [Google Scholar] [CrossRef]
- Murphy, J.J.; MacDonncha, C.; Murphy, M.H.; Murphy, N.; Timperio, A.; Leech, R.M.; Woods, C.B. Identification of health-related behavioural clusters and their association with demographic characteristics in Irish university students. BMC Public Health 2019, 19, 121. [Google Scholar] [CrossRef] [PubMed]
- Daly, A.N.; O’Sullivan, E.J.; Walton, J.; McNulty, B.A.; Kearney, J.M. Eating behaviour styles in Irish teens: A cross-sectional study. Public Health Nutr. 2021, 24, 2144–2152. [Google Scholar] [CrossRef]
- WHO. European Regional Obesity Report 2022; World Health Organization: Copenhagen, Denmark; WHO Regional Office for Europe: Copenhagen, Denmark, 2022. [Google Scholar]
- Walsh, C.; Walsh, J. Demographic and socio-economic change in Ireland: A spatial perspective. Scott. Aff. 2008, 64, 53–66. [Google Scholar] [CrossRef]
- CSO. Census 2016 Summary Results—Part 1; Central Statistics Office: Cork, Ireland, 2017. [Google Scholar]
- King-O’Riain, R.C. How the Irish became more than white: Mixed-race Irishness in historical and contemporary contexts. J. Ethn. Migr. Stud. 2021, 47, 821–837. [Google Scholar] [CrossRef]
- CSO. Urban and Rural Life in Ireland 2019; Central Statistics Office: Cork, Ireland, 2019. [Google Scholar]
- Daly, A.N.; O’Sullivan, E.J.; Walton, J.; McNulty, B.A.; Kearney, J.M. Sociodemographic determinants of perceived influences on food choice in a nationally representative sample of Irish adults. Public Health Nutr. 2000, 3, 219–226. [Google Scholar]
- Martikainen, P.; Brunner, E.; Marmot, M. Socioeconomic differences in dietary patterns among middle-aged men and women. Soc. Sci. Med. 2003, 56, 1397–1410. [Google Scholar] [CrossRef] [PubMed]
- Kell, K.P.; Judd, S.E.; Pearson, K.E.; Shikany, J.M.; Fernández, J.R. Associations between socio-economic status and dietary patterns in US black and white adults. Br. J. Nutr. 2015, 113, 1792–1799. [Google Scholar] [CrossRef]
- CSO. Census of Population 2022—Preliminary Results; Central Statistics Office: Cork, Ireland, 2022. [Google Scholar]
- CSO. Census 2016 Published Reports; Central Statistics Office: Cork, Ireland, 2016. [Google Scholar]
- McGuire, S. Scientific Report of the 2015 Dietary Guidelines Advisory Committee. Washington, DC: US Departments of Agriculture and Health and Human Services, 2015. Adv. Nutr. 2016, 7, 202–204. [Google Scholar] [CrossRef]
- CSO. Measuring Distance to Everyday Services in Ireland; Central Statistics Office, CSO Statistical Publication: Dublin, Ireland, 2019. [Google Scholar]
- WHO. Body Mass Index—BMI. Available online: www.euro.who.int/en/health-topics/disease-prevention/nutrition/a-healthy-lifestyle/body-mass-index-bmi (accessed on 20 April 2022).
- Fung, T.T.; Rimm, E.B.; Spiegelman, D.; Rifai, N.; Tofler, G.H.; Willett, W.C.; Hu, F.B. Association between dietary patterns and plasma biomarkers of obesity and cardiovascular disease risk. Am. J. Clin. Nutr. 2001, 73, 61–67. [Google Scholar] [CrossRef]
- Medina-Remón, A.; Kirwan, R.; Lamuela-Raventós, R.M.; Estruch, R. Dietary patterns and the risk of obesity, type 2 diabetes mellitus, cardiovascular diseases, asthma, and neurodegenerative diseases. Crit. Rev. Food Sci. Nutr. 2018, 58, 262–296. [Google Scholar] [CrossRef]
- McNutt, S.; Zimmerman, T.P.; Hull, S.G. Development of food composition databases for food frequency questionnaires (FFQ). J. Food Compos. Anal. 2008, 21, S20–S26. [Google Scholar] [CrossRef]
- Harrington, J.; Perry, I.; Lutomski, J.; Morgan, K.; Mc Gee, H.; Shelley, E.; Watson, D.; Barry, M. SLAN 2007: Survey of Lifestyle, Attitudes and Nutrition in Ireland. Dietary Habits of the Irish Populatio. Report; Royal College of Surgeons in Ireland: Dublin, Ireland, 2008. [Google Scholar] [CrossRef]
- IUNA. National Adult Nutrition Survey; Irish Universities Nutrition Alliance: Dublin, Ireland, 2011. [Google Scholar]
- Lavallee, S.; Hynds, P.D.; Brown, R.S.; Majury, A. Classification of sub-populations for quantitative risk assessment based on awareness and perception: A cross-sectional population study of private well users in Ontario. Sci. Total Environ. 2023, 857, 159677. [Google Scholar] [CrossRef]
- Tropea, E.; Hynds, P.; McDermott, K.; Brown, R.S.; Majury, A. Environmental adaptation of E. coli within private groundwater sources in southeastern Ontario: Implications for groundwater quality monitoring and human health. Environ. Pollut. 2021, 285, 117263. [Google Scholar] [CrossRef]
- Cattell, R.B. The scree test for the number of factors. Multivar. Behav. Res. 1966, 1, 245–276. [Google Scholar] [CrossRef] [PubMed]
- Gorsuch, R.L. Factor Analysis: Classic Edition; Routledge: London, UK, 2014. [Google Scholar]
- Kline, P. An Easy Guide to Factor Analysis; Routledge: London, UK, 2014. [Google Scholar]
- Hearty, Á.P.; Gibney, M.J. Dietary patterns in Irish adolescents: A comparison of cluster and principal component analyses. Public Health Nutr. 2013, 16, 848–857. [Google Scholar] [CrossRef] [PubMed]
- Northstone, K.; Smith, A.D.; Cribb, V.L.; Emmett, P.M. Dietary patterns in UK adolescents obtained from a dual-source FFQ and their associations with socio-economic position, nutrient intake and modes of eating. Public Health Nutr. 2014, 17, 1476–1485. [Google Scholar] [CrossRef] [PubMed]
- Northstone, K.; Emmett, P. The associations between feeding difficulties and behaviours and dietary patterns at 2 years of age: The ALSPAC cohort. Matern. Child Nutr 2013, 9, 533–542. [Google Scholar] [CrossRef]
- Flynn, A.; Seed, P.; Patel, N.; Barr, S.; Bell, R.; Briley, A.; Godfrey, K.; Nelson, S.; Oteng-Ntim, E.; Robinson, S.; et al. Dietary patterns in obese pregnant women; Influence of a behavioral intervention of diet and physical activity in the UPBEAT randomized controlled trial. Int. J. Behav. Nutr. Phys. Act. 2016, 13, 124. [Google Scholar] [CrossRef]
- Cozzolino, D.; Power, A.; Chapman, J. Interpreting and Reporting Principal Component Analysis in Food Science Analysis and Beyond. Food Anal. Methods 2019, 12, 2469–2473. [Google Scholar] [CrossRef]
- Bord Bia. Dietary Lifestyle Report; Bord Bia: New York, NY, USA, 2021. [Google Scholar]
- Hearty, A.P.; Gibney, M.J. Comparison of cluster and principal component analysis techniques to derive dietary patterns in Irish adults. Br. J. Nutr. 2009, 101, 598–608. [Google Scholar] [CrossRef]
- Prendiville, O.; Walton, J.; Flynn, A.; Nugent, A.P.; McNulty, B.A.; Brennan, L. Classifying Individuals Into a Dietary Pattern Based on Metabolomic Data. Mol. Nutr. Food Res. 2021, 65, e2001183. [Google Scholar] [CrossRef]
- Bedford, J.L.; Barr, S.I. Diets and selected lifestyle practices of self-defined adult vegetarians from a population-based sample suggest they are more ‘health conscious’. Int. J. Behav. Nutr. Phys. Act. 2005, 2, 4. [Google Scholar] [CrossRef] [PubMed]
- Juan, W.; Yamini, S.; Britten, P. Food Intake Patterns of Self-identified Vegetarians Among the U.S. Population, 2007–2010. Procedia Food Sci. 2015, 4, 86–93. [Google Scholar] [CrossRef]
- Lehto, E.; Kaartinen, N.E.; Sääksjärvi, K.; Männistö, S.; Jallinoja, P. Vegetarians and different types of meat eaters among the Finnish adult population from 2007 to 2017. Br. J. Nutr. 2022, 127, 1060–1072. [Google Scholar] [CrossRef] [PubMed]
- Mihrshahi, S.; Ding, D.; Gale, J.; Allman-Farinelli, M.; Banks, E.; Bauman, A.E. Vegetarian diet and all-cause mortality: Evidence from a large population-based Australian cohort—The 45 and Up Study. Prev. Med. 2017, 97, 1–7. [Google Scholar] [CrossRef] [PubMed]
- Wozniak, H.; Larpin, C.; de Mestral, C.; Guessous, I.; Reny, J.-L.; Stringhini, S. Vegetarian, pescatarian and flexitarian diets: Sociodemographic determinants and association with cardiovascular risk factors in a Swiss urban population. Br. J. Nutr. 2020, 124, 844–852. [Google Scholar] [CrossRef]
- Gastaldello, A.; Giampieri, F.; De Giuseppe, R.; Grosso, G.; Baroni, L.; Battino, M. The rise of processed meat alternatives: A narrative review of the manufacturing, composition, nutritional profile and health effects of newer sources of protein, and their place in healthier diets. Trends Food Sci. Technol. 2022, 127, 263–271. [Google Scholar] [CrossRef]
- Spencer, E.A.; Appleby, P.N.; Davey, G.K.; Key, T.J. Diet and body mass index in 38,000 EPIC-Oxford meat-eaters, fish-eaters, vegetarians and vegans. Int. J. Obes. 2003, 27, 728–734. [Google Scholar] [CrossRef]
- Paradis, A.M.; Godin, G.; Pérusse, L.; Vohl, M.C. Associations between dietary patterns and obesity phenotypes. Int. J. Obes. 2009, 33, 1419–1426. [Google Scholar] [CrossRef]
- Clarys, P.; Deliens, T.; Huybrechts, I.; Deriemaeker, P.; Vanaelst, B.; De Keyzer, W.; Hebbelinck, M.; Mullie, P. Comparison of Nutritional Quality of the Vegan, Vegetarian, Semi-Vegetarian, Pesco-Vegetarian and Omnivorous Diet. Nutrients 2014, 6, 1318–1332. [Google Scholar] [CrossRef]
- Watling, C.Z.; Schmidt, J.A.; Dunneram, Y.; Tong, T.Y.N.; Kelly, R.K.; Knuppel, A.; Travis, R.C.; Key, T.J.; Perez-Cornago, A. Risk of cancer in regular and low meat-eaters, fish-eaters, and vegetarians: A prospective analysis of UK Biobank participants. BMC Med. 2022, 20, 73. [Google Scholar] [CrossRef] [PubMed]
- Gehring, J.; Touvier, M.; Baudry, J.; Julia, C.; Buscail, C.; Srour, B.; Hercberg, S.; Péneau, S.; Kesse-Guyot, E.; Allès, B. Consumption of Ultra-Processed Foods by Pesco-Vegetarians, Vegetarians, and Vegans: Associations with Duration and Age at Diet Initiation. J. Nutr. 2021, 151, 120–131. [Google Scholar] [CrossRef]
- Macdiarmid, J.I. The food system and climate change: Are plant-based diets becoming unhealthy and less environmentally sustainable? Proc. Nutr. Soc. 2022, 81, 162–167. [Google Scholar] [CrossRef]
- Askegaard, S.; Madsen, T.K. The local and the global: Exploring traits of homogeneity and heterogeneity in European food cultures. Int. Bus. Rev. 1998, 7, 549–568. [Google Scholar] [CrossRef]
- Freire, R. Scientific evidence of diets for weight loss: Different macronutrient composition, intermittent fasting, and popular diets. Nutrition 2020, 69, 110549. [Google Scholar] [CrossRef] [PubMed]
- Cambeses-Franco, C.; González-García, S.; Feijoo, G.; Moreira, M.T. Is the Paleo diet safe for health and the environment? Sci. Total Environ. 2021, 781, 146717. [Google Scholar] [CrossRef]
- Mac Con Iomaire, M. The History of Seafood in Irish Cuisine and Culture; Technological University Dublin: Dublin, Ireland, 2004. [Google Scholar]
- Curtin, R. Global Food Consumption Patterns of Interest to the Irish Seafood Sector; An Bord Iascaigh Mhara/Ireland’s Seafood Development Agency: Dublin, Ireland, 2019. [Google Scholar]
- Dale, H.F.; Madsen, L.; Lied, G.A. Fish–derived proteins and their potential to improve human health. Nutr. Rev. 2019, 77, 572–583. [Google Scholar] [CrossRef]
- Rundle, A.; Field, S.; Park, Y.; Freeman, L.; Weiss, C.C.; Neckerman, K. Personal and neighborhood socioeconomic status and indices of neighborhood walk-ability predict body mass index in New York City. Soc. Sci. Med. 2008, 67, 1951–1958. [Google Scholar] [CrossRef]
- Layte, R.; Harrington, J.; Sexton, E.; Perry, I.J.; Cullinan, J.; Lyons, S. Irish exceptionalism? Local food environments and dietary quality. J. Epidemiol. Community Health 2011, 65, 881–888. [Google Scholar] [CrossRef]
- Koch, F.; Heuer, T.; Krems, C.; Claupein, E. Meat consumers and non-meat consumers in Germany: A characterisation based on results of the German National Nutrition Survey II. J. Nutr. Sci. 2019, 8, e21. [Google Scholar] [CrossRef]
- Kirbiš, A.; Lamot, M.; Javornik, M. The Role of Education in Sustainable Dietary Patterns in Slovenia. Sustainability 2021, 13, 13036. [Google Scholar] [CrossRef]
- Kamphuis, C.B.M.; Giskes, K.; de Bruijn, G.-J.; Wendel-Vos, W.; Brug, J.; van Lenthe, F.J. Environmental determinants of fruit and vegetable consumption among adults: A systematic review. Br. J. Nutr. 2006, 96, 620–635. [Google Scholar] [CrossRef]
- Lee-Kwan, S.H.; Moore, L.V.; Blanck, H.M.; Harris, D.M.; Galuska, D. Disparities in State-Specific Adult Fruit and Vegetable Consumption—United States, 2015. MMWR Morb. Mortal. Wkly. Rep. 2017, 66, 1241–1247. [Google Scholar] [CrossRef]
- OECD. Ireland: Country Health Profile 2021, State of Health in the EU.; European Observatory on Health Systems and Policies: Paris, France, 2021. [Google Scholar]
- Rodrigues, A. The Atlantic Diet—Origin and features. Int. J. Food Stud. 2016, 5, 106–119. [Google Scholar] [CrossRef]
- Carballo-Casla, A.; Ortolá, R.; García-Esquinas, E.; Oliveira, A.; Sotos-Prieto, M.; Lopes, C.; Lopez-Garcia, E.; Rodríguez-Artalejo, F. The Southern European Atlantic Diet and all-cause mortality in older adults. BMC Med. 2021, 19, 36. [Google Scholar] [CrossRef] [PubMed]
- WHO. Interventions on Diet and Physical Activity: What Works: Summary Report; World Health Organization: Geneva, Switzerland, 2009. [Google Scholar]
- Pechey, R.; Jebb, S.A.; Kelly, M.P.; Almiron-Roig, E.; Conde, S.; Nakamura, R.; Shemilt, I.; Suhrcke, M.; Marteau, T.M. Socioeconomic differences in purchases of more vs. less healthy foods and beverages: Analysis of over 25,000 British households in 2010. Soc. Sci. Med. 2013, 92, 22–26. [Google Scholar] [CrossRef]
- Thorpe, M.G.; Milte, C.M.; Crawford, D.; McNaughton, S.A. Education and lifestyle predict change in dietary patterns and diet quality of adults 55 years and over. Nutr. J. 2019, 18, 67. [Google Scholar] [CrossRef] [PubMed]
- Schultz, C.; Thorlton, J. Access to Fresh Fruits and Vegetables in School Lunches: A Policy Analysis. J. Sch. Nurs. 2019, 35, 248–255. [Google Scholar] [CrossRef] [PubMed]
- Turnwald, B.P.; Bertoldo, J.D.; Perry, M.A.; Policastro, P.; Timmons, M.; Bosso, C.; Connors, P.; Valgenti, R.T.; Pine, L.; Challamel, G.; et al. Increasing Vegetable Intake by Emphasizing Tasty and Enjoyable Attributes: A Randomized Controlled Multisite Intervention for Taste-Focused Labeling. Psychol. Sci. 2019, 30, 1603–1615. [Google Scholar] [CrossRef]
- EC. Farm to Fork Strategy: For a Fair, Healthy, and Environmentally-Friendly Food System; European Commission: Brussels, Belgium, 2020. [Google Scholar]
- Cade, J.E.; Burley, V.J.; Warm, D.L.; Thompson, R.L.; Margetts, B.M. Food-frequency questionnaires: A review of their design, validation and utilisation. Nutr. Res. Rev. 2004, 17, 5–22. [Google Scholar] [CrossRef]
- Labonté, M.È.; Cyr, A.; Baril-Gravel, L.; Royer, M.M.; Lamarche, B. Validity and reproducibility of a web-based, self-administered food frequency questionnaire. Eur. J. Clin. Nutr. 2012, 66, 166–173. [Google Scholar] [CrossRef] [PubMed]
- Maugeri, A.; Barchitta, M.; Favara, G.; La Mastra, C.; La Rosa, M.C.; Magnano San Lio, R.; Agodi, A. The Application of Clustering on Principal Components for Nutritional Epidemiology: A Workflow to Derive Dietary Patterns. Nutrients 2023, 15, 195. [Google Scholar] [CrossRef] [PubMed]
- Sartipi, M.; Nedjat, S.; Mansournia, M.A.; Baigi, V.; Fotouhi, A. Assets as a Socioeconomic Status Index: Categorical Principal Components Analysis vs. Latent Class Analysis. Arch. Iran Med. 2016, 19, 791–796. [Google Scholar]
- Sotres-Alvarez, D.; Herring, A.H.; Siega-Riz, A.M. Latent Class Analysis Is Useful to Classify Pregnant Women into Dietary Patterns. J. Nutr. 2010, 140, 2253–2259. [Google Scholar] [CrossRef]
- Dalmartello, M.; Decarli, A.; Ferraroni, M.; Bravi, F.; Serraino, D.; Garavello, W.; Negri, E.; Vermunt, J.; La Vecchia, C. Dietary patterns and oral and pharyngeal cancer using latent class analysis. Int. J. Cancer 2020, 147, 719–727. [Google Scholar] [CrossRef]
- Cui, Q.; Xia, Y.; Wu, Q.; Chang, Q.; Niu, K.; Zhao, Y. A meta-analysis of the reproducibility of food frequency questionnaires in nutritional epidemiological studies. Int. J. Behav. Nutr. Phys. Act. 2021, 18, 12. [Google Scholar] [CrossRef] [PubMed]
- El Mesmoudi, N.; Al Dhaheri, A.S.; Feehan, J.; Stojanovska, L.; Ali, H.I. Validation of a quantitative web-based food frequency questionnaire to assess dietary intake in the adult Emirati population. PLoS ONE 2022, 17, e0262150. [Google Scholar] [CrossRef] [PubMed]


| Characteristics | Total (n = 957) | Male (n = 403) | Female (n = 554) | |||
|---|---|---|---|---|---|---|
| Gender | n | % | n | % | n | % |
| Male | 403 | 42.1 | - | - | ||
| Female | 554 | 57.9 | - | - | ||
| Age range | ||||||
| 18–24 years | 139 | 14.5 | 58 | 14.4 | 81 | 14.6 |
| 25–34 years | 310 | 32.4 | 121 | 30.0 | 189 | 34.1 |
| 35–44 years | 279 | 29.2 | 104 | 25.8 | 174 | 31.6 |
| 45–54 years | 138 | 14.4 | 64 | 15.9 | 74 | 13.4 |
| 55–64 years | 62 | 6.5 | 34 | 8.4 | 28 | 5.1 |
| 65+ years | 29 | 3.0 | 22 | 5.5 | 7 | 1.3 |
| Ethnicity | ||||||
| Irish | 754 | 78.8 | 315 | 78.2 | 439 | 79.2 |
| European/non-Irish | 126 | 13.2 | 53 | 13.2 | 73 | 13.2 |
| African | 17 | 1.8 | 11 | 2.7 | 6 | 1.1 |
| Asian | 46 | 4.8 | 19 | 4.7 | 27 | 4.9 |
| Mix/other | 14 | 1.5 | 5 | 1.2 | 9 | 1.6 |
| Settlement pattern | ||||||
| Urban | 678 | 70.8 | 296 | 73.4 | 382 | 69.0 |
| Rural | 279 | 29.2 | 107 | 26.6 | 172 | 31.0 |
| Pre-tax household income a | ||||||
| <EUR 24,999 | 87 | 10.0 | 41 | 10.9 | 46 | 9.2 |
| EUR 25,000–EUR 49,999 | 266 | 30.5 | 110 | 29.3 | 156 | 31.3 |
| EUR 50,000–EUR 74,999 | 217 | 24.9 | 94 | 25.1 | 123 | 24.7 |
| EUR 75,000–EUR 99,999 | 141 | 16.2 | 60 | 16.0 | 81 | 16.3 |
| EUR 100,000–EUR 124,999 | 92 | 10.5 | 39 | 10.4 | 53 | 10.6 |
| EUR 125,000–EUR 149,999 | 44 | 5.0 | 18 | 4.8 | 26 | 5.2 |
| >EUR 150,000 | 26 | 3.0 | 13 | 3.5 | 13 | 2.6 |
| Respondent education a | ||||||
| Secondary school | 149 | 15.7 | 68 | 17.0 | 81 | 14.7 |
| Technical or vocational | 126 | 13.2 | 72 | 18.0 | 54 | 9.8 |
| Undergraduate degree | 275 | 28.9 | 114 | 28.6 | 161 | 29.2 |
| Postgraduate diploma or degree | 345 | 36.3 | 125 | 31.3 | 220 | 39.9 |
| Doctorate | 56 | 5.9 | 20 | 5.0 | 36 | 6.5 |
| Respondent work status b | ||||||
| Working for payment or profit | 658 | 69.2 | 285 | 71.6 | 373 | 67.5 |
| Looking for first regular job | 18 | 1.9 | 12 | 3.0 | 6 | 1.1 |
| Unemployed | 27 | 2.8 | 12 | 3.0 | 15 | 2.7 |
| Student with a parttime job | 76 | 8.0 | 24 | 6.0 | 52 | 9.4 |
| Student without a parttime job | 69 | 7.3 | 29 | 7.3 | 40 | 7.2 |
| Looking after home/family | 40 | 4.2 | 6 | 1.5 | 34 | 6.1 |
| Retired from employment | 23 | 2.4 | 14 | 3.5 | 9 | 1.6 |
| Unable to work | 14 | 1.5 | 8 | 2.0 | 6 | 1.1 |
| Other | 26 | 2.7 | 8 | 2.0 | 18 | 3.3 |
| Respondent occupation b,c | ||||||
| Education | 134 | 18.4 | 40 | 13.0 | 94 | 22.3 |
| Sales, business, law, and commerce | 120 | 16.5 | 49 | 16.0 | 71 | 16.8 |
| Computing, IT, scientific and technical | 104 | 14.3 | 64 | 20.8 | 40 | 9.5 |
| Engineering, architecture, manufacturing, building, construction | 67 | 9.2 | 48 | 15.6 | 19 | 4.5 |
| Farming, fishing, forestry, and veterinary | 27 | 3.7 | 21 | 6.8 | 6 | 1.4 |
| Healthcare | 82 | 11.2 | 16 | 5.2 | 66 | 15.6 |
| Social services | 12 | 1.6 | 1 | 0.3 | 11 | 2.6 |
| Services | 112 | 15.4 | 43 | 14.0 | 69 | 16.4 |
| Other | 71 | 9.7 | 25 | 8.1 | 46 | 10.9 |
| Household composition | ||||||
| Living alone | 160 | 16.7 | 75 | 18.6 | 85 | 15.3 |
| Living with other adults and/or minors | 797 | 83.3 | 328 | 81.4 | 469 | 84.7 |
| Living with minors | 394 | 41.2 | 167 | 41.4 | 227 | 41.0 |
| Living with adults and no minors | 563 | 58.8 | 236 | 58.6 | 327 | 59.0 |
| Household composition d,e | ||||||
| Children (<18 years old) | 0.77 | 1.1 | 0.79 | 1.1 | 0.75 | 1.1 |
| Adults (≥18 years old) | 2.29 | 1.1 | 2.19 | 1.0 | 2.36 | 1.1 |
| Total household members | 3.06 | 1.6 | 2.98 | 1.5 | 3.12 | 1.6 |
| Health and dietary profile | ||||||
| BMI class f | ||||||
| Underweight (BMI < 18.5) | 31 | 3.4 | 16 | 4.1 | 15 | 2.8 |
| Healthy (BMI 18.5–24.9) | 366 | 39.8 | 147 | 37.7 | 219 | 41.3 |
| Overweight (BMI 25.0–29.9) | 302 | 32.8 | 149 | 38.2 | 153 | 28.9 |
| Obese (BMI > 30.0) | 221 | 24.0 | 78 | 20.0 | 143 | 27.0 |
| Mean BMI (kg/m2) d,e | 26.99 | 6.6 | 26.71 | 5.9 | 27.21 | 7.0 |
| Median BMI (kg/m2) | 25.89 | - | 25.00 | - | 25.73 | - |
| Self-reported health conditions g | ||||||
| Hypertension | 99 | 10.3 | 49 | 12.2 | 50 | 9.0 |
| Diabetes | 47 | 4.9 | 25 | 6.2 | 22 | 4.0 |
| Coronary heart disease | 17 | 1.8 | 10 | 2.5 | 7 | 1.3 |
| Self-reported dietary pattern | ||||||
| Omnivore | 606 | 63.3 | 226 | 66.0 | 340 | 61.4 |
| Flexitarian | 218 | 22.8 | 93 | 23.1 | 125 | 22.6 |
| Pescatarian | 32 | 3.3 | 9 | 2.2 | 23 | 4.2 |
| Vegetarian | 76 | 7.9 | 28 | 6.9 | 48 | 8.7 |
| Vegan | 25 | 2.6 | 7 | 1.7 | 18 | 3.2 |
| Self-reported duration of current diet | ||||||
| Less than 1 year | 92 | 9.7 | 46 | 11.5 | 46 | 8.4 |
| 1 to 5 years | 236 | 24.9 | 105 | 26.2 | 131 | 23.9 |
| 6 to 10 years | 78 | 8.2 | 31 | 7.7 | 47 | 8.6 |
| 11 to 15 years | 28 | 3.0 | 12 | 3.0 | 16 | 2.9 |
| More than 15 years | 515 | 54.3 | 207 | 51.6 | 308 | 56.2 |
| Food Group | Test Statistic | p-Value |
|---|---|---|
| Bread, rice, pasta, grains, oats | 15.443 | 0.492 |
| Vegetables | 26.415 | 0.048 * |
| Potatoes | 36.410 | 0.003 * |
| Bananas, avocados, citrus fruit | 16.616 | 0.411 |
| Other fruit | 15.212 | 0.509 |
| Nuts and seeds | 73.208 | <0.001 * |
| Fruit and vegetable juice | 11.962 | 0.747 |
| Tea | 20.468 | 0.200 |
| Coffee | 21.874 | 0.147 |
| Dairy | 291.397 | <0.001 * |
| Eggs | 366.496 | <0.001 * |
| Seafood | 193.485 | <0.001 * |
| Red meat | 603.364 | <0.001 * |
| Non-red meat | 622.483 | <0.001 * |
| Confectionary | 20.589 | 0.195 |
| Dietary Patterns | |||||
|---|---|---|---|---|---|
| PC1 | PC2 | PC3 | PC4 | PC5 | |
| Food group (variance %) | “Meat-focused” (28.7) | “Dairy/ovo-focused” (18.3) | “Vegetable-focused” (12.1) | “Seafood-focused” (10.6) | “Potato-focused” (9.3) |
| Non-red meat | 0.885 | 0.128 | |||
| Red meat | 0.786 | 0.181 | 0.213 | 0.223 | |
| Dairy | 0.256 | 0.838 | −0.121 | ||
| Seafood | 0.209 | 0.865 | |||
| Potatoes | 0.154 | 0.956 | |||
| Nuts and seeds | −0.203 | 0.655 | 0.446 | ||
| Vegetables | 0.891 | ||||
| Eggs | 0.706 | 0.391 | 0.252 | ||
| Socio-Economic Characteristics | “Meat-Focused” | “Dairy/Ovo-Focused” | “Vegetable-Focused” | “Seafood-Focused” | “Potato-Focused” | p-Value for Target Characteristic |
|---|---|---|---|---|---|---|
| PC1 (n = 296) | PC2 (n = 254) | PC3 (n = 212) | PC4 (n = 92) | PC5 (n = 103) | ||
| n (%) | n (%) | n (%) | n (%) | n (%) | ||
| Sex | <0.001 * | |||||
| Male | 135 (45.6) | 108 (42.5) | 63 (29.7) | 45 (48.9) | 52 (50.5) | |
| Female | 161 (54.4) | 146 (57.5) | 149 (70.3) | 47 (51.1) | 51 (49.5) | |
| Age group | 0.067 | |||||
| 18–24 years | 46 (15.5) | 41 (16.1) | 31 (14.6) | 11 (12.0) | 10 (9.7) | |
| 25–34 years | 105 (35.5) | 81 (31.9) | 71 (33.5) | 31 (33.7) | 22 (21.4) | |
| 35–44 years | 83 (28.0) | 73 (28.7) | 59 (27.8) | 27 (29.3) | 37 (35.9) | |
| 45–54 years | 38 (12.8) | 41 (16.1) | 23 (10.8) | 13 (14.1) | 23 (22.3) | |
| 55–64 years | 14 (4.7) | 15 (5.9) | 20 (9.4) | 4 (4.3) | 9 (8.7) | |
| 65+ years | 10 (3.4) | 3 (1.2) | 8 (3.8) | 6 (6.5) | 2 (1.9) | |
| Ethnicity | <0.001 * | |||||
| Irish | 248 (83.8) | 194 (76.4) | 153 (72.2) | 64 (69.6) | 95 (92.2) | |
| European/non-Irish | 25 (8.4) | 35 (13.8) | 45 (21.2) | 18 (19.6) | 3 (2.9) | |
| African | 9 (3.0) | 3 (1.2) | 0 (0.0) | 2 (2.2) | 3 (2.9) | |
| Asian | 11 (3.7) | 19 (7.5) | 11 (5.2) | 4 (4.3) | 1 (1.0) | |
| Mix/other | 3 (1.0) | 3 (1.2) | 3 (1.4) | 4 (4.3) | 1 (1.0) | |
| Settlement pattern | <0.001 * | |||||
| Urban | 186 (62.8) | 189 (74.4) | 172 (81.1) | 74 (80.4) | 57 (55.3) | |
| Rural | 110 (37.2) | 65 (25.6) | 40 (18.9) | 18 (19.6) | 46 (44.7) | |
| Pre-tax household income a | 0.559 | |||||
| <EUR 24,999 | 27 (9.1) | 20 (7.9) | 24 (11.3) | 10 (10.9) | 6 (5.8) | |
| EUR 25,000–EUR 49,999 | 78 (26.4) | 68 (26.8) | 61 (28.8) | 26 (28.3) | 33 (32.0) | |
| EUR 50,000–EUR 74,999 | 81 (27.4) | 55 (21.7) | 40 (18.9) | 20 (21.7) | 21 (20.4) | |
| EUR 75,000–EUR 99,999 | 45 (15.2) | 37 (14.6) | 34 (16.0) | 8 (8.7) | 17 (16.5) | |
| EUR 100,000–EUR 124,999 | 23 (7.8) | 26 (10.2) | 19 (9.0) | 11 (12.0) | 13 (12.6) | |
| EUR 125,000–EUR 149,999 | 10 (3.4) | 17 (6.7) | 8 (3.8) | 5 (5.4) | 4 (3.9) | |
| >EUR 150,000 | 10 (3.4) | 10 (3.9) | 3 (1.4) | 1 (1.1) | 2 (1.9) | |
| Respondent education b | 0.073 | |||||
| Secondary school | 46 (15.5) | 41 (16.1) | 27 (12.7) | 13 (14.1) | 22 (21.4) | |
| Technical or vocational | 46 (15.5) | 27 (10.6) | 21 (9.9) | 13 (14.1) | 19 (18.4) | |
| Undergraduate degree | 93 (31.4) | 71 (28.0) | 56 (26.4) | 24 (26.1) | 31 (30.1) | |
| Postgraduate diploma or degree | 97 (32.8) | 99 (39.0) | 89 (42.0) | 32 (34.8) | 28 (27.2) | |
| Doctorate | 13 (4.4) | 15 (5.9) | 18 (8.5) | 8 (8.7) | 2 (1.9) | |
| Respondent employment status b | 0.023 * | |||||
| Working for payment or profit | 205 (69.3) | 185 (72.8) | 133 (62.7) | 60 (65.2) | 75 (72.8) | |
| Looking for first regular job | 8 (2.7) | 3 (1.2) | 2 (0.9) | 2 (2.2) | 3 (2.9) | |
| Unemployed | 6 (2.0) | 5 (2.0) | 10 (4.7) | 2 (2.2) | 4 (3.9) | |
| Student with a parttime job | 22 (7.4) | 22 (8.7) | 20 (9.4) | 9 (9.8) | 3 (2.9) | |
| Student without a parttime job | 23 (7.8) | 19 (7.5) | 20 (9.4) | 5 (5.4) | 2 (1.9) | |
| Looking after home/family | 10 (3.4) | 14 (5.5) | 5 (2.4) | 3 (3.3) | 8 (7.8) | |
| Retired from employment | 7 (2.4) | 1 (0.4) | 8 (3.8) | 4 (4.3) | 3 (2.9) | |
| Unable to work | 6 (2.0) | 3 (1.2) | 2 (0.9) | 1 (1.1) | 2 (1.9) | |
| Other | 8 (2.7) | 1 (0.4) | 12 (5.7) | 4 (4.3) | 1 (1.0) | |
| Respondent occupation b,c | 0.017 * | |||||
| Education | 32 (10.8) | 37 (14.6) | 43 (20.3) | 12 (13.0) | 10 (9.7) | |
| Sales, business, law, and commerce | 44 (14.9) | 39 (15.4) | 19 (9.0) | 6 (6.5) | 12 (11.7) | |
| Computing, IT, scientific and technical | 29 (9.8) | 30 (11.8) | 21 (9.9) | 11 (12.0) | 13 (12.6) | |
| Engineering, architecture, manufacturing, building, construction | 30 (10.1) | 12 (4.7) | 8 (3.8) | 11 (12.0) | 6 (5.8) | |
| Farming, fishing, forestry, and veterinary | 8 (2.7) | 11 (4.3) | 2 (0.9) | 1 (1.1) | 5 (4.9) | |
| Healthcare | 21 (7.1) | 27 (10.6) | 16 (7.5) | 10 (10.9) | 8 (7.8) | |
| Social services | 4 (1.4) | 3 (1.2) | 2 (0.9) | 1 (1.1) | 2 (1.9) | |
| Services | 38 (12.8) | 30 (11.8) | 17 (8.0) | 10 (10.9) | 17 (16.5) | |
| Other | 18 (6.1) | 18 (7.1) | 23 (10.8) | 7 (7.6) | 5 (4.9) | |
| Household composition | ||||||
| Living alone | 48 (16.2) | 38 (15.0) | 39 (18.4) | 23 (25.0) | 12 (11.7) | 0.113 |
| Living with other adults and/or minors | 248 (83.8) | 216 (85.0) | 173 (81.6) | 69 (75.0) | 91 (88.3) | 0.113 |
| Living with minors | 120 (40.5) | 114 (44.9) | 66 (31.1) | 37 (40.2) | 57 (55.3) | <0.001 * |
| Living with adults and no minors | 128 (43.2) | 104 (40.9) | 107 (50.5) | 32 (34.8) | 34 (33.0) | 0.018 * |
| Household composition d,e | ||||||
| Children (<18 years old) | 0.74 (1.1) | 0.92 (1.2) | 0.53 (0.9) | 0.68 (1.0) | 1.06 (1.1) | <0.001 * |
| Adults (≥18 years old) | 2.33 (1.1) | 2.30 (1.1) | 2.34 (1.1) | 2.07 (1.1) | 2.26 (1.0) | 0.168 |
| Total household members | 3.06 (1.6) | 3.22 (1.6) | 2.87 (1.4) | 2.75 (1.6) | 3.32 (1.5) | 0.005 * |
| Monthly household food expenses (EUR/month) | <0.001 * | |||||
| Mean (SD) Median | 679 (644.2) 500 | 819 (718.1) 600 | 623 (554.8) 450 | 590 (525.1) 400 | 798 (639.4) 600 | |
| Duration of current diet | <0.001 * | |||||
| Less than 1 year | 30 (10.3) | 25 (9.9) | 15 (7.1) | 16 (17.6) | 6 (5.9) | |
| 1 to 5 years | 38 (13.0) | 64 (25.3) | 83 (39.2) | 31 (34.1) | 20 (19.8) | |
| 6 to 10 years | 15 (5.1) | 20 (7.9) | 27 (12.7) | 7 (7.7) | 9 (8.9) | |
| 11 to 15 years | 4 (1.4) | 11 (4.3) | 10 (4.7) | 3 (3.3) | 0 (0) | |
| More than 15 years | 205 (70.2) | 133 (52.6) | 77 (36.3) | 34 (37.4) | 66 (65.3) |
| PCA-Derived Diet | Socioeconomic Variable | aOR | CI |
|---|---|---|---|
| Meat-focused | Diet duration: more than 15 years | 2.64 | [1.97, 3.54] |
| Occupation: engineering, architecture, manufacturing, building, construction | 1.96 | [1.18, 3.26] | |
| Settlement pattern: rural | 1.72 | [1.28, 2.31] | |
| Education: postgraduate qualification | 0.75 | [0.57, 0.996] | |
| Ethnicity: European/non-Irish | 0.51 | [0.32, 0.81] | |
| Diet duration: 6 to 10 years | 0.51 | [0.29, 0.91] | |
| Diet duration: 1 to 5 years | 0.35 | [0.24, 0.51] | |
| Dairy/ovo-focused | Ethnicity: Asian | 2.02 | [1.11, 3.71] |
| Employment status: Retired | 0.12 | [0.02, 0.91] | |
| Vegetable-focused | Diet duration: 1 to 5 years | 2.46 | [1.77, 3.41] |
| Ethnicity: European/non-Irish | 2.21 | [1.48, 3.30] | |
| Occupation: education | 2.13 | [1.40, 3.24] | |
| Settlement pattern: urban | 2.03 | [1.39, 2.96] | |
| Gender: female | 1.99 | [1.43, 2.76] | |
| Diet duration: 6 to 10 years | 1.96 | [1.20, 3.22] | |
| Education: postgraduate qualification | 1.56 | [1.15, 2.12] | |
| Household composition: living with adults and no minors | 1.53 | [1.13, 2.08] | |
| Ethnicity: African | 0.77 | [0.75, 0.80] | |
| Education: up to and including secondary school | 0.67 | [0.47, 0.96] | |
| Household composition: living with minors | 0.58 | [0.42, 0.80] | |
| Gender: male | 0.50 | [0.36, 0.70] | |
| Settlement pattern: rural | 0.49 | [0.34, 0.72] | |
| Diet duration: more than 15 years | 0.39 | [0.28, 0.53] | |
| Seafood-focused | Ethnicity: Mix/other | 3.89 | [1.19, 12.65] |
| Diet duration: Less than 1 year | 2.20 | [1.22, 3.96] | |
| Occupation: Engineering, architecture, manufacturing, building, construction | 2.05 | [1.02, 4.12] | |
| Settlement pattern: Rural | 0.56 | [0.33, 0.96] | |
| Diet duration: More than 15 years | 0.47 | [2.99, 0.73] | |
| Potato-focused | Ethnicity: Irish (SR = 1.5) | 3.51 | [1.68, 7.36] |
| Settlement pattern: rural | 2.15 | [1.42, 3.26] | |
| Household composition: living with minors | 1.90 | [1.26, 2.87] | |
| Education: up to and including secondary school | 1.75 | [1.15, 2.67] | |
| Diet duration: more than 15 years | 1.68 | [1.09, 2.58] | |
| Education: postgraduate qualification | 0.54 | [0.34, 0.84] | |
| Employment status: student without parttime job | 0.24 | [0.06, 0.98] | |
| Ethnicity: European/non-Irish | 0.18 | [0.06, 0.57] |
| Self-Reported Dietary Pattern | Omnivorous (n = 606) | Flexitarian (n = 218) | Pescatarian (n = 32) | Vegetarian (n = 76) | Vegan (n = 25) | p-Value |
| n (%) | n (%) | n (%) | n (%) | n (%) | ||
| Calculated BMI in kg/m2 | <0.001 * | |||||
| Mean BMI (SD) | 27.40 (6.8) | 27.32 (6.7) | 24.37 (3.6) | 24.89 (5.0) | 24.17 (3.3) | |
| Median BMI | 26.15 | 26.58 | 23.43 | 24.81 | 24.02 | |
| BMI classes a (%) b | 0.005 * | |||||
| Underweight (BMI < 18.5) | 19 (3.2) | 6 (2.9) | 1 (3.4) | 5 (6.8) | 0 (0) | |
| Healthy (BMI 18.5–24.9) | 224 (38.3) | 75 (35.9) | 17 (58.6) | 36 (48.6) | 14 (60.9) | |
| Overweight (BMI 25.0–29.9) | 181 (30.9) | 80 (38.3) | 8 (27.6) | 25 (33.8) | 8 (34.8) | |
| Obese (BMI > 30.0) | 161 (27.5) | 48 (23.0) | 3 (10.3) | 8 (10.8) | 1 (4.3) | |
| Health conditions (%) b | ||||||
| Hypertension | 68 (11.2) | 23 (10.6) | 2 (6.3) | 6 (7.9) | 0 (0) | 0.347 |
| Diabetes | 28 (4.6) | 13 (6.0) | 2 (6.3) | 3 (3.9) | 1 (4.0) | 0.918 |
| Coronary heart disease | 10 (1.7) | 5 (2.3) | 2 (6.3) | 0 (0) | 0 (0) | 0.208 |
| PCA-derived dietary pattern | “Meat-focused” | “Dairy/ovo-focused” | “Vegetable-focused” | “Seafood-focused” | “Potato-focused” | p-value |
| (n = 296) | (n = 254) | (n = 212) | (n = 92) | (n = 103) | ||
| n (%) | n (%) | n (%) | n (%) | n (%) | ||
| Calculated BMI in kg/m2 | <0.001 * | |||||
| Mean BMI (SD) | 27.70 (6.58) | 27.17 (6.71) | 25.83 (5.95) | 26.45 (7.43) | 27.44 (6.33) | |
| Median BMI | 26.26 | 26.19 | 24.68 | 25.25 | 26.88 | |
| BMI classes a (%) b | <0.001 * | |||||
| Underweight (BMI < 18.5) | 6 (2.0) | 10 (3.9) | 3 (1.4) | 7 (7.6) | 5 (4.9) | |
| Healthy (BMI 18.5–24.9) | 110 (37.2) | 89 (35.0) | 106 (50.0) | 34 (37.0) | 27 (26.2) | |
| Overweight (BMI 25.0–29.9) | 88 (29.7) | 88 (34.6) | 61 (28.8) | 28 (30.4) | 37 (35.9) | |
| Obese (BMI > 30.0) | 83 (28.0) | 61 (24.0) | 34 (16.0) | 16 (17.4) | 27 (26.2) | |
| Health conditions (%) b | ||||||
| Hypertension | 24 (8.1) | 33 (13.0) | 16 (7.5) | 12 (13.0) | 14 (13.6) | 0.126 |
| Diabetes | 10 (3.4) | 13 (5.1) | 13 (6.1) | 5 (5.4) | 6 (5.8) | 0.658 |
| Coronary heart disease | 1 (0.3) | 5 (2.0) | 3 (1.4) | 6 (6.5) | 2 (1.9) | 0.004 * |
| PCA-Derived Diet | Health Variable | aOR | CI |
| Meat-focused | Obese BMI | 1.46 | [1.06, 2.00] |
| Seafood-focused | Coronary heart disease | 5.42 | [1.96, 15.01] |
| Underweight BMI | 3.03 | [1.27, 7.26] | |
| Vegetable-focused | Healthy BMI | 1.90 | [1.39, 2.60] |
| Obese BMI | 0.57 | [0.38, 0.85] | |
| Potato-focused | Healthy BMI | 0.56 | [0.35, 0.89] |
| Self-reported diet | Health variable | aOR | CI |
| Omnivorous | Obese BMI | 1.76 | [1.26, 2.44] |
| Pescatarian | Healthy BMI | 2.20 | [1.04, 4.66] |
| Vegetarian | Obese BMI | 0.36 | [0.17, 0.76] |
| Vegan | Healthy BMI | 2.41 | [1.03, 5.62] |
Disclaimer/Publisher’s Note: The statements, opinions and data contained in all publications are solely those of the individual author(s) and contributor(s) and not of MDPI and/or the editor(s). MDPI and/or the editor(s) disclaim responsibility for any injury to people or property resulting from any ideas, methods, instructions or products referred to in the content. |
© 2023 by the authors. Licensee MDPI, Basel, Switzerland. This article is an open access article distributed under the terms and conditions of the Creative Commons Attribution (CC BY) license (https://creativecommons.org/licenses/by/4.0/).
Share and Cite
Burke, D.T.; Bennett, A.E.; Hynds, P.; Priyadarshini, A. Identifying Novel Data-Driven Dietary Patterns via Dimensionality Reduction and Associations with Socioeconomic Profile and Health Outcomes in Ireland. Nutrients 2023, 15, 3256. https://doi.org/10.3390/nu15143256
Burke DT, Bennett AE, Hynds P, Priyadarshini A. Identifying Novel Data-Driven Dietary Patterns via Dimensionality Reduction and Associations with Socioeconomic Profile and Health Outcomes in Ireland. Nutrients. 2023; 15(14):3256. https://doi.org/10.3390/nu15143256
Chicago/Turabian StyleBurke, Daniel T., Annemarie E. Bennett, Paul Hynds, and Anushree Priyadarshini. 2023. "Identifying Novel Data-Driven Dietary Patterns via Dimensionality Reduction and Associations with Socioeconomic Profile and Health Outcomes in Ireland" Nutrients 15, no. 14: 3256. https://doi.org/10.3390/nu15143256
APA StyleBurke, D. T., Bennett, A. E., Hynds, P., & Priyadarshini, A. (2023). Identifying Novel Data-Driven Dietary Patterns via Dimensionality Reduction and Associations with Socioeconomic Profile and Health Outcomes in Ireland. Nutrients, 15(14), 3256. https://doi.org/10.3390/nu15143256